1:1 Mobile Learning Initiative (MLI): Measurement of Student Outcomes
January 27, 2014
Essential questions: ‣ What research-based tools exist to allow
us to measure student outcomes? ‣ How will data collected be used to inform
the progress of the Mobile Learning Initiative? ‣ How will data from measurements be
used to inform future technology initiatives?

District Technology Committee (DTC)
Vision Statement (9/14):
The Winnetka Public Schools encourages our community of learners to innovate, create and collaborate through the purposeful use of technology in an ever-changing global society.

Belief Statements (9/14):
Background: ❖ Three Outcomes
❖ Two Months of Research ❖ One Recommendation

Three Outcomes ❖ Students have increased opportunities
for self-directed learning experiences. ❖ Students use technology to effectively
initiate and engage in collaborative learning.
❖ Students are savvy, strategic,
responsible and balanced users of technology

Two Months of Research ❖ Vendors
❖ Measures ❖ Evidence ❖ Action

Recommendation: BrightBytes+
Researched-base framework ▪ 4 Domains ▪ 22 Success indicators ▪ 100s data points

Crosswalk: CASE to District 36 Student Outcomes MEASURE STUDENT OUTCOMES
Students have increased
opportunities for self-directed
learning experiences.
Students use technology to
effectively initiate and engage in collaborative
learning.
Students are savvy, strategic,
responsible and balanced users of
technology
CASE - Classroom
4C’s Assistive Tech
Formative Assessment
4C’s Assistive Tech
CASE - Access Access at School Access at home
Access at School Access at home
Access at School Access at home
CASE - Skills
Online Multimedia
Foundational Online
Multimedia
Online Multimedia
CASE Environment
3P’s Beliefs

Other measures of District 36 Student Outcomes
MEASURE STUDENT OUTCOMES
Students have increased opportunities for self-
directed learning experiences.
Students use technology to effectively initiate and engage
in collaborative learning.
Students are savvy, strategic, responsible and balanced users
of technology
Schoology Statistics
Percentage of teachers using Schoology to deliver content.
Google Drive Statistics
Use of Google Docs, Sheets, Slides and Forms, number of
published documents.
App Requests Percentage of teachers
requesting apps for further exploration
Percentage of teachers requesting apps for further
exploration
Student Behavior Data
Evaluate Instances of student behavior related to the use of
technology.
Internet Content Filter
Review internet searches for content that has been blocked or
marked as suspicious.
Paper Consumption
Follow paper consumption based on paper re-orders from year to
year.
Teacher and student Interviews
To provide context for action plans and staff development.
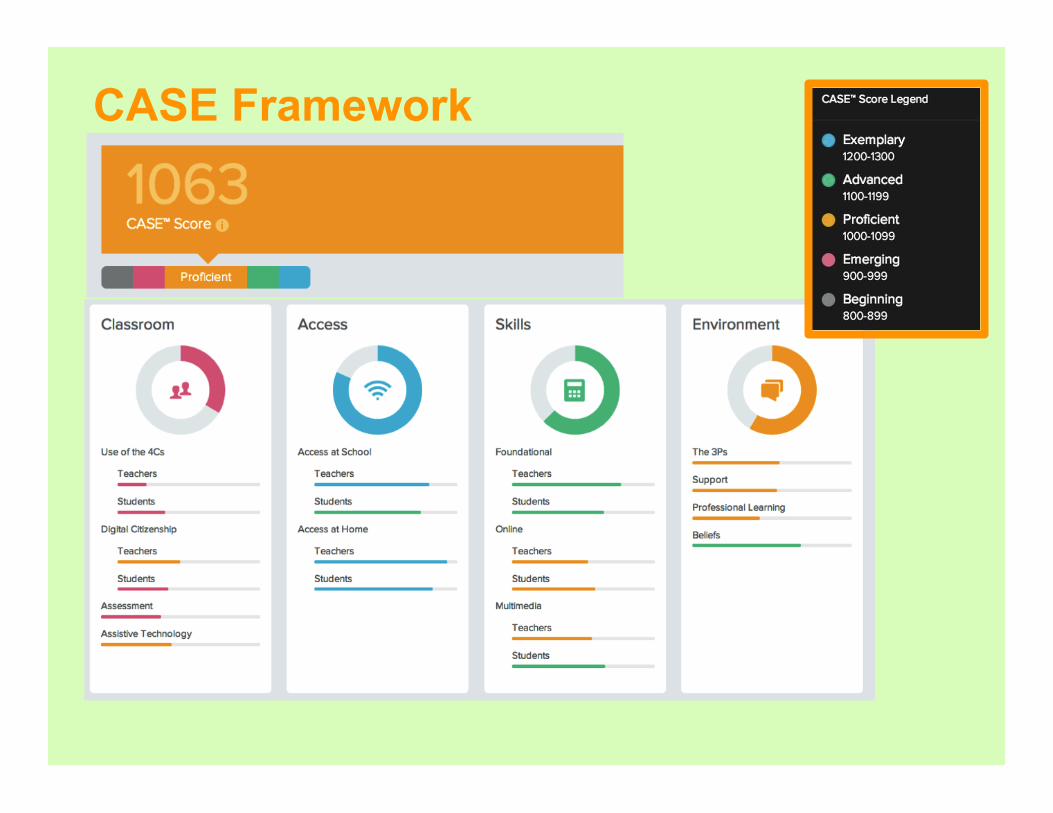
CASE Framework
High Level Overview Data Reports

Students use technology to effectively initiate and engage in collaborative learning.

Students are savvy, strategic, responsible and balanced users of technology.

Predictions, Goals and Measurements
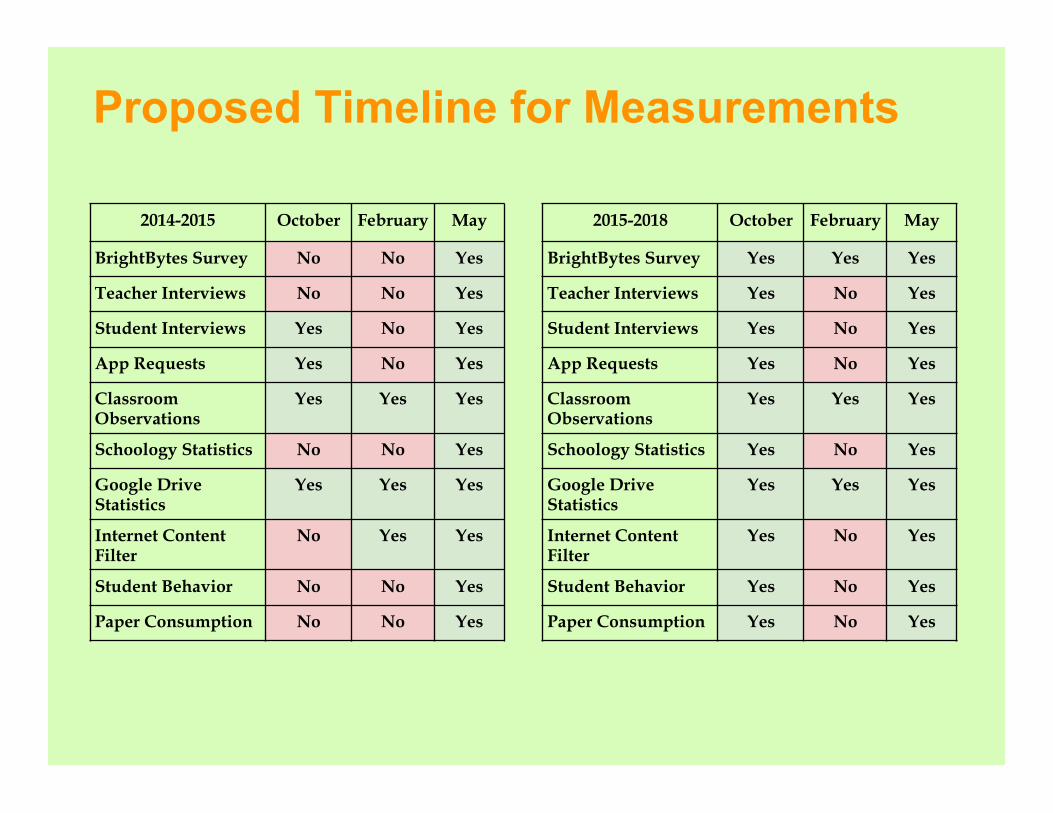
Proposed Timeline for Measurements
2015-2018 October February May
BrightBytes Survey Yes Yes Yes
Teacher Interviews Yes No Yes
Student Interviews Yes No Yes
App Requests Yes No Yes
Classroom Observations
Yes Yes Yes
Schoology Statistics Yes No Yes
Google Drive Statistics
Yes Yes Yes
Internet Content Filter
Yes No Yes
Student Behavior Yes No Yes
Paper Consumption Yes No Yes
2014-2015 October February May
BrightBytes Survey No No Yes
Teacher Interviews No No Yes
Student Interviews Yes No Yes
App Requests Yes No Yes
Classroom Observations
Yes Yes Yes
Schoology Statistics No No Yes
Google Drive Statistics
Yes Yes Yes
Internet Content Filter
No Yes Yes
Student Behavior No No Yes
Paper Consumption No No Yes

Next Steps:
❖ Enter into contract with BrightBytes o 1 Year $5,706.00 o 3 Year $14,000
❖ Follow proposed timelines ❖ Based on actual benchmark data, review and
modify goals (spring 2015) ❖ Report to the School Board in June to share
progress for the year and next steps for 2015-2016

Q&A
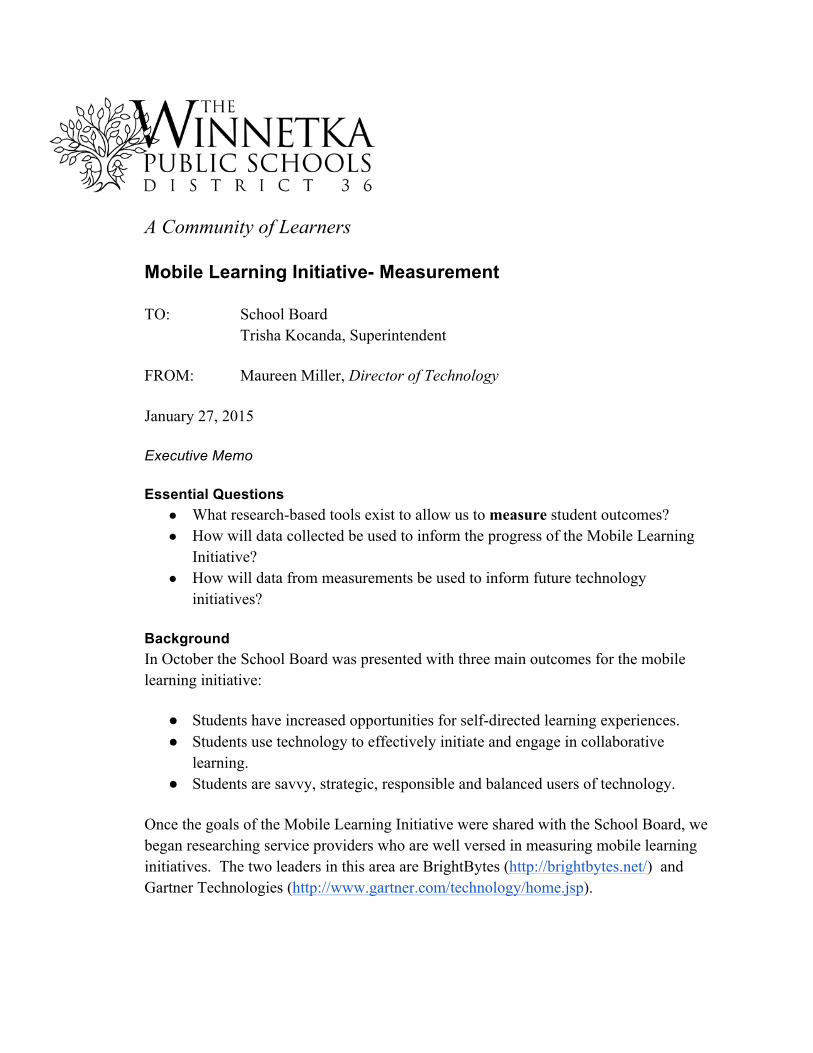
A Community of Learners Mobile Learning Initiative- Measurement TO: School Board Trisha Kocanda, Superintendent FROM: Maureen Miller, Director of Technology January 27, 2015 Executive Memo Essential Questions
● What research-based tools exist to allow us to measure student outcomes? ● How will data collected be used to inform the progress of the Mobile Learning
Initiative? ● How will data from measurements be used to inform future technology
initiatives? Background In October the School Board was presented with three main outcomes for the mobile learning initiative: ● Students have increased opportunities for self-directed learning experiences. ● Students use technology to effectively initiate and engage in collaborative
learning. ● Students are savvy, strategic, responsible and balanced users of technology.
Once the goals of the Mobile Learning Initiative were shared with the School Board, we began researching service providers who are well versed in measuring mobile learning initiatives. The two leaders in this area are BrightBytes (http://brightbytes.net/) and Gartner Technologies (http://www.gartner.com/technology/home.jsp).
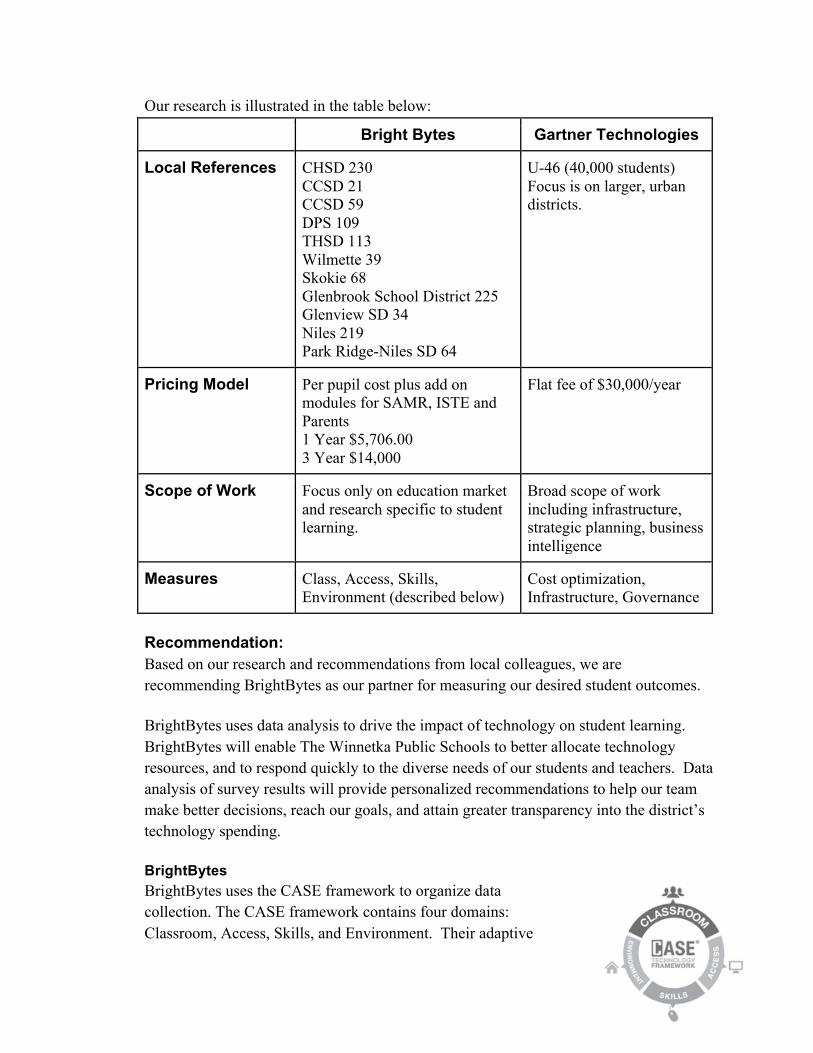
Our research is illustrated in the table below:
Bright Bytes Gartner Technologies
Local References CHSD 230 CCSD 21 CCSD 59 DPS 109 THSD 113 Wilmette 39 Skokie 68 Glenbrook School District 225 Glenview SD 34 Niles 219 Park Ridge-Niles SD 64
U-46 (40,000 students) Focus is on larger, urban districts.
Pricing Model Per pupil cost plus add on modules for SAMR, ISTE and Parents 1 Year $5,706.00 3 Year $14,000
Flat fee of $30,000/year
Scope of Work Focus only on education market and research specific to student learning.
Broad scope of work including infrastructure, strategic planning, business intelligence
Measures Class, Access, Skills, Environment (described below)
Cost optimization, Infrastructure, Governance
Recommendation: Based on our research and recommendations from local colleagues, we are recommending BrightBytes as our partner for measuring our desired student outcomes. BrightBytes uses data analysis to drive the impact of technology on student learning. BrightBytes will enable The Winnetka Public Schools to better allocate technology resources, and to respond quickly to the diverse needs of our students and teachers. Data analysis of survey results will provide personalized recommendations to help our team make better decisions, reach our goals, and attain greater transparency into the district’s technology spending. BrightBytes BrightBytes uses the CASE framework to organize data collection. The CASE framework contains four domains: Classroom, Access, Skills, and Environment. Their adaptive

survey draws from a bank of over 300 questions to create short, individualized questionnaires for each respondent. CASE outlines the essential factors schools need to improve teaching and learning through the use of technology. Measures Provided by CASE Framework in 4 Domains Classroom
Indicators Evidence
The 4 C’s: communication, collaboration, creativity, & critical thinking.
● creating new ideas ● refining and evaluating ● communicating with experts ● being open to diverse perspectives ● demonstrating originality ● viewing failure as part of the process ● online collaboration ● solving authentic problems ● collecting and analyzing data
Digital Citizenship ● legal use of online content ● online safety ● cyberbullying prevention ● using social networks for learning ● evaluating the credibility of online content
Assistive Technology ● Text-to-Speech ● Concept/Mind-mapping ● Speech-to-Text
● Digital Textbooks ● Classroom Displays
Formative Assessment ● digital exit slips ● online polling tools ● digital bulletin boards ● backchannels ● audio feedback
Access
Indicators Evidence
Student and teacher access at home
● computing devices ○ shared or unshared
● internet access

○ wireless or wired
Student and teacher access at school
● student to device ratio ● access to computer labs and carts ● types of devices available ● quality of connections
Skills
Indicators Evidence
Student and Teacher Foundational Skills
● sending emails ● word processing ● learning new technologies ● connecting to printers ● connecting to projectors ● basic troubleshooting and problem-solving
Student and Teacher Online Skills
● collaborate using online documents ● videoconference ● social media for teaching and learning ● consuming online content ● creating online content
Student and Teacher Multimedia Skills
● record and edit and/or publish audio ● record and edit and/or publish video ● download or stream content
Environment
Indicators Evidence
Policy, Procedures, and Practices (3P’s)
● technology use at department/grade-level meetings
● recognition for integrating technology ● internet filter traffic and requests
Technology Support ● speed of support ● quality of support ● answers to routine questions ● instructional technology planning ● hardware repair and replacement ● technology refresh cycles
Professional Learning ● school sponsored ● formal opportunities (degrees,

conferences, workshops) ● informal opportunities (blogs, videos,
social networks, webinars)
Student and Teacher Beliefs
● technology enhances student learning ● school encourages technology use ● technology enhances daily life
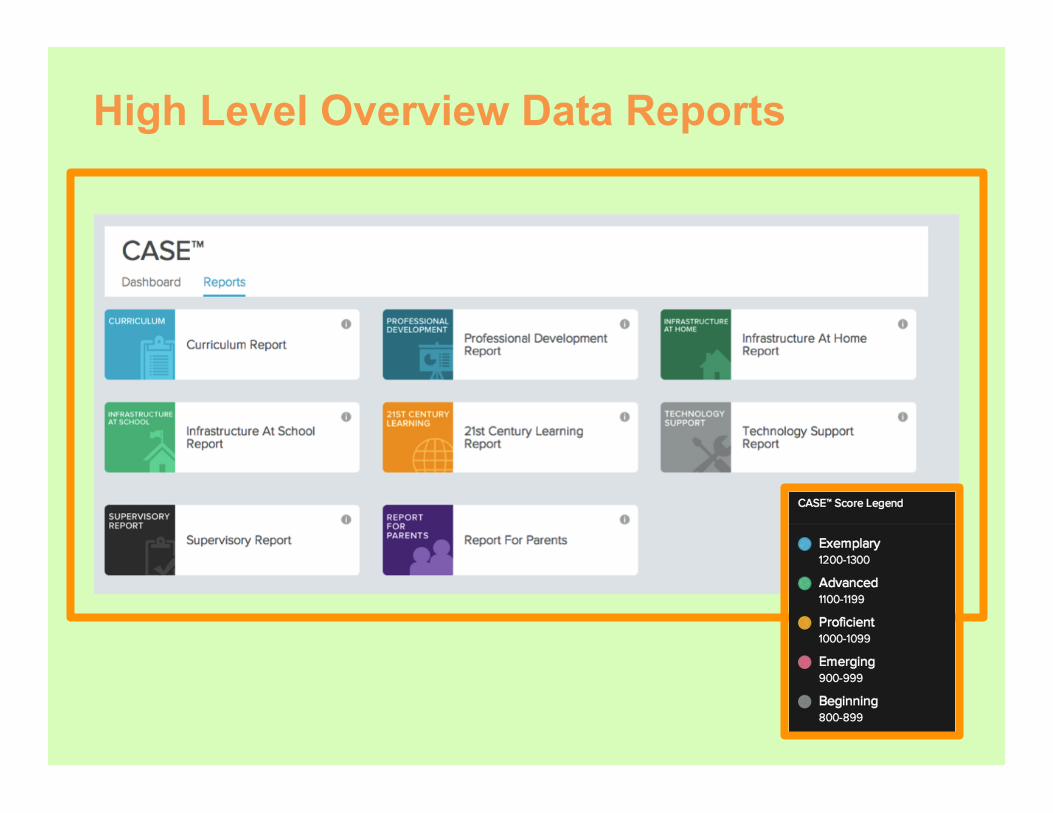
Initial results will be gathered during a two week window when surveys will be shared with students, staff and parents. Once the survey window closes, several reports will be generated for analysis. The reports types include the following: ● Curriculum ● Professional Development ● 21st Century Learning ● Infrastructure ● Technology
Reports will be reviewed with the assistance of BrightBytes analysts and education experts. Results of the survey are presented with an overall CASE score (legend to the right) along with a score for each domain and data point. Recommendations will be reviewed and implemented as necessary. Along with the reports come suggested actions in the form of “Quick Wins” and “Game Changers.” Once we have collected and analyzed the data, we will return in June to share the measures with the School Board. Crosswalk: CASE to District 36 Student Outcomes BrightBytes measures over 100 data points and 22 indicators. Therefore, we have aligned the most pertinent indicators with our outcomes and set growth targets for the next 4 years. In addition to the BrightBytes quantitative data, we will use student and teacher interviews, statistics from Schoology and Google Apps for Education (GAFE), internet content filter data (Lightspeed), Student behavior data, app request information and paper consumption data.
MEASURE STUDENT OUTCOMES
Students have increased opportunities for self-directed learning experiences.
Students use technology to effectively initiate and engage in collaborative learning.
Students are savvy, strategic, responsible and balanced users of technology

CASE - Classroom
4C’s Assistive Tech Formative Assessment
4C’s Assistive Tech
CASE - Access
Access at School Access at home
Access at School Access at home
Access at School Access at home
CASE - Skills
Online Multimedia
Foundational Online Multimedia
Online Multimedia
CASE Environment
3P’s Beliefs
Schoology Statistics
Percentage of teachers using Schoology to deliver content.
Google Drive Statistics
Use of Google Docs, Sheets, Slides and Forms, number of
published documents.
App Requests Percentage of teachers requesting apps for further exploration
Percentage of teachers requesting apps for further exploration
Student Behavior Data
Evaluate Instances of student behavior related to the use of technology.
Internet Content Filter
Review internet searches for content that has been blocked or marked as suspicious.
Paper Consumption
Follow paper consumption based on paper re-orders from year to year.
Teacher Interviews To provide context for action plans and staff development.
Student Interviews

Predictions, Goals and Measurement A report to the Board will be shared after every measurement cycle using this reporting template (Link to live template) :
Proposed Timeline for Measures
2014-2015 October February June
BrightBytes Survey No No Yes
Teacher Interviews No No Yes
Student Interviews Yes No Yes
App Requests Yes No Yes
Classroom Observations Yes Yes Yes
Schoology Statistics No No Yes
Google Drive Statistics Yes Yes Yes
Internet Content Filter No Yes Yes
Student Behavior No No Yes
Paper Consumption No No Yes

2015-2018 October February June
BrightBytes Survey Yes Yes Yes
Teacher Interviews Yes No Yes
Student Interviews Yes No Yes
App Requests Yes No Yes
Classroom Observations Yes Yes Yes
Schoology Statistics Yes No Yes
Google Drive Statistics Yes Yes Yes
Internet Content Filter Yes No Yes
Student Behavior Yes No Yes
Paper Consumption Yes No Yes
Next Steps ● Enter into contract with BrightBytes
○ 1 Year $5,706.00 ○ 3 Year $14,000
● Follow proposed timelines outlined above ● Based on actual benchmark data, review and modify goals (spring 2015) ● Report to the School Board in June to share progress for the year and next steps
for 2015-2016 Click here to view the presentation that will be provided at the January 27, 2015, School Board meeting.
Recommended