10 Nondestructive Evaluation
A Nondestructive Inspection of Adhesive MetalMetal Bonds
Principal InvestigatorsDennis Roach Kirk Rackow Ciji L Nelson Randy Duvall David MooreSandia National Laboratories PO Box 5800 MS 08635 Albuquerque NM 87185(505) 844-6078 e-mail dproachsandiagov
Technology Area Development Manager William Joost(202) 287-6020 e-mail williamjoosteedoegov
Contractor US Automotive Materials PartnershipContract No DE-AC04-94AL8500
Objective bull The goal of this project is to identify and develop one or more nondestructive inspection (NDI) methods for adhesive bond evaluation to be used in an automotive manufacturing environment that would foster increased confidence and use in adhesive joining Wider use of adhesive joining could result in reduced vehicle weight increased body stiffness and improved crashworthiness
bull The primary objective is to identify and validate an NDI method(s) which can 1) measure the adhesive area and thickness and 2) detect weak bonds having intimate contact but which have reduced strength Adhesives are also seen as a critical enabler for the joiningof dissimilar materials in order to avoid corrosion To accomplish this goal the attributes that determine bond strength were identified along with an NDI method to measure that property
Approach bull There are five major attributes which contribute to the strength of an adhesive bond on a metal flange the width of the adhesive area the thickness the location of the bead relative to the edges of the flange the state of cure and the quality of the adhesion The general approach is to develop a portfolio of methods that can be used on the plant floor which allow all these attributes to be measured nondestructively
bull These methods need to be single-side inspections that can follow a flange deal with large changes in geometry and have resolution approaching 1 mm To accomplish this several setsof flat adhesively bonded specimens representative of automobile flanges were generated by the original equipment manufacturers (OEM) and adhesive suppliers to test the feasibility of NDI techniques to assess bond area and bond-line thickness
bull The specimens vary in adhesive and adherent type and thickness stack-up (2-3 layers) andcure state These conditions bound the processing parameters for the adhesive assembly
10-1
process A through-transmission ultrasound (TTU) inspection was performed to characterize the specimens The inspection images were used as a gold standard to compare results from candidate inspection technologies such as pulse-echo ultrasound and pulsed thermography which can be deployed from one side of the flange
bull The specimens were peeled destructively and photographs of the samples were also compared with the inspection images In addition multiple automobile bodies-in-white (BIW) containing a number of adhesive joints were produced by the OEMs to determine whether complex geometry produces any inspection impediments and to provide a test-bed for the validation of promising inspection techniques
bull Methods for producing weak bonds were developed and deployed to generate specimen setsfor evaluating NDI ability to quantify bond strength
FY 2009 Accomplishments bull The team completed the evaluation of the final second generation array and probe holder (production prototype) on the BIW structures This device is simpler and smaller than the first generation and should be able to inspect 95 of the BIW while imaging 85 of the area under the probe The system works with a commercially-available closed-loop water circulation system and should have a significantly reduced system cost The system is now at a production ready status
bull The BIW evaluations involved constructing inspection plans inspecting over 100 beads with a wide variety of geometries and probe orientations and generating evaluation reports Over 80 of the adhesive structure could be imaged at a speed of over 1 mmin with this feasibility system These images elucidate large-scale features such as adhesive spread and the fill-factor of the flange The 1 mm resolution also allows small features such as surface springback air entrainment bead dribbles and weld expulsion damage to be imaged
bull An NDI method was developed for determining bond line thickness an important quality assurance consideration for production High fidelity pulse-echo ultrasonics in conjunction with software to overlay signals from calibrated thicknesses was used to measure and compare specific reflection peaks from within the adhesive joint Validation on standard (04 mm) thick (06 mm) and thin (02 mm) bond lines established the ability of this method to accurately measure these thin adhesive layers to within 5 Formal NDI procedures were produced
bull Reproducible procedures were established for constructing weak (kissing) bond samples using a wide variety of contaminates and controlled cures Ten different methods were selected based on repeatability of results to produce specimen sets with 10 3050 70 90 and 100 bond strength Over 300 strengths tests were completed to characterize the weak bonds
bull NDI evaluations involving a suite of 9 inspection methods were completed on the weak bondspecimens Several methods clearly showed capabilities to delineate bond strength NDI images could be correlated to the subsequent strength measurements While the most sensitive NDI methods were not able to completely quantifying bond strength they were able to accurately establish a strength threshold to indicate when the strength of the bondline falls below the 60-70 strength value
bull Tests were completed to quantify the effects of various bond line thicknesses and environmental exposure levels on the strength of the bonded joint Both shear strength andfatigue (durability) tests established performance levels for standard thick and thin bondlines with and without extended exposure to hot-wet conditions
10-2
Future Direction
bull Fiscal Year (FY) 09 is the final year of this project All deliverables and milestones have been met Discussions with United States Council for Automotive Research (USCAR) participants indicates a desire to continue this work in a follow-on effort in order to complete the transfer of this inspection system to the automobile production line and to further the maturity of the weak bond quantification work
Introduction Adhesive bonding is an important joining tool for modern automotive structures Structural adhesives can greatly increase the strength as well as stiffness of joints and can significantly improve the crash performance of vehicles Structural adhesives also allow more efficient structures to be designed that may be difficult to weld Structural adhesives will play an increasingly important role in the joining of dissimilar materials such as aluminum (Al) to steel or magnesium (Mg) to other metals The adhesive acts both as a galvanic barrier and as a stress spreader on materials that are more brittle The NDE 601 project was directed at filling a major technical gap for adhesives how to determine whether an adhesive bond on a vehicle will perform as designed without actually destroying the bond The major goal of this project was to develop an NDI method and associated system to inspect automotive flange joints an ultrasonic pulseecho inspection with a manually scanned phased array A unique phased array probe system with a closed-loop circulation system was built by the team and successfully validated on numerous test coupons and production automobile bodies Issues of inspection plan organization report generation accessibility ultrasonic coupling operator skill and operator ergonomics were also evaluated The system performed quite well delivering high resolution images of the adhesive area Another issue critical to fabrication quality assurance is the ability to quantify the strength of the bonded joint Once the team discovered methods to generate weak bonds in a controlled fashion it was possible to study the ability of various NDI methods to characterize these weak bonds It was shown that grease reduces both shear and tensile strength with the same sensitivity dependence and that grease contamination can be detected with ultrasonic pulse-echo inspections Several NDI methods were developed with sufficient sensitivity to ascertain when bond strengths fall below 60 of full strength Finally it is important to be able to measure bond line thickness as variations from optimum designs can degrade strength and durability of the joint This study proved the ability of an ultrasonic inspection method and associated signal analysis to accurately measure the thickness of a hidden bond line
Nondestructive Inspection of Bond Lines and Bond Thickness Measurements Phased Array Ultrasonic Inspections and Incorporation of Gen2 Scanning
The team completed the evaluation of the second generation ultrasonic array and probe holder that is intended as a production prototype (Figure 1) This device is simpler and smaller than the first generation and should be able to inspect 95 of the BIW while imaging 85 of the area under the probe The system works with a commercially-available closed-loop water circulation system and should have a significantly reduced system cost This inspection system was evaluated on three BIW structures The BIW evaluations involved constructing inspection plans inspecting over 100 beads with a wide variety of geometries and probe orientations and generating evaluation reports Images of the adhesive structure elucidate large-scale features such as adhesive spread and the fill-factor of the flange The 1-mm resolution also allows small features such as surface springback air entrainment beads dribbles and weld expulsion
10-3
damage to be imaged A formal inspection procedure was written and optimized during the trial inspections Figure 2 shows a sample C-scan result with disbond flaws detected by the UT Array inspection system
Figure 1 First generation (left) and second production-prototype generation (right) of the ultrasonic array andprobe holder
Figure 2 Phased array inspection of bonded joints in the BIW test articles and the resulting scans
Ultrasonic Signal Analysis to Determine Adhesive Thickness
The signal-processing effort was completed to extract the adhesive thickness from the ultrasonic array echo data This analysis can rapidly compensate for probe to surface distance variations The short burst of high-frequency sound waves travel through the material with some loss of energy and is reflected at any interface The reflected echo signal is captured and analyzed to determine the presence and location of reflected interfaces (Figure 3) Variations in reflectivity or scattering can be used as the basis of flaw detection Transit times of the echoes can also be used to assess bond-line adhesive thickness Two different adhesive thickness measurement methods were pursued One NDI method produced spot measurements of adhesive layer thickness while the second method used the set of phased array A-scanC-scan data to produce a thickness mapping of the entire bond line
Figure 3 Ultrasonic set-up of the USCAR flange inspection
Discrete adhesive thickness measurements were successfully produced using a Sonoscan C-SAM D9000 device shown in Figure 4 First the acoustic velocity of epoxy adhesive was measured
10-4
and determined to be 2345 mmmicrosec Then the time lines for the critical echoes within the bonded joint as depicted in Figure 3 were measured These UT signals were overlayed with baseline signals from adhesive bond lines of known thickness Using signal subtraction algorithms the bond line thickness for all variations within the specimen set were determined As it propagates through the layer to be measured the ultrasonic energy is reflected at the front and back interfaces of the material By measuring the time difference between the reflections and factoring in the velocity of the ultrasound of the material Sonoscanrsquos software is used to intercompare signals and calculates the thickness of layers Figure 4 shows the bond line thickness predictions produced by this UT peak signal inspection method and compares these results to those obtained from mechanical measurements For bond lines that were intentionally varied +- 50 from a desired thickness (02 mm to 06 mm) this method was able to accurately determine the bond thickness using pulse echo ultrasonic measurements to within 5 of actual thickness
Figure 4 Sonoscan C-SAM D9000 pulse-echo ultrasonic inspection device and bond line thickness measurementsproduced using analysis of UT peak signals
Nondestructive Characterization of Weak Bonds A suite of customized applications of advanced NDI techniques coupled with signal analysis were applied to characterize bonds that are non-ideal and thus possess strengths that are less than optimum The ideal result is data that can be calibrated to quantify the strength of a bond Data analysis was used to highlight subtle changes in the structurersquos response and signal trends in order to link such differences to bond quality parameters In order to obtain data that contains the small variation in bond line response it was necessary to optimize the excitation used for the inspection This includes both the frequency content and the magnitude of the excitation Such optimization schemes considered the goal of keeping the inspections truly nondestructive excessive excitation may damage the bond line The source of the weak bond can stem from changes in the adhesive or a non-optimum interface between the adhesive and the adherend This study focused on the expected sources of poor bonding at the adhesive-to-adherend interface When assessing weak bonds the source of the weak bond can stem from changes in the adhesive or a non-optimum interface between the adhesive and the adherend One side aspect of this work determined if off-design cures produce changes in the material properties of the adhesives used in car production and to use NDI methods to monitor such
10-5
changes By considering changes in the adhesive these effects can be uncoupled in subsequent tests on bonded structures Similarly the effects of contaminants and other sources of weak bonds at the adhesive-to-surface interface will be studied Results from mechanical property tests were intercompared and also compared with USCAR coupons of a different design In this manner NDI testing on the complete structure focused on the interface region to better identifyquantify a weak bond The data analysis looked at subtle changes in the response and signal trends in order to link such differences to bond quality parameters
Generating Reliable Weak Bonds
The first challenge in this effort was to be able to create weak bonds with the adhesives used in the automotive industry in such a way that the strength results would be repeatable with some small level of variation This was done by fabricating a series of lap joint coupons that are made of two galvanized steel adherends with a 1 inch overlap and a 1rdquo x 1rdquo bond area as shown in Figure 5 The thickness of the steel plate is 15 mm (0060rdquo) and the thickness of the bond line is 040 mm (0016rdquo) The coupons were prepared using specific methods designed to produce various levels of weak bonds The methods that were evaluated in this study included 30 different configurations and included 1) various levels of grease thicknesses 2) grease with thinner layers of adhesive 3) different mold releases with various levels of coverage 4) diluted mold release 5) non-optimum cure profiles (varying in temperature and time) 6) hot-wet conditioning 7) application of different contaminants (water wax sand Vaseline) 8) oil application with various levels of coverage 9) less than 100 adhesive coverage and 10) baking powder with various levels of coverage These specimens were then tested for strength by completing a failure test (tensile) in a uniaxial mechanical test machine All the test results were collected and analyzed to determine the consistency (variance of strength) and the percentage of the full bond strength for each of the specific weak bond methods It should be noted that a series of pristine coupons were fabricated in the same manner as the weak bond methods in order to provide strength and variance results for comparison purposes The weak bond methods that showed the least amount of variance in strength results were then put into percentage of full strength bins (eg 10 30 50) The final percentage of full strength bins used were 10 30 50 70 and 90 More coupons were fabricated and tested (strength tests) on the ten selected weak bond methods to insure repeatability (ie small deviation in strength) Table 1 shows the final selection of weak bond methods that were used for inspection purposes Over 300 coupons were fabricated and tested to arrive at the final weak bond test set Thus there are 10 specimens in each NDI set with bond strengths in each of the following categories 10 bond strength (2 types) 30 bond strength (2 types) 50 bond strength (2 types) 70 bond strength (2 types) 90 bond strength (1 type) 100 bond strength (1 type)
Figure 5 Weak bond lap splice test specimen
10-6
Table 1 Summary of ten-specimen weak bond set
Nondestructive Inspection of Weak Bonds Based on previous experience in related weak bond studies along with research into promising inspection methods a suite of NDI methods was selected to study the weak bond specimens The suite of NDI techniques evaluated were 1) pulse-echo ultrasonics (UT) 2) phased array UT 3) nonlinear UT 4) UT spectroscopy 5) resonance 6) laser shot peening 7) through transmission UT (immersion and air-coupled) 8) flash thermography and 9) laser UT Some techniques did not show any promise for assessing weak bonds some techniques were able to identify the severely weak bonds (less than 20) some techniques showed some trends but did not provide the resolution to make any clear indications of weak bonds and some methods clearly showed delineation in bond strength The most promising and sensitive methods are described here
While the most sensitive NDI methods were not able to completely quantifying bond strength they were able to accurately establish a strength threshold Inspection data often is presented in the form of C-scans which are two-dimensional color or gray-scale coded plots where the colors correspond to assigned magnitudes in the NDI signals Features revealed in the C-scans are able to indicate when the strength of the bond line falls below the 60-70 strength valueThis is an important finding that provides the ability to more accurately and reliably establish accept-reject levels Through-transmission ultrasonics was able to identify weak bonds Figure6 shows a series of amplitude plots along with the bond strength for each of the ten specimens in the weak bond set These results show that the signal amplitude is affected by the physics of the changing bond and the general brightness of the C-scan darkens as the bond becomes weaker The more field-deployable pulse-echo UT can also provide bond strength information using C-scan images produced after some custom signal analysis Detailed analyses on pulse-echo ultrasonic signals was able to determine the portions of the signal that contained the primary bond strength information These are highlighted as peaks 2 3 and 5 in Figure 7 Focused analyses on these A-scan peaks produced some success in identifying weak bonds The C-scans in Figure 7 show the results from using the change in the ratio of peak 3 to peak 2 and clearly demonstrates the promise for use of pulse-echo UT to quantify bond strength In both cases the C-scan colors change from warm bright colors to darker cool colors as the bond strength degrades
10-7
Figure 6 Tracing bond strength using through transmission ultrasonic images
Figure 7 Pulse-echo UT inspections show promise for assessing bond strength using ratio of peak amplitudes
The degree of variation in the C-scan images does not quite allow for exact bond strength values to be assigned based on the color codes However the images do significantly change when the bond strength drops to approximately the 60 (+-) level A-scan results from the weak bond specimen such as the one depicted in Figure 7 show that the bond-related echoes 3 5 and 6 are missing or reduced as the bond strength decreases Thus a measure of bond strength can be determined by calculating the ratios between the amplitudes of echo 2 in (steel travel only) and echo 3 in (bond line travel) for the array of specimens Table 2 summarizes the results from this calculation and reveals that the UT peak signal measurements are close for 60-90 bond strength but can distinguish the bonds that are less than 50 (signal-to-noise levels are high enough to produce consistent results)
Other NDI methods were applied to fully exploit all characteristic features in bond strength inspections Swept-frequency narrow-band spectroscopy has shown promise for improving the UT signal and an ability to differentiate low from high bond strengths A dynamic modal testing method worked well when masses were added to the joints in order to uncouple the dynamic response of the ldquoplate slapping moderdquo from the other specimen resonances The natural frequencies decrease and the damping increases as the bond gets weaker Laser peening methods were able to properly characterize the bonds in order of strength but the high energy levels required for inspection may deteriorate the bond Shear wave resonance testing and thermography were able to differentiate high strength from low strength bonds when noise reduction schemes were deployed
Figure 8 shows a series of thermographic images of weak bond specimens Data acquisition software enhancements were used to filter the data and remove noise In addition flash quenching hardware was deployed to optimize the heat pulse excitation The result is a much higher signal-to-noise ratio in the thermographic images and a greater sensitivity This allows the bonds to be imaged differently based on strength and produces the set of images shown in Figure 8 Finally resonance-based inspections monitored changes in acoustic impedance and were able
10-8
to image variations in the bond lines Figure 9 shows the C-scan images from resonance testing which essentially uses an acoustic wave to interrogate the structure for stiffness variations If the steel adherend is thin enough resonance testing can detect changes in the strength of the bonded joint because the bond line plays a bigger role in the overall stiffness of the assembly
Table 2 Identification of weak bonds using ratio of UT peak 2 and peak 3 amplitudes
Figure 8 Thermography coupled with signal optimization schemes can differentiate bond strengths
Figure 9 Resonance NDI method clearly shows when bond strength drops below 70 level
Bond Strength and Durability Assessment
As an artifact of the weak bond study it was also possible to evaluate the effects of various bond line thicknesses and environmental exposure levels on the strength of the bonded joint A series of shear test specimens (see Figure 5) was produced to complete such a parametric study In addition to the intentional weak bonds described above the bond line thickness was studied in concert with the degrading exposure to hot-wet conditions (95 humidity at 140degF for 30 days) Both shear strength and fatigue (durability) tests were completed on approximately 10 coupons of each type Figure 10 shows that the thin and thick bond lines possessed approximately the same shear strength as the standard 04 mm bond line Hot-wet exposure reduced the bond strength and the thin bond line was least affected by environmental
10-9
exposure Fatigue test results showed that the thin bond (02 mm) exhibited the best durability results requiring almost six times as many fatigue cycles to produce failure as the standard bond line
Figure 10 Strength and durability results for varying bond line thicknesses and effect of sustained hot-wet exposure
Conclusions FY2009 is the final year of this project All deliverables and milestones have been met The prototype production ultrasonic array tool for off-line inspections was successfully tested on production vehicles The performance of this ultrasonic array system is adequate to allow the
10-10
adhesive mapping even on narrow flanges and on curved surfaces This device is simpler and smaller than the first generation and should be able to inspect 95 of the BIW while imaging85 of the area under the probe The system works with a commercially-available closed-loop water circulation system and should have a significantly reduced system cost The system is now at a production ready status An NDI method was developed for determining bond line thickness Validation on various bond lines established the ability of this method to accurately measure these thin adhesive layers to within 5 The high-resolution wedge-peel test has been established as a bond strength standard Simple scaling laws allow NDI measurements of bond width and thickness to predict the bond strength over a wide range of conditions Ultrasonic NDI methods were developed to delineate bond strength NDI images could be correlated to the subsequent strength measurements While the ultrasonic-based NDI methods were not able to completely quantify bond strength they were able to accurately establish a strength threshold to indicate when the strength of the bond line falls below the 60-70 strength value
PresentationPublicationsPatents bull ldquoQuantification of Weak Adhesion Using Nonlinear Ultrasonic Response Signals and Frequency Spectrardquo Drewry M Roach D Journal of Materials Evaluation Vol 67 No 9 September 2009
bull ldquoNondestructive Inspection of Adhesive Bonds in Automotive MetalMetal Joints (NDE 601)rdquo C J Dasch USAMP Off-site Review Oct 29 2008
bull ldquoUltrasonic Phased Array Tools for Large Area Composite Inspection During Maintenance and Manufacturingrdquo Habermehl J Roach D Lamarre A Review of Progress in Quantitative Nondestructive Evaluation Vol 14 Plenum Press New York July 2008
bull ldquoUsing Quantitative Ultrasonic NDE to Accurately Predict Adhesive Bond Strengthsrdquo Cameron Dasch Kim Lazarz and Rajat Agarwal Quantitative Nondestructive Evaluation Conference Chicago IL July 2008
bull ldquoCorrelating Adhesive Bond Strength with Non-Destructive Test Methodsrdquo K Lazarz C Dasch R Agarwal presented at the Annual Meeting of the Adhesion Society Austin TX Feb 2008
bull Disclosure of Technical Advance Dated February 20 2007 ldquoProbe Deployment Device for Optimal Ultrasonic Wave Transmission and Area Scan Inspectionsrdquo Joseph DiMambro Dennis Roach Kirk Rackow Ciji Nelson Sandia National Laboratories and Cameron Dasch General Motor Corporation
bull Roach D and DiMambro J ldquoEnhanced Inspection Methods to Characterize Bonded Joints Moving Beyond Flaw Detection to Quantify Adhesive Strengthrdquo Air Transport Assoc Nondestructive Testing Forum October 2006
10-11
B Laser Ultrasonic Inspection of Adhesive Bonds Used in Automotive Body Assembly
Principal Investigator Marvin KleinIntelligent Optical Systems2520 West 237th Street Torrance CA 90505 Phone (424) 263-6361 e-Mail mkleinintopsyscom
Technology Area Development Manager Carol Schutte(202) 287-5371 e-mail carolschutteeedoegov
Contractor Intelligent Optical SystemsContract No DE-FG02-06ER84545
Objective bull Adhesive bonding is widely used in automotive production especially for body assembly It is critical to be able to measure the strength of adhesive bonds during manufacture in a nondestructive effective and rapid manner There are no current means for inspecting these bonds in real time The specific inspection requirement is to (1) map the adhesive spread (2) measure the thickness over the full area and (3) measure the bond strength All inspections must be performed from one side and must be able to function on contoured surfaces with ~1 mm resolution The ideal tool must be able to perform the above measurements simultaneously (ie in one pass across the bond) In this project we have applied the technique of laser ultrasonics to the adhesive- inspection requirements described above The specific goals of this project are to determine the best inspection configuration andsignal-processing approach followed by the development and demonstration of a prototype inspection system
Approach bull The technology which we have applied to this inspection requirement is laser ultrasonics in which a pulsed laser beam is directed to the surface to generate ultrasonic waves in the sample and a continuous-wave laser receiver is used to detect the waves after they interrogate the required sub-surface feature and return to the surface Laser-based ultrasonic inspection has a number of benefits over transducer-based ultrasonic inspection including (1) lack of physical contact with the workpiece (2) high spatial resolution obtained usingfocused laser beams (3) high scan rate associated with rapid beam scanning and (4) high bandwidth thereby improving the measurement accuracy
bull This project has been closely coordinated with Sandia National Laboratoriesrsquo phased-array project ldquoNondestructive Inspection of Adhesive MetalMetal Bondsrdquo funded by the Department of Energy (DOE) and managed by the United States Council for Automotive Research (USCAR) Nondestructive Evaluation (NDE) Working Group (see 10B) That USCAR-managed project has produced a large number of adhesive-bonded specimens The flat specimens vary in adhesive adherent type and thickness stackup (2-3 layers) cure state and surface contaminants These conditions bound the processing parameters for the adhesive assembly process These specimens have been used to optimize the beam configuration
10-12
and signal-processing techniques The remaining portion of our project is devoted to the development and demonstration of a prototype scanning inspection system that can be scaled to a measurement speed of 1 meterminute
Accomplishments bull In 2009 we completed the remaining months of a 24-month Small Business Innovation Research (SBIR) Phase II project that started in 2007 During the course of this effort we tested a number of steel and aluminum specimens prepared for the USCAR project thus improving our ability to determine the configuration of both laser beams (separation size shape energy) that provides the best signal-to-noise We have identified techniques for processing the raw signals to provide accurate mapping of the adhesive spread and thickness as well as to measure bond strength Finally we have designed a measurement head that is based on the required beam configuration and delivered a full system using this head to General Motors
Introduction Adhesive bonding is widely used in automotive production especially for body assembly The most common use is the lap joining of two or three sheet-metal panels Adhesive bonding adds strength and thus allows the use of lighter components at equal performance Adhesive bondingallows the joining of dissimilar materials such as aluminum (Al) and steel Modern adhesives (especially epoxy resins) have excellent fatigue and thermal shock resistance and less critical design tolerances because of their gap- filling capabilities Their service range extends from space environments to high temperatures It is critical to be able to measure the strength of these bonds during manufacture in a nondestructive effective and rapid manner
The most important manufacturing issues that can influence the strength of an adhesive bond are the maintenance of the proper fit-up and proper surface preparation While adhesive bonds are tolerant of some range of gap between the panels if the gap is too large the adhesive will not cover the required area and the intrinsic strength of the adhesive itself is reduced If surface contamination (eg oil grease surface oxides corrosion and water infiltration) is present the bond adhesion will be reduced In the limit of very low adhesion weak bonds may have intimate contact but little or no bond strength (ldquokissingrdquo)
The corresponding requirements for nondestructive evaluation of adhesive bonds fall into three areas (1) mapping of the adhesive coverage (2) measurement of adhesive thickness and (3) measurement of the adhesion of each metaladhesive bond
All inspections must be performed from one side and must be able to function on contoured surfaces The ideal tool must be able to perform the above measurements simultaneously (ie in one pass across the bond)
At the current time nondestructive inspection is not performed during the bonding process The only quality control techniques now implemented are careful process control machine-vision inspection of the adhesive bead before joining and selective destructive evaluation A nondestructive technique for in-line measurement of adhesive integrity would reduce scrap and warranty costs and thus allow wider use of adhesive joining
Laser ultrasonics offer an attractive approach for nondestructive evaluation over a broad range of applications The full complement of ultrasonic waves (longitudinal shear Lamb and Rayleigh) can be produced with known directionality The pulses are high in bandwidth thereby providing the high depth resolution required for thin sheets and bonds The spot sizes on the part can be
10-13
much less than 1 mm in diameter thereby providing high spatial resolution
The objective of this project is to develop a real-time system for inspection of adhesive panels during auto body assembly (see Figure 1) This system will incorporate a fiber-delivered robotic measurement head containing a scanning mirror that will be able to scan narrow sections of adhesive very rapidly
Figure 1 Depiction of robot-driven inspection system performing a two-dimensional scan of an adhesive-bonded auto body panel
Adhesive Bond Strength Measurements We next investigated a series of bond strength samples provided by Sandia National Laboratories The samples were prepared with various bond strengths ranging from 10 to 100 Our goal was to determine a suitable configuration settings and parameters of the laser ultrasonic inspection system and a suitable bond strength metric applied to the laser ultrasonic data which would enable the verification of existence or lack of adhesive and the identification and classification of the samples according to their bond strengths Several configurations of the generation lenses including spherical cylindrical and cross cylindrical with various focal lengths were used for the experiments The generation lens configuration proved to be the most critical factor for enabling the characterization of the adhesive samples In particular a single cylindrical lens with a focal length of 25 mm was determined to be the most effective The beam separation and generation laser energy were also varied in the experiment but were found to be not critical
A set of oscilloscope time-traces were taken from four samples with different bond strengths including on and off their adhesive regions The beam separation was set at ~45 mm and the time-span of the oscilloscope was set such that only the interface-echoes after the Rayleigh wave arrival and before the shock wave arrival were displayed As an example Figures 2 and 3 show the time-traces obtained from the sample with 26 bond strength over a time-span of 175 us to 425 us The longitudinal-longitudinal (LL) echo separation is about 500 ns and the time-trace contains 5 LL arrivals starting with the fourth echo which is the first arrival appearing after the Rayleigh wave arrival
10-14
Figure 3 On-adhesive time-trace for sample with Figure 2 Off-adhesive time-trace for sample with 26 bond strength26 bond strength
As there was a high variation of surface reflectivity from sample to sample and some surface variation within any given sample including between its on-adhesive and off-adhesive regions we selected the on-adhesive and off-adhesive inspected locations on a given sample such that the magnitude of the first arrival in the measured time-trace when on-adhesive is as close as possible to the magnitude when off-adhesive Also the arrivals after the shock wave were too weak to make meaningful measurements even when the shock wave was set to arrive early For a given sample we observed that the ratios of magnitudes of adjacent interface-echoarrivals did not change appreciably when moving the laser beams across the sample Comparing time-traces from samples with different bond strengths we also observed a general trend of decreasing later arrivals with increasing bond strength for most of the samples To quantify this effect we selected and applied an algebraic metric to the peak magnitudes of the sequences of interface arrivals for the different samples The result is shown in Table 1 Table 1 Metric applied to time-trace data from samples with different bond strengths In this table ldquoArrival nrdquo means the magnitude of the nth interface-echo LL arrival in units of mV
Sample Arrival 4
Arrival 5
Arrival 6
Arrival 7
Arrival 8
Metric
Bond 26
380 300 230 180 170 058
Off-Adhesive
450 400 290 270 200 064
Bond 58
195 140 80 75 80 048
Off-Adhesive
410 310 290 270 210 066
Bond 88
390 180 175 130 130 039
Off-Adhesive
410 310 290 280 210 066
Bond 100
83 63 52 48 36 06
Off-Adhesive
83 68 45 60 48 067
10-15
The metric is the summation of peak magnitudes of interface Arrivals 5 through 8 normalized by four-times the peak magnitude of interface Arrival 4 Since we start with Arrival 4 rather than with Arrival 1 for the calculation of the bond strength metric the effect of large adhesive-interface ultrasonic-wave incidence-angles on the metric is minimized Table 1 clearly demonstrates that 1) the on-adhesive metric varies with bond strength 2) for any given sample the on-adhesive metric is lower than the off-adhesive metric and 3) the off-adhesive metric is nearly the same for all four samples The data also shows a monotonic decrease of the metric as the bond strength increases for the samples with 26 58 and 88 bond strengths However the sample with the bond strength of 100 did not follow this monotonic trend and we are investigating whether this is caused by another characteristic of this particular sample besides its bond strength
Prototype Development We have developed a full laboratory prototype adhesive inspection system and delivered it to Cameron Dasch at General Motors RampD The measurement head has been described in earlier Annual Reports It is shown during target focusing in Figure 4
Figure 4 Focusing the measurement head during installation at General Motors An adhesive sample is mounted as the target
The head uses fiber delivery of the generation and detection laser beams to deliver spots on the target that have a controllable spacing and adjustable laser powerenergy The only connection to the measurement head is a fiber cable A photo of the system during data acquisition is shown in Figure 5 Figure 6 shows a photo of the control equipment
Figure 5 Acquiring data during the installation at General Motors
10-16
Figure 6 Control equipment
Conclusions In 2009 we completed this Phase II project We have successfully applied laser ultrasonics to the requirements for evaluating adhesive bonds used in auto body assembly Techniques have been developed to map the adhesive spread and measure the adhesive thickness The signal processing efforts have indicated a pathway for processing the raw data in real time We have designed and delivered a prototype scanning system to General Motors that will be robot-mounted for automated measurements We have defined a pathway for measuring the adhesive bond strength
PresentationsPublicationsPatents Marvin Klein and Homayoon Ansari ldquoLaser Ultrasonic Inspection of Adhesives Used in Auto Body Manufacturerdquo SAMPE 2010 Seattle Washington May 17-20 2010
10-17
C On-Line Weld Quality Monitor and Control with Infrared Thermography
Principal Investigator Zhili FengOak Ridge National Laboratory1 Bethel Valley Road Oak Ridge TN 37831(865) 576-3797 e-mail fengzornlgov
Team MembersHsin Wang and Wei Zhang - Oak Ridge National Laboratory
Technology Area Development Manager Dr Carol Schutte(202) 287-5371 e-mail carolschutteeedoegov
Field Technical Manager C David Warren(865) 574-9693 e-mail warrencdornlgov
Contractor Oak Ridge National LaboratoryContract No DE-AC05-00OR22725
Objective Develop an infrared (IR) thermography based weld quality detection technology capable of reliable and cost-effective on-line non-destructive monitoring and feedback control of the welding assembly operation in a high-volume automotive production environment
bull Phase I Demonstrate the technical merit and potential of the IR based weld quality monitoringtechnology for resistance spot welds
bull Phase II Field demonstration of a prototype system for real-time welding operation monitoringand on-line weld quality evaluation This will include technology transfer and dissemination for future commercialization
Approach bull Produce welds with different levels of quality and geometry attributes
bull Catalog and quantify weld quality attributes by means of destructive characterization
bull Develop quantitative correlation between various weld quality attributes and their characteristic IR thermal signature through combined welding heat flow simulation andlaboratory IR experiments
bull Develop field-deployable IR measurement techniques for cost-effective detection of the characteristic thermal signature patterns during welding operation (real-time) andor in on-line post-mortem inspection
bull Develop efficient IR data analysis algorithms for thermal signature recognition
bull Integrate the field-deployable IR measurement system and the data analysis algorithm to develop a prototype IR weld quality monitor and control expert system for field demonstration
10-18
Accomplishments
bull We have successfully completed the Phase I Concept Feasibility study and demonstrated the feasibility and potential of both post-mortem and real-time IR thermography to detect weld quality and defects commonly encountered in resistance spot welds using industry practices
bull Major weld defect issues such as cold weldsstuck welds weld expulsion and unacceptable surface indentation are readily identifiable in both post-mortem and real-time IR measurements
bull The weld nugget size a key weld quality measure governing the weld strength and failure mode in advanced high strength steel (AHSS) and other lightweight materials can be deduced from both post-mortem and real-time infrared thermal image data
bull Other types of common weld defects such as cracking and voidporosity are detectable although quantifying these defects requires further improvements in both IR image measurement techniques and detection algorithms
bull It is feasible for both post-mortem and real-time IR measurements to be performed onlineand within 1-2 seconds
bull It is feasible to develop an IR image analysis expert software based on the artificial intelligence principle to determine the weld quality in real-time and without relying on operators skill and experience
Future Direction Phase II
bull Refine and optimize field-deployable IR measurement techniques that can reliably detect the characteristic thermal signature patterns of various weld quality attributes both in real time and in post-mortem online inspection including (i) design and build a simple and cost-effective heatingcooling device for on-line post-mortem inspection and (ii) evaluate the pros and cons of single-sided inspection vs double-sided inspection
bull Develop robust IR image analysis software that in real-time can analyze the IR thermal image for the characteristic signature of various weld defects and weld joint configurations to provide quantitative measure of the quality and the level of defects (if any) of spot welds of both steel and aluminum (Al) alloys
bull Identify a cost-effective IR imaging camera system that meets the on-line weld quality inspection needs
bull Develop a prototype IR weld quality monitoring expert system (hardware and software) for field demonstration
bull Identify potential industry entities for technology transfer and eventual commercialization
Introduction Welding is an essential technology used in automotive body structure assembly Variations in welding conditions materials part dimensions and other production conditions inevitably occur in the high-volume and complex body-in-white (BIW) assembling process These variations can result in ldquoout-of-the-tolerancerdquo welds that impair the quality and performance of the vehicles Despite the extensive RampD efforts over the years non-destructive weld quality inspection still remains a critical need in the auto industry largely due to the unique technological and economical
10-19
constraints of the auto production environment Any weld quality inspection technique must be fast cost-conscious low in false rejections and not interfere with the highly automated weldingassembly process
Today all OEMs primarily rely on destructive testing to ensure the integrity of critical structure members Welded components are torn apart at predetermined time intervals (usually once per shift) to ensure the weld quality The destructive testing is costly and labor intensive As the teardown test cannot be done too frequently the cost risk associated with reworking or scrapping the defective welded parts made between teardown tests is even higher Furthermore the teardown inspection techniques are less effective for advanced high-strength steels (AHSS) aluminum and other lightweight materials As the industry moves toward body structures with more AHSS and aluminum the post-mortem teardown inspection for weld integrity will be less reliable and more difficult and costly potentially discouraging the implementation of these lightweighting materials
In 2007 USAMP sponsored a study to assess the current status for in-line resistance spot welding (RSW) control and evaluation systems and to determine their application potential for lightweight sheet materials [1] After extensive survey and communications with potential NDE suppliers and developers the study concluded that ldquono economically reliable method exists today to inspect resistance spot welds at production rates and the only technical needs identified in the project for further development consideration were in infrared thermography technologyrdquo
This project aims to develop a field-deployable on-line weld quality monitoring method and a prototype system based on state-of-the-art IR thermography A distinct advantage of IR thermography as a NDE tool is its non-intrusive and non-contact nature making the IR especially attractive in hIR thermography detects surface temperature changes due to geometric discontinuity or inhomogeneity An ldquoout-of-tolerancerdquo weld introduces a geometric change that would produce a perturbation of surface temperature profile from that of a normal weld In theory such temperature changes can be detected by IR thermography In reality detection of an anomalous weld by temperature change depends on many factors that can be grouped into four major categories (1) factors inherent to the weld such as the heat flow characteristics of the weld and the size orientation and location of the anomalous weld (2) factors causing surface temperature changes unrelated to the presence of weld quality anomaly (such as emissivity changes due to changes in surface condition reflection of other heat sources) (3) the sensitivity spatial resolution and other attributes of the IR measurement system and (4) the detection algorithms ndash the ability to critically and effectively process the IR signals and positively identify an abnormal weld when present
IR for weld quality inspection in the auto assembly environment has been explored in the pastmostly post-mortem (ie after weld is made and as a separate step in manufacturing) Typically a short-pulse heating via xenon flash light (in a few milli-seconds) is applied to the surface of a spot weld Temperature changes with time were then recorded by an IR camera and further processed to correlate to the weld size and other attributes of resistance spot welds Such an approach had varying degrees of success in the laboratory environment and limited applications in other industries However applications in the automotive industry have been unsuccessful largely due to a critical drawback that cannot be implemented in the high-volume production line which is the prerequisite of painting the weld surface to eliminate the surface reflection and other environment interferences [2]
1 Sun X Charron W Cerjanec D Bohr J and Cleaver T ldquoAMD 605 In-Line Resistance Spot Welding (RSW) Control and Evaluation System Assessment for Light Weight Materials (Final Report)rdquo August 20082 Communications with Weld NDE Subcommittee Automotive Materials Partnership Steering Committee USCAR 2004
10-20
Working with industrial partners we recently demonstrated several novel concepts and approaches that would overcome some of the key technical barriers inhibiting the use of IR thermography as an effective weld NDE tool in the automotive assembly line A unique advantage of the Oak Ridge National Laboratory (ORNL) approach is the potential for real-time weld quality detection as the weld is being produced This would offer the opportunity of real-time weldingprocess feedback for in-process adjustment and control [3]
This project builds upon recent work and consists of a two-phase gated RampD effort to further advance the IR thermography based weld quality monitoring and control technology to a stage that can be deployed in high-volume auto production environment In this project a two-phase gated approach was adopted to develop an IR based weld quality inspection technology that overcomes the key technical barriers of the past Phase I is a 12-month Concept Feasibility study to establish the technical basis and demonstrate the ability of detecting various types of defects (cold welds cracking expulsion etc) and the critical weld quality attributes (weld size and indentation) in resistance spot welds produced using industry welding practices and without any surface treatment or preparation Since it has been determined to be warranted more comprehensive research and development program will be now be performed in the second phase (Technical Feasibility) toward eventual field demonstration of the technology
The RampD in Phase I has been primarily carried out at ORNL with support from the industry collaborators An industry technical advisory committee has been formed for this project consisting of representatives from Chrysler Ford General Motor and ArcelorMittal
Following the recommendations from OEM material joining and NDE experts and relevant USAMP AMD task teams the project (Phase I and Phase II) includes tasks on both real-time weld quality monitoring and post-mortem weld quality auditing The real-time monitoring is performed as a weld is being made whereas the post-mortem auditing is performed as a separate step after welding The two different techniques are needed to address different application situations Both techniques must be suitable for on-line inspection
Phase I consisted of three major milestones (1) producing a limited set of controlled resistance spot welds having various types and levels of weld quality and defect attributes and characterizing these weld attributes through destructive examination (2) designing and performing IR measurements of these welds to obtain their ldquothermal signaturesrdquo (3) IR data analysis and processing based on heat flow simulation to develop the correlation between the characteristic signature of IR images and the weld quality attributes
Resistance Spot Weld (RSW) Samples for IR Thermography In Phase I a set of steel resistance spot welds were made having the typical range of weld defects and quality attributes known to potentially influence the structural performance of the spot welds in automotive body structures These attributes are listed below in the order of decreasing importance per the industry technical focus committee
3 H WangZ Feng and PS Sklad (2004) ldquoInspection and Evaluation of Laser Welds for Transit Busesrdquo Thermosense XXVI SPIE Defense and Security Conference Orlando FL
10-21
bull Weld with no or minimal fusion
bull Cold or stuck weld
bull Weld nugget size
bull Weld expulsionindentation
bull Weld cracks
bull Weld porosity
As a concept feasibility study all welds were made on hot-dipped galvanized dual phase 780 MPa (DP590) steel of 185mm nominal thickness in the common two-stack configuration All welds were made at the Welding Lab of ArcelorMittalrsquos research and development (RampD) Center in East Chicago Indiana For each welding condition a total of six replicate welds were made Two of the six replicates were sectioned destructively to determine the weld nugget size type and degree of weld defects The other welds of the same set were used in IR thermography measurements In addition extensive IR measurements were also conducted on one of the sectioned welds before it was sectioned It was found those controlled welds made by ArcelorMittal were very consistent for a given welding condition This greatly facilitated the development work in Phase I
Table 1 summarizes the welds made with different quality attribute Each weld was characterized by its nugget diameter surface indentation type andor extent of defects The weld nugget represents the fused region of the weld and its diameter was determined using an optical microscope from both the cross-sectioned samples and the samples with one of the sheet steels carefully removed by machining and polishing to the faying surface of the weld The table is color-coded The second and third rows represent the welds acceptable in accordance with industry specifications whereas the welds in the other rows are regarded to be ldquoout-of-tolerancerdquo Appearances of representative welds are shown in Figure 1 through Figure 5
Table 1 Weld samples with different weld quality attributes produced at ArcelorMittal RampD
Minimum weld refers to the minimum weld nugget diameter or button size perAWS specification Maximum weld refers to the weld obtained using welding conditions just belowthe explosion limit
10-22
Figure 1 Cross-section view of a stuck weld with very small fused weld nugget
Figure 2 Cross-section view of a weld with acceptable weld nugget size and no defect
Figure 3 Welds with solidification shrinkage voids as revealed (a) in cross-section view and (b) by machining off one of the steel sheets
Figure 4 Cross-section view of a weld with expulsion
Figure 5 Cross-section view of a weld with expulsion cracking and surface indentation
10-23
Post-Mortem Inspection
Two types of IR weld quality inspections were studied in Phase I postmortem and real-time In all IR measurements the weld sample surface was in as-welded condition ndash there was no any surface painting cleaning or other treatments Instead the IR images were digitally enhanced during image analysis to minimize the effects of surface conditions (if any) encountered duringeither postmortem or real-time measurements In addition several heatingcooling techniques were tested and evaluated for enhancing the IR image signal to noise ratio
In the post-mortem study the IR measurement was conducted at ORNL on the welds made at ArcelorMittal An external heating (or cooling) source was applied to introduce transient temperature changes in the weld and its surround area An IR thermography camera was pointed to the weld surface to record the surface temperature changes The measurement principle is illustrated in Figure 6
Figure 6 IR weld quality inspection principle (post-mortem approach)
The recorded IR images were then analyzed (offline and manually in Phase I) to obtain the characteristic thermal signature changes of the IR images and to relate such signature changes to the weld quality The type of external heating or cooling source and the way it was applied influenced the heat flow in the weld and thereby the sensitivity and accuracy to detect the weld quality attributes In Phase I a total of six different heat and cooling techniques (three heatingand three cooling) were evaluated It was found that one heating technique and one coolingtechnique were particularly promising They both required no physical contact between the coolingheating device and the weld surface The devices are readily available commercially low-cost and highly portable Together with the digital imaging enhancement techniques adopted in this project these two techniques were capable of producing consistently clean signals (high signal-to-noise ratio) that facilitated the IR image analysis and correlation to the weld quality These two promising techniques herein referred to as the ldquoORNL heating or cooling methodsrdquoare under internal review at ORNL for invention filing so details are omitted in this report
The ORNL heatingcooling techniques were capable of producing very consistent results during repeated tests and were able to distinguish major weld quality and defects in the controlled welds as shown in Figure 7 First of all welds with different defects and geometry attributes have highly distinguishable temperature transient profiles More encouragingly the transient temperature curves can be roughly grouped into three distinct groups corresponding to the weld quality The welds with the acceptable quality are in the middle band of the curves The
10-24
welds with unacceptable quality attributes such as stuck welds undersized weld (weld diameter less than the minimum specification by the industry) are clearly distinguishable from those of the acceptable welds The welds with severe expulsion and cracking are distinctively located on the other side of the acceptable welds band
Figure 7 Post-mortem IR intensity curves of the controlled welds with different weld quality attributes generated using the proprietary cooling technique (top) and proprietary heating technique (bottom) For each heatingcooling technique identical IR image measurement condition was used for the welds with different qualitydefect attributes so that the differences in the recorded IR signal were solely from the variations in weld quality The curves are color coded into three different groups corresponding to different weld quality attributes (i) cold or undersized welds (ii) welds within acceptable weld nugget size and minimum defects and (iii) welds with detectable expulsion severe surface indentation andor cracking
Real-Time Inspection Real-time IR inspection studies were performed on-site at ArcelorMittal RampD Center A commercial IR camera (the same one used in the post-mortem study) was brought to the welding lab and used to capture the temperature changes during welding The experimental set-up is shown in Figure 8 where an IR camera was placed near the spot welding head and pointed to the top surface of the spot weld
Figure 8 Real-time IR measurement set up and an IR image showing formation of a surface crack during welding
10-25
The real-time IR measurement utilizes the heat generated during welding and the welding heat flow pattern changes caused by the formation of weld defectsanomalies or variations of weld geometric attributes (weld nugget size and surface indentation) to determine the weld quality as the weld is being produced Examples of the real-time measurement results are given in Figure 9 in which three repeated IR measurements (on three separate welds) were performed for each welding condition It is evident from the figure that the measurements for a given welding condition were highly consistent and therewere definite correlations between the real-
Figure 9 Real-time IR measurements of weld quality attributes Top IR intensity variations as function of time corresponding to different weld quality attributes The real-time measurements were highly repeatable as indicated by three repeats for each welding condition Bottom line profile of IR intensity at a given time shows distinctive patterns associated with different weld quality attributes
time IR signals and the different weld quality attributes for the weld studies in Phase I This was consistent with previous work on laser welding [3] In addition surface cracks formed during welding were clearly visible during real-time IR measurement as shown in the photo shown in Figure 8
Initial Development of an Expert System In Phase I we also worked on a proof-of-concept development of the IR thermal signature analysis expert software for postmortem weld quality auditing This expert software to be fully developed in Phase II aimed at providing reliable and accurate determination of the weld quality from the IR thermal signature measurements (either postmortem or real-time) without relying on the skills or experience of the operator (a major drawback prevented the use of IR inspection in the past) The software was based on the artificial intelligence principle and coded with generic signal pattern recognition routines The initial proof-of-concept version was developed and evaluated with idealized post-mortem IR thermal profiles that were obtained from finite element simulation of the heat flow and surface temperature changes of welds with different nugget size and indentation features under the heating conditions similar to the ORNL heatingmethod developed in Phase I Figure 10 shows the comparison of the prediction of the weld nugget sizes with the target ones It is evident the feasibility of such software for weld quality determination
10-26
Figure 10 Demonstration of the artificial intelligence based expert software for weld nugget size detection (initial version in Phase I)
CostBenefit Analysis Finally we conducted a preliminary rough-order-of-magnitude (ROM) cost analysis of the IR based inspection system The cost analysis included the cost of IR inspection head the cost of robotic system and the cost of labor and operation
The IR inspection head consists of the IR camera heatingcooling system for post-weld inspection and the expert system software According to a major IR camera manufacturer a high performance camera capable of performing the type of full-field IR imaging in Phase I costs about $30K (camera and lens) This would be the upper end of the IR camera It is noted that one of the major activities in Phase II is to refine and optimize the IR signal analysis algorithms to allow the use of low cost toolbox IR camera A low cost IR camera currently cost under $15K and some are under $10K Other IR head costs include heatingcooling device for post-weld inspection (not needed for real-time monitoring) and the expert software Induction heater $8000 Liquid cooling $1000 Software $2000 Therefore ROM cost of the IR inspection head is in the range of $15K to $40K
For on-line automated inspection a robotic system is likely required Since an IR camera only weights a few pounds light duty robotics would be adequate The cost of such systems is in the range of $30K to 50K based on the information from OEMs and robotic manufacturers Therefore the ROM capital cost of the entire IR inspection system would be in the range of $45K to $90K
Since the IR inspection system is highly automated and the expert system provides the visual feedback of weld quality and networked digital record archival it is reasonable to expect that an operator for welding can be doubled for weld quality monitoring In this case the operating cost mostly consists of the cost of running the robotics heatingcooling and periodic inspection calibration or maintenance of the IR camera head From the technology perspective the high labor cost (~$1Myear) in todayrsquos manual destructive pry-check and tear-down can be mostly eliminated The ergonomic and safety issues in todayrsquos destructive inspection are also resolved In addition the automated IR inspection is expected to bring in significant cost savings from the reduced scrap andor rework of defective welded parts associated with todayrsquos infrequent tear-down and pry-check
Finally todayrsquos teardown inspection techniques are less effective for advanced high-strength steels aluminum and other lightweight materials As the industry moves toward body structures with more AHSS and aluminum teardown inspection for weld integrity will be less reliable and
10-27
more difficult and costly potentially discouraging the adoption of these lightweighting materials The IR based NDE technology once successfully developed would be a critical enabler for the widespread use of lightweight materials
Conclusions In Phase I we evaluated approaches combining novel IR system setup and IR signal analysis techniques that have demonstrated the feasibility to overcome the key technical barriers inhibiting IR weld NDE in auto assembly line Both post-weld inspection and real-time detection of weld quality were explored The technical feasibility of IR NDE for weld quality and defect is summarized in Table 2 The post-weld approach was able to detect typical weld defects and determine the nugget size of steel spot welds Furthermore for the first time the feasibility of real-time weld quality detection has been demonstrated Both the post-mortem and the real-time approaches in Phase I required no special treatments of the as-welded or as-received surface ndash a key issue that has hindered previous IR attempts As such we have successfully met the milestones and passed the Technical Gate point set forth for Phase I
Table 2 Feasibility of IR NDE of Weld Quality and Defects
Future Directions
Phase II
bull Refinement and optimization of field-deployable IR measurement techniques
bull User friendly IR image recognition expert software
bull IR weld NDE guideline for selected typical applications
bull Field demonstration and prototype systems
PresentationsPublicationsPatents W Woo ZFeng H Wang CW Chin W Zhang H Xu and PS Sklad ldquoApplication of Infrared Imaging for Quality Inspection in Resistance Spot Weldsrdquo SPIE Defense Security and Sensing Conference April 13-17 2009 Orlando FL
10-28
D Enhanced Resonance Inspection for Light Metal Castings
Principal Investigator Xin Sun Pacific Northwest National LaboratoryRichland WA 99352 (509) 372-6489 e-mail xinsunpnlgov
Technology Area Development Manager William Joost(202) 287-6020 e-mail williamjoosteedoegov
Field Technical Manager Mark T Smith (509) 375-4478 e-mail marksmithpnlgov
Contractor Pacific Northwest National LaboratoryContract No DE-AC05-76RL01830
Objective bull To accelerate the development of rapid and reliable resonance inspection technique in ensuring the structural integrity of light metal castings
bull To assess the capability of modeling approaches in accurately predicting the vibrational mode frequencies along with the variability of those frequencies
bull To quantitatively evaluate the sensitivity of resonance inspection (RI) to anomalies of various types and sizes in various locations of a light metal casting
Approach bull Develop a set of computational tools to enable predictive capability
1 Make current setuptraining time shorter by using computer modeling to simulate response of actual parts and flaws
2 Identify response to critical flaws thereby allowing ldquofaultrdquo to be specified and subsequently fixed (process feedback)
bull Develop computational model to translate materials properties and geometry into predicted frequencies
1 Use a Computer Aided Design (CAD) model or preferably three-dimensional (3D) scanning to provide exact as-is geometry to finite element analysis (FEA) model
2 Generate FEA 3D mesh directly from scanned data
bull Develop numerical algorithms to identify mode shapes for each frequency
1 Identify exact modal shapes for all the resonance frequencies in practical sampling range ie 1 to 80 kilo-hertz (kHz) This is critical in determining what frequency changes correspond to which features in the part
bull Establish sensitivity matrix for critical anomalies
1 Use FEA to predict the response sensitivity to a specified feature (flaw) anywhere in the part
10-29
2 Use perturbation theory-based numerical analyses to predict the frequency shift of a part considering flaws at different locations
bull Validate modeling results by comparing predicted and measured frequencies and mode shapes
1 Have multiple vendors collect data over full frequency range and compare these experimental measurements with FEA predictions
Milestones Metrics and Accomplishments Completed RI testing on production partmdasha steering knuckle
bull Three vendors participated in the study
Completed finite element simulations on the steering knuckle
bull Performed finite element-based natural frequency extraction
bull Performed mesh size convergence studies for the knuckle finite element model
bull Simulated actual RI experimental setup with steady-state dynamic simulation to obtain the vibrational amplitude at each resonant frequency
bull Calculated mode shapes and compared with experimental laser vibrometry measurements
bull Obtained good correlations between experimental frequencies to observed mode shapes
bull Predicted frequency shifts due to porosity and slits (oxide film model) using variational principles
bull Performed variational study to identify the influence of element density stiffness and part dimension on predicted natural frequencies and associated mode shapes
Future Direction bull The project has been completed
bull The success of this project has led to a new project under US Automotive Materials Partnership (USAMP) in developing the computationally enhanced RI sorting module
Introduction The resonance inspection (RI) technique is quick and very sensitive making it an ideal choice in production environments
Manufacturing acceptance of RI is limited by its empirical methodology and lengthy training period In addition the current RI technology does not provide any physics-based reasons for rejecting a particular part The ability to use RI for testing and flaw identification has long been a desired inspection technology
The goal of this concept feasibility project is to determine if it is feasible to use RI on a more quantitative basis by providing physics-based explainations of certain frequency shifts induced by flaws and anomalies More specifically we set out to assess the capability of finite element modeling approaches in accurately predicting the vibrational mode shapes and natural frequencies
10-30
along with the variability of those frequencies induced by structural flaws and anomalies Possible benefits of the computationally enhanced RI technology include the following decrease the required size of the training set choose the frequencies to watch more intelligently predict the sensitivity of the test to a specific feature etc Because of the complexity of the resonance structure in even simple parts computer modeling of the RI process had previously been deemed as intractable in many instances
In FY 2008 this project demonstrated that modeling the resonant behavior of simple partsis not only possible but also quite accurate We have compared the simulated results with the experimental results from two commercial vendors The Modal Shop (TMS) and Magnaflux Quasar (Quasar) We have also shown that the use of laser vibrometry resolves any ambiguities as to the actual mode shape present at a particular frequency
Based on the progress achieved during FY 2008 (Ref 1 2) FY 2009 has seen more achievements in both the experimental testing area and modeling area (Ref 3) Great strides were also made in automating the mode identification process and in predicting accurate mode frequencies Experimental resonance data have been collected on all the knuckles provided by our castingpartner We have also developed Finite Element Analysis (FEA) models from both Computer Aided Design (CAD) geometry and from computed tomography (CT) data in performing the subsequent natural frequency extraction analyses
Variational principle-based formulations were also derived for quantifying the influence of part defects at different locations on the overall resonance of the knuckle FEA models with defects have been created and the result generated from the model provides some interesting comparisons with data from experiments Study of the perturbation theory has also been extended
FEA model for knuckle developed An automotive steering knuckle as shown in Figure 1 has been chosen as a production part for our study Commercial finite element software ABAQUS (Ref 4) is used FEA models have been created from both CAD geometry and CT scan data
Figure 1 An automotive steering knuckle chosen for our concept feasibility study
Figure 2 shows the measurable geometry difference between the CAD model and the CT scan result of the sample knuckle part In some areas the difference of two models can be as much as 6 mm Consequently the predicted frequency spectra for the two models are also slightly different
10-31
Figure 2 Geometry discrepancy between the CT model and the CAD model
Mesh size convergence A mesh size convergence study was carried out by running the finite element frequency extraction with different characteristic mesh sizes ranging from 20 mm to 08 mm By comparing results from models with different mesh sizes the following observations on mesh size convergence can be made
In general predicted natural frequencies for every mode decrease as mesh size decreases An extrapolation curve fitting can be used to estimate the convergent resonance frequencies with a sufficiently small mesh size
The converged mesh size can be established as the largest mesh size below which no more mode switches can be predicted when mesh size is further reduced
Comparison of predicted and measured resonance frequency spectra Very good comparison has been achieved between the experimentally measured and FEA predicted resonance spectra for the steering knuckle with mesh size of 08 mm Figure 3 illustrates the comparison for the first 20 kHz In Figure 3 the peaks above the x-axis are the experimentally measured resonance spectra with the response power at different frequency levels and ldquoHTrdquo stands for ldquoheat treatedrdquo in the legend of Figure 3
Figure 3 Comparison of resonance frequencies for the first 20 kHz from TMS experiments and ABAQUS simulation
10-32
The peaks below the x-axis are the predicted resonance at different frequency levels Since the natural frequency extraction analysis does not provide any response amplitude the predicted results are plotted with uniform magnitude The good alignment between the top experimental spectrum and the lower predicted spectrum demonstrates that finite element-based modal analysis can be used to accurately predict the natural frequency response of a production-level light metal casting part
Complete mode shape catalog The vibrational mode shapes for the lowest 100 frequencies have been plotted and cataloged from the ABSQUS FEA results based on a CAD part As an illustration Figure 4 shows the mode shape for No 88 with a natural frequency of 37098 Hz for the steering knuckle
Figure 4 Knuckle mode shape at 37098 Hz
Comparison of mode shapes predicted by FEA with those measured by Laser vibrometry Experimental-mode shape measurements for the knuckle have also been performed using laser vibrometry by Polytec a commercial supplier of this technology Polytec measured the actual motion of the parts as they were being acoustically excited Because of the size of the knuckle for each frequency a total of 10000 scanned points divided into 21 image groups was used to cover the whole surface of the knuckle The scan frequency of 5 Hz was used to minimize the size of the scan data file
An automated mode shape matching algorithm between FEA prediction and experimental measurements has been developed and implemented which has greatly reduced the human error in mode matching A resemblance coefficient ranging from 0 to 1 is calculated between a Polytec mode and a predicted mode (Ref 3) A coefficient close to 1 indicates perfect matching of the mode pair For example Figure 5 shows the experimentally measured mode shape at a resonance frequency of 16810 Hz and Figure 6 shows the corresponding mode shape predicted by the finite element analysis For this pair the resemblance coefficient is 087
10-33
Figure 5 Polytec-measured knuckle vibrational mode shape at F=16810 Hz Red region represents highest absolute displacement
Figure 6 Knuckle mode shape at 16825 Hz as generated from ABAQUS FEA model Region at left side representshighest absolute displacement
Variational study on influences of density stiffness and part dimension on resonance frequency A perturbation theory-based variational approach has been used to derive the analytical resonance frequency shift due to a small change in part density material modules andor part geometry It is shown that the frequency shift for each mode is proportional or inversely proportional to the changes in density ρ stiffness E and overall geometry scale V
Subsequent finite element analyses were performed and the predicted frequency shifts match well with the perturbation theories (Ref 3)
Steady-state dynamics analyses for the knuckle
In addition to the modal analysis steady-state dynamic analyses were also performed for the knuckle to predict the relative magnitude of each resonant frequency
10-34
This is done by exciting the steering knuckle at a certain frequency with a concentrated force applied at the driver node (see Figure 7) along with a uniform gravity force acting on the whole part A boundary condition of zero displacement at the thickness direction is applied to the two nodes representing the two receiving transducers in the experimental setup A steady-state dynamics analysis is run after the linear frequency extraction step The reaction force is obtained at the two transducer nodes and the response power is calculated as the average reaction force from the two nodes
(a) (b)
Figure 7 Illustration of the transducer locations for the knuckle for (a) experimentmdashsee black X on part (b) steady-state finite element analysismdashsee white dots on part
Figures 8 and 9 compare the predicted vibration magnitude at each frequency level with the experimental measurements Here the Quasar data are shown with a real power unit and the ABAQUS results are plotted with their relative values in negative for each frequency Relatively good resonance magnitudes have been obtained in comparison with the Quasar experimental data particularly for the 20 kHz - 40 kHz range
Figure 8 Steady-state dynamics comparison for the first 20 kHz resonance frequencies
Figure 9 Steady-state dynamics comparison for the 20 kHz to 40 kHz resonance frequencies
10-35
Conclusions
In this concept feasibility study we have demonstrated that it is not only possible to use finite element-based frequency extraction to predict the vibrational frequency of a simple partbut it is also possible to predict the vibrational frequency as well as the mode shape of a complicated production-level part with very good accuracy With the rapid development of computer hardware and software finite element analyses and perturbation analyses will be capable of putting RI on a more science-based quantitative basis
It is commonly acknowledged by the original equipment manufacturer (OEM) participants that the work completed in this project is of greater magnitude and quality than expected Unexpected computational capabilities have also been shown and investigated Based on what has been achieved a follow-on technical feasibility study has been proposed and approved by USAMP in developing an industry-wide standard and the associated sorting modules for computationally enhanced RI
References 1 X Sun and M H Jones ldquoNDE 701 ndash Enhanced Resonance Inspection for Light Metal Castingsrdquo US-DOE Automotive Lightweighting Materials FY2007-2008 Annual Progress report
2 C Dasch X Sun C Lai J Saxton G Stultz G Palombo C Grupke G Harmon L Ouimet D Simon and M Jones Towards Quantitative Resonance Inspection Resonance Mode Identification and Modeling Proceedings of Review of Progress in Quantitative Nondestructive Evaluation Chicago Illinois 2008
3 C Lai X Sun M Jones C Dasch and G Harmon Project Final Report - NDE 701- Enhanced Resonance Inspection for Light Metal Castings Pacific Northwest National Laboratory Richland WA PNNL-18630 July 2009
4 ABAQUS 2007 Analysis Userrsquos Manual Version 67
PresentationsPublicationsPatents 1 ldquoNDE 701 Enhanced Resonance Inspection for Light Metal Castingsrdquo AMD Offsite Southfield Michigan Oct 29 2008
2 C Dasch X Sun C Lai J Saxton G Stultz G Palombo C Grupke G Harmon L Ouimet D Simon and M Jones Towards Quantitative Resonance Inspection Resonance Mode Identification and Modeling Proceedings of Review of Progress in Quantitative Nondestructive Evaluation Chicago Illinois 2008
10-36
E Concept Feasibility of Global Quality Assurance of Joining Technology for Automotive Body-in-White
Principal Investigator Xin SunPacific Northwest National LaboratoryPO Box 999 Richland WA 99352 (509) 372-6489 e-mail xinsunpnlgov
Industry Consultants Ford General Motors Chrysler
Technology Area Development Manager William Joost(202) 287-6020 e-mail williamjoosteedoegov
Field Technical Manager Mark T Smith (509) 375-4478 e-mail marksmithpnlgov
Contractor Pacific Northwest National LaboratoryContract No DE-AC05-76RL01830
Objective bull To quantitatively evaluate the effects of missing bondline or missing welds on the global resonance signature of an automotive body-in-white (BIW)
bull To assess the feasibility of a new inspection technique that will provide a global quality factor of the joining technology used for an automotive BIW
Approach bull Evaluate the sensitivity of resonance spectroscopy to detect defects such as a partial weld or an improperly cured adhesive in a simple structure
bull Determine target values for sensitivity reference surrogates of defects and functional requirements to be acceptable in a manufacturing environment and compatible with either inline or offline quality assurance and cost targets to ensure an inspection is economically affordable for the manufacturer
bull Determine techniques of exciting vibrational modes and other methods of stimulus that will intentionally stress a predetermined region to increase sensitivity to a selected site
bull Investigate novel means to reduce implementation cost
bull Determine advantages technology gaps and implementation issues investigate cost-effective means for implementation at automotive assembly plants and define paths for future development
Milestones Metrics and Accomplishments Milestone 1 Report of Concept Feasibility Study of Global QA of Joining Technology for Automotive BIW Completed September 2009 (PNNL-18838)
10-37
Accomplishments
bull Fabricated adhesively bonded generic hat sections perfectly bonded and with intentionally missed bondlines Experimentally measured the resonance spectra for all the three part populations using resonance inspection (RI)
bull Performed statistical data analyses on experimentally obtained RI data to demonstrate the concept feasibility of using RI in detecting lack of bonding in automotive BIW-level parts
bull Determined advantages technology gaps and implementation issues
Future Direction bull The project has been completed
bull The success of this concept feasibility project has led to the development of a new project proposal on technical feasibility of Global Quality Assurance of Joining Technology for Automotive Body-in-White
Introduction While the domestic automotive industry continues to introduce new lightweight materials and associated joining technologies to body-in-white (BIW) the need emerges for a global quality assurance tool that is nondestructive and able to quickly evaluate the joining technology for an entire automotive BIW Current practices employ statistical testing with destructive measurements that are labor-intensive ergonomically unfriendly costly and time intensive Further continuous joints such as adhesive bonds or laser welds can be difficult to inspect destructively and joints in high-strength steel can be too strong to be pried apart
Facing these challenges this project will examine the concept feasibility of using a global joint quality evaluation and assurance approach by quantifying the contributions of joint integrity (discrete as well as continuous) to the overall structural stiffness of the BIW through vibration mode and natural frequency analyses The proposed method is computationally intensive and examines BIW natural frequency and vibration modes using structural finite element analyses Different means of structural excitation and effects of different boundary conditions will be established by detailed finite element structuralmodal analyses on BIW models provided by the original equipment manufacturers
Partnering with automotive manufacturers is critical to ensure the techniques of straining the BIW and performing three-dimensional (3D) imaging is conducive to a manufacturing environment and existing online production practices Various experimental measurements including resonant spectroscopy and whole-body strain measurements using techniques such as shearography (shearing speckle interferometry) will be used as experimental model validations
The proposed techniques are capable of whole body imaging where either static or dynamic stress is applied and displacement is quantified on the order of nanometers Comparing analyses results the 3D displacement measurements will show a characteristic pattern when joining methods have been properly used and permit an objective means of evaluating quality
The objective of the project is to assess the feasibility of a global inspection technique for the various joining technologies used for an automotive BIW Three component-level parts have been examined in this concept feasibility study welded strips bonded strips and bonded hat sections
10-38
Our FY08 annual report (Sun et al 2008) summarizes the resonance inspection (RI) resultsfor the welded and bonded strips populations In FY09 we focused on a generic hat section to evaluate the feasibility of using a global measurement technique such as RI to determine the bond quality of a BIW level part The fabrication process and corresponding resonance spectraof controlled good and bad parts in this population are detailed in this report Conclusions and suggestions for future research will be made after the results are analyzed More detail on sample fabrication procedures measurement techniques measured RI spectra and data analyses procedures can also be found in our project final report (Sun et al 2009)
Fabrication of Adhesively Bonded Hat Sections Adhesively bonded hat sections are designed and fabricated to test the effectiveness of usingresonance spectra to discriminate lack of bonding parts from fully bonded parts
Figure 1(a) schematically illustrates the dimensions of the idealized generic hat section The top hat and the base plate are made of 12-mm gage mild steel sheets Note that these partswere accurately cut and bent in the machine shop at Pacific Northwest National Laboratory and they do not have the typical production line part-to-part variations observed in the automotive production environment Figure 1(b) shows a typical hat section as fabricated
(a) (b)
Figure 1 Illustration of adhesively bonded hat section
The structural adhesive Dow Betamate 73305GB was used in the bonding process In total six bonded hat sections were fabricated and cured under vacuum condition Two sections (G1 and G2) were perfectly bonded with 24-in bond lines on both flanges The remaining four ldquobadrdquo samples (G3-G6) were made with intentionally missed 8-in-long bond lines at various locations on the two flanges
Resonance Spectroscopy Measurements The Modal Shop (TMS) hammer impact system was used to measure the resonance spectra of the six bonded hat sections The experimental set up is shown in Figure 2 Two 1-in-wide nylon rails were positioned 2 in away from both ends of the parts as supports The impact point was at the center of the part (12 in from either side or 2 in updown from the top)
Figure 2 TMS resonance test set up 10-39
Figure 3 (a)-(f) shows the measured resonance spectra for the two good parts (G1 and G2) in different frequency ranges The results shown in Figure 3 clearly demonstrate that discrete resonance peaks can be measured for the adhesively bonded hat sections That is the bonded hollow sections ring and the attenuating effect of the adhesive are not dominating in the resonance spectra for the hat section as was seen in the adhesively bonded strips (Sun et al 2008) In addition the test results shown in Figure 3 indicate that the resonance spectra comparison between the two good parts share many similar resonance peaks This is particularly true for frequencies of less than 15 kilo-Hertz (kHz) In the frequency range gt15 kHz their resemblance decreases This may be due to the small number of measurements and the high noise-to-signal ratio for this measurement technique at higher frequency ranges
(a) 0-1000Hz (b) 1000Hz-2000Hz
(c) 2000Hz-5000Hz (d) 5000Hz-10000H
(e) 10000Hz-15000Hz (f) 15000Hz-20000Hz
Figure 3 TMS measured resonance spectra comparison for the two good hat sections
10-40
Figure 4 shows a typical spectra comparison between the good part (G1) and a bad part (G3- missing an 8-in bond line on the 2-in-wide flange) The results here indicate that the bad part is missing many distinct resonance peaks compared to the good part particularly in the frequency range of 3 to 7 kHz At higher frequency ranges ie gt10 kHz some significant frequency shifts are also observed between the two parts
(a) 0-1000Hz (b) 1000Hz-2000Hz
(c) 2000Hz-5000Hz (d) 5000Hz-10000Hz
(e) 10000Hz-15000Hz (f)15000Hz-20000Hz
Figure 4 TMS measured resonance spectra comparison between a good part (G1) and a bad part (G3)
10-41
These results are very encouraging in the sense that 1) a clear resonance pattern can be established for the good parts and 2) clear resonance differences can be observed between the good and bad part Spectra comparisons for all the other parts are processed and stored in Exceltrade format They show the same trends as discussed above
Statistical Data Analyses with Test Statistics This section summarizes the preliminary results of a statistical data analysis using the resonance spectra measured for the adhesively bonded hat sections The problem was formulated as a classic discrimination problem First the spectra for all the bonded hat sections are used to establish the test statics for the bonded hat section population The detection statistic is expressed in a weighed sum of the spectrum
D(P) =
with the weights determined by the means of the good and debond samples
The detector is produced by thresholding the test statistic T That is if D(P)ltT then classify the part as good and if D(P)gtT then classify the part as bad The threshold value T is set to produce a specific false call probability for detection Practically speaking the wider the range of effective T the better the test statistic
The mathematical details of the procedures for this statistical approach are summarized in Sun et al (2009) Figure 5 shows the receiver operating characteristic (ROC) curve for the good parts versus the debond part using this test statistic The ROC curve is a statistical tool to display all possible probability of detection (POD) versus false call probability (FCP) values that can be achieved by the inspection method Different POD and FCP performance is achieved by varying the detection threshold of the test statistic
For example if T is set at 1100 as shown in Figure 5 then the POD of the debonded parts approaches 10 and the false call probability of the good parts is almost 0 The results shown in Figure 5 clearly indicate that a threshold value T can be established such that the good partscan be distinguished from the bebond parts without ambiguity
10-42
Figure 5 ROC curve of the hat section population
The conclusions from these statistical data analyses are
bull For the population of parts investigated in this study it is possible to discriminate between good and debonded parts with little misclassification error
bull The good part populations however are very homogeneous and probably are not typical of production line parts
bull The debonded parts differ from the good parts significantly
bull Defects result in complex changes to the resonance frequency spectra
Conclusions The ability to use RI for detecting lack of bonding andor subsizedmissed spot welds in an automotive BIW has long been desired The RI technique is quick and very sensitive making it an ideal choice in production environments This concept feasibility project set out to determine if it is feasible to accomplish this goal The results in this study clearly demonstrate that
1 RI is not effective in detecting lack of bonding in a fully bonded panel or strip due to the attenuating effects of the adhesive layer
2 For the bonded hat sections and spot welded strips it is possible to discriminate between good and debonded parts with little misclassification error based on the resonance spectra
3 Defects result in complex changes to the response frequency spectra spectra for the debonded parts differ from the good parts significantly
The gaps and limitations of the current study are as follows
1 The good part populations are very homogeneous and probably are not representative of production line part-to-part variations
2 A larger population of good parts is needed for developing a more accurate algorithm andtraining
3 Production-level part-to-part variations need to be considered in developing the detection algorithm
10-43
4 Effective and consistent means of part excitation must be established
5 Algorithms for inverse mapping must be developed such that given a resonance spectrum the possible location of the lack of weldbonds can be identified
6 These gaps and limitations should be the focus of the next phase of study in evaluating the effectiveness of this technique in detecting production-level BIW parts
References 1 1 X Sun JA Carpenter and AD Yocum ldquoConcept Feasibility of Global QA of Joining Technology for Automotive Body-in-White (BIW)rdquo US-DOE Automotive Lightweighting Materials FY2008 Annual Progress report
2 2 X Sun C Lai P Heasler MT Smith and M Good Technical Report - Concept Feasibility of Global QA of Joining Technology for Automotive Body-in-White (BIW) Pacific Northwest National Laboratory Richland WA PNNL-18838 September 2009
10-44
F Reliability Tools for Resonance Inspection of Light Metal Castings
Principal Investigator Martin JonesNondestructive Evaluation Laboratory Ford Motor Company35750 Plymouth Road Livonia MI 48150 (313) 805-9184 e-mail mjone147fordcom
Technology Area Development Manager William Joost(202) 287-6020 e-mail williamjoosteedoegov
Contractor United Sates Automotive Materials Partnership (USAMP1)Contract No DE-FC26-02OR22910
Objective bull To ensure the structural integrity of light metal castings by satisfying the need for rapid reliable in-line nondestructive evaluation (NDE)
bull To develop a set of tools for resonance (acoustic) inspection (RI) that increases its reliability and robustness
bull To develop a set of software tools that can predict the probability of detection (POD) for a discrepancy given its type size orientation and location when using RI This set includes tools to predict accurately resonance frequencies in the absence of discrepancies frequency shifts due to discrepancies the normal frequency variability and robust sort modules
bull To test the accuracy of the models on several commercial castings and to collect data on the time manpower and cost associated with heuristic and physics-based methods
bull To develop standard procedures to implement RI for production components and to ensure the accuracy repeatability and traceability of the inspections
bull To research methods that may allow measured frequency shifts to determine the location size and type of discrepancies
Approach including industrial partnercollaborator and path to technology transfer and commercialization bull Working with several casting vendors make castings with a range of common discrepancies that can be quantified for each discrepancy type These castings will be resonance inspected and then measured for strength to provide an RI-strength correlation
bull Working with RI system vendors collect resonance spectra for the castings and develop sort modules using current heuristic methods
bull Working with finite element model (FEM) experts create scalable models for the discrepancies and test their accuracy for predicting RI frequency shifts
bull Working with an acoustic system integrator build an integrated work bench that allows RI to be evaluated beginning with only the CAD model and strength requirements of a part This will use FEM to predict the resonances predict POD for discrepancies and optimize sort modules
10-45
Milestone Metrics and Accomplishments
bull Commenced project and selected project vendors
bull Designed and resonance modeled a tensile bar that will be used to calibrate RI sensitivity to material strength
bull Cast several batches of cylinders for the tensile bars with controlled levels of shrink porosity
bull Collected and resonance inspected discrepant production castings from two different casters
bull Translated ASTM E155 radiographic data2 into physically dimensioned discrepancy sizes
bull Began design of finite element program that will optimize selection of inspection resonance frequencies and predict the probability of detection
bull Drafted standardized process flow chart for developing RI plans for new parts
bull Conducted a workshop on the need and requirements for a new acceptance standard for RI in production environments and developed an outline for the standard
Future Direction bull During the next year tensile bars with varying levels of porosity crack size and oxide inclusions will be cast machined resonance inspected tomographed pulled and micro-characterized
bull The results from the tensile bars will give sensitivity response curves and provide details to develop finite element models of the discrepancies
bull Traditional heuristic inspection plans will be developed for the tensile bars and the twoproduction castings These will provide a baseline to compare with the physics-based predictions
bull The framework for the physics-based FEM model will be coded and tested
bull A draft standard for production resonance inspections is to be completed
Introduction There are many automotive castings that are either safety or performance critical to the vehicle and require 100 inspection with extremely high requirements for the confidence of reliability These include many chassis and powertrain components Usually these have complex shapes and present extremely difficult inspection problems even with multi-view x-ray systems or surface-only inspections such as dye-penetrants
Resonant (acoustic) inspection (RI) offers unique capabilities for these inspections Sound in the range of 100 to 100000 Hz can readily penetrate small to very large castings and is sensitive to heat treatment porosity cracks and at least some oxide inclusions Resonance inspection also has significantly lower capital and piece costs than either radiographic testing(RT) or fluorescent penetrant inspection (FPI) In fact resonance inspection is already used for 100 inspection of many castings such as knuckles rocker arms master cylinders and brake calipers Figure 1 shows a schematic representation of a resonance inspection To date these resonance inspections have been based on heuristic sort modules Sets of good parts and of
10-46
Fig 1 Schematic representation of aresonance inspection
Figure 2 Schematic comparison of prior heuristic sort modules with new physics-based
approach
discrepant parts are used to select a set of inspection resonances (acoustic frequencies with associated frequency window) and to build sort rules that can separate the two sets of parts correctly (see Figure 2)
GOOD PARTS
BAD PARTS
Sort Module
Extract Resonance Frequencies
Fig 1 Schematic representation of a resonance inspection
Figure 2 Schematic comparison of prior heuristic sort modules with new physics-based approach
Despite these successes resonance inspection has not been universally adopted for three sets of reasons
1 The sensitivity of a given resonance inspection to a particular size discrepancy in a given location has been generally unknown Rarely has the sensitivity been directly measured even for simulated discrepancies such as drilled holes or saw cuts Nor can the sensitivity be estimated even by experts in the field The physics of the resonance problem have been very underdeveloped compared with radiographic or ultrasonic inspections
10-47
2 The second set of reasons involves the robustness of the inspection to allowed part variations Castings of a part are almost always made with several cavities in several different molds In addition to initial mold variations the molds will experience wear as many parts are cast The resulting castings will have small dimensional and processing condition variations Frequently heuristic sort modules must be rebuilt and re-verified as more molds and cavities are brought into production leading to uncertainty reduced reliability down time and major expense
3 There is not currently a resonance inspection standard that establishes a traceable inspection that can be used to support the reliability of a given inspection
This project is designed to address each of these sets of problems In general terms the project is aimed at replacing the current heuristic approach with a priori or physics-based tools as seen in Figure 2 The projectrsquos deliverables are
1 Standardized procedure for RI in production
2 Integrated tools to predict probability of detection (POD) to critical defects
3 Software tools to create sort modules
4 Evaluate ability to identify anomaly type size and location from RI data
This project builds on the NDE701 project that demonstrated the technical feasibility of using FEM to accurately predict the resonance spectra of complex shapes such as front knuckle castings3 This new development project was approved in March of 2009 but the first purchase orders were not approved until September 2009 This report covers the progress that has been made on Tasks 1 to 4 during this period
Integrated tools for POD to critical defects This task is targeted at creating accurate probability of detection (POD) predictions for resonance inspection of the principal casting discrepancies The discrepancies to be included are shrink porosity cracks and oxide inclusions To predict the POD there are three essential ingredients 1) the sensitivity of the response to the size of the discrepancy for RI the response is the frequency shift of a resonance due to the discrepancy 2) the noise in the frequency shifts due all sources these include measurement error (lt1 part in 10000) and resonance variability due to acceptable material variation (typically 1 part in 1000) and 3) the sort module selected
1 Creating discrepancies
To determine the RI sensitivity (ie frequency vs discrepancy size response) a set of simple samples with well-characterized discrepancies are being cast These discrepancies will first be non-destructively inspected especially by computed tomography and resonance inspection They will then be tensile tested to relate the effect of the discrepancy on the strength Post facto the discrepancy revealed by the tensile test will be analyzed with metallographic fractographic and micro-hardiness measurements These measurements will then be used to create finite element models of standard scalable discrepancies for shrink porosity cracks and oxide inclusions
The simple shape selected for the discrepancy castings is a modified ASTM B577M5 tensile bar (see Figure 3) cast from A356 and given a T6 heat treatment Tensile strength was chosen as the strength characterization since it can be run quickly and has been correlated to discrepancy size previously (Reference) A sample with a relatively large gauge size (125 mm dia) was selected to make the RI simpler and to allow for variations in the locations of the discrepancies within the castings The standard tensile bar was modified by removing small areas of the ends to make it asymmetric this breaks modal degeneracies and simplifies the mode assignment
10-48
Figure 3 RI tensile bar design with 125 mm diam gauge section
Figure 3 RI tensile bar design with 125 mm diam gauge section
Several different designs of the tensile bar were evaluated to ensure the design has sufficient asymmetry The designs were tested using the FEM methods developed during the NDE701 project There are three classes of modes associated with increasing stiffness transverse bending torsional and longitudinal stretching Examples of the first two modes of each type are shown in Figure 4 The predicted frequencies below 100 kHz are shown in Figure 5 The bending modes would normally be doubly degenerate with deflections at right angles to each other The mode splitting between these bending modes induced by the bar asymmetry is indicated in the graph and ranges from 1 to 400 Hz
Figure 4 Representative resonance modes calculated for the modified ASTM B577 tensile bar Only the lowest two modes of each class are included Only one of the twonearly degenerate bending modes is included
Figure 5 Predicted resonance frequencies for modified ASTM B577 tensile bar grouped by mode type
10-49
Figure 7 X-ray radiographs of porosity in two cylindrical castings
A series of 54 cylindrical castings with three different diameters have been cast at the Chrysler Technical Center The lower pattern used to make the mold for the sand castings is shown in Figure 6 These castings include both low and high shrinkage porosity samples
Figure 6 Lower pattern used to make cylindrical castings for tensile bars
The castings have been x-rayed in two orthogonal views to establish the discrepancy size and location Figure 7 shows illustrative radiographs of a good casting and a casting with a discrepant amount of shrink porosity The shrink porosity includes both cavity and sponge types
Figure 7 X-ray radiographs of porosity in two cylindrical castings
In the next round of castings oxide inclusions will be created These will include both gross dross forms and film oxides
To produce tight cracks some of the good castings will be cycled at low tension in order to produce high-cycle fatigue cracks It is planned that the cylinders will first be circumferentially notched to confine the crack to the middle of the bar Then a piezo-stack running at roughly 1000 Hz will be used to fatigue the bars The cracks will be grown to varying depths After crack growth the outer surface will be machined away to remove the notches and define the gauge section
2 Discrepancies found in production
In addition to the experimental discrepancies described above production foundry discrepancies are being pulled for two parts produced by two of our casting participants Both castings are produced with multi-cavity permanent mold processes These discrepant castings are found by
10-50
normal quality assurance using x-ray fluorescent particle and visual inspections This is a difficult task since discrepant castings are made infrequently These are all resonantly inspected Some of these will also be machined into tensile bars and tested for comparison with the experimental castings
3 Calibrating discrepancy sizes
Safety critical castings such as some chassis components are typically 100 radiographically inspected following ASTM E155 or ASTM E2422 These standards use actual cast blocks that have a range of sizes for several discrepancy types (gas holes shrink cavity porosity shrink sponge porosity high and low density inclusions) For each discrepancy type the castings have been subjectively ranked or given a grade depending on the severity (size) of the discrepancies Only by long experience has it been determined what radiographic grade is needed for each component Part of these short comings arises because the sizes of the discrepancies in the radiographic standards have not been published
In the USAMPAMD ldquoDesign and Product Optimization for Cast Light Metals Projectrdquo completed in 2001 there was an activity at Lawrence Livermore National Lab to re-radiograph the ASTM E155 castings and to analyze those radiographs for discrepancy size For the discrete discrepancies (gas holes shrink cavities and inclusions) the LLNL analysis included the projected area of the discrepancies the maximum feature size and an effective depth (from the calibrated attenuation measurements) Each of these measurements gives a different characteristic size
The final step to reduce this information to a single dimension or size was never completed We have re-analyzed this data for each of the different casting types for the discrete defects to determine if there is a consistent size that can be associated with each grade Using either a circle equivalent diameter or a sphere equivalent diameter gave similar results It was concluded that the area equivalent diameter is the most accurately measured property using ASTM E155 and provides the best scalar representation of the discrepant classes
Finite element sort modules To have a useful physics-based tool it is necessary to integrate all the physics into a software tool bench This will begin with the part design (CAD model) and the engineering requirements(peak loads and associated locations) These inputs then must be converted into finite element models for the part and for discrepancies that would limit the performance of the part
These inputs and the other elements of the processing are shown schematically in Figure 8The important physics that will be included are the sensitivity to discrepancy type size and location that was described above efficient means to predict the frequency variability and the efficient means to optimize the sort module and to include process compensation Process compensation is the inclusion of some resonance lines to compensate for allowable geometry and material property variations
These tools will be built within a commercial finite element environment maximizing the use of existing tools that are available for modal analysis
10-51
Figure 8 Inputs and data processing for the proposed FEM tool to create physics-based RI sort modules
Figure 8 Inputs and data processing for the proposed FEM tool to create physics-based RI sort modules
Standardized Procedures The last task of the project is produce a standard that will lead to accurate repeatable and traceable inspections in the production environment There already exists one standard6 for resonance inspection but it is mostly a generic guide to the technology There have been several OEM procedures drafted that address implementation procedures These have been synthesized into a standard process flow chart This will be used for the creation of sort modules for the three castings being tested in the project
Despite these documents there is a gap in the available standards and procedures relevant to making production inspections reliable repeatable and traceable This gap includes the consistent use and documentation on 1) the inspection procedure used 2) measurements on the repeatability and reproducibility 3) the numbers and types of discrepancies used to measure the accuracy of the final sort module as well as the error rates for this validation setand 4) preservation of results from production inspections
In June 2009 a workshop was held to review the state of RI standardization and to propose the areas to be included in a new standard The workshop concluded that this document is an essential element for productionizing RI
Conclusions Resonance inspection is a promising technology for ensuring the quality of light metal castings that require high reliability This project addresses three of the technical barriers limiting the implementation of RI These include the need for probability of detection predictions for given inspections the need for more reliable sort modules and the need for standard traceable inspection procedures When completed this project will deliver tools that are or are very close to being commercially ready
10-52
PresentationsPublicationsPatents Dasch C X Sun C Lai J Saxton G Stultz G Palombo C Grupke G Harmon L Ouimet D Simon and M Jones 2008 ldquoTowards Quantitative Resonance Inspection Resonance Mode Identification and Modelingrdquo Review of Progress in Quantitative NDE
ldquoNDE 901 Enhanced Resonance Inspection for Light Metal Castingsrdquo 2009 AMD Offsite Southfield MI October 13
C Lai X Sun C Dasch G Harmon and M Jones ldquoQuantifying Resonance Inspection with Finite-Element-Based Modelingrdquo submitted to J Sound and Vibration Oct 2009
References 1 Denotes Project 701 of the Nondestructive Evaluation Working Group of the United States Automotive Materials Partnership (USAMP) one of the formal consortia of the United States Council for Automotive Research (USCAR wwwuscarorg) set up by Chrysler Ford and General Motors to conduct joint pre-competitive research and development
2 ASTM B155-05 ldquoStandard Reference Radiographs for Inspection of Aluminum and Magnesium Castingsrdquo
3 USAMP Project NDE701 ldquoEnhanced Resonance Inspection for Light Metal Castingsrdquo
4 See for example A Miglioriand J L Sarrao ldquoResonant Ultrasound Spectroscopyrdquo (John Wiley amp Sons 1997) or J He and Z Fu ldquoModal Analysisrdquo (Butterworth-Heinemann 2001)
5 ASTM E577M ldquoStandard Test Methods of Tension Testing Wrought and Cast Aluminum- andMagnesium-Alloy Productsrdquo
6 ASTM E2001-08 ldquoStandard Guide for Resonant Ultrasound Spectroscopy for Defect Detection in Both Metallic and Non-metallic Partsrdquo
10-53
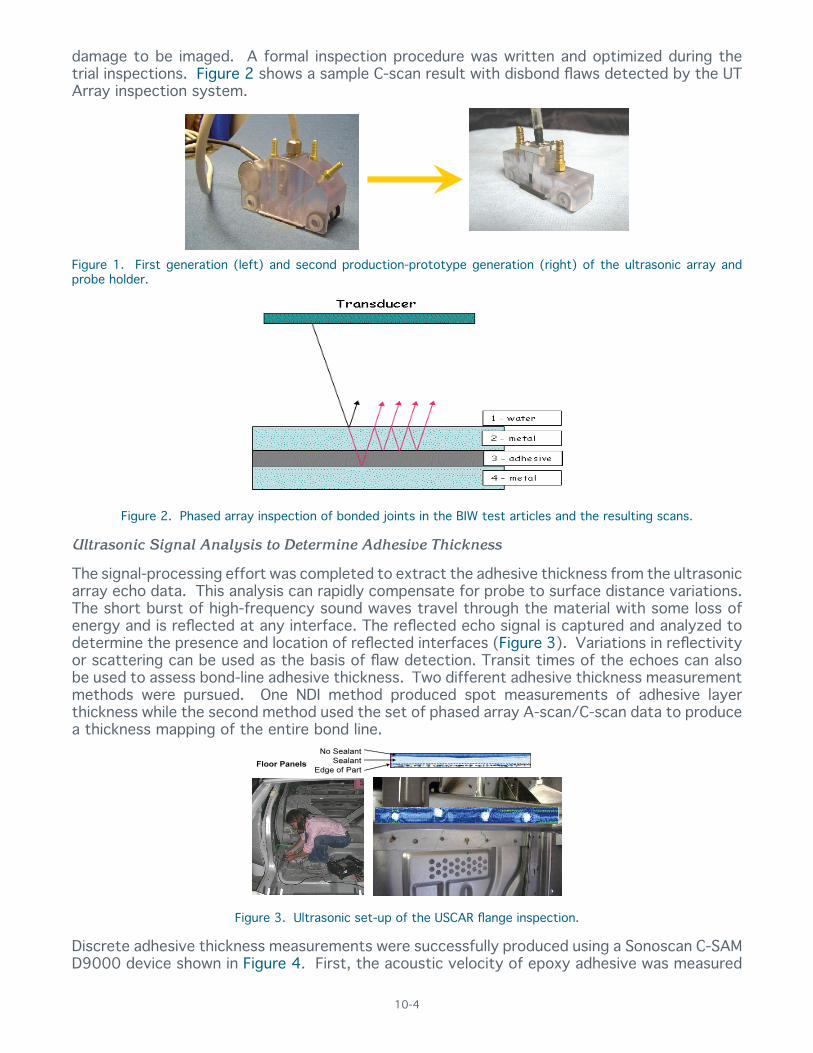
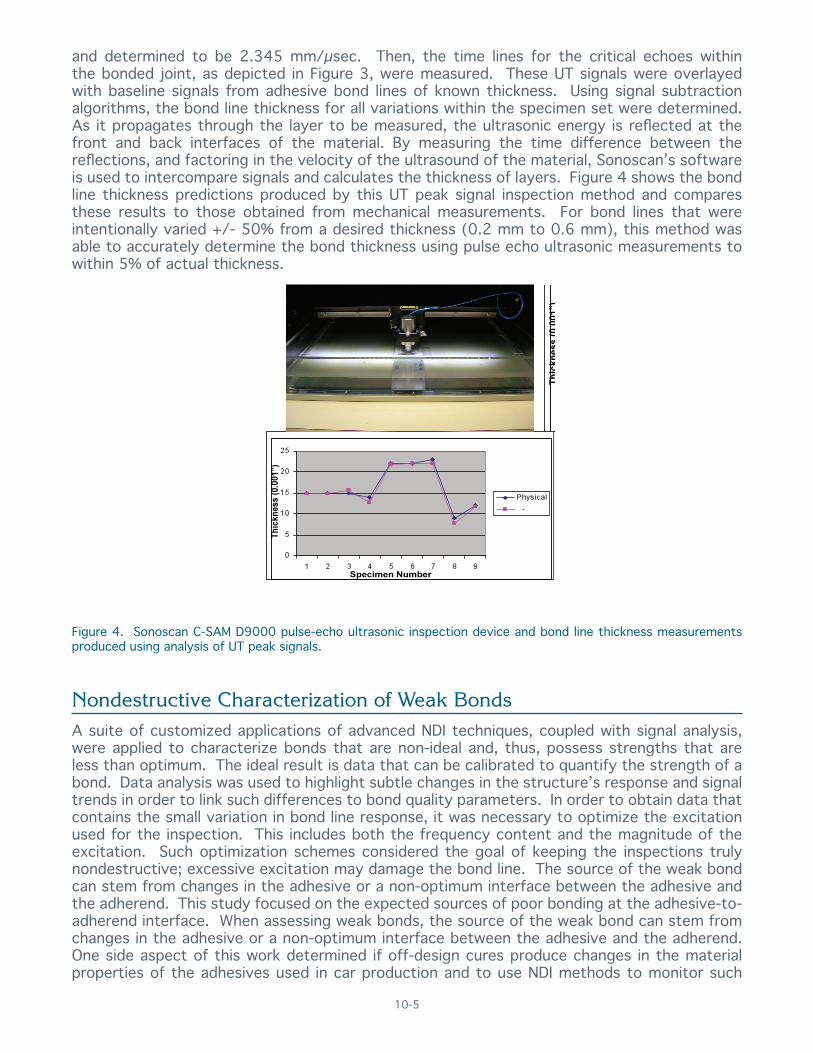
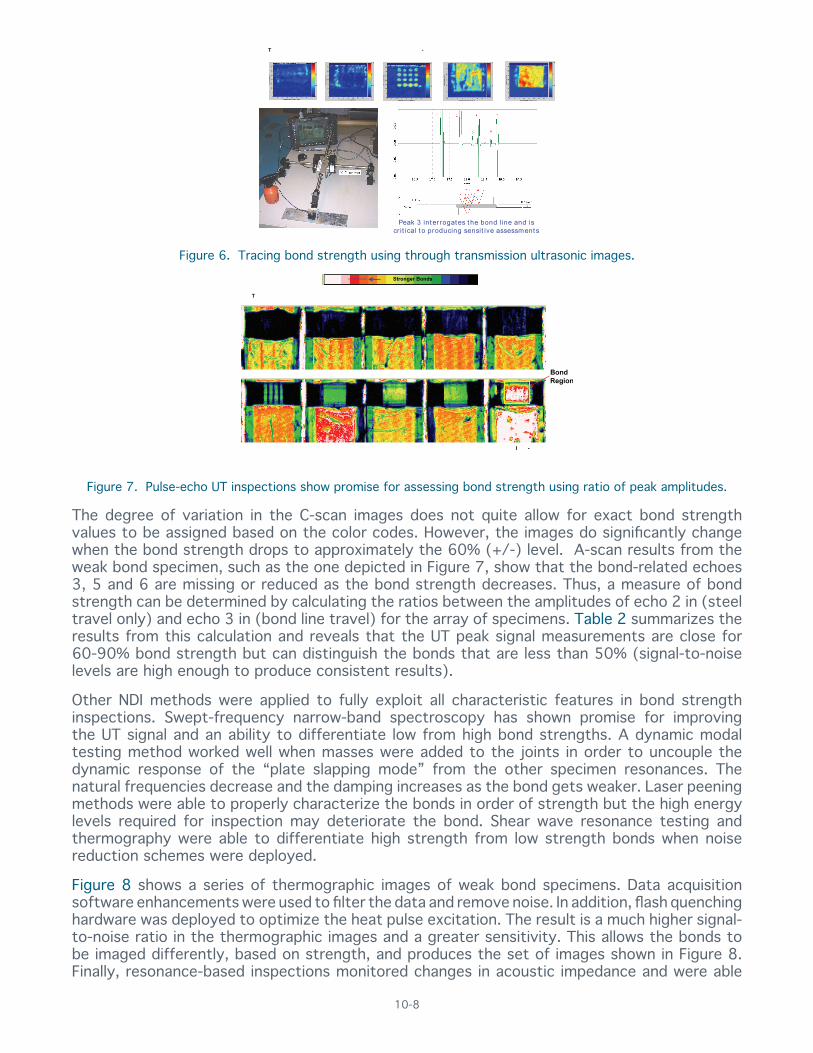
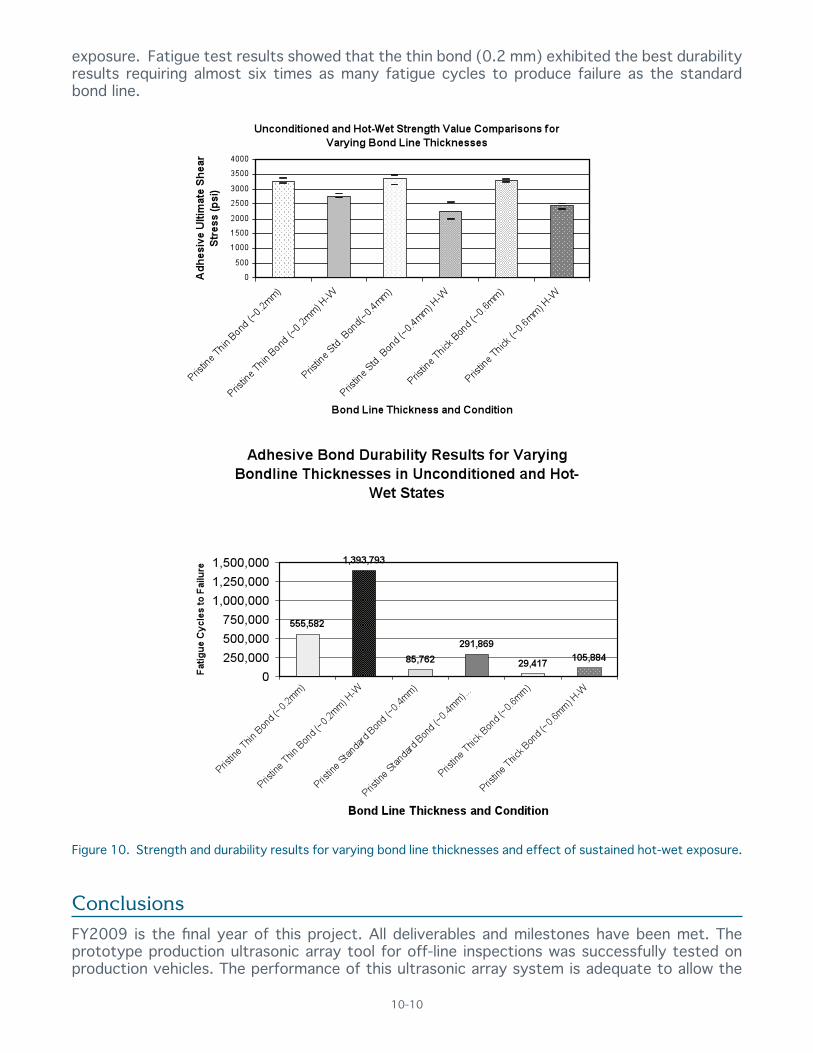
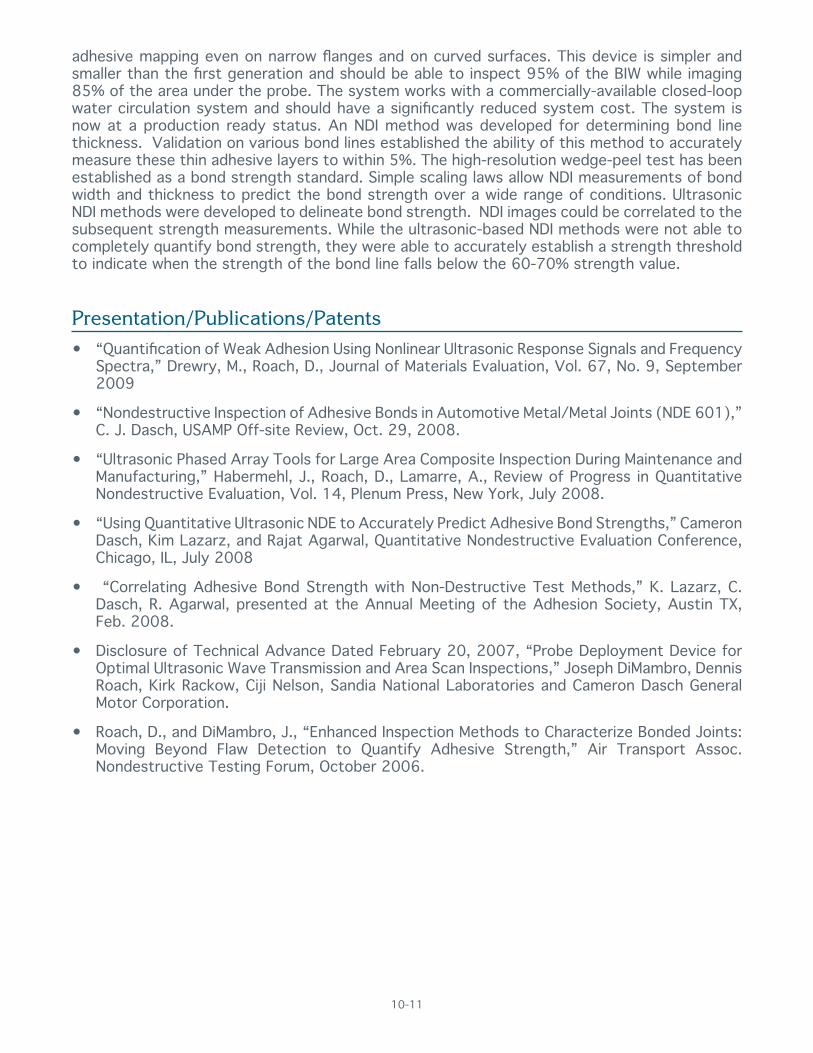
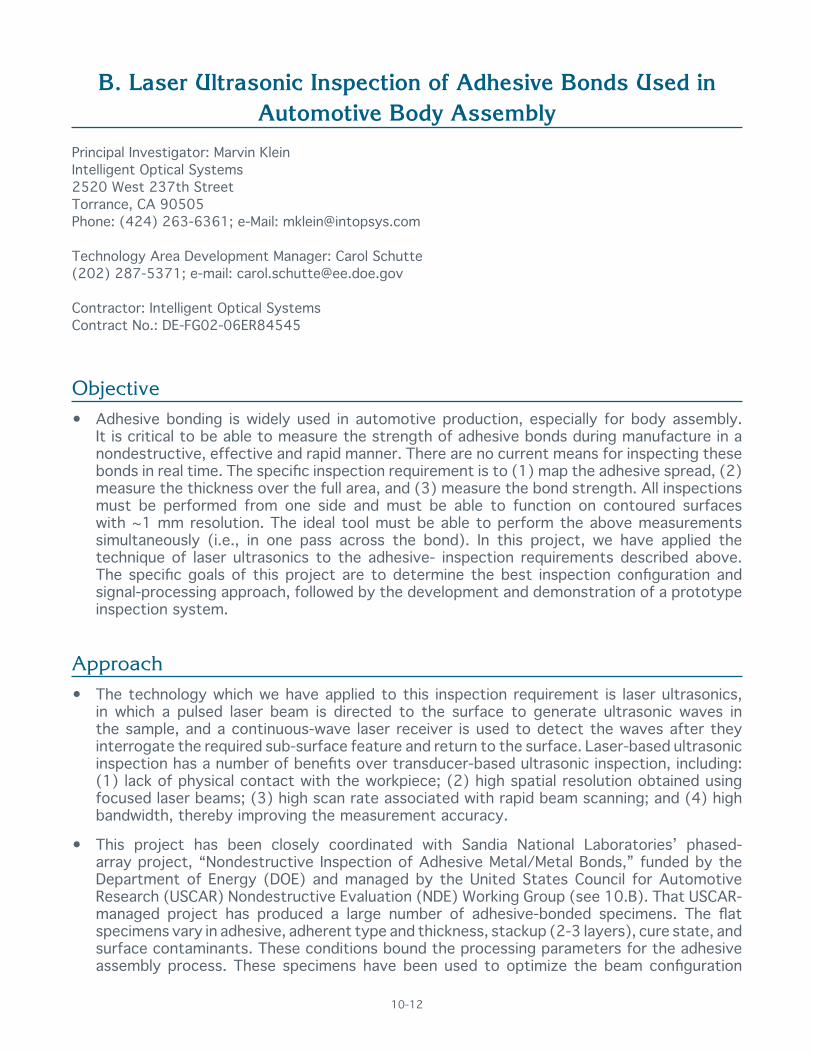
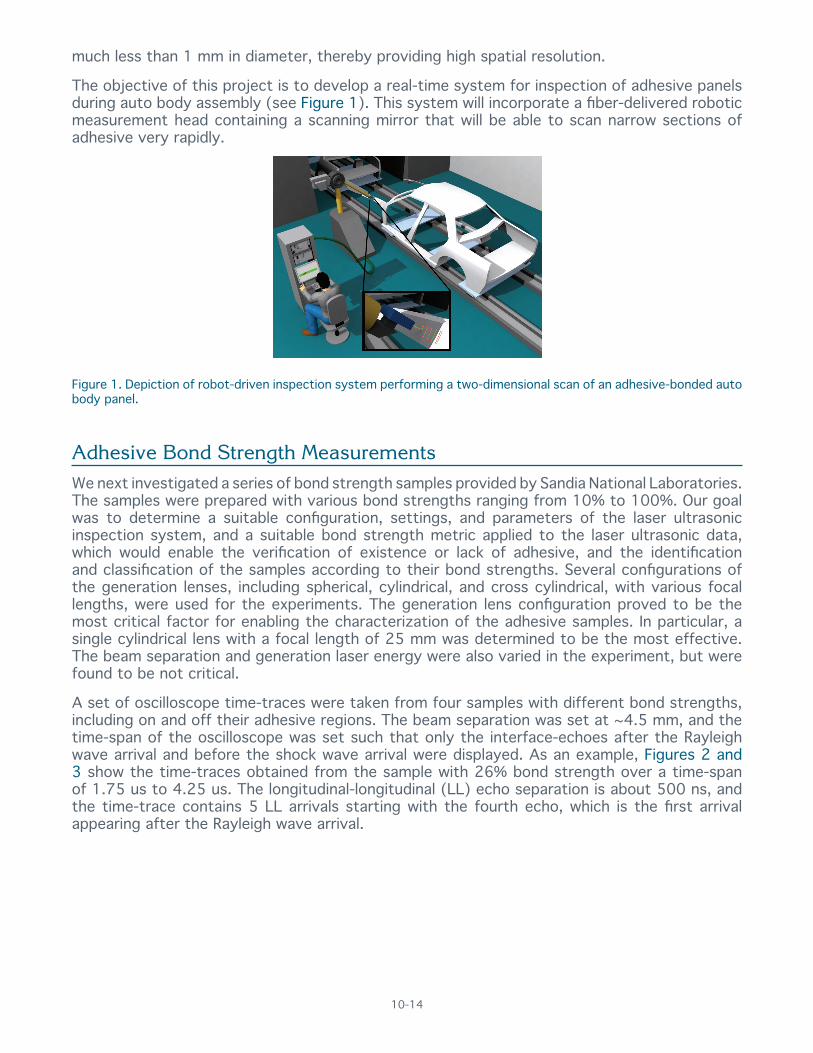
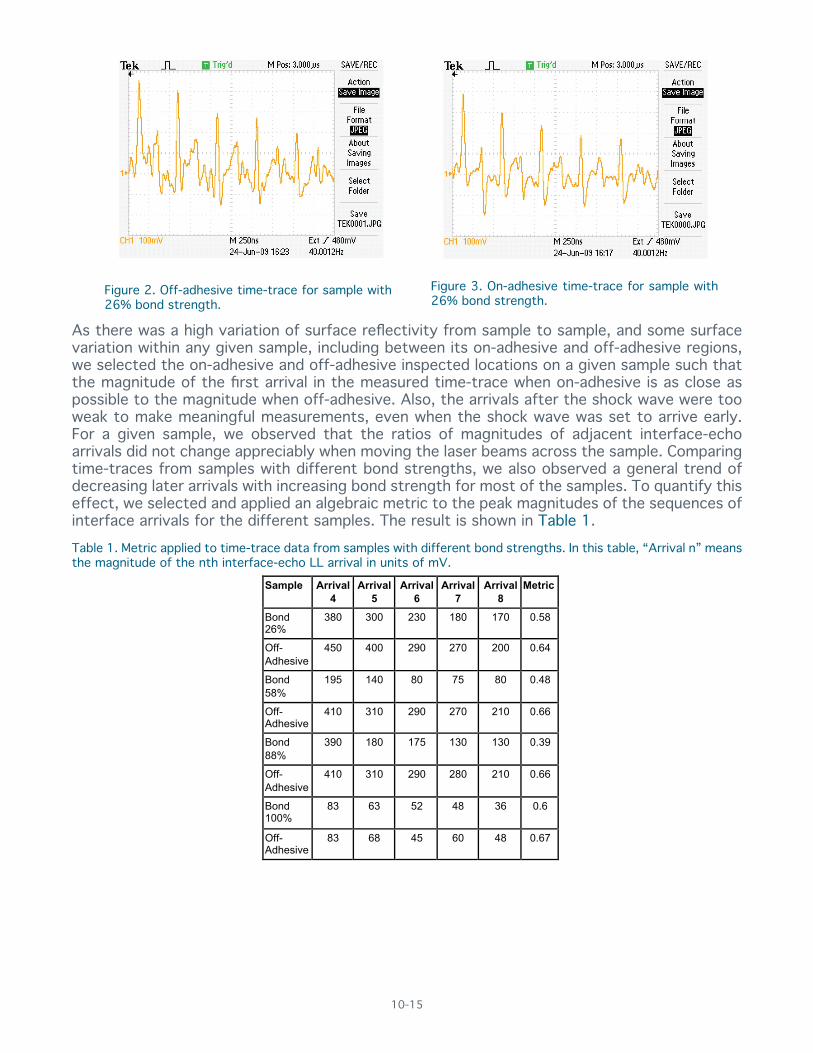
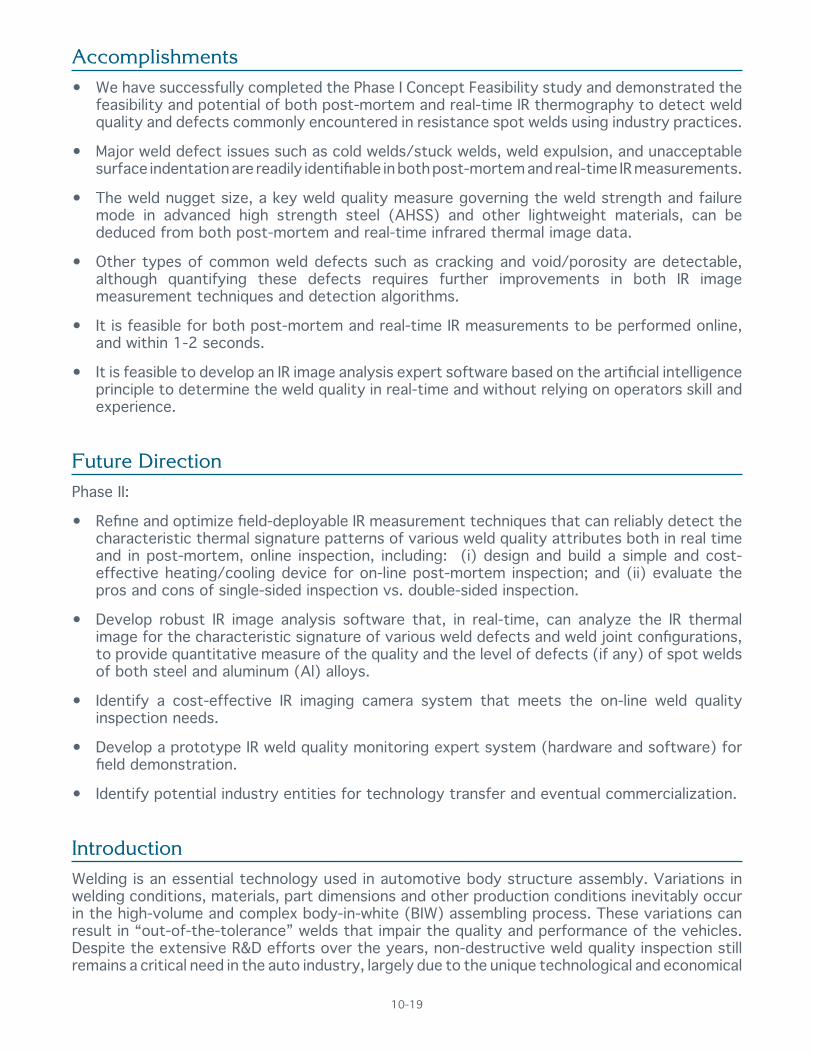
Accomplishments
bull We have successfully completed the Phase I Concept Feasibility study and demonstrated the feasibility and potential of both post-mortem and real-time IR thermography to detect weld quality and defects commonly encountered in resistance spot welds using industry practices
bull Major weld defect issues such as cold weldsstuck welds weld expulsion and unacceptable surface indentation are readily identifiable in both post-mortem and real-time IR measurements
bull The weld nugget size a key weld quality measure governing the weld strength and failure mode in advanced high strength steel (AHSS) and other lightweight materials can be deduced from both post-mortem and real-time infrared thermal image data
bull Other types of common weld defects such as cracking and voidporosity are detectable although quantifying these defects requires further improvements in both IR image measurement techniques and detection algorithms
bull It is feasible for both post-mortem and real-time IR measurements to be performed onlineand within 1-2 seconds
bull It is feasible to develop an IR image analysis expert software based on the artificial intelligence principle to determine the weld quality in real-time and without relying on operators skill and experience
Future Direction Phase II
bull Refine and optimize field-deployable IR measurement techniques that can reliably detect the characteristic thermal signature patterns of various weld quality attributes both in real time and in post-mortem online inspection including (i) design and build a simple and cost-effective heatingcooling device for on-line post-mortem inspection and (ii) evaluate the pros and cons of single-sided inspection vs double-sided inspection
bull Develop robust IR image analysis software that in real-time can analyze the IR thermal image for the characteristic signature of various weld defects and weld joint configurations to provide quantitative measure of the quality and the level of defects (if any) of spot welds of both steel and aluminum (Al) alloys
bull Identify a cost-effective IR imaging camera system that meets the on-line weld quality inspection needs
bull Develop a prototype IR weld quality monitoring expert system (hardware and software) for field demonstration
bull Identify potential industry entities for technology transfer and eventual commercialization
Introduction Welding is an essential technology used in automotive body structure assembly Variations in welding conditions materials part dimensions and other production conditions inevitably occur in the high-volume and complex body-in-white (BIW) assembling process These variations can result in ldquoout-of-the-tolerancerdquo welds that impair the quality and performance of the vehicles Despite the extensive RampD efforts over the years non-destructive weld quality inspection still remains a critical need in the auto industry largely due to the unique technological and economical
10-19
constraints of the auto production environment Any weld quality inspection technique must be fast cost-conscious low in false rejections and not interfere with the highly automated weldingassembly process
Today all OEMs primarily rely on destructive testing to ensure the integrity of critical structure members Welded components are torn apart at predetermined time intervals (usually once per shift) to ensure the weld quality The destructive testing is costly and labor intensive As the teardown test cannot be done too frequently the cost risk associated with reworking or scrapping the defective welded parts made between teardown tests is even higher Furthermore the teardown inspection techniques are less effective for advanced high-strength steels (AHSS) aluminum and other lightweight materials As the industry moves toward body structures with more AHSS and aluminum the post-mortem teardown inspection for weld integrity will be less reliable and more difficult and costly potentially discouraging the implementation of these lightweighting materials
In 2007 USAMP sponsored a study to assess the current status for in-line resistance spot welding (RSW) control and evaluation systems and to determine their application potential for lightweight sheet materials [1] After extensive survey and communications with potential NDE suppliers and developers the study concluded that ldquono economically reliable method exists today to inspect resistance spot welds at production rates and the only technical needs identified in the project for further development consideration were in infrared thermography technologyrdquo
This project aims to develop a field-deployable on-line weld quality monitoring method and a prototype system based on state-of-the-art IR thermography A distinct advantage of IR thermography as a NDE tool is its non-intrusive and non-contact nature making the IR especially attractive in hIR thermography detects surface temperature changes due to geometric discontinuity or inhomogeneity An ldquoout-of-tolerancerdquo weld introduces a geometric change that would produce a perturbation of surface temperature profile from that of a normal weld In theory such temperature changes can be detected by IR thermography In reality detection of an anomalous weld by temperature change depends on many factors that can be grouped into four major categories (1) factors inherent to the weld such as the heat flow characteristics of the weld and the size orientation and location of the anomalous weld (2) factors causing surface temperature changes unrelated to the presence of weld quality anomaly (such as emissivity changes due to changes in surface condition reflection of other heat sources) (3) the sensitivity spatial resolution and other attributes of the IR measurement system and (4) the detection algorithms ndash the ability to critically and effectively process the IR signals and positively identify an abnormal weld when present
IR for weld quality inspection in the auto assembly environment has been explored in the pastmostly post-mortem (ie after weld is made and as a separate step in manufacturing) Typically a short-pulse heating via xenon flash light (in a few milli-seconds) is applied to the surface of a spot weld Temperature changes with time were then recorded by an IR camera and further processed to correlate to the weld size and other attributes of resistance spot welds Such an approach had varying degrees of success in the laboratory environment and limited applications in other industries However applications in the automotive industry have been unsuccessful largely due to a critical drawback that cannot be implemented in the high-volume production line which is the prerequisite of painting the weld surface to eliminate the surface reflection and other environment interferences [2]
1 Sun X Charron W Cerjanec D Bohr J and Cleaver T ldquoAMD 605 In-Line Resistance Spot Welding (RSW) Control and Evaluation System Assessment for Light Weight Materials (Final Report)rdquo August 20082 Communications with Weld NDE Subcommittee Automotive Materials Partnership Steering Committee USCAR 2004
10-20
Working with industrial partners we recently demonstrated several novel concepts and approaches that would overcome some of the key technical barriers inhibiting the use of IR thermography as an effective weld NDE tool in the automotive assembly line A unique advantage of the Oak Ridge National Laboratory (ORNL) approach is the potential for real-time weld quality detection as the weld is being produced This would offer the opportunity of real-time weldingprocess feedback for in-process adjustment and control [3]
This project builds upon recent work and consists of a two-phase gated RampD effort to further advance the IR thermography based weld quality monitoring and control technology to a stage that can be deployed in high-volume auto production environment In this project a two-phase gated approach was adopted to develop an IR based weld quality inspection technology that overcomes the key technical barriers of the past Phase I is a 12-month Concept Feasibility study to establish the technical basis and demonstrate the ability of detecting various types of defects (cold welds cracking expulsion etc) and the critical weld quality attributes (weld size and indentation) in resistance spot welds produced using industry welding practices and without any surface treatment or preparation Since it has been determined to be warranted more comprehensive research and development program will be now be performed in the second phase (Technical Feasibility) toward eventual field demonstration of the technology
The RampD in Phase I has been primarily carried out at ORNL with support from the industry collaborators An industry technical advisory committee has been formed for this project consisting of representatives from Chrysler Ford General Motor and ArcelorMittal
Following the recommendations from OEM material joining and NDE experts and relevant USAMP AMD task teams the project (Phase I and Phase II) includes tasks on both real-time weld quality monitoring and post-mortem weld quality auditing The real-time monitoring is performed as a weld is being made whereas the post-mortem auditing is performed as a separate step after welding The two different techniques are needed to address different application situations Both techniques must be suitable for on-line inspection
Phase I consisted of three major milestones (1) producing a limited set of controlled resistance spot welds having various types and levels of weld quality and defect attributes and characterizing these weld attributes through destructive examination (2) designing and performing IR measurements of these welds to obtain their ldquothermal signaturesrdquo (3) IR data analysis and processing based on heat flow simulation to develop the correlation between the characteristic signature of IR images and the weld quality attributes
Resistance Spot Weld (RSW) Samples for IR Thermography In Phase I a set of steel resistance spot welds were made having the typical range of weld defects and quality attributes known to potentially influence the structural performance of the spot welds in automotive body structures These attributes are listed below in the order of decreasing importance per the industry technical focus committee
3 H WangZ Feng and PS Sklad (2004) ldquoInspection and Evaluation of Laser Welds for Transit Busesrdquo Thermosense XXVI SPIE Defense and Security Conference Orlando FL
10-21
bull Weld with no or minimal fusion
bull Cold or stuck weld
bull Weld nugget size
bull Weld expulsionindentation
bull Weld cracks
bull Weld porosity
As a concept feasibility study all welds were made on hot-dipped galvanized dual phase 780 MPa (DP590) steel of 185mm nominal thickness in the common two-stack configuration All welds were made at the Welding Lab of ArcelorMittalrsquos research and development (RampD) Center in East Chicago Indiana For each welding condition a total of six replicate welds were made Two of the six replicates were sectioned destructively to determine the weld nugget size type and degree of weld defects The other welds of the same set were used in IR thermography measurements In addition extensive IR measurements were also conducted on one of the sectioned welds before it was sectioned It was found those controlled welds made by ArcelorMittal were very consistent for a given welding condition This greatly facilitated the development work in Phase I
Table 1 summarizes the welds made with different quality attribute Each weld was characterized by its nugget diameter surface indentation type andor extent of defects The weld nugget represents the fused region of the weld and its diameter was determined using an optical microscope from both the cross-sectioned samples and the samples with one of the sheet steels carefully removed by machining and polishing to the faying surface of the weld The table is color-coded The second and third rows represent the welds acceptable in accordance with industry specifications whereas the welds in the other rows are regarded to be ldquoout-of-tolerancerdquo Appearances of representative welds are shown in Figure 1 through Figure 5
Table 1 Weld samples with different weld quality attributes produced at ArcelorMittal RampD
Minimum weld refers to the minimum weld nugget diameter or button size perAWS specification Maximum weld refers to the weld obtained using welding conditions just belowthe explosion limit
10-22
Figure 1 Cross-section view of a stuck weld with very small fused weld nugget
Figure 2 Cross-section view of a weld with acceptable weld nugget size and no defect
Figure 3 Welds with solidification shrinkage voids as revealed (a) in cross-section view and (b) by machining off one of the steel sheets
Figure 4 Cross-section view of a weld with expulsion
Figure 5 Cross-section view of a weld with expulsion cracking and surface indentation
10-23
Post-Mortem Inspection
Two types of IR weld quality inspections were studied in Phase I postmortem and real-time In all IR measurements the weld sample surface was in as-welded condition ndash there was no any surface painting cleaning or other treatments Instead the IR images were digitally enhanced during image analysis to minimize the effects of surface conditions (if any) encountered duringeither postmortem or real-time measurements In addition several heatingcooling techniques were tested and evaluated for enhancing the IR image signal to noise ratio
In the post-mortem study the IR measurement was conducted at ORNL on the welds made at ArcelorMittal An external heating (or cooling) source was applied to introduce transient temperature changes in the weld and its surround area An IR thermography camera was pointed to the weld surface to record the surface temperature changes The measurement principle is illustrated in Figure 6
Figure 6 IR weld quality inspection principle (post-mortem approach)
The recorded IR images were then analyzed (offline and manually in Phase I) to obtain the characteristic thermal signature changes of the IR images and to relate such signature changes to the weld quality The type of external heating or cooling source and the way it was applied influenced the heat flow in the weld and thereby the sensitivity and accuracy to detect the weld quality attributes In Phase I a total of six different heat and cooling techniques (three heatingand three cooling) were evaluated It was found that one heating technique and one coolingtechnique were particularly promising They both required no physical contact between the coolingheating device and the weld surface The devices are readily available commercially low-cost and highly portable Together with the digital imaging enhancement techniques adopted in this project these two techniques were capable of producing consistently clean signals (high signal-to-noise ratio) that facilitated the IR image analysis and correlation to the weld quality These two promising techniques herein referred to as the ldquoORNL heating or cooling methodsrdquoare under internal review at ORNL for invention filing so details are omitted in this report
The ORNL heatingcooling techniques were capable of producing very consistent results during repeated tests and were able to distinguish major weld quality and defects in the controlled welds as shown in Figure 7 First of all welds with different defects and geometry attributes have highly distinguishable temperature transient profiles More encouragingly the transient temperature curves can be roughly grouped into three distinct groups corresponding to the weld quality The welds with the acceptable quality are in the middle band of the curves The
10-24
welds with unacceptable quality attributes such as stuck welds undersized weld (weld diameter less than the minimum specification by the industry) are clearly distinguishable from those of the acceptable welds The welds with severe expulsion and cracking are distinctively located on the other side of the acceptable welds band
Figure 7 Post-mortem IR intensity curves of the controlled welds with different weld quality attributes generated using the proprietary cooling technique (top) and proprietary heating technique (bottom) For each heatingcooling technique identical IR image measurement condition was used for the welds with different qualitydefect attributes so that the differences in the recorded IR signal were solely from the variations in weld quality The curves are color coded into three different groups corresponding to different weld quality attributes (i) cold or undersized welds (ii) welds within acceptable weld nugget size and minimum defects and (iii) welds with detectable expulsion severe surface indentation andor cracking
Real-Time Inspection Real-time IR inspection studies were performed on-site at ArcelorMittal RampD Center A commercial IR camera (the same one used in the post-mortem study) was brought to the welding lab and used to capture the temperature changes during welding The experimental set-up is shown in Figure 8 where an IR camera was placed near the spot welding head and pointed to the top surface of the spot weld
Figure 8 Real-time IR measurement set up and an IR image showing formation of a surface crack during welding
10-25
The real-time IR measurement utilizes the heat generated during welding and the welding heat flow pattern changes caused by the formation of weld defectsanomalies or variations of weld geometric attributes (weld nugget size and surface indentation) to determine the weld quality as the weld is being produced Examples of the real-time measurement results are given in Figure 9 in which three repeated IR measurements (on three separate welds) were performed for each welding condition It is evident from the figure that the measurements for a given welding condition were highly consistent and therewere definite correlations between the real-
Figure 9 Real-time IR measurements of weld quality attributes Top IR intensity variations as function of time corresponding to different weld quality attributes The real-time measurements were highly repeatable as indicated by three repeats for each welding condition Bottom line profile of IR intensity at a given time shows distinctive patterns associated with different weld quality attributes
time IR signals and the different weld quality attributes for the weld studies in Phase I This was consistent with previous work on laser welding [3] In addition surface cracks formed during welding were clearly visible during real-time IR measurement as shown in the photo shown in Figure 8
Initial Development of an Expert System In Phase I we also worked on a proof-of-concept development of the IR thermal signature analysis expert software for postmortem weld quality auditing This expert software to be fully developed in Phase II aimed at providing reliable and accurate determination of the weld quality from the IR thermal signature measurements (either postmortem or real-time) without relying on the skills or experience of the operator (a major drawback prevented the use of IR inspection in the past) The software was based on the artificial intelligence principle and coded with generic signal pattern recognition routines The initial proof-of-concept version was developed and evaluated with idealized post-mortem IR thermal profiles that were obtained from finite element simulation of the heat flow and surface temperature changes of welds with different nugget size and indentation features under the heating conditions similar to the ORNL heatingmethod developed in Phase I Figure 10 shows the comparison of the prediction of the weld nugget sizes with the target ones It is evident the feasibility of such software for weld quality determination
10-26
Figure 10 Demonstration of the artificial intelligence based expert software for weld nugget size detection (initial version in Phase I)
CostBenefit Analysis Finally we conducted a preliminary rough-order-of-magnitude (ROM) cost analysis of the IR based inspection system The cost analysis included the cost of IR inspection head the cost of robotic system and the cost of labor and operation
The IR inspection head consists of the IR camera heatingcooling system for post-weld inspection and the expert system software According to a major IR camera manufacturer a high performance camera capable of performing the type of full-field IR imaging in Phase I costs about $30K (camera and lens) This would be the upper end of the IR camera It is noted that one of the major activities in Phase II is to refine and optimize the IR signal analysis algorithms to allow the use of low cost toolbox IR camera A low cost IR camera currently cost under $15K and some are under $10K Other IR head costs include heatingcooling device for post-weld inspection (not needed for real-time monitoring) and the expert software Induction heater $8000 Liquid cooling $1000 Software $2000 Therefore ROM cost of the IR inspection head is in the range of $15K to $40K
For on-line automated inspection a robotic system is likely required Since an IR camera only weights a few pounds light duty robotics would be adequate The cost of such systems is in the range of $30K to 50K based on the information from OEMs and robotic manufacturers Therefore the ROM capital cost of the entire IR inspection system would be in the range of $45K to $90K
Since the IR inspection system is highly automated and the expert system provides the visual feedback of weld quality and networked digital record archival it is reasonable to expect that an operator for welding can be doubled for weld quality monitoring In this case the operating cost mostly consists of the cost of running the robotics heatingcooling and periodic inspection calibration or maintenance of the IR camera head From the technology perspective the high labor cost (~$1Myear) in todayrsquos manual destructive pry-check and tear-down can be mostly eliminated The ergonomic and safety issues in todayrsquos destructive inspection are also resolved In addition the automated IR inspection is expected to bring in significant cost savings from the reduced scrap andor rework of defective welded parts associated with todayrsquos infrequent tear-down and pry-check
Finally todayrsquos teardown inspection techniques are less effective for advanced high-strength steels aluminum and other lightweight materials As the industry moves toward body structures with more AHSS and aluminum teardown inspection for weld integrity will be less reliable and
10-27
more difficult and costly potentially discouraging the adoption of these lightweighting materials The IR based NDE technology once successfully developed would be a critical enabler for the widespread use of lightweight materials
Conclusions In Phase I we evaluated approaches combining novel IR system setup and IR signal analysis techniques that have demonstrated the feasibility to overcome the key technical barriers inhibiting IR weld NDE in auto assembly line Both post-weld inspection and real-time detection of weld quality were explored The technical feasibility of IR NDE for weld quality and defect is summarized in Table 2 The post-weld approach was able to detect typical weld defects and determine the nugget size of steel spot welds Furthermore for the first time the feasibility of real-time weld quality detection has been demonstrated Both the post-mortem and the real-time approaches in Phase I required no special treatments of the as-welded or as-received surface ndash a key issue that has hindered previous IR attempts As such we have successfully met the milestones and passed the Technical Gate point set forth for Phase I
Table 2 Feasibility of IR NDE of Weld Quality and Defects
Future Directions
Phase II
bull Refinement and optimization of field-deployable IR measurement techniques
bull User friendly IR image recognition expert software
bull IR weld NDE guideline for selected typical applications
bull Field demonstration and prototype systems
PresentationsPublicationsPatents W Woo ZFeng H Wang CW Chin W Zhang H Xu and PS Sklad ldquoApplication of Infrared Imaging for Quality Inspection in Resistance Spot Weldsrdquo SPIE Defense Security and Sensing Conference April 13-17 2009 Orlando FL
10-28
D Enhanced Resonance Inspection for Light Metal Castings
Principal Investigator Xin Sun Pacific Northwest National LaboratoryRichland WA 99352 (509) 372-6489 e-mail xinsunpnlgov
Technology Area Development Manager William Joost(202) 287-6020 e-mail williamjoosteedoegov
Field Technical Manager Mark T Smith (509) 375-4478 e-mail marksmithpnlgov
Contractor Pacific Northwest National LaboratoryContract No DE-AC05-76RL01830
Objective bull To accelerate the development of rapid and reliable resonance inspection technique in ensuring the structural integrity of light metal castings
bull To assess the capability of modeling approaches in accurately predicting the vibrational mode frequencies along with the variability of those frequencies
bull To quantitatively evaluate the sensitivity of resonance inspection (RI) to anomalies of various types and sizes in various locations of a light metal casting
Approach bull Develop a set of computational tools to enable predictive capability
1 Make current setuptraining time shorter by using computer modeling to simulate response of actual parts and flaws
2 Identify response to critical flaws thereby allowing ldquofaultrdquo to be specified and subsequently fixed (process feedback)
bull Develop computational model to translate materials properties and geometry into predicted frequencies
1 Use a Computer Aided Design (CAD) model or preferably three-dimensional (3D) scanning to provide exact as-is geometry to finite element analysis (FEA) model
2 Generate FEA 3D mesh directly from scanned data
bull Develop numerical algorithms to identify mode shapes for each frequency
1 Identify exact modal shapes for all the resonance frequencies in practical sampling range ie 1 to 80 kilo-hertz (kHz) This is critical in determining what frequency changes correspond to which features in the part
bull Establish sensitivity matrix for critical anomalies
1 Use FEA to predict the response sensitivity to a specified feature (flaw) anywhere in the part
10-29
2 Use perturbation theory-based numerical analyses to predict the frequency shift of a part considering flaws at different locations
bull Validate modeling results by comparing predicted and measured frequencies and mode shapes
1 Have multiple vendors collect data over full frequency range and compare these experimental measurements with FEA predictions
Milestones Metrics and Accomplishments Completed RI testing on production partmdasha steering knuckle
bull Three vendors participated in the study
Completed finite element simulations on the steering knuckle
bull Performed finite element-based natural frequency extraction
bull Performed mesh size convergence studies for the knuckle finite element model
bull Simulated actual RI experimental setup with steady-state dynamic simulation to obtain the vibrational amplitude at each resonant frequency
bull Calculated mode shapes and compared with experimental laser vibrometry measurements
bull Obtained good correlations between experimental frequencies to observed mode shapes
bull Predicted frequency shifts due to porosity and slits (oxide film model) using variational principles
bull Performed variational study to identify the influence of element density stiffness and part dimension on predicted natural frequencies and associated mode shapes
Future Direction bull The project has been completed
bull The success of this project has led to a new project under US Automotive Materials Partnership (USAMP) in developing the computationally enhanced RI sorting module
Introduction The resonance inspection (RI) technique is quick and very sensitive making it an ideal choice in production environments
Manufacturing acceptance of RI is limited by its empirical methodology and lengthy training period In addition the current RI technology does not provide any physics-based reasons for rejecting a particular part The ability to use RI for testing and flaw identification has long been a desired inspection technology
The goal of this concept feasibility project is to determine if it is feasible to use RI on a more quantitative basis by providing physics-based explainations of certain frequency shifts induced by flaws and anomalies More specifically we set out to assess the capability of finite element modeling approaches in accurately predicting the vibrational mode shapes and natural frequencies
10-30
along with the variability of those frequencies induced by structural flaws and anomalies Possible benefits of the computationally enhanced RI technology include the following decrease the required size of the training set choose the frequencies to watch more intelligently predict the sensitivity of the test to a specific feature etc Because of the complexity of the resonance structure in even simple parts computer modeling of the RI process had previously been deemed as intractable in many instances
In FY 2008 this project demonstrated that modeling the resonant behavior of simple partsis not only possible but also quite accurate We have compared the simulated results with the experimental results from two commercial vendors The Modal Shop (TMS) and Magnaflux Quasar (Quasar) We have also shown that the use of laser vibrometry resolves any ambiguities as to the actual mode shape present at a particular frequency
Based on the progress achieved during FY 2008 (Ref 1 2) FY 2009 has seen more achievements in both the experimental testing area and modeling area (Ref 3) Great strides were also made in automating the mode identification process and in predicting accurate mode frequencies Experimental resonance data have been collected on all the knuckles provided by our castingpartner We have also developed Finite Element Analysis (FEA) models from both Computer Aided Design (CAD) geometry and from computed tomography (CT) data in performing the subsequent natural frequency extraction analyses
Variational principle-based formulations were also derived for quantifying the influence of part defects at different locations on the overall resonance of the knuckle FEA models with defects have been created and the result generated from the model provides some interesting comparisons with data from experiments Study of the perturbation theory has also been extended
FEA model for knuckle developed An automotive steering knuckle as shown in Figure 1 has been chosen as a production part for our study Commercial finite element software ABAQUS (Ref 4) is used FEA models have been created from both CAD geometry and CT scan data
Figure 1 An automotive steering knuckle chosen for our concept feasibility study
Figure 2 shows the measurable geometry difference between the CAD model and the CT scan result of the sample knuckle part In some areas the difference of two models can be as much as 6 mm Consequently the predicted frequency spectra for the two models are also slightly different
10-31
Figure 2 Geometry discrepancy between the CT model and the CAD model
Mesh size convergence A mesh size convergence study was carried out by running the finite element frequency extraction with different characteristic mesh sizes ranging from 20 mm to 08 mm By comparing results from models with different mesh sizes the following observations on mesh size convergence can be made
In general predicted natural frequencies for every mode decrease as mesh size decreases An extrapolation curve fitting can be used to estimate the convergent resonance frequencies with a sufficiently small mesh size
The converged mesh size can be established as the largest mesh size below which no more mode switches can be predicted when mesh size is further reduced
Comparison of predicted and measured resonance frequency spectra Very good comparison has been achieved between the experimentally measured and FEA predicted resonance spectra for the steering knuckle with mesh size of 08 mm Figure 3 illustrates the comparison for the first 20 kHz In Figure 3 the peaks above the x-axis are the experimentally measured resonance spectra with the response power at different frequency levels and ldquoHTrdquo stands for ldquoheat treatedrdquo in the legend of Figure 3
Figure 3 Comparison of resonance frequencies for the first 20 kHz from TMS experiments and ABAQUS simulation
10-32
The peaks below the x-axis are the predicted resonance at different frequency levels Since the natural frequency extraction analysis does not provide any response amplitude the predicted results are plotted with uniform magnitude The good alignment between the top experimental spectrum and the lower predicted spectrum demonstrates that finite element-based modal analysis can be used to accurately predict the natural frequency response of a production-level light metal casting part
Complete mode shape catalog The vibrational mode shapes for the lowest 100 frequencies have been plotted and cataloged from the ABSQUS FEA results based on a CAD part As an illustration Figure 4 shows the mode shape for No 88 with a natural frequency of 37098 Hz for the steering knuckle
Figure 4 Knuckle mode shape at 37098 Hz
Comparison of mode shapes predicted by FEA with those measured by Laser vibrometry Experimental-mode shape measurements for the knuckle have also been performed using laser vibrometry by Polytec a commercial supplier of this technology Polytec measured the actual motion of the parts as they were being acoustically excited Because of the size of the knuckle for each frequency a total of 10000 scanned points divided into 21 image groups was used to cover the whole surface of the knuckle The scan frequency of 5 Hz was used to minimize the size of the scan data file
An automated mode shape matching algorithm between FEA prediction and experimental measurements has been developed and implemented which has greatly reduced the human error in mode matching A resemblance coefficient ranging from 0 to 1 is calculated between a Polytec mode and a predicted mode (Ref 3) A coefficient close to 1 indicates perfect matching of the mode pair For example Figure 5 shows the experimentally measured mode shape at a resonance frequency of 16810 Hz and Figure 6 shows the corresponding mode shape predicted by the finite element analysis For this pair the resemblance coefficient is 087
10-33
Figure 5 Polytec-measured knuckle vibrational mode shape at F=16810 Hz Red region represents highest absolute displacement
Figure 6 Knuckle mode shape at 16825 Hz as generated from ABAQUS FEA model Region at left side representshighest absolute displacement
Variational study on influences of density stiffness and part dimension on resonance frequency A perturbation theory-based variational approach has been used to derive the analytical resonance frequency shift due to a small change in part density material modules andor part geometry It is shown that the frequency shift for each mode is proportional or inversely proportional to the changes in density ρ stiffness E and overall geometry scale V
Subsequent finite element analyses were performed and the predicted frequency shifts match well with the perturbation theories (Ref 3)
Steady-state dynamics analyses for the knuckle
In addition to the modal analysis steady-state dynamic analyses were also performed for the knuckle to predict the relative magnitude of each resonant frequency
10-34
This is done by exciting the steering knuckle at a certain frequency with a concentrated force applied at the driver node (see Figure 7) along with a uniform gravity force acting on the whole part A boundary condition of zero displacement at the thickness direction is applied to the two nodes representing the two receiving transducers in the experimental setup A steady-state dynamics analysis is run after the linear frequency extraction step The reaction force is obtained at the two transducer nodes and the response power is calculated as the average reaction force from the two nodes
(a) (b)
Figure 7 Illustration of the transducer locations for the knuckle for (a) experimentmdashsee black X on part (b) steady-state finite element analysismdashsee white dots on part
Figures 8 and 9 compare the predicted vibration magnitude at each frequency level with the experimental measurements Here the Quasar data are shown with a real power unit and the ABAQUS results are plotted with their relative values in negative for each frequency Relatively good resonance magnitudes have been obtained in comparison with the Quasar experimental data particularly for the 20 kHz - 40 kHz range
Figure 8 Steady-state dynamics comparison for the first 20 kHz resonance frequencies
Figure 9 Steady-state dynamics comparison for the 20 kHz to 40 kHz resonance frequencies
10-35
Conclusions
In this concept feasibility study we have demonstrated that it is not only possible to use finite element-based frequency extraction to predict the vibrational frequency of a simple partbut it is also possible to predict the vibrational frequency as well as the mode shape of a complicated production-level part with very good accuracy With the rapid development of computer hardware and software finite element analyses and perturbation analyses will be capable of putting RI on a more science-based quantitative basis
It is commonly acknowledged by the original equipment manufacturer (OEM) participants that the work completed in this project is of greater magnitude and quality than expected Unexpected computational capabilities have also been shown and investigated Based on what has been achieved a follow-on technical feasibility study has been proposed and approved by USAMP in developing an industry-wide standard and the associated sorting modules for computationally enhanced RI
References 1 X Sun and M H Jones ldquoNDE 701 ndash Enhanced Resonance Inspection for Light Metal Castingsrdquo US-DOE Automotive Lightweighting Materials FY2007-2008 Annual Progress report
2 C Dasch X Sun C Lai J Saxton G Stultz G Palombo C Grupke G Harmon L Ouimet D Simon and M Jones Towards Quantitative Resonance Inspection Resonance Mode Identification and Modeling Proceedings of Review of Progress in Quantitative Nondestructive Evaluation Chicago Illinois 2008
3 C Lai X Sun M Jones C Dasch and G Harmon Project Final Report - NDE 701- Enhanced Resonance Inspection for Light Metal Castings Pacific Northwest National Laboratory Richland WA PNNL-18630 July 2009
4 ABAQUS 2007 Analysis Userrsquos Manual Version 67
PresentationsPublicationsPatents 1 ldquoNDE 701 Enhanced Resonance Inspection for Light Metal Castingsrdquo AMD Offsite Southfield Michigan Oct 29 2008
2 C Dasch X Sun C Lai J Saxton G Stultz G Palombo C Grupke G Harmon L Ouimet D Simon and M Jones Towards Quantitative Resonance Inspection Resonance Mode Identification and Modeling Proceedings of Review of Progress in Quantitative Nondestructive Evaluation Chicago Illinois 2008
10-36
E Concept Feasibility of Global Quality Assurance of Joining Technology for Automotive Body-in-White
Principal Investigator Xin SunPacific Northwest National LaboratoryPO Box 999 Richland WA 99352 (509) 372-6489 e-mail xinsunpnlgov
Industry Consultants Ford General Motors Chrysler
Technology Area Development Manager William Joost(202) 287-6020 e-mail williamjoosteedoegov
Field Technical Manager Mark T Smith (509) 375-4478 e-mail marksmithpnlgov
Contractor Pacific Northwest National LaboratoryContract No DE-AC05-76RL01830
Objective bull To quantitatively evaluate the effects of missing bondline or missing welds on the global resonance signature of an automotive body-in-white (BIW)
bull To assess the feasibility of a new inspection technique that will provide a global quality factor of the joining technology used for an automotive BIW
Approach bull Evaluate the sensitivity of resonance spectroscopy to detect defects such as a partial weld or an improperly cured adhesive in a simple structure
bull Determine target values for sensitivity reference surrogates of defects and functional requirements to be acceptable in a manufacturing environment and compatible with either inline or offline quality assurance and cost targets to ensure an inspection is economically affordable for the manufacturer
bull Determine techniques of exciting vibrational modes and other methods of stimulus that will intentionally stress a predetermined region to increase sensitivity to a selected site
bull Investigate novel means to reduce implementation cost
bull Determine advantages technology gaps and implementation issues investigate cost-effective means for implementation at automotive assembly plants and define paths for future development
Milestones Metrics and Accomplishments Milestone 1 Report of Concept Feasibility Study of Global QA of Joining Technology for Automotive BIW Completed September 2009 (PNNL-18838)
10-37
Accomplishments
bull Fabricated adhesively bonded generic hat sections perfectly bonded and with intentionally missed bondlines Experimentally measured the resonance spectra for all the three part populations using resonance inspection (RI)
bull Performed statistical data analyses on experimentally obtained RI data to demonstrate the concept feasibility of using RI in detecting lack of bonding in automotive BIW-level parts
bull Determined advantages technology gaps and implementation issues
Future Direction bull The project has been completed
bull The success of this concept feasibility project has led to the development of a new project proposal on technical feasibility of Global Quality Assurance of Joining Technology for Automotive Body-in-White
Introduction While the domestic automotive industry continues to introduce new lightweight materials and associated joining technologies to body-in-white (BIW) the need emerges for a global quality assurance tool that is nondestructive and able to quickly evaluate the joining technology for an entire automotive BIW Current practices employ statistical testing with destructive measurements that are labor-intensive ergonomically unfriendly costly and time intensive Further continuous joints such as adhesive bonds or laser welds can be difficult to inspect destructively and joints in high-strength steel can be too strong to be pried apart
Facing these challenges this project will examine the concept feasibility of using a global joint quality evaluation and assurance approach by quantifying the contributions of joint integrity (discrete as well as continuous) to the overall structural stiffness of the BIW through vibration mode and natural frequency analyses The proposed method is computationally intensive and examines BIW natural frequency and vibration modes using structural finite element analyses Different means of structural excitation and effects of different boundary conditions will be established by detailed finite element structuralmodal analyses on BIW models provided by the original equipment manufacturers
Partnering with automotive manufacturers is critical to ensure the techniques of straining the BIW and performing three-dimensional (3D) imaging is conducive to a manufacturing environment and existing online production practices Various experimental measurements including resonant spectroscopy and whole-body strain measurements using techniques such as shearography (shearing speckle interferometry) will be used as experimental model validations
The proposed techniques are capable of whole body imaging where either static or dynamic stress is applied and displacement is quantified on the order of nanometers Comparing analyses results the 3D displacement measurements will show a characteristic pattern when joining methods have been properly used and permit an objective means of evaluating quality
The objective of the project is to assess the feasibility of a global inspection technique for the various joining technologies used for an automotive BIW Three component-level parts have been examined in this concept feasibility study welded strips bonded strips and bonded hat sections
10-38
Our FY08 annual report (Sun et al 2008) summarizes the resonance inspection (RI) resultsfor the welded and bonded strips populations In FY09 we focused on a generic hat section to evaluate the feasibility of using a global measurement technique such as RI to determine the bond quality of a BIW level part The fabrication process and corresponding resonance spectraof controlled good and bad parts in this population are detailed in this report Conclusions and suggestions for future research will be made after the results are analyzed More detail on sample fabrication procedures measurement techniques measured RI spectra and data analyses procedures can also be found in our project final report (Sun et al 2009)
Fabrication of Adhesively Bonded Hat Sections Adhesively bonded hat sections are designed and fabricated to test the effectiveness of usingresonance spectra to discriminate lack of bonding parts from fully bonded parts
Figure 1(a) schematically illustrates the dimensions of the idealized generic hat section The top hat and the base plate are made of 12-mm gage mild steel sheets Note that these partswere accurately cut and bent in the machine shop at Pacific Northwest National Laboratory and they do not have the typical production line part-to-part variations observed in the automotive production environment Figure 1(b) shows a typical hat section as fabricated
(a) (b)
Figure 1 Illustration of adhesively bonded hat section
The structural adhesive Dow Betamate 73305GB was used in the bonding process In total six bonded hat sections were fabricated and cured under vacuum condition Two sections (G1 and G2) were perfectly bonded with 24-in bond lines on both flanges The remaining four ldquobadrdquo samples (G3-G6) were made with intentionally missed 8-in-long bond lines at various locations on the two flanges
Resonance Spectroscopy Measurements The Modal Shop (TMS) hammer impact system was used to measure the resonance spectra of the six bonded hat sections The experimental set up is shown in Figure 2 Two 1-in-wide nylon rails were positioned 2 in away from both ends of the parts as supports The impact point was at the center of the part (12 in from either side or 2 in updown from the top)
Figure 2 TMS resonance test set up 10-39
Figure 3 (a)-(f) shows the measured resonance spectra for the two good parts (G1 and G2) in different frequency ranges The results shown in Figure 3 clearly demonstrate that discrete resonance peaks can be measured for the adhesively bonded hat sections That is the bonded hollow sections ring and the attenuating effect of the adhesive are not dominating in the resonance spectra for the hat section as was seen in the adhesively bonded strips (Sun et al 2008) In addition the test results shown in Figure 3 indicate that the resonance spectra comparison between the two good parts share many similar resonance peaks This is particularly true for frequencies of less than 15 kilo-Hertz (kHz) In the frequency range gt15 kHz their resemblance decreases This may be due to the small number of measurements and the high noise-to-signal ratio for this measurement technique at higher frequency ranges
(a) 0-1000Hz (b) 1000Hz-2000Hz
(c) 2000Hz-5000Hz (d) 5000Hz-10000H
(e) 10000Hz-15000Hz (f) 15000Hz-20000Hz
Figure 3 TMS measured resonance spectra comparison for the two good hat sections
10-40
Figure 4 shows a typical spectra comparison between the good part (G1) and a bad part (G3- missing an 8-in bond line on the 2-in-wide flange) The results here indicate that the bad part is missing many distinct resonance peaks compared to the good part particularly in the frequency range of 3 to 7 kHz At higher frequency ranges ie gt10 kHz some significant frequency shifts are also observed between the two parts
(a) 0-1000Hz (b) 1000Hz-2000Hz
(c) 2000Hz-5000Hz (d) 5000Hz-10000Hz
(e) 10000Hz-15000Hz (f)15000Hz-20000Hz
Figure 4 TMS measured resonance spectra comparison between a good part (G1) and a bad part (G3)
10-41
These results are very encouraging in the sense that 1) a clear resonance pattern can be established for the good parts and 2) clear resonance differences can be observed between the good and bad part Spectra comparisons for all the other parts are processed and stored in Exceltrade format They show the same trends as discussed above
Statistical Data Analyses with Test Statistics This section summarizes the preliminary results of a statistical data analysis using the resonance spectra measured for the adhesively bonded hat sections The problem was formulated as a classic discrimination problem First the spectra for all the bonded hat sections are used to establish the test statics for the bonded hat section population The detection statistic is expressed in a weighed sum of the spectrum
D(P) =
with the weights determined by the means of the good and debond samples
The detector is produced by thresholding the test statistic T That is if D(P)ltT then classify the part as good and if D(P)gtT then classify the part as bad The threshold value T is set to produce a specific false call probability for detection Practically speaking the wider the range of effective T the better the test statistic
The mathematical details of the procedures for this statistical approach are summarized in Sun et al (2009) Figure 5 shows the receiver operating characteristic (ROC) curve for the good parts versus the debond part using this test statistic The ROC curve is a statistical tool to display all possible probability of detection (POD) versus false call probability (FCP) values that can be achieved by the inspection method Different POD and FCP performance is achieved by varying the detection threshold of the test statistic
For example if T is set at 1100 as shown in Figure 5 then the POD of the debonded parts approaches 10 and the false call probability of the good parts is almost 0 The results shown in Figure 5 clearly indicate that a threshold value T can be established such that the good partscan be distinguished from the bebond parts without ambiguity
10-42
Figure 5 ROC curve of the hat section population
The conclusions from these statistical data analyses are
bull For the population of parts investigated in this study it is possible to discriminate between good and debonded parts with little misclassification error
bull The good part populations however are very homogeneous and probably are not typical of production line parts
bull The debonded parts differ from the good parts significantly
bull Defects result in complex changes to the resonance frequency spectra
Conclusions The ability to use RI for detecting lack of bonding andor subsizedmissed spot welds in an automotive BIW has long been desired The RI technique is quick and very sensitive making it an ideal choice in production environments This concept feasibility project set out to determine if it is feasible to accomplish this goal The results in this study clearly demonstrate that
1 RI is not effective in detecting lack of bonding in a fully bonded panel or strip due to the attenuating effects of the adhesive layer
2 For the bonded hat sections and spot welded strips it is possible to discriminate between good and debonded parts with little misclassification error based on the resonance spectra
3 Defects result in complex changes to the response frequency spectra spectra for the debonded parts differ from the good parts significantly
The gaps and limitations of the current study are as follows
1 The good part populations are very homogeneous and probably are not representative of production line part-to-part variations
2 A larger population of good parts is needed for developing a more accurate algorithm andtraining
3 Production-level part-to-part variations need to be considered in developing the detection algorithm
10-43
4 Effective and consistent means of part excitation must be established
5 Algorithms for inverse mapping must be developed such that given a resonance spectrum the possible location of the lack of weldbonds can be identified
6 These gaps and limitations should be the focus of the next phase of study in evaluating the effectiveness of this technique in detecting production-level BIW parts
References 1 1 X Sun JA Carpenter and AD Yocum ldquoConcept Feasibility of Global QA of Joining Technology for Automotive Body-in-White (BIW)rdquo US-DOE Automotive Lightweighting Materials FY2008 Annual Progress report
2 2 X Sun C Lai P Heasler MT Smith and M Good Technical Report - Concept Feasibility of Global QA of Joining Technology for Automotive Body-in-White (BIW) Pacific Northwest National Laboratory Richland WA PNNL-18838 September 2009
10-44
F Reliability Tools for Resonance Inspection of Light Metal Castings
Principal Investigator Martin JonesNondestructive Evaluation Laboratory Ford Motor Company35750 Plymouth Road Livonia MI 48150 (313) 805-9184 e-mail mjone147fordcom
Technology Area Development Manager William Joost(202) 287-6020 e-mail williamjoosteedoegov
Contractor United Sates Automotive Materials Partnership (USAMP1)Contract No DE-FC26-02OR22910
Objective bull To ensure the structural integrity of light metal castings by satisfying the need for rapid reliable in-line nondestructive evaluation (NDE)
bull To develop a set of tools for resonance (acoustic) inspection (RI) that increases its reliability and robustness
bull To develop a set of software tools that can predict the probability of detection (POD) for a discrepancy given its type size orientation and location when using RI This set includes tools to predict accurately resonance frequencies in the absence of discrepancies frequency shifts due to discrepancies the normal frequency variability and robust sort modules
bull To test the accuracy of the models on several commercial castings and to collect data on the time manpower and cost associated with heuristic and physics-based methods
bull To develop standard procedures to implement RI for production components and to ensure the accuracy repeatability and traceability of the inspections
bull To research methods that may allow measured frequency shifts to determine the location size and type of discrepancies
Approach including industrial partnercollaborator and path to technology transfer and commercialization bull Working with several casting vendors make castings with a range of common discrepancies that can be quantified for each discrepancy type These castings will be resonance inspected and then measured for strength to provide an RI-strength correlation
bull Working with RI system vendors collect resonance spectra for the castings and develop sort modules using current heuristic methods
bull Working with finite element model (FEM) experts create scalable models for the discrepancies and test their accuracy for predicting RI frequency shifts
bull Working with an acoustic system integrator build an integrated work bench that allows RI to be evaluated beginning with only the CAD model and strength requirements of a part This will use FEM to predict the resonances predict POD for discrepancies and optimize sort modules
10-45
Milestone Metrics and Accomplishments
bull Commenced project and selected project vendors
bull Designed and resonance modeled a tensile bar that will be used to calibrate RI sensitivity to material strength
bull Cast several batches of cylinders for the tensile bars with controlled levels of shrink porosity
bull Collected and resonance inspected discrepant production castings from two different casters
bull Translated ASTM E155 radiographic data2 into physically dimensioned discrepancy sizes
bull Began design of finite element program that will optimize selection of inspection resonance frequencies and predict the probability of detection
bull Drafted standardized process flow chart for developing RI plans for new parts
bull Conducted a workshop on the need and requirements for a new acceptance standard for RI in production environments and developed an outline for the standard
Future Direction bull During the next year tensile bars with varying levels of porosity crack size and oxide inclusions will be cast machined resonance inspected tomographed pulled and micro-characterized
bull The results from the tensile bars will give sensitivity response curves and provide details to develop finite element models of the discrepancies
bull Traditional heuristic inspection plans will be developed for the tensile bars and the twoproduction castings These will provide a baseline to compare with the physics-based predictions
bull The framework for the physics-based FEM model will be coded and tested
bull A draft standard for production resonance inspections is to be completed
Introduction There are many automotive castings that are either safety or performance critical to the vehicle and require 100 inspection with extremely high requirements for the confidence of reliability These include many chassis and powertrain components Usually these have complex shapes and present extremely difficult inspection problems even with multi-view x-ray systems or surface-only inspections such as dye-penetrants
Resonant (acoustic) inspection (RI) offers unique capabilities for these inspections Sound in the range of 100 to 100000 Hz can readily penetrate small to very large castings and is sensitive to heat treatment porosity cracks and at least some oxide inclusions Resonance inspection also has significantly lower capital and piece costs than either radiographic testing(RT) or fluorescent penetrant inspection (FPI) In fact resonance inspection is already used for 100 inspection of many castings such as knuckles rocker arms master cylinders and brake calipers Figure 1 shows a schematic representation of a resonance inspection To date these resonance inspections have been based on heuristic sort modules Sets of good parts and of
10-46
Fig 1 Schematic representation of aresonance inspection
Figure 2 Schematic comparison of prior heuristic sort modules with new physics-based
approach
discrepant parts are used to select a set of inspection resonances (acoustic frequencies with associated frequency window) and to build sort rules that can separate the two sets of parts correctly (see Figure 2)
GOOD PARTS
BAD PARTS
Sort Module
Extract Resonance Frequencies
Fig 1 Schematic representation of a resonance inspection
Figure 2 Schematic comparison of prior heuristic sort modules with new physics-based approach
Despite these successes resonance inspection has not been universally adopted for three sets of reasons
1 The sensitivity of a given resonance inspection to a particular size discrepancy in a given location has been generally unknown Rarely has the sensitivity been directly measured even for simulated discrepancies such as drilled holes or saw cuts Nor can the sensitivity be estimated even by experts in the field The physics of the resonance problem have been very underdeveloped compared with radiographic or ultrasonic inspections
10-47
2 The second set of reasons involves the robustness of the inspection to allowed part variations Castings of a part are almost always made with several cavities in several different molds In addition to initial mold variations the molds will experience wear as many parts are cast The resulting castings will have small dimensional and processing condition variations Frequently heuristic sort modules must be rebuilt and re-verified as more molds and cavities are brought into production leading to uncertainty reduced reliability down time and major expense
3 There is not currently a resonance inspection standard that establishes a traceable inspection that can be used to support the reliability of a given inspection
This project is designed to address each of these sets of problems In general terms the project is aimed at replacing the current heuristic approach with a priori or physics-based tools as seen in Figure 2 The projectrsquos deliverables are
1 Standardized procedure for RI in production
2 Integrated tools to predict probability of detection (POD) to critical defects
3 Software tools to create sort modules
4 Evaluate ability to identify anomaly type size and location from RI data
This project builds on the NDE701 project that demonstrated the technical feasibility of using FEM to accurately predict the resonance spectra of complex shapes such as front knuckle castings3 This new development project was approved in March of 2009 but the first purchase orders were not approved until September 2009 This report covers the progress that has been made on Tasks 1 to 4 during this period
Integrated tools for POD to critical defects This task is targeted at creating accurate probability of detection (POD) predictions for resonance inspection of the principal casting discrepancies The discrepancies to be included are shrink porosity cracks and oxide inclusions To predict the POD there are three essential ingredients 1) the sensitivity of the response to the size of the discrepancy for RI the response is the frequency shift of a resonance due to the discrepancy 2) the noise in the frequency shifts due all sources these include measurement error (lt1 part in 10000) and resonance variability due to acceptable material variation (typically 1 part in 1000) and 3) the sort module selected
1 Creating discrepancies
To determine the RI sensitivity (ie frequency vs discrepancy size response) a set of simple samples with well-characterized discrepancies are being cast These discrepancies will first be non-destructively inspected especially by computed tomography and resonance inspection They will then be tensile tested to relate the effect of the discrepancy on the strength Post facto the discrepancy revealed by the tensile test will be analyzed with metallographic fractographic and micro-hardiness measurements These measurements will then be used to create finite element models of standard scalable discrepancies for shrink porosity cracks and oxide inclusions
The simple shape selected for the discrepancy castings is a modified ASTM B577M5 tensile bar (see Figure 3) cast from A356 and given a T6 heat treatment Tensile strength was chosen as the strength characterization since it can be run quickly and has been correlated to discrepancy size previously (Reference) A sample with a relatively large gauge size (125 mm dia) was selected to make the RI simpler and to allow for variations in the locations of the discrepancies within the castings The standard tensile bar was modified by removing small areas of the ends to make it asymmetric this breaks modal degeneracies and simplifies the mode assignment
10-48
Figure 3 RI tensile bar design with 125 mm diam gauge section
Figure 3 RI tensile bar design with 125 mm diam gauge section
Several different designs of the tensile bar were evaluated to ensure the design has sufficient asymmetry The designs were tested using the FEM methods developed during the NDE701 project There are three classes of modes associated with increasing stiffness transverse bending torsional and longitudinal stretching Examples of the first two modes of each type are shown in Figure 4 The predicted frequencies below 100 kHz are shown in Figure 5 The bending modes would normally be doubly degenerate with deflections at right angles to each other The mode splitting between these bending modes induced by the bar asymmetry is indicated in the graph and ranges from 1 to 400 Hz
Figure 4 Representative resonance modes calculated for the modified ASTM B577 tensile bar Only the lowest two modes of each class are included Only one of the twonearly degenerate bending modes is included
Figure 5 Predicted resonance frequencies for modified ASTM B577 tensile bar grouped by mode type
10-49
Figure 7 X-ray radiographs of porosity in two cylindrical castings
A series of 54 cylindrical castings with three different diameters have been cast at the Chrysler Technical Center The lower pattern used to make the mold for the sand castings is shown in Figure 6 These castings include both low and high shrinkage porosity samples
Figure 6 Lower pattern used to make cylindrical castings for tensile bars
The castings have been x-rayed in two orthogonal views to establish the discrepancy size and location Figure 7 shows illustrative radiographs of a good casting and a casting with a discrepant amount of shrink porosity The shrink porosity includes both cavity and sponge types
Figure 7 X-ray radiographs of porosity in two cylindrical castings
In the next round of castings oxide inclusions will be created These will include both gross dross forms and film oxides
To produce tight cracks some of the good castings will be cycled at low tension in order to produce high-cycle fatigue cracks It is planned that the cylinders will first be circumferentially notched to confine the crack to the middle of the bar Then a piezo-stack running at roughly 1000 Hz will be used to fatigue the bars The cracks will be grown to varying depths After crack growth the outer surface will be machined away to remove the notches and define the gauge section
2 Discrepancies found in production
In addition to the experimental discrepancies described above production foundry discrepancies are being pulled for two parts produced by two of our casting participants Both castings are produced with multi-cavity permanent mold processes These discrepant castings are found by
10-50
normal quality assurance using x-ray fluorescent particle and visual inspections This is a difficult task since discrepant castings are made infrequently These are all resonantly inspected Some of these will also be machined into tensile bars and tested for comparison with the experimental castings
3 Calibrating discrepancy sizes
Safety critical castings such as some chassis components are typically 100 radiographically inspected following ASTM E155 or ASTM E2422 These standards use actual cast blocks that have a range of sizes for several discrepancy types (gas holes shrink cavity porosity shrink sponge porosity high and low density inclusions) For each discrepancy type the castings have been subjectively ranked or given a grade depending on the severity (size) of the discrepancies Only by long experience has it been determined what radiographic grade is needed for each component Part of these short comings arises because the sizes of the discrepancies in the radiographic standards have not been published
In the USAMPAMD ldquoDesign and Product Optimization for Cast Light Metals Projectrdquo completed in 2001 there was an activity at Lawrence Livermore National Lab to re-radiograph the ASTM E155 castings and to analyze those radiographs for discrepancy size For the discrete discrepancies (gas holes shrink cavities and inclusions) the LLNL analysis included the projected area of the discrepancies the maximum feature size and an effective depth (from the calibrated attenuation measurements) Each of these measurements gives a different characteristic size
The final step to reduce this information to a single dimension or size was never completed We have re-analyzed this data for each of the different casting types for the discrete defects to determine if there is a consistent size that can be associated with each grade Using either a circle equivalent diameter or a sphere equivalent diameter gave similar results It was concluded that the area equivalent diameter is the most accurately measured property using ASTM E155 and provides the best scalar representation of the discrepant classes
Finite element sort modules To have a useful physics-based tool it is necessary to integrate all the physics into a software tool bench This will begin with the part design (CAD model) and the engineering requirements(peak loads and associated locations) These inputs then must be converted into finite element models for the part and for discrepancies that would limit the performance of the part
These inputs and the other elements of the processing are shown schematically in Figure 8The important physics that will be included are the sensitivity to discrepancy type size and location that was described above efficient means to predict the frequency variability and the efficient means to optimize the sort module and to include process compensation Process compensation is the inclusion of some resonance lines to compensate for allowable geometry and material property variations
These tools will be built within a commercial finite element environment maximizing the use of existing tools that are available for modal analysis
10-51
Figure 8 Inputs and data processing for the proposed FEM tool to create physics-based RI sort modules
Figure 8 Inputs and data processing for the proposed FEM tool to create physics-based RI sort modules
Standardized Procedures The last task of the project is produce a standard that will lead to accurate repeatable and traceable inspections in the production environment There already exists one standard6 for resonance inspection but it is mostly a generic guide to the technology There have been several OEM procedures drafted that address implementation procedures These have been synthesized into a standard process flow chart This will be used for the creation of sort modules for the three castings being tested in the project
Despite these documents there is a gap in the available standards and procedures relevant to making production inspections reliable repeatable and traceable This gap includes the consistent use and documentation on 1) the inspection procedure used 2) measurements on the repeatability and reproducibility 3) the numbers and types of discrepancies used to measure the accuracy of the final sort module as well as the error rates for this validation setand 4) preservation of results from production inspections
In June 2009 a workshop was held to review the state of RI standardization and to propose the areas to be included in a new standard The workshop concluded that this document is an essential element for productionizing RI
Conclusions Resonance inspection is a promising technology for ensuring the quality of light metal castings that require high reliability This project addresses three of the technical barriers limiting the implementation of RI These include the need for probability of detection predictions for given inspections the need for more reliable sort modules and the need for standard traceable inspection procedures When completed this project will deliver tools that are or are very close to being commercially ready
10-52
PresentationsPublicationsPatents Dasch C X Sun C Lai J Saxton G Stultz G Palombo C Grupke G Harmon L Ouimet D Simon and M Jones 2008 ldquoTowards Quantitative Resonance Inspection Resonance Mode Identification and Modelingrdquo Review of Progress in Quantitative NDE
ldquoNDE 901 Enhanced Resonance Inspection for Light Metal Castingsrdquo 2009 AMD Offsite Southfield MI October 13
C Lai X Sun C Dasch G Harmon and M Jones ldquoQuantifying Resonance Inspection with Finite-Element-Based Modelingrdquo submitted to J Sound and Vibration Oct 2009
References 1 Denotes Project 701 of the Nondestructive Evaluation Working Group of the United States Automotive Materials Partnership (USAMP) one of the formal consortia of the United States Council for Automotive Research (USCAR wwwuscarorg) set up by Chrysler Ford and General Motors to conduct joint pre-competitive research and development
2 ASTM B155-05 ldquoStandard Reference Radiographs for Inspection of Aluminum and Magnesium Castingsrdquo
3 USAMP Project NDE701 ldquoEnhanced Resonance Inspection for Light Metal Castingsrdquo
4 See for example A Miglioriand J L Sarrao ldquoResonant Ultrasound Spectroscopyrdquo (John Wiley amp Sons 1997) or J He and Z Fu ldquoModal Analysisrdquo (Butterworth-Heinemann 2001)
5 ASTM E577M ldquoStandard Test Methods of Tension Testing Wrought and Cast Aluminum- andMagnesium-Alloy Productsrdquo
6 ASTM E2001-08 ldquoStandard Guide for Resonant Ultrasound Spectroscopy for Defect Detection in Both Metallic and Non-metallic Partsrdquo
10-53
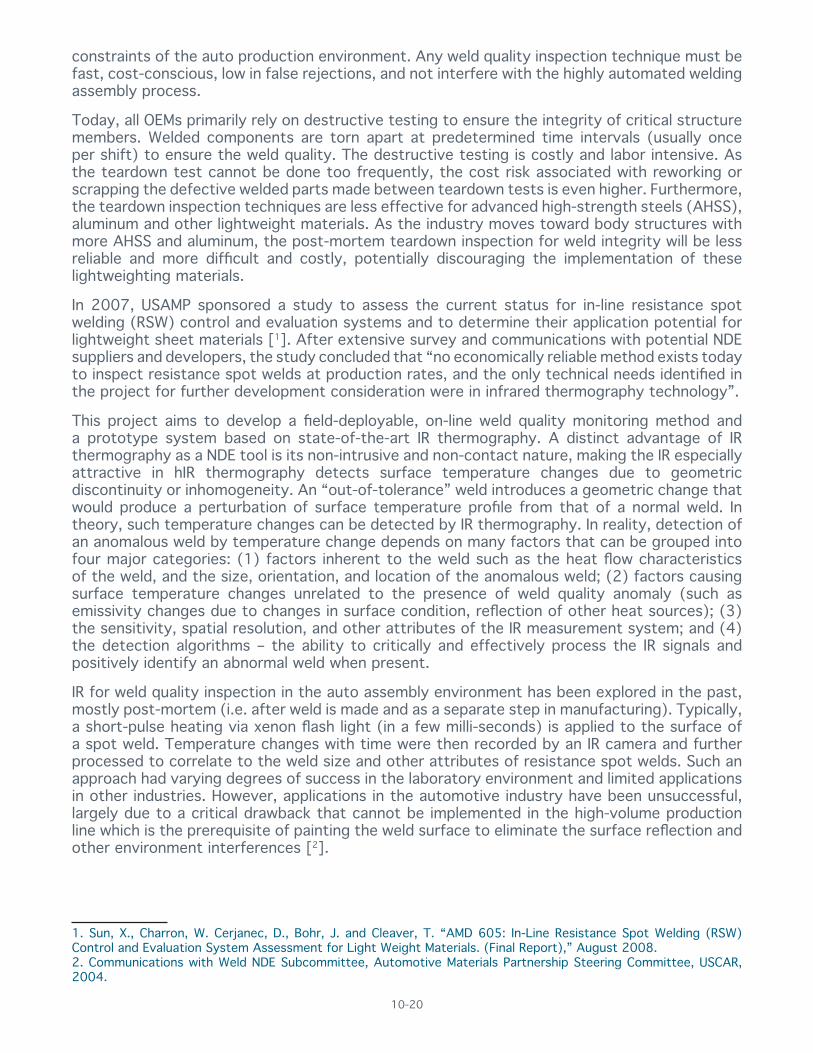
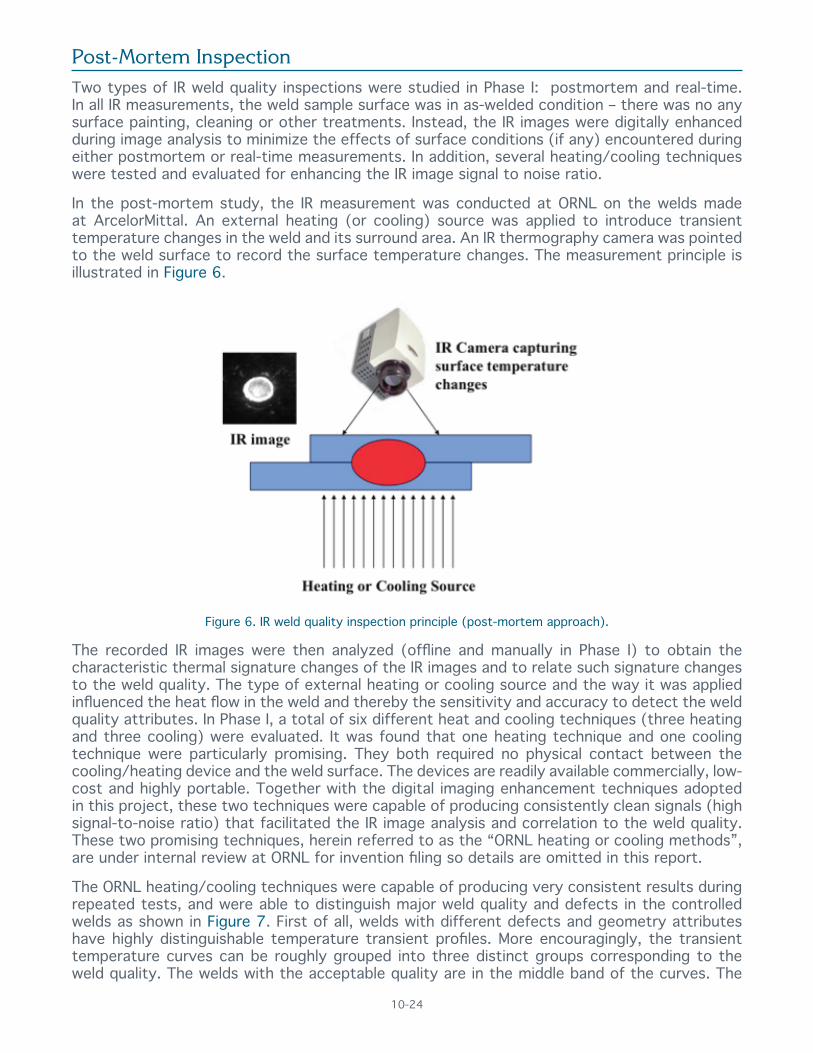
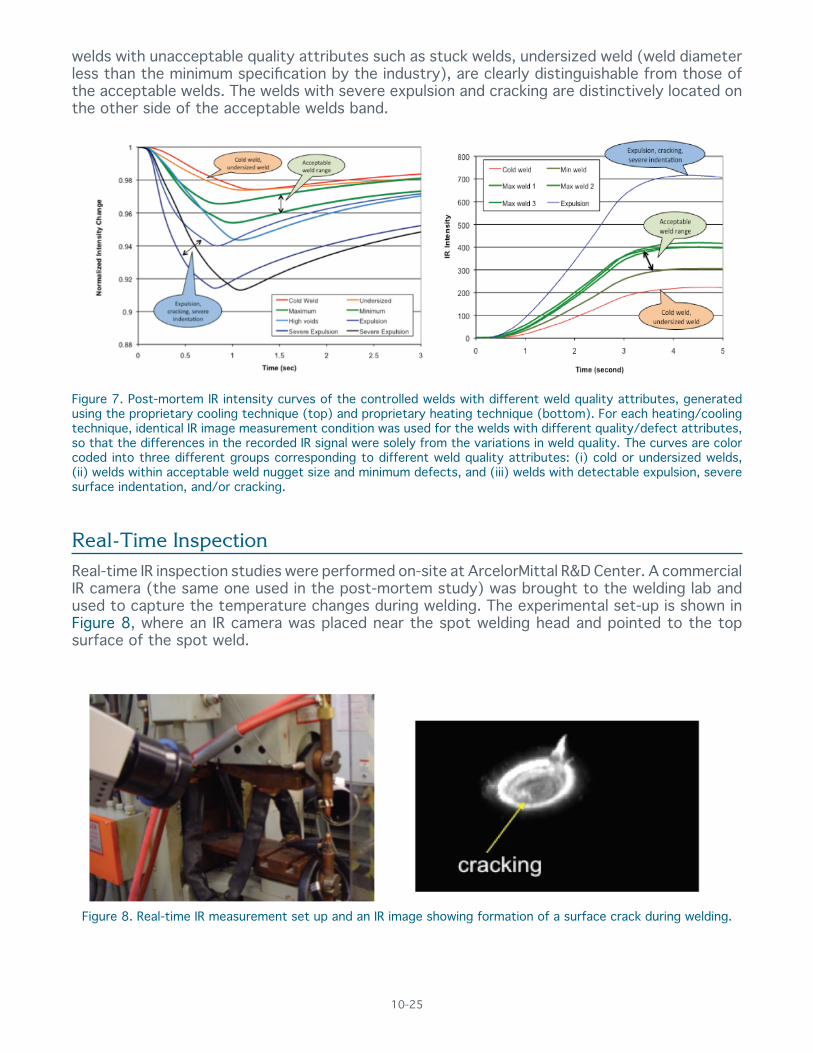
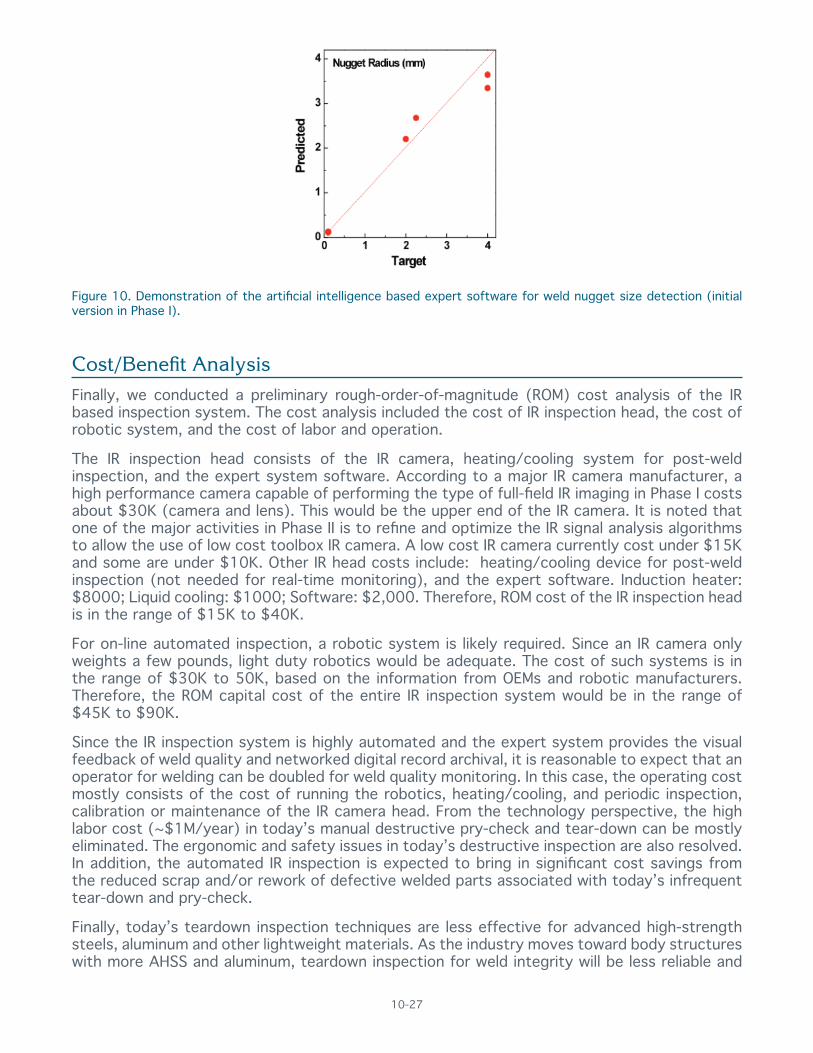
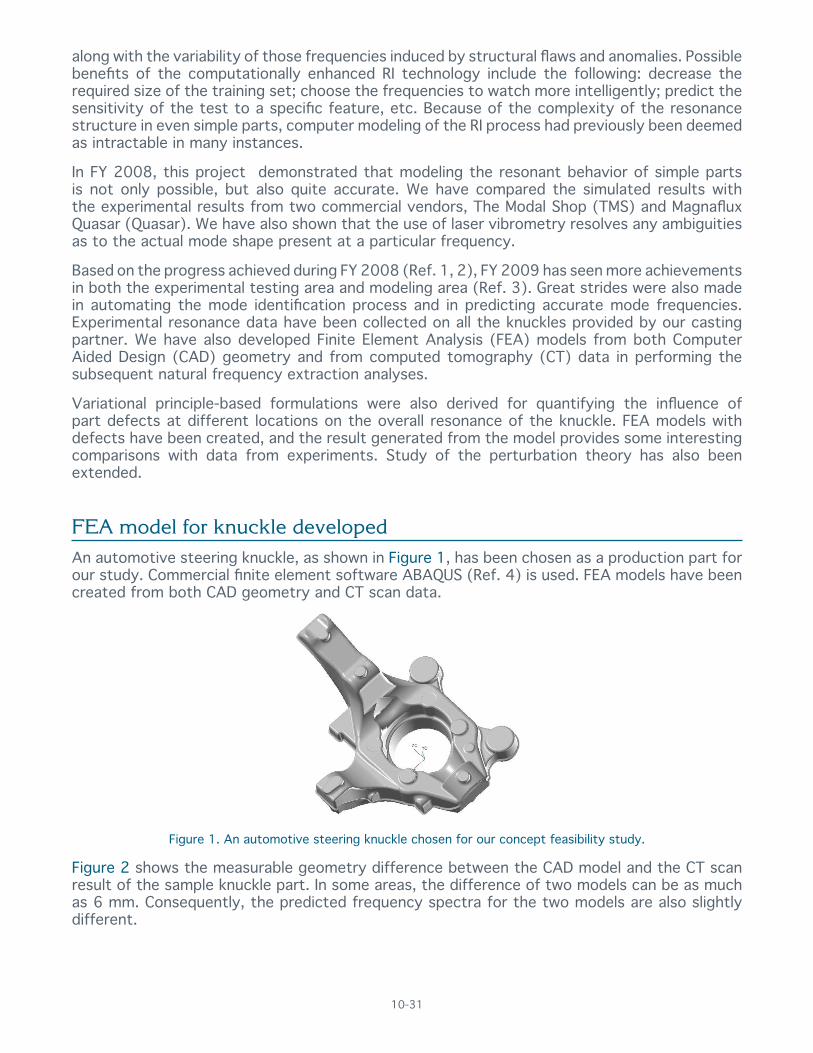
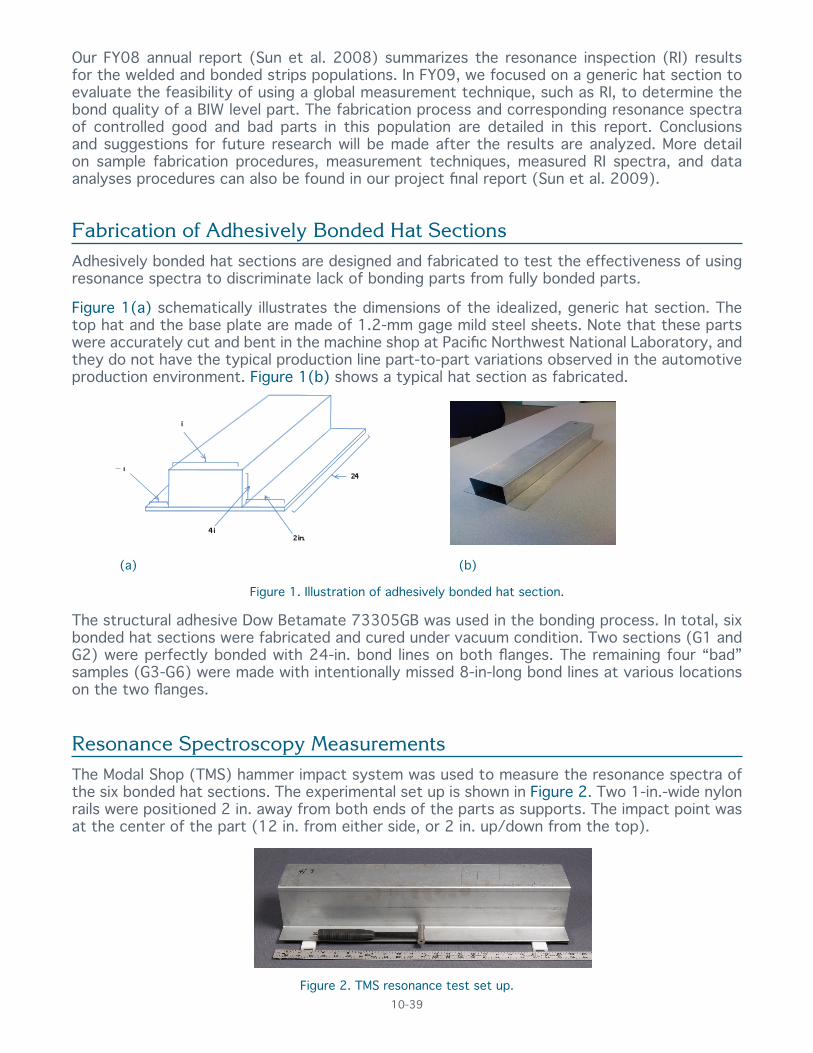
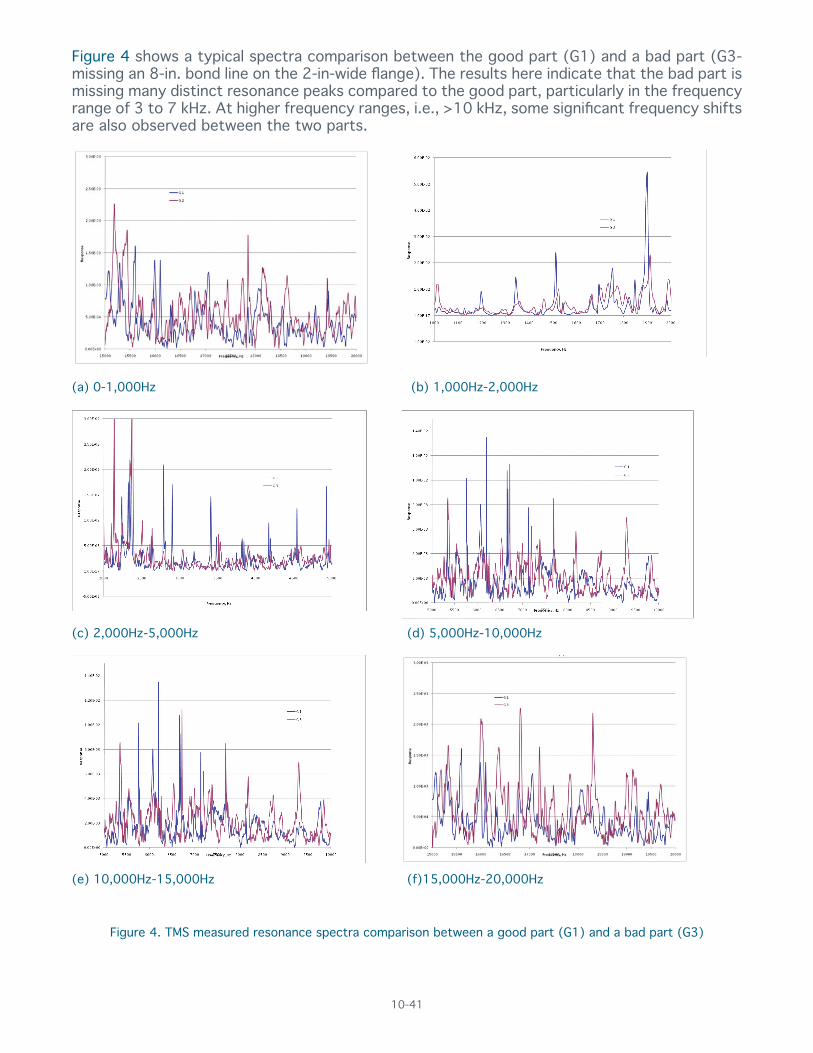

Figure 3 RI tensile bar design with 125 mm diam gauge section
Figure 3 RI tensile bar design with 125 mm diam gauge section
Several different designs of the tensile bar were evaluated to ensure the design has sufficient asymmetry The designs were tested using the FEM methods developed during the NDE701 project There are three classes of modes associated with increasing stiffness transverse bending torsional and longitudinal stretching Examples of the first two modes of each type are shown in Figure 4 The predicted frequencies below 100 kHz are shown in Figure 5 The bending modes would normally be doubly degenerate with deflections at right angles to each other The mode splitting between these bending modes induced by the bar asymmetry is indicated in the graph and ranges from 1 to 400 Hz
Figure 4 Representative resonance modes calculated for the modified ASTM B577 tensile bar Only the lowest two modes of each class are included Only one of the twonearly degenerate bending modes is included
Figure 5 Predicted resonance frequencies for modified ASTM B577 tensile bar grouped by mode type
10-49
Figure 7 X-ray radiographs of porosity in two cylindrical castings
A series of 54 cylindrical castings with three different diameters have been cast at the Chrysler Technical Center The lower pattern used to make the mold for the sand castings is shown in Figure 6 These castings include both low and high shrinkage porosity samples
Figure 6 Lower pattern used to make cylindrical castings for tensile bars
The castings have been x-rayed in two orthogonal views to establish the discrepancy size and location Figure 7 shows illustrative radiographs of a good casting and a casting with a discrepant amount of shrink porosity The shrink porosity includes both cavity and sponge types
Figure 7 X-ray radiographs of porosity in two cylindrical castings
In the next round of castings oxide inclusions will be created These will include both gross dross forms and film oxides
To produce tight cracks some of the good castings will be cycled at low tension in order to produce high-cycle fatigue cracks It is planned that the cylinders will first be circumferentially notched to confine the crack to the middle of the bar Then a piezo-stack running at roughly 1000 Hz will be used to fatigue the bars The cracks will be grown to varying depths After crack growth the outer surface will be machined away to remove the notches and define the gauge section
2 Discrepancies found in production
In addition to the experimental discrepancies described above production foundry discrepancies are being pulled for two parts produced by two of our casting participants Both castings are produced with multi-cavity permanent mold processes These discrepant castings are found by
10-50
normal quality assurance using x-ray fluorescent particle and visual inspections This is a difficult task since discrepant castings are made infrequently These are all resonantly inspected Some of these will also be machined into tensile bars and tested for comparison with the experimental castings
3 Calibrating discrepancy sizes
Safety critical castings such as some chassis components are typically 100 radiographically inspected following ASTM E155 or ASTM E2422 These standards use actual cast blocks that have a range of sizes for several discrepancy types (gas holes shrink cavity porosity shrink sponge porosity high and low density inclusions) For each discrepancy type the castings have been subjectively ranked or given a grade depending on the severity (size) of the discrepancies Only by long experience has it been determined what radiographic grade is needed for each component Part of these short comings arises because the sizes of the discrepancies in the radiographic standards have not been published
In the USAMPAMD ldquoDesign and Product Optimization for Cast Light Metals Projectrdquo completed in 2001 there was an activity at Lawrence Livermore National Lab to re-radiograph the ASTM E155 castings and to analyze those radiographs for discrepancy size For the discrete discrepancies (gas holes shrink cavities and inclusions) the LLNL analysis included the projected area of the discrepancies the maximum feature size and an effective depth (from the calibrated attenuation measurements) Each of these measurements gives a different characteristic size
The final step to reduce this information to a single dimension or size was never completed We have re-analyzed this data for each of the different casting types for the discrete defects to determine if there is a consistent size that can be associated with each grade Using either a circle equivalent diameter or a sphere equivalent diameter gave similar results It was concluded that the area equivalent diameter is the most accurately measured property using ASTM E155 and provides the best scalar representation of the discrepant classes
Finite element sort modules To have a useful physics-based tool it is necessary to integrate all the physics into a software tool bench This will begin with the part design (CAD model) and the engineering requirements(peak loads and associated locations) These inputs then must be converted into finite element models for the part and for discrepancies that would limit the performance of the part
These inputs and the other elements of the processing are shown schematically in Figure 8The important physics that will be included are the sensitivity to discrepancy type size and location that was described above efficient means to predict the frequency variability and the efficient means to optimize the sort module and to include process compensation Process compensation is the inclusion of some resonance lines to compensate for allowable geometry and material property variations
These tools will be built within a commercial finite element environment maximizing the use of existing tools that are available for modal analysis
10-51
Figure 8 Inputs and data processing for the proposed FEM tool to create physics-based RI sort modules
Figure 8 Inputs and data processing for the proposed FEM tool to create physics-based RI sort modules
Standardized Procedures The last task of the project is produce a standard that will lead to accurate repeatable and traceable inspections in the production environment There already exists one standard6 for resonance inspection but it is mostly a generic guide to the technology There have been several OEM procedures drafted that address implementation procedures These have been synthesized into a standard process flow chart This will be used for the creation of sort modules for the three castings being tested in the project
Despite these documents there is a gap in the available standards and procedures relevant to making production inspections reliable repeatable and traceable This gap includes the consistent use and documentation on 1) the inspection procedure used 2) measurements on the repeatability and reproducibility 3) the numbers and types of discrepancies used to measure the accuracy of the final sort module as well as the error rates for this validation setand 4) preservation of results from production inspections
In June 2009 a workshop was held to review the state of RI standardization and to propose the areas to be included in a new standard The workshop concluded that this document is an essential element for productionizing RI
Conclusions Resonance inspection is a promising technology for ensuring the quality of light metal castings that require high reliability This project addresses three of the technical barriers limiting the implementation of RI These include the need for probability of detection predictions for given inspections the need for more reliable sort modules and the need for standard traceable inspection procedures When completed this project will deliver tools that are or are very close to being commercially ready
10-52
PresentationsPublicationsPatents Dasch C X Sun C Lai J Saxton G Stultz G Palombo C Grupke G Harmon L Ouimet D Simon and M Jones 2008 ldquoTowards Quantitative Resonance Inspection Resonance Mode Identification and Modelingrdquo Review of Progress in Quantitative NDE
ldquoNDE 901 Enhanced Resonance Inspection for Light Metal Castingsrdquo 2009 AMD Offsite Southfield MI October 13
C Lai X Sun C Dasch G Harmon and M Jones ldquoQuantifying Resonance Inspection with Finite-Element-Based Modelingrdquo submitted to J Sound and Vibration Oct 2009
References 1 Denotes Project 701 of the Nondestructive Evaluation Working Group of the United States Automotive Materials Partnership (USAMP) one of the formal consortia of the United States Council for Automotive Research (USCAR wwwuscarorg) set up by Chrysler Ford and General Motors to conduct joint pre-competitive research and development
2 ASTM B155-05 ldquoStandard Reference Radiographs for Inspection of Aluminum and Magnesium Castingsrdquo
3 USAMP Project NDE701 ldquoEnhanced Resonance Inspection for Light Metal Castingsrdquo
4 See for example A Miglioriand J L Sarrao ldquoResonant Ultrasound Spectroscopyrdquo (John Wiley amp Sons 1997) or J He and Z Fu ldquoModal Analysisrdquo (Butterworth-Heinemann 2001)
5 ASTM E577M ldquoStandard Test Methods of Tension Testing Wrought and Cast Aluminum- andMagnesium-Alloy Productsrdquo
6 ASTM E2001-08 ldquoStandard Guide for Resonant Ultrasound Spectroscopy for Defect Detection in Both Metallic and Non-metallic Partsrdquo
10-53

Figure 7 X-ray radiographs of porosity in two cylindrical castings
A series of 54 cylindrical castings with three different diameters have been cast at the Chrysler Technical Center The lower pattern used to make the mold for the sand castings is shown in Figure 6 These castings include both low and high shrinkage porosity samples
Figure 6 Lower pattern used to make cylindrical castings for tensile bars
The castings have been x-rayed in two orthogonal views to establish the discrepancy size and location Figure 7 shows illustrative radiographs of a good casting and a casting with a discrepant amount of shrink porosity The shrink porosity includes both cavity and sponge types
Figure 7 X-ray radiographs of porosity in two cylindrical castings
In the next round of castings oxide inclusions will be created These will include both gross dross forms and film oxides
To produce tight cracks some of the good castings will be cycled at low tension in order to produce high-cycle fatigue cracks It is planned that the cylinders will first be circumferentially notched to confine the crack to the middle of the bar Then a piezo-stack running at roughly 1000 Hz will be used to fatigue the bars The cracks will be grown to varying depths After crack growth the outer surface will be machined away to remove the notches and define the gauge section
2 Discrepancies found in production
In addition to the experimental discrepancies described above production foundry discrepancies are being pulled for two parts produced by two of our casting participants Both castings are produced with multi-cavity permanent mold processes These discrepant castings are found by
10-50
normal quality assurance using x-ray fluorescent particle and visual inspections This is a difficult task since discrepant castings are made infrequently These are all resonantly inspected Some of these will also be machined into tensile bars and tested for comparison with the experimental castings
3 Calibrating discrepancy sizes
Safety critical castings such as some chassis components are typically 100 radiographically inspected following ASTM E155 or ASTM E2422 These standards use actual cast blocks that have a range of sizes for several discrepancy types (gas holes shrink cavity porosity shrink sponge porosity high and low density inclusions) For each discrepancy type the castings have been subjectively ranked or given a grade depending on the severity (size) of the discrepancies Only by long experience has it been determined what radiographic grade is needed for each component Part of these short comings arises because the sizes of the discrepancies in the radiographic standards have not been published
In the USAMPAMD ldquoDesign and Product Optimization for Cast Light Metals Projectrdquo completed in 2001 there was an activity at Lawrence Livermore National Lab to re-radiograph the ASTM E155 castings and to analyze those radiographs for discrepancy size For the discrete discrepancies (gas holes shrink cavities and inclusions) the LLNL analysis included the projected area of the discrepancies the maximum feature size and an effective depth (from the calibrated attenuation measurements) Each of these measurements gives a different characteristic size
The final step to reduce this information to a single dimension or size was never completed We have re-analyzed this data for each of the different casting types for the discrete defects to determine if there is a consistent size that can be associated with each grade Using either a circle equivalent diameter or a sphere equivalent diameter gave similar results It was concluded that the area equivalent diameter is the most accurately measured property using ASTM E155 and provides the best scalar representation of the discrepant classes
Finite element sort modules To have a useful physics-based tool it is necessary to integrate all the physics into a software tool bench This will begin with the part design (CAD model) and the engineering requirements(peak loads and associated locations) These inputs then must be converted into finite element models for the part and for discrepancies that would limit the performance of the part
These inputs and the other elements of the processing are shown schematically in Figure 8The important physics that will be included are the sensitivity to discrepancy type size and location that was described above efficient means to predict the frequency variability and the efficient means to optimize the sort module and to include process compensation Process compensation is the inclusion of some resonance lines to compensate for allowable geometry and material property variations
These tools will be built within a commercial finite element environment maximizing the use of existing tools that are available for modal analysis
10-51
Figure 8 Inputs and data processing for the proposed FEM tool to create physics-based RI sort modules
Figure 8 Inputs and data processing for the proposed FEM tool to create physics-based RI sort modules
Standardized Procedures The last task of the project is produce a standard that will lead to accurate repeatable and traceable inspections in the production environment There already exists one standard6 for resonance inspection but it is mostly a generic guide to the technology There have been several OEM procedures drafted that address implementation procedures These have been synthesized into a standard process flow chart This will be used for the creation of sort modules for the three castings being tested in the project
Despite these documents there is a gap in the available standards and procedures relevant to making production inspections reliable repeatable and traceable This gap includes the consistent use and documentation on 1) the inspection procedure used 2) measurements on the repeatability and reproducibility 3) the numbers and types of discrepancies used to measure the accuracy of the final sort module as well as the error rates for this validation setand 4) preservation of results from production inspections
In June 2009 a workshop was held to review the state of RI standardization and to propose the areas to be included in a new standard The workshop concluded that this document is an essential element for productionizing RI
Conclusions Resonance inspection is a promising technology for ensuring the quality of light metal castings that require high reliability This project addresses three of the technical barriers limiting the implementation of RI These include the need for probability of detection predictions for given inspections the need for more reliable sort modules and the need for standard traceable inspection procedures When completed this project will deliver tools that are or are very close to being commercially ready
10-52
PresentationsPublicationsPatents Dasch C X Sun C Lai J Saxton G Stultz G Palombo C Grupke G Harmon L Ouimet D Simon and M Jones 2008 ldquoTowards Quantitative Resonance Inspection Resonance Mode Identification and Modelingrdquo Review of Progress in Quantitative NDE
ldquoNDE 901 Enhanced Resonance Inspection for Light Metal Castingsrdquo 2009 AMD Offsite Southfield MI October 13
C Lai X Sun C Dasch G Harmon and M Jones ldquoQuantifying Resonance Inspection with Finite-Element-Based Modelingrdquo submitted to J Sound and Vibration Oct 2009
References 1 Denotes Project 701 of the Nondestructive Evaluation Working Group of the United States Automotive Materials Partnership (USAMP) one of the formal consortia of the United States Council for Automotive Research (USCAR wwwuscarorg) set up by Chrysler Ford and General Motors to conduct joint pre-competitive research and development
2 ASTM B155-05 ldquoStandard Reference Radiographs for Inspection of Aluminum and Magnesium Castingsrdquo
3 USAMP Project NDE701 ldquoEnhanced Resonance Inspection for Light Metal Castingsrdquo
4 See for example A Miglioriand J L Sarrao ldquoResonant Ultrasound Spectroscopyrdquo (John Wiley amp Sons 1997) or J He and Z Fu ldquoModal Analysisrdquo (Butterworth-Heinemann 2001)
5 ASTM E577M ldquoStandard Test Methods of Tension Testing Wrought and Cast Aluminum- andMagnesium-Alloy Productsrdquo
6 ASTM E2001-08 ldquoStandard Guide for Resonant Ultrasound Spectroscopy for Defect Detection in Both Metallic and Non-metallic Partsrdquo
10-53

Figure 8 Inputs and data processing for the proposed FEM tool to create physics-based RI sort modules
Figure 8 Inputs and data processing for the proposed FEM tool to create physics-based RI sort modules
Standardized Procedures The last task of the project is produce a standard that will lead to accurate repeatable and traceable inspections in the production environment There already exists one standard6 for resonance inspection but it is mostly a generic guide to the technology There have been several OEM procedures drafted that address implementation procedures These have been synthesized into a standard process flow chart This will be used for the creation of sort modules for the three castings being tested in the project
Despite these documents there is a gap in the available standards and procedures relevant to making production inspections reliable repeatable and traceable This gap includes the consistent use and documentation on 1) the inspection procedure used 2) measurements on the repeatability and reproducibility 3) the numbers and types of discrepancies used to measure the accuracy of the final sort module as well as the error rates for this validation setand 4) preservation of results from production inspections
In June 2009 a workshop was held to review the state of RI standardization and to propose the areas to be included in a new standard The workshop concluded that this document is an essential element for productionizing RI
Conclusions Resonance inspection is a promising technology for ensuring the quality of light metal castings that require high reliability This project addresses three of the technical barriers limiting the implementation of RI These include the need for probability of detection predictions for given inspections the need for more reliable sort modules and the need for standard traceable inspection procedures When completed this project will deliver tools that are or are very close to being commercially ready
10-52
PresentationsPublicationsPatents Dasch C X Sun C Lai J Saxton G Stultz G Palombo C Grupke G Harmon L Ouimet D Simon and M Jones 2008 ldquoTowards Quantitative Resonance Inspection Resonance Mode Identification and Modelingrdquo Review of Progress in Quantitative NDE
ldquoNDE 901 Enhanced Resonance Inspection for Light Metal Castingsrdquo 2009 AMD Offsite Southfield MI October 13
C Lai X Sun C Dasch G Harmon and M Jones ldquoQuantifying Resonance Inspection with Finite-Element-Based Modelingrdquo submitted to J Sound and Vibration Oct 2009
References 1 Denotes Project 701 of the Nondestructive Evaluation Working Group of the United States Automotive Materials Partnership (USAMP) one of the formal consortia of the United States Council for Automotive Research (USCAR wwwuscarorg) set up by Chrysler Ford and General Motors to conduct joint pre-competitive research and development
2 ASTM B155-05 ldquoStandard Reference Radiographs for Inspection of Aluminum and Magnesium Castingsrdquo
3 USAMP Project NDE701 ldquoEnhanced Resonance Inspection for Light Metal Castingsrdquo
4 See for example A Miglioriand J L Sarrao ldquoResonant Ultrasound Spectroscopyrdquo (John Wiley amp Sons 1997) or J He and Z Fu ldquoModal Analysisrdquo (Butterworth-Heinemann 2001)
5 ASTM E577M ldquoStandard Test Methods of Tension Testing Wrought and Cast Aluminum- andMagnesium-Alloy Productsrdquo
6 ASTM E2001-08 ldquoStandard Guide for Resonant Ultrasound Spectroscopy for Defect Detection in Both Metallic and Non-metallic Partsrdquo
10-53
Recommended