1
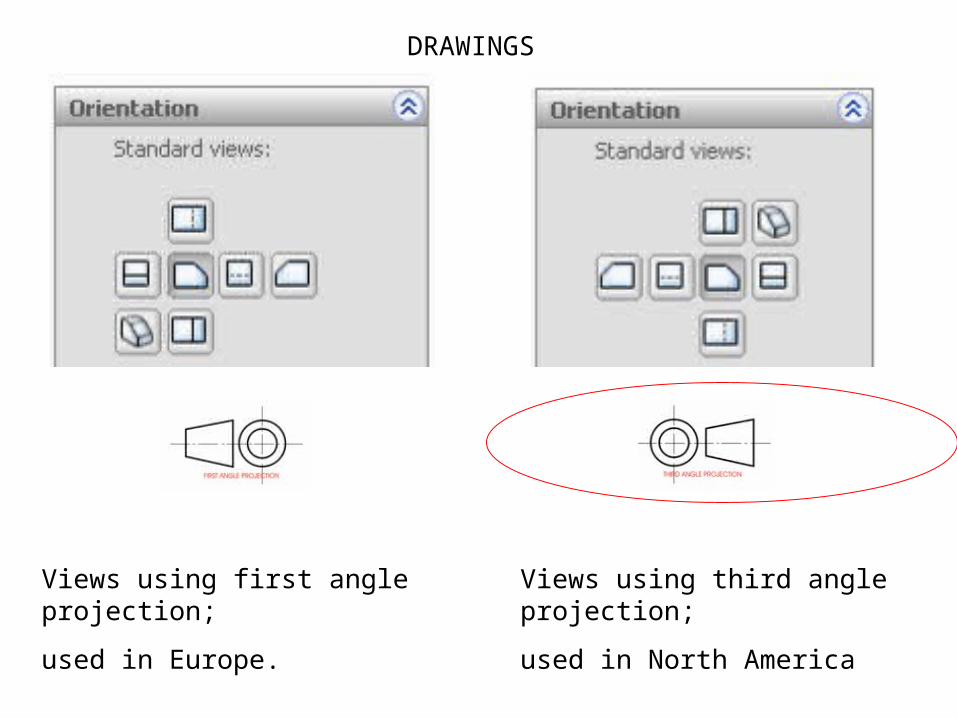
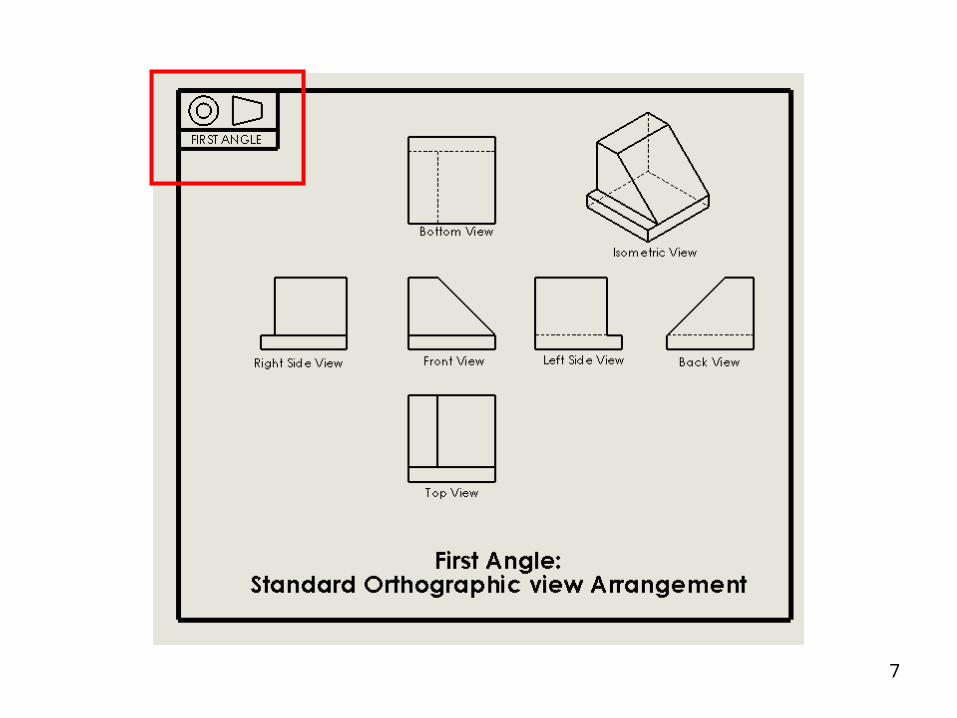
Views using first angle projection;
used in Europe.
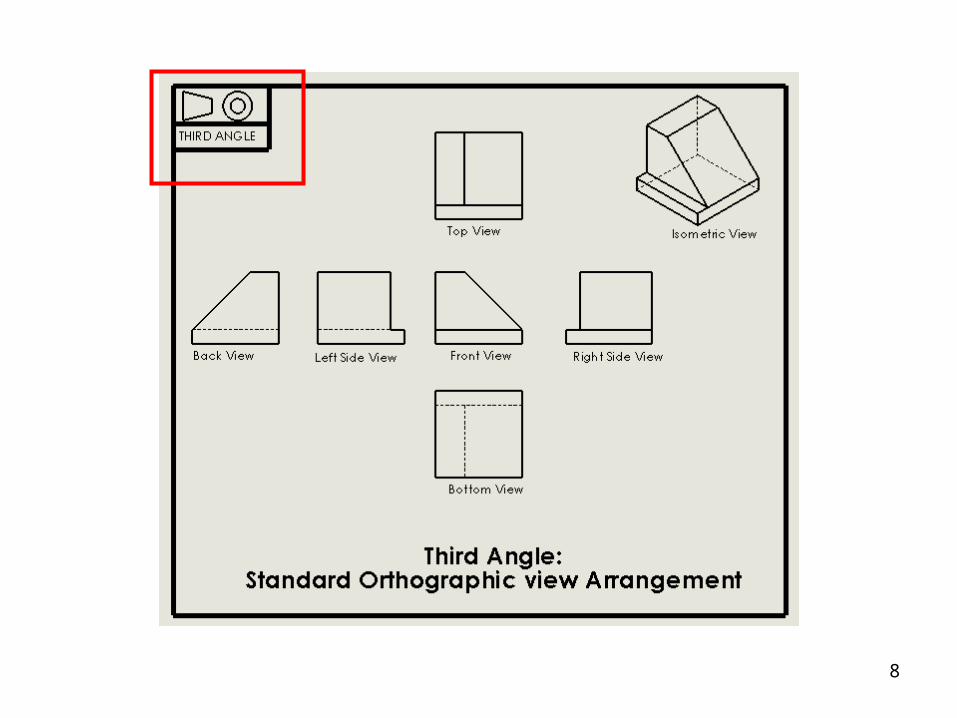
Views using third angle projection;
used in North America
DRAWINGS
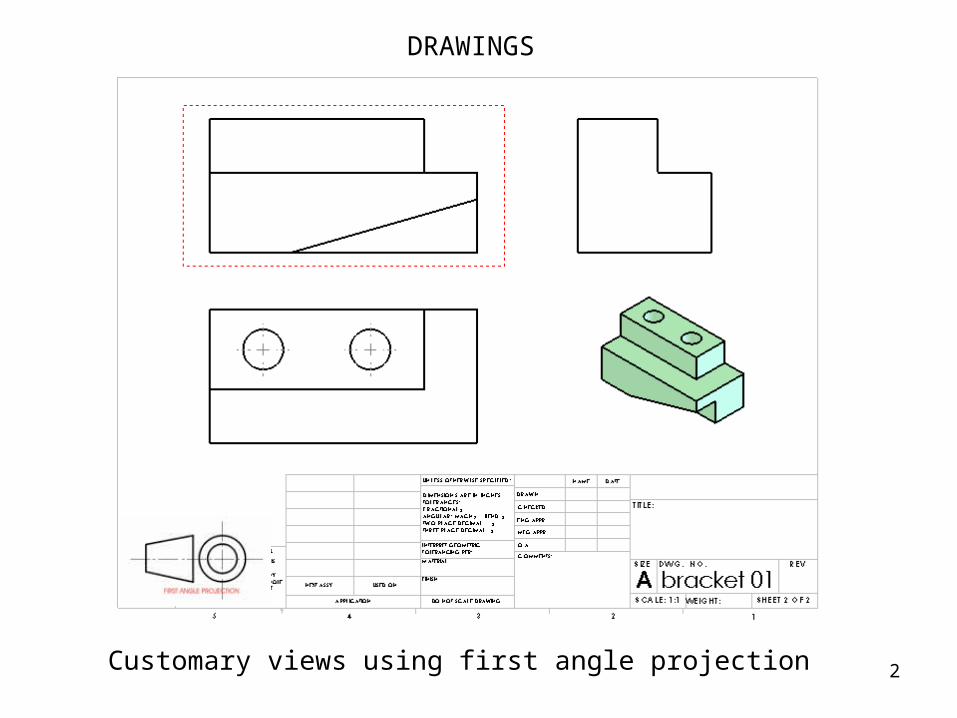
2Customary views using first angle projection
DRAWINGS
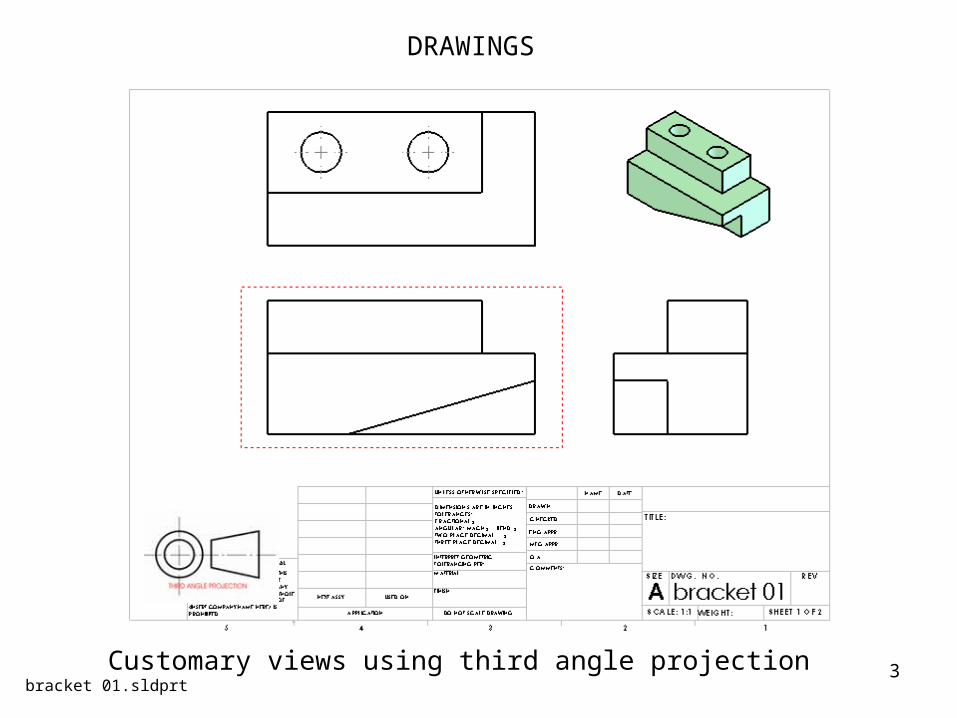
3Customary views using third angle projectionbracket 01.sldprt
DRAWINGS

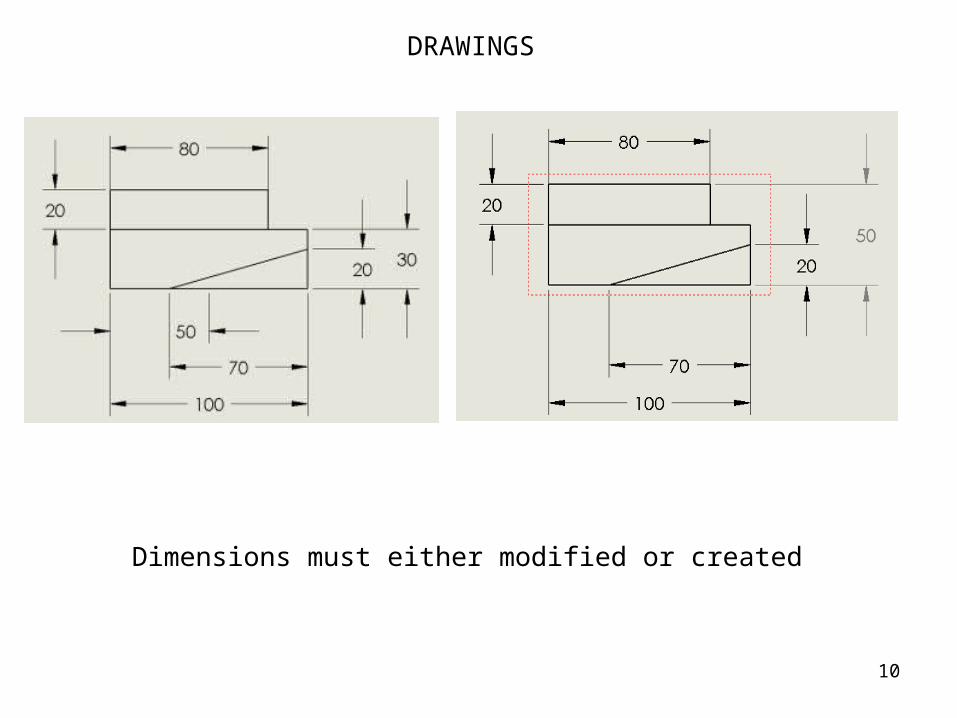
4Automatic dimensions are most often not acceptable
DRAWINGS
5
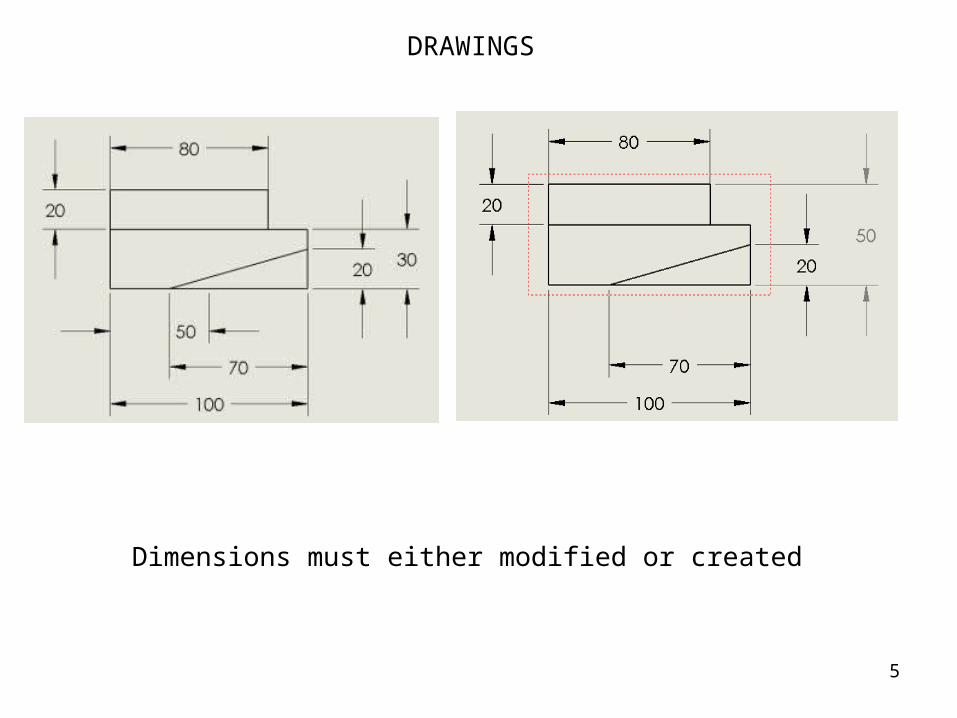
Dimensions must either modified or created
DRAWINGS
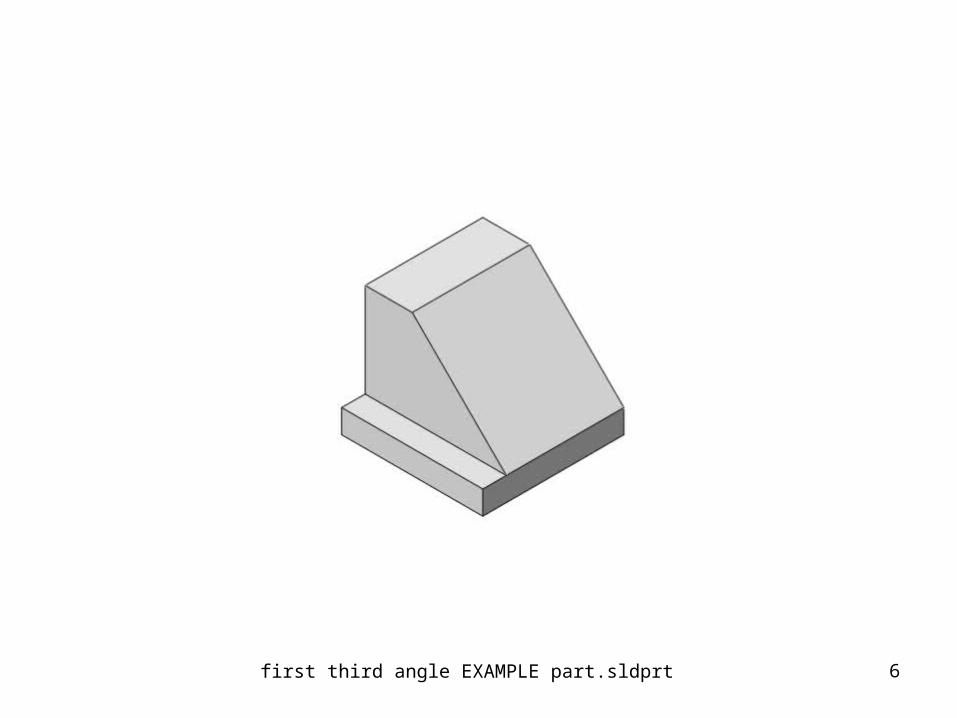
6first third angle EXAMPLE part.sldprt
7
8
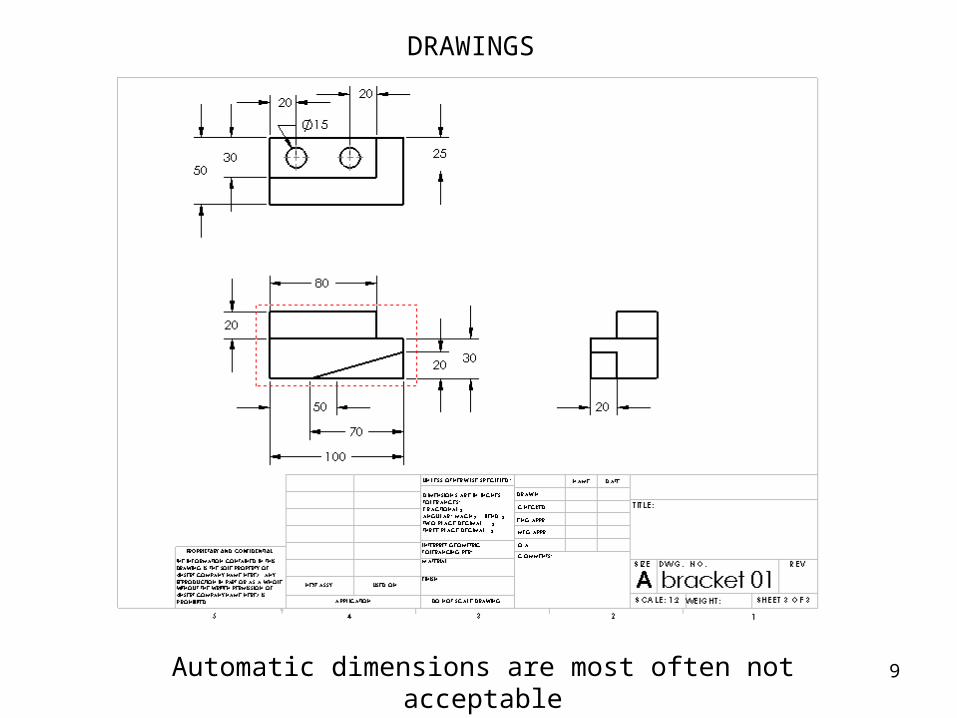
9Automatic dimensions are most often not acceptable
DRAWINGS
10
Dimensions must either modified or created
DRAWINGS
11
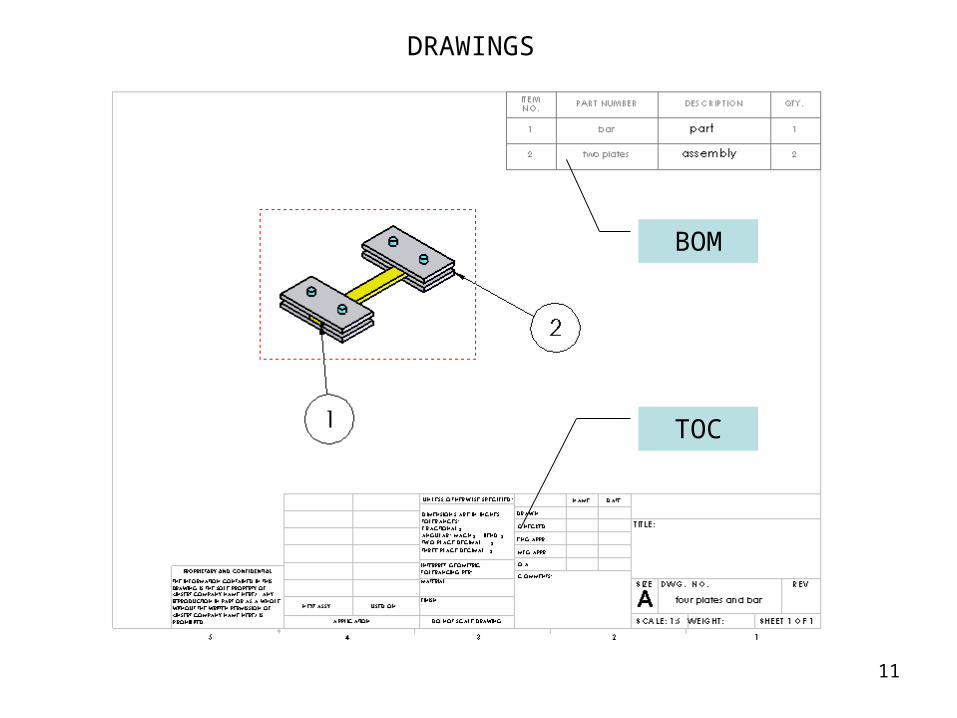
DRAWINGS
BOM
TOC
12
DRAWINGS
Learn to use all types of views in drawings
Learn BOM
Learn TOC
Learn dimensioning
…
…
Learn fits and GD&T; we’ll cover this later in the course
13
DESIGN FOR MANUFACTURING PROCESS
MATERIAL SELECTION
14
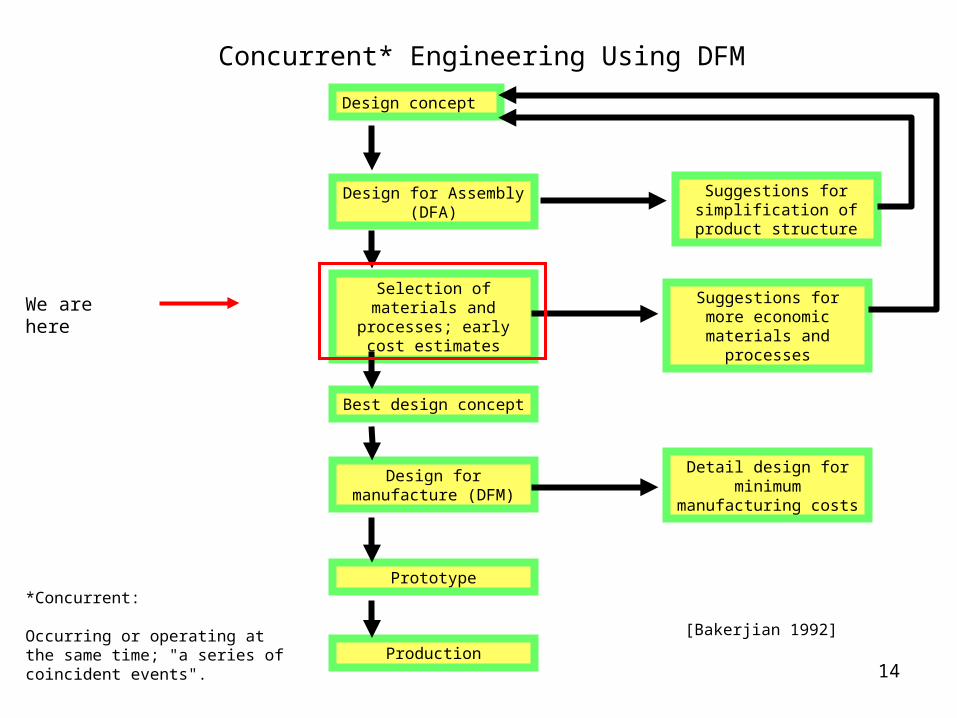
Concurrent* Engineering Using DFM
[Bakerjian 1992]
Design concept
Design for Assembly (DFA)
Selection of materials and processes; early cost
estimates
Best design concept
Design for manufacture (DFM)
Prototype
Production
Suggestions for simplification of product
structure
Suggestions for more economic materials and
processes
Detail design for minimum manufacturing
costs
We are here
*Concurrent:
Occurring or operating at the same time; "a series of coincident events".
15
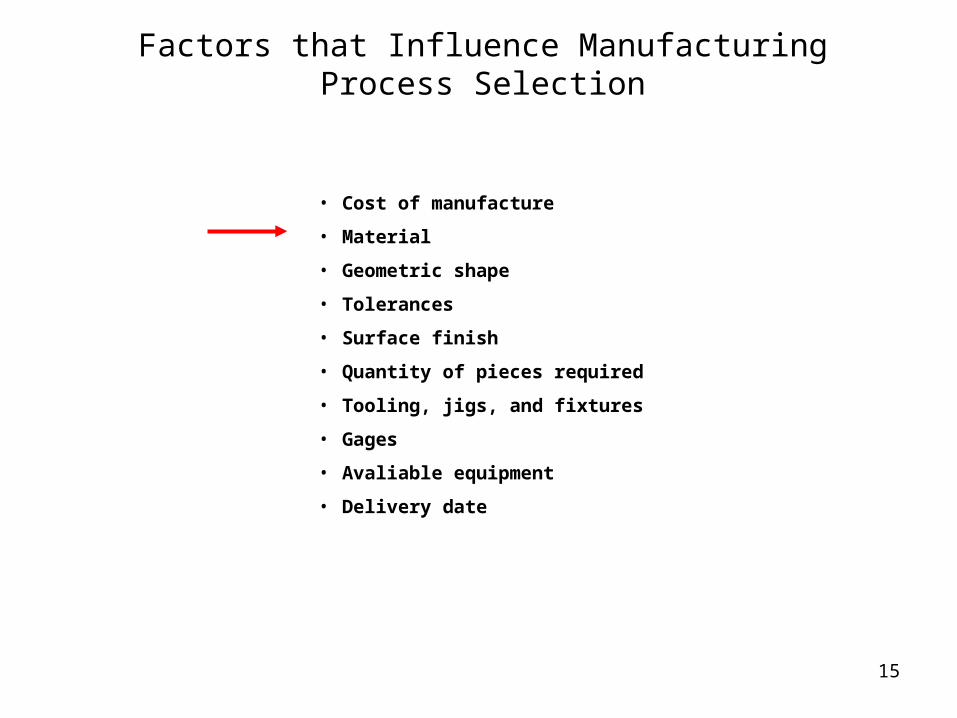
Factors that Influence Manufacturing Process Selection
• Cost of manufacture
• Material
• Geometric shape
• Tolerances
• Surface finish
• Quantity of pieces required
• Tooling, jigs, and fixtures
• Gages
• Avaliable equipment
• Delivery date
16
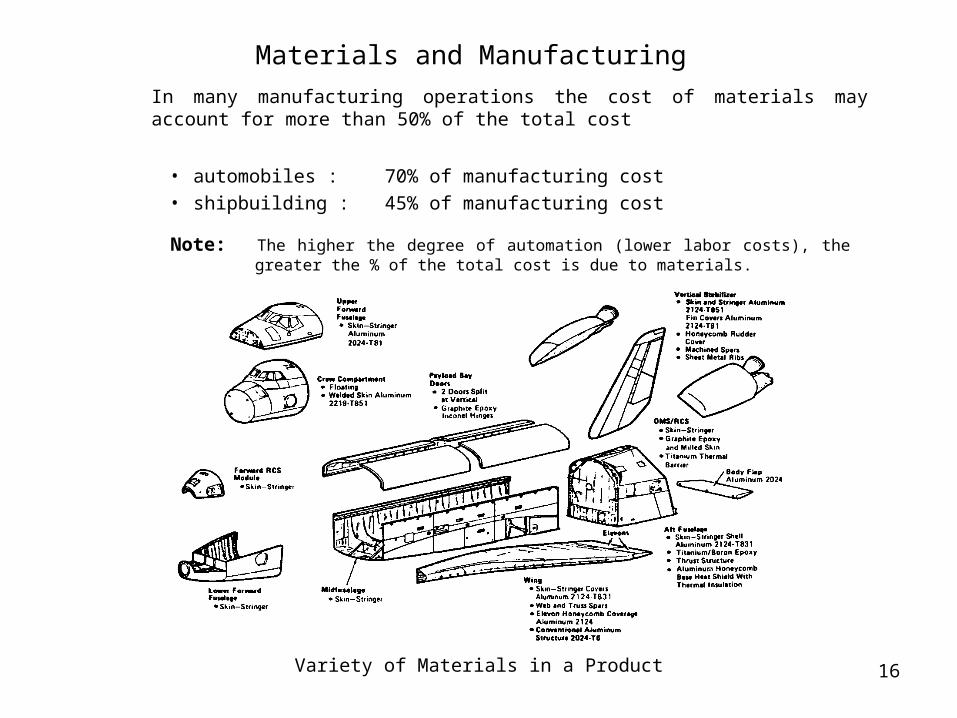
Materials and Manufacturing
In many manufacturing operations the cost of materials may account for more than 50% of the total cost
• automobiles : 70% of manufacturing cost
• shipbuilding : 45% of manufacturing cost
Note: The higher the degree of automation (lower labor costs), the greater the % of the total cost is due to materials.
Variety of Materials in a Product
17
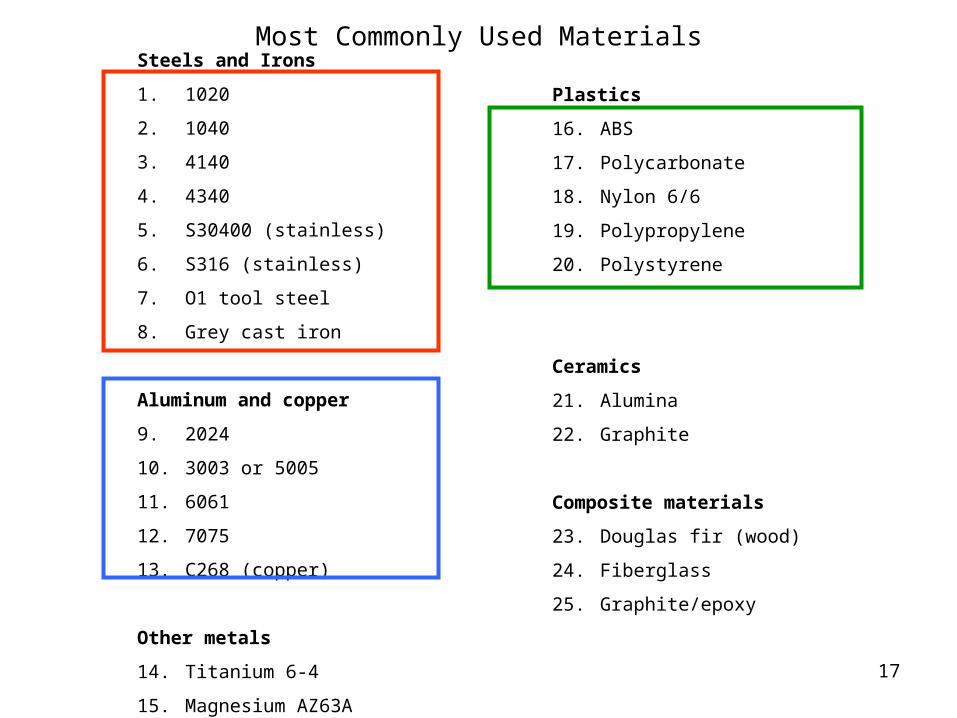
Most Commonly Used MaterialsSteels and Irons
1. 1020
2. 1040
3. 4140
4. 4340
5. S30400 (stainless)
6. S316 (stainless)
7. O1 tool steel
8. Grey cast iron
Aluminum and copper
9. 2024
10. 3003 or 5005
11. 6061
12. 7075
13. C268 (copper)
Other metals
14. Titanium 6-4
15. Magnesium AZ63A
Plastics
16. ABS
17. Polycarbonate
18. Nylon 6/6
19. Polypropylene
20. Polystyrene
Ceramics
21. Alumina
22. Graphite
Composite materials
23. Douglas fir (wood)
24. Fiberglass
25. Graphite/epoxy
18
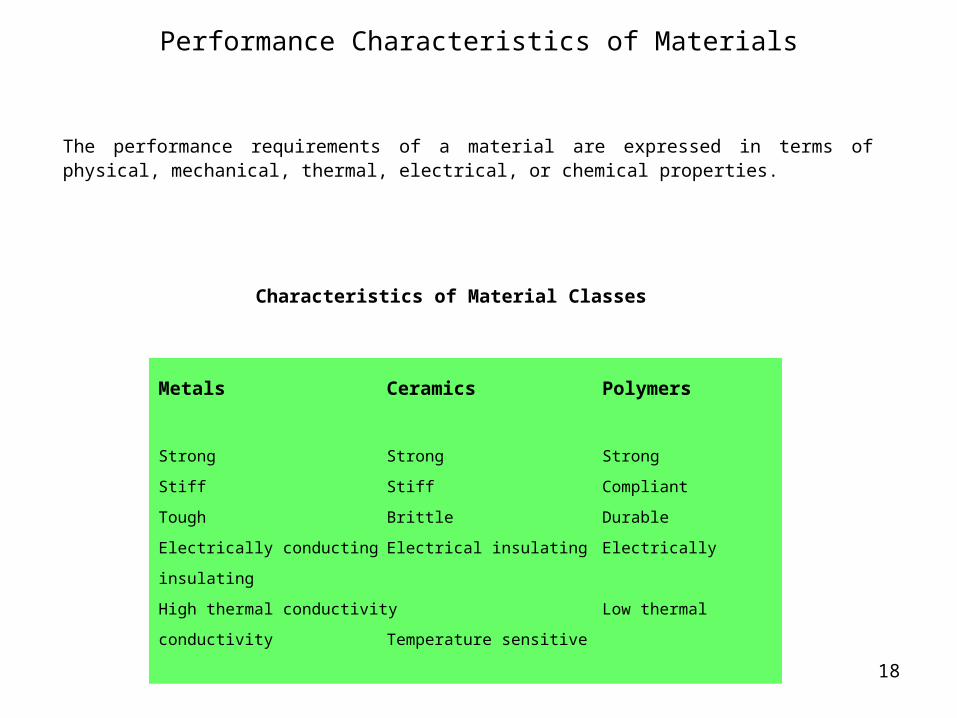
Performance Characteristics of Materials
The performance requirements of a material are expressed in terms of physical, mechanical, thermal, electrical, or chemical properties.
Characteristics of Material Classes
Metals Ceramics Polymers
Strong Strong Strong
Stiff Stiff Compliant
Tough Brittle Durable
Electrically conducting Electrical insulating Electrically insulating
High thermal conductivity Low thermal conductivity Temperature sensitive
19
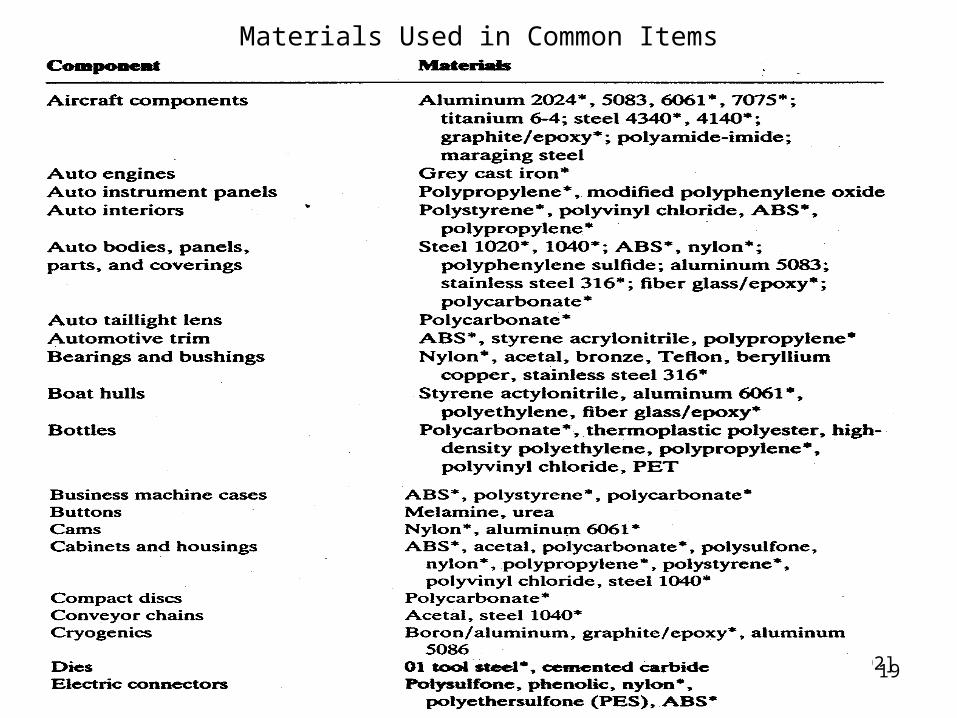
Materials Used in Common Items
[Ullman 1992]
20
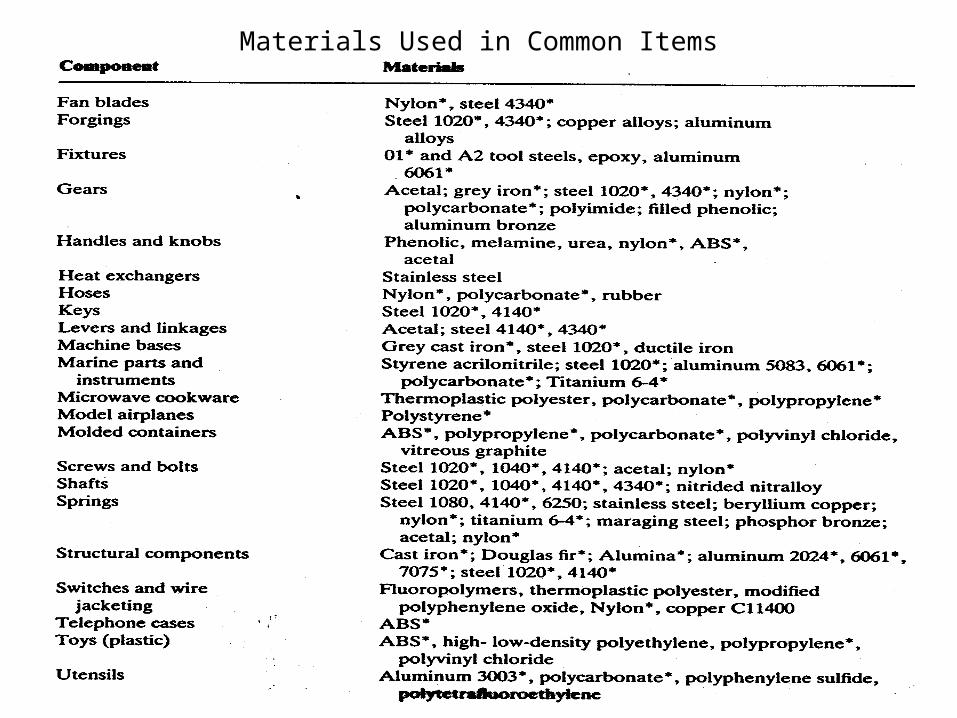
Materials Used in Common Items
21
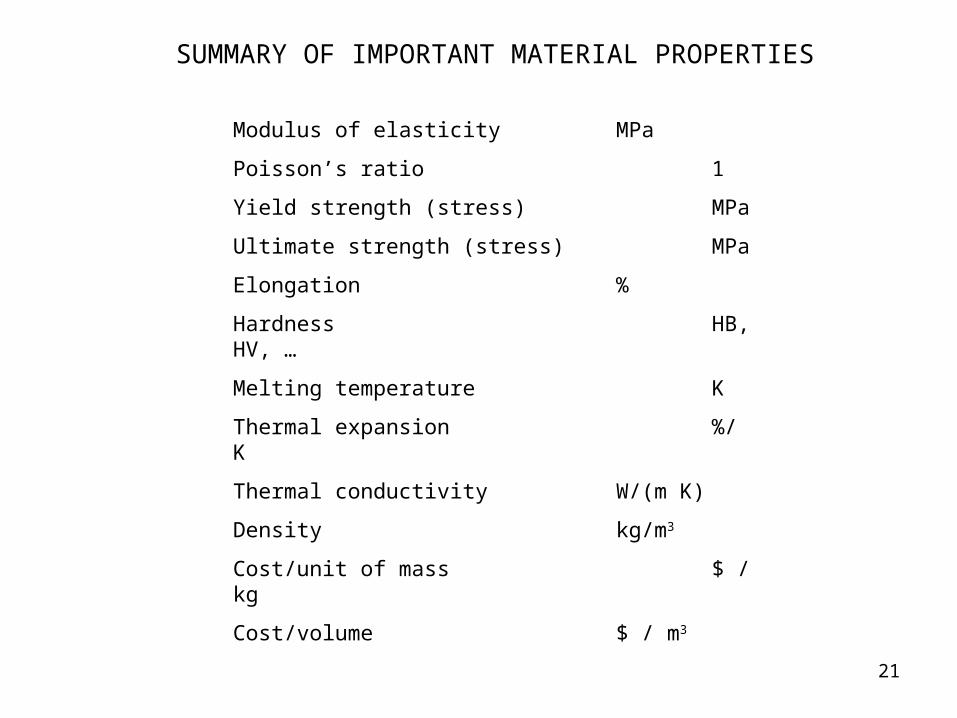
SUMMARY OF IMPORTANT MATERIAL PROPERTIES
Modulus of elasticity MPa
Poisson’s ratio 1
Yield strength (stress) MPa
Ultimate strength (stress) MPa
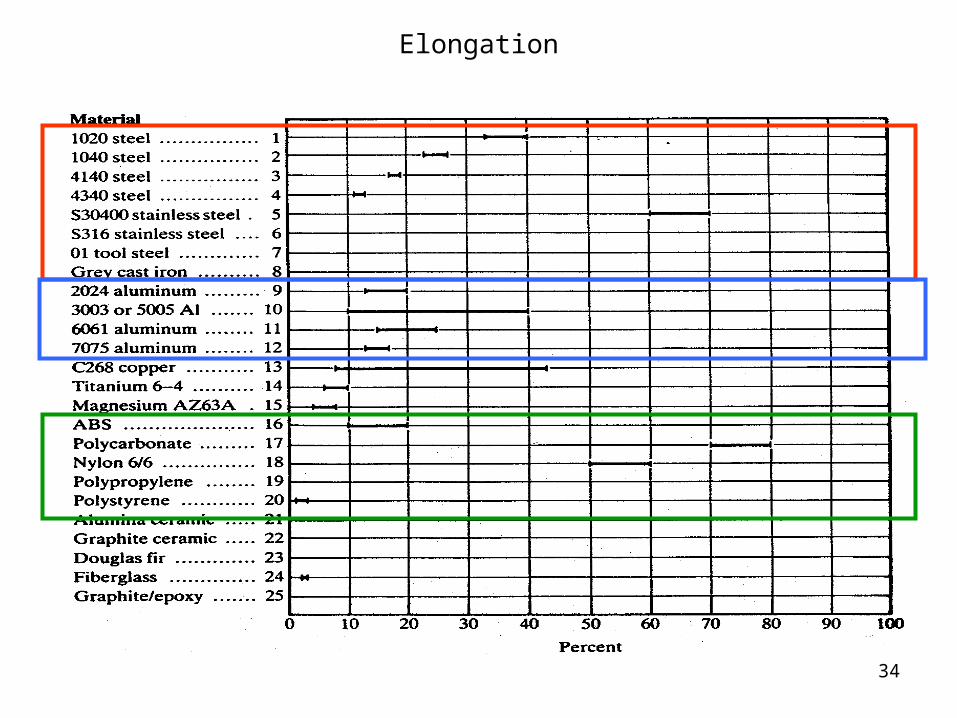
Elongation %
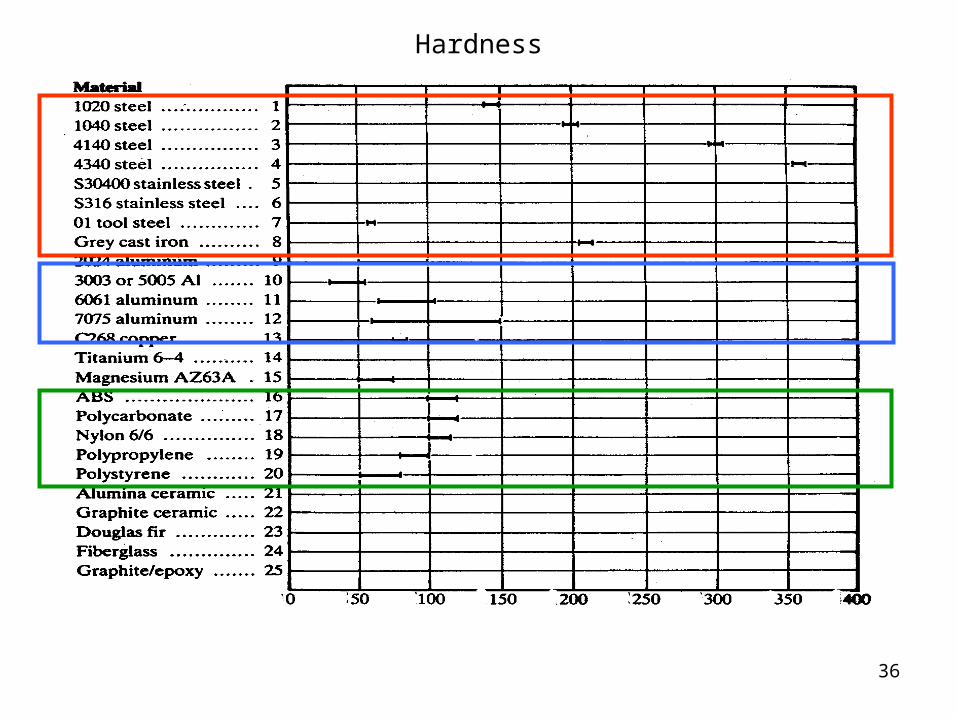
Hardness HB, HV, …
Melting temperature K
Thermal expansion %/ K
Thermal conductivity W/(m K)
Density kg/m3
Cost/unit of mass $ / kg
Cost/volume $ / m3
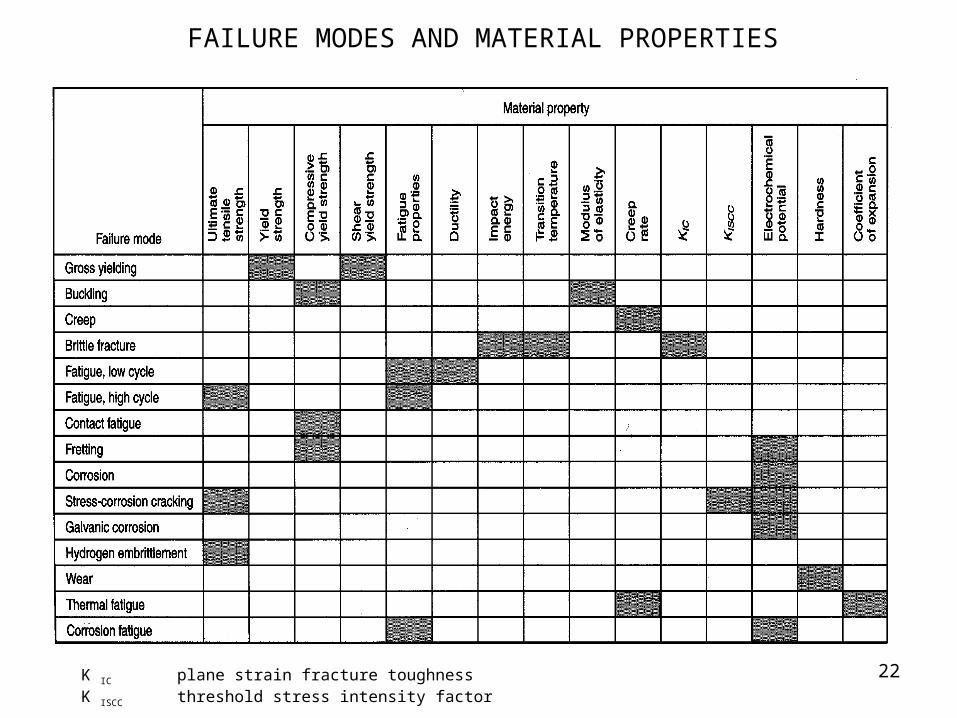
22K IC plane strain fracture toughnessK ISCC threshold stress intensity factor
FAILURE MODES AND MATERIAL PROPERTIES
23
Thomas Young (1773 - 1829)
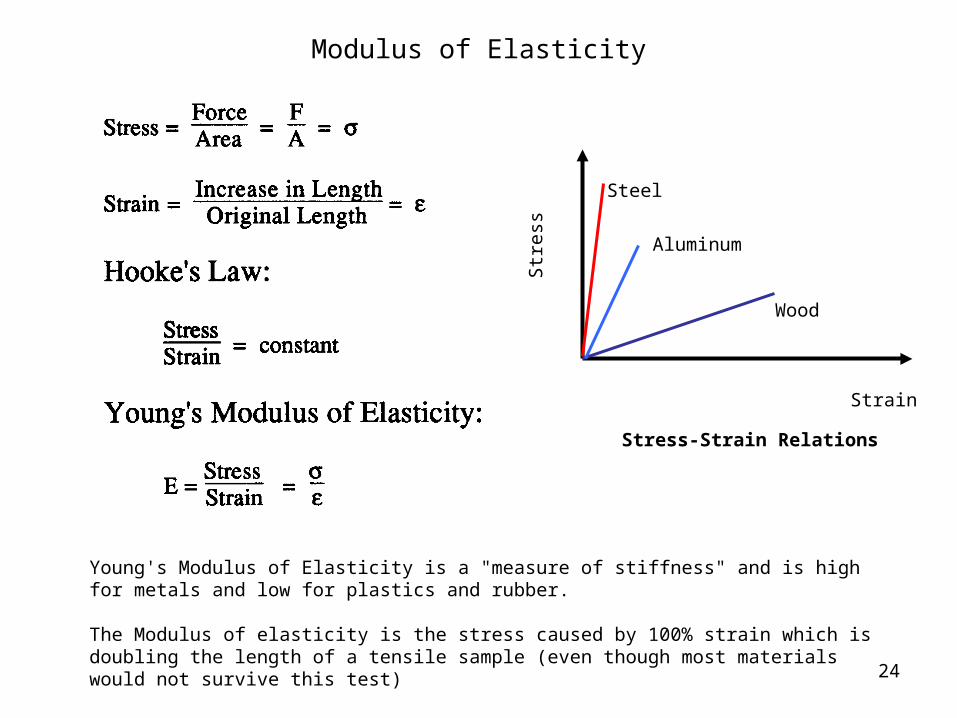
Modulus of Elasticity
24
Modulus of Elasticity
Stress-Strain Relations
Steel
Aluminum
Wood
Strain
Str
ess
Young's Modulus of Elasticity is a "measure of stiffness" and is high for metals and low for plastics and rubber.
The Modulus of elasticity is the stress caused by 100% strain which is doubling the length of a tensile sample (even though most materials would not survive this test)
25
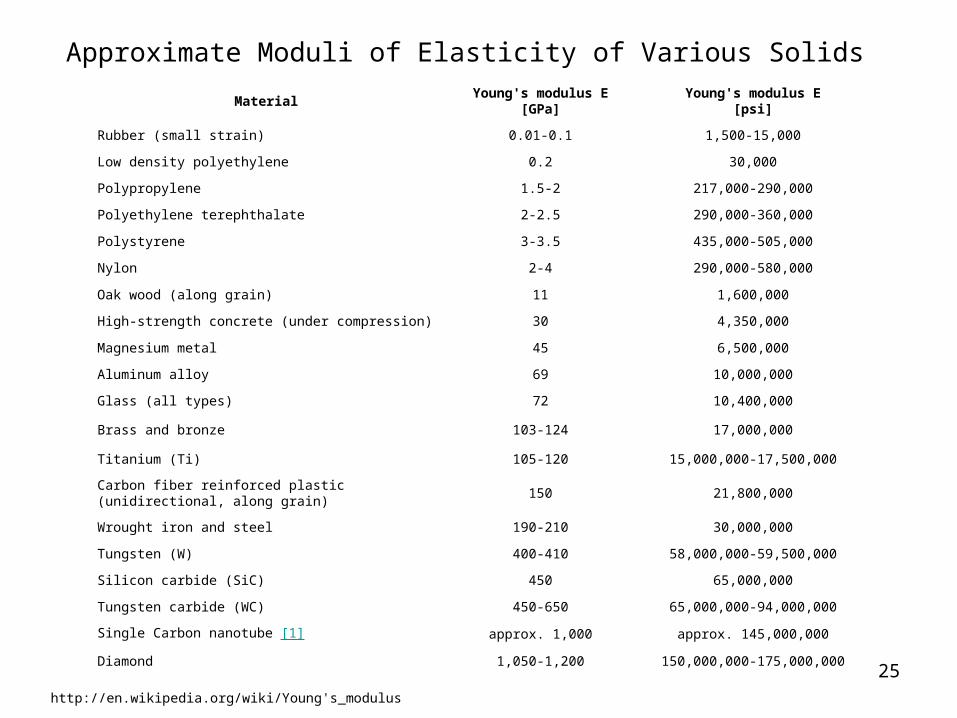
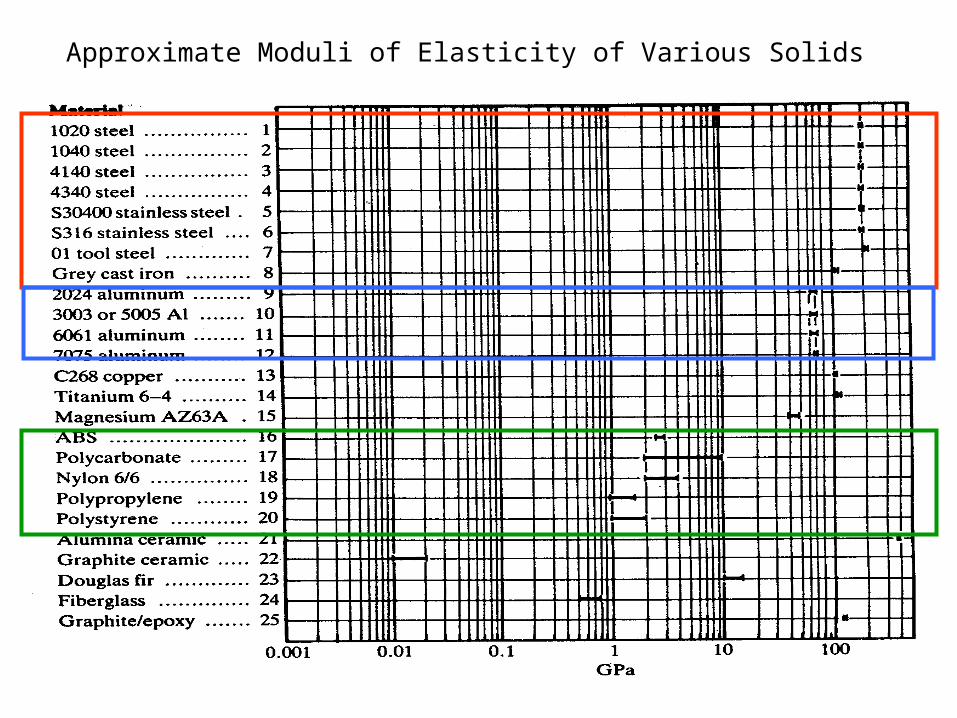
Approximate Moduli of Elasticity of Various Solids
MaterialYoung's modulus E
[GPa]Young's modulus E
[psi]
Rubber (small strain) 0.01-0.1 1,500-15,000
Low density polyethylene 0.2 30,000
Polypropylene 1.5-2 217,000-290,000
Polyethylene terephthalate 2-2.5 290,000-360,000
Polystyrene 3-3.5 435,000-505,000
Nylon 2-4 290,000-580,000
Oak wood (along grain) 11 1,600,000
High-strength concrete (under compression) 30 4,350,000
Magnesium metal 45 6,500,000
Aluminum alloy 69 10,000,000
Glass (all types) 72 10,400,000
Brass and bronze 103-124 17,000,000
Titanium (Ti) 105-120 15,000,000-17,500,000
Carbon fiber reinforced plastic (unidirectional, along grain)
150 21,800,000
Wrought iron and steel 190-210 30,000,000
Tungsten (W) 400-410 58,000,000-59,500,000
Silicon carbide (SiC) 450 65,000,000
Tungsten carbide (WC) 450-650 65,000,000-94,000,000
Single Carbon nanotube [1] approx. 1,000 approx. 145,000,000
Diamond 1,050-1,200 150,000,000-175,000,000
http://en.wikipedia.org/wiki/Young's_modulus
26
Approximate Moduli of Elasticity of Various Solids
27
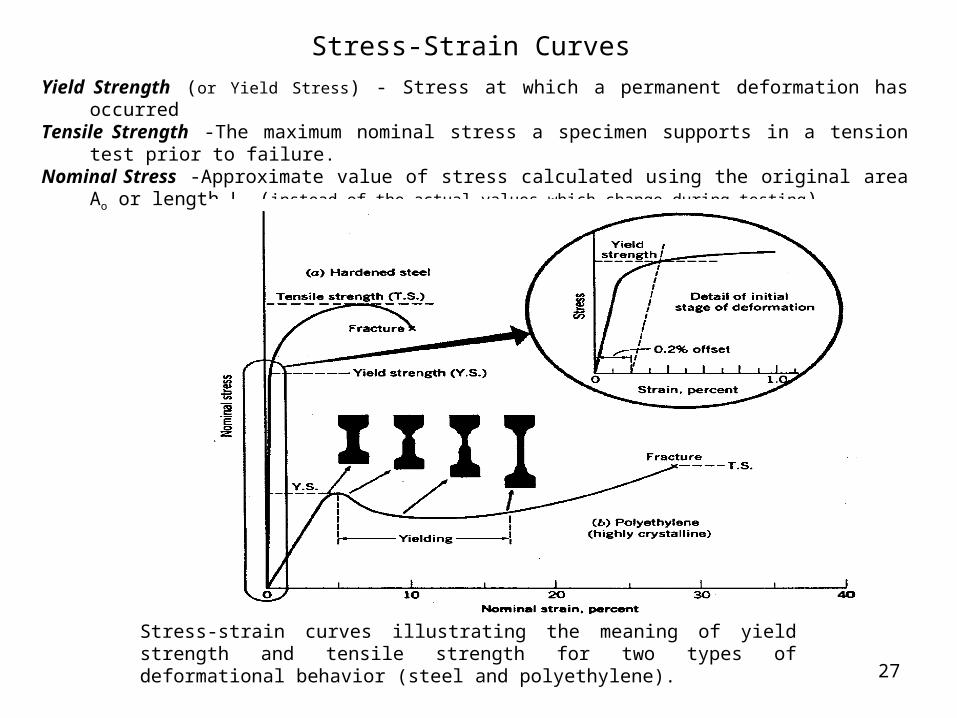
Stress-Strain Curves
Yield Strength (or Yield Stress) - Stress at which a permanent deformation has occurredTensile Strength -The maximum nominal stress a specimen supports in a tension test prior to failure. Nominal Stress -Approximate value of stress calculated using the original area Ao or length Lo (instead of
the actual values which change during testing).
Stress-strain curves illustrating the meaning of yield strength and tensile strength for two types of deformational behavior (steel and polyethylene).
28
STRAIN
ST
RE
SS
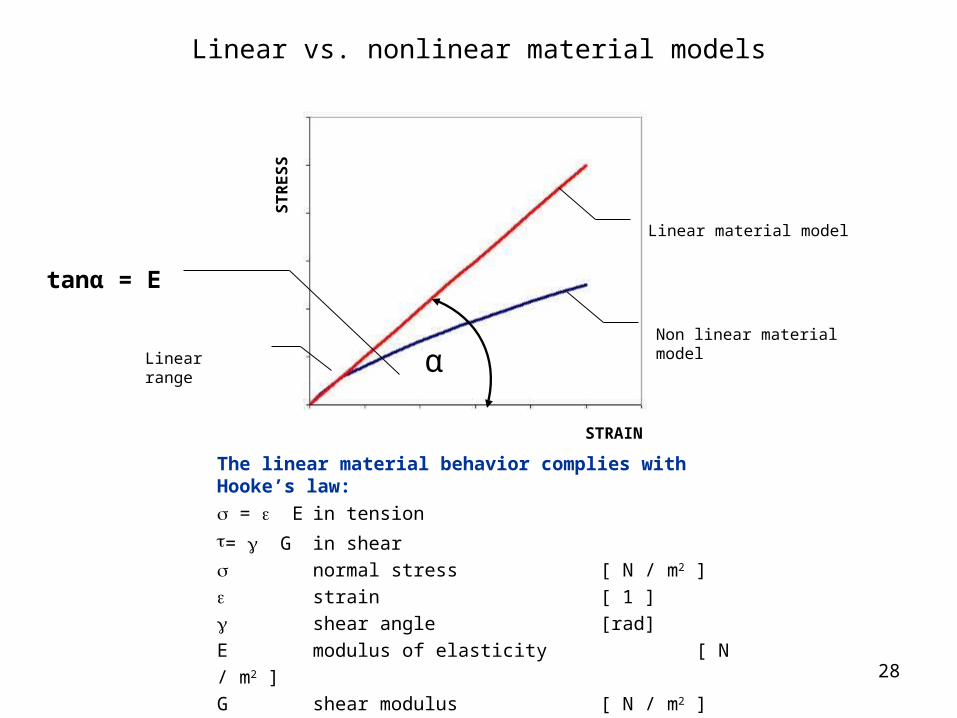
Linear material model
Non linear material model
The linear material behavior complies with Hooke’s law:
= E in tension
= G in shear
normal stress [ N / m2 ]
strain [ 1 ]
shear angle [rad]
E modulus of elasticity [ N / m2 ]
G shear modulus [ N / m2 ]
Linearrange
Linear vs. nonlinear material models
α
tanα = E
29
Simeon Poisson (1781 – 1840)
Poisson’s ratio
30
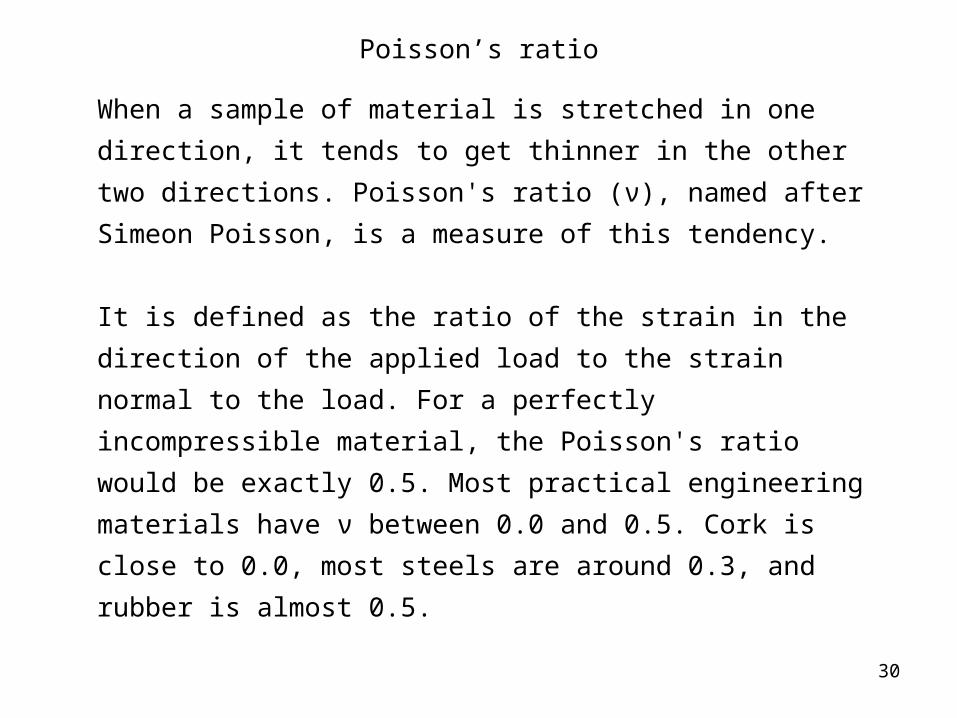
When a sample of material is stretched in one direction, it tends to
get thinner in the other two directions. Poisson's ratio (ν), named
after Simeon Poisson, is a measure of this tendency.
It is defined as the ratio of the strain in the direction of the applied
load to the strain normal to the load. For a perfectly
incompressible material, the Poisson's ratio would be exactly 0.5.
Most practical engineering materials have ν between 0.0 and 0.5.
Cork is close to 0.0, most steels are around 0.3, and rubber is
almost 0.5.
Poisson’s ratio
31
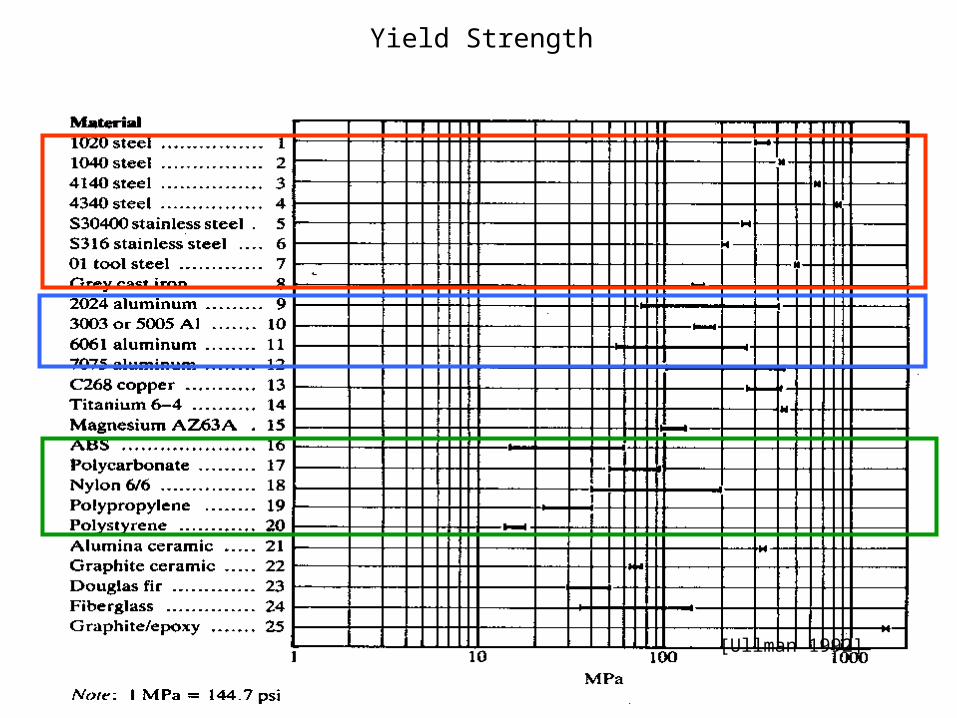
Yield Strength
[Ullman 1992]
32
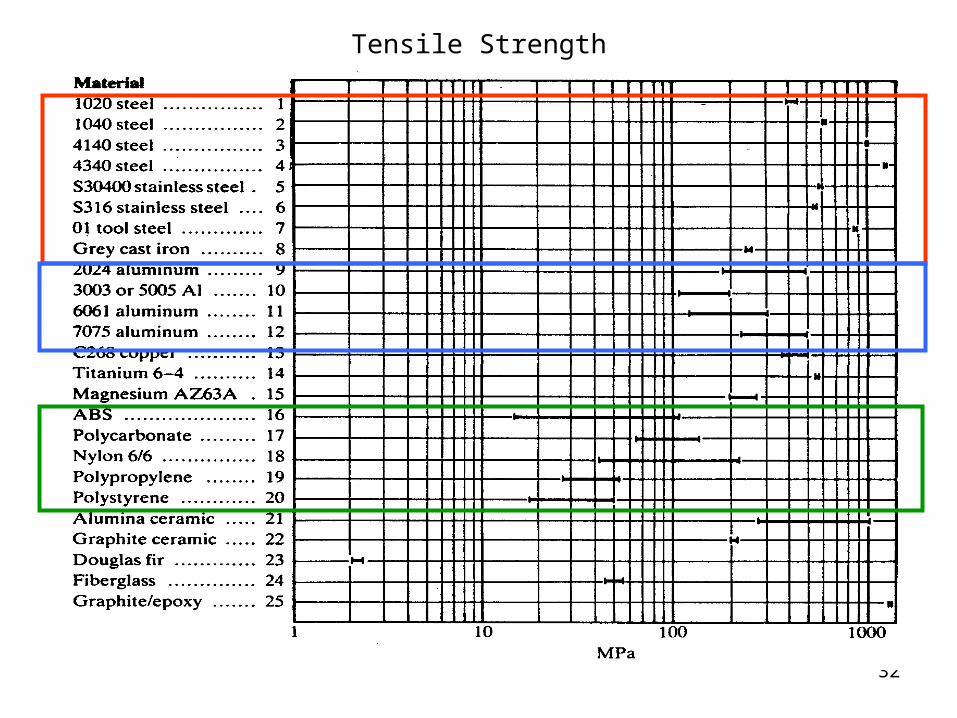
Tensile Strength
33
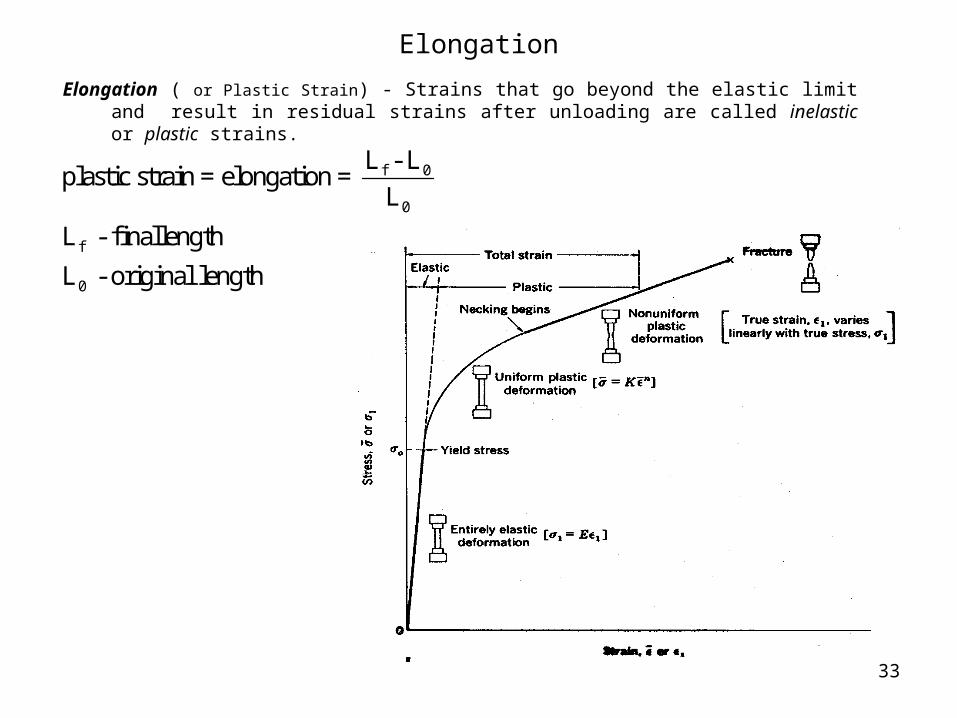
Elongation ( or Plastic Strain) - Strains that go beyond the elastic limit and result in residual strains after unloading are called inelastic or plastic strains.
f 0
0
f
0
L - Lplastic strain = elongation =
L
L - finallength
L - original length
Elongation
34
Elongation
35
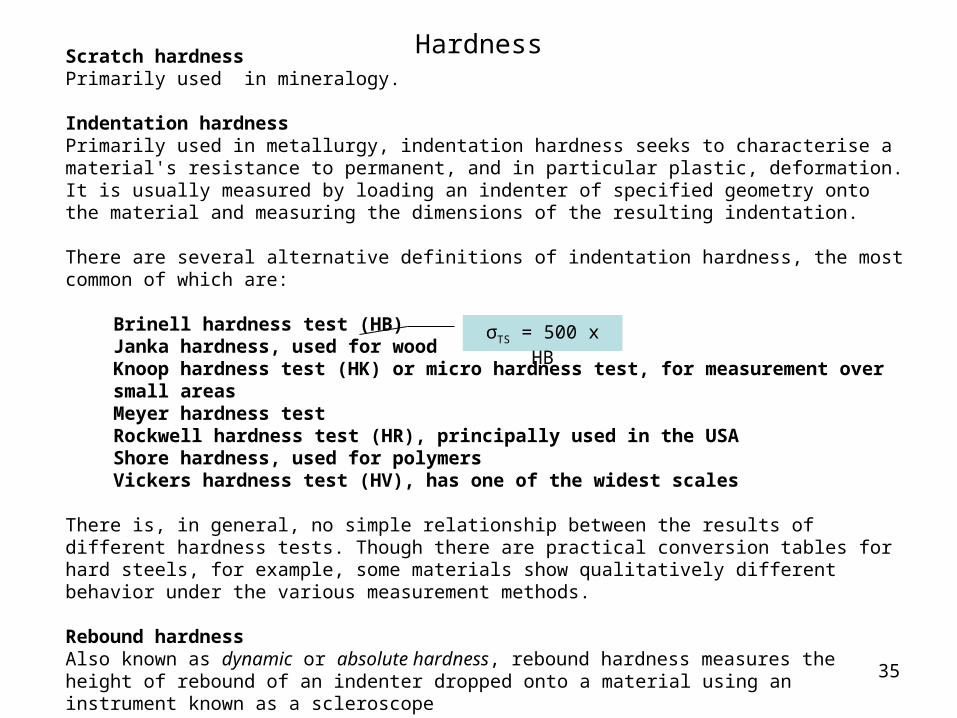
Scratch hardnessPrimarily used in mineralogy.
Indentation hardnessPrimarily used in metallurgy, indentation hardness seeks to characterise a material's resistance to permanent, and in particular plastic, deformation. It is usually measured by loading an indenter of specified geometry onto the material and measuring the dimensions of the resulting indentation.
There are several alternative definitions of indentation hardness, the most common of which are:
Brinell hardness test (HB) Janka hardness, used for wood Knoop hardness test (HK) or micro hardness test, for measurement over small areas Meyer hardness test Rockwell hardness test (HR), principally used in the USA Shore hardness, used for polymers Vickers hardness test (HV), has one of the widest scales
There is, in general, no simple relationship between the results of different hardness tests. Though there are practical conversion tables for hard steels, for example, some materials show qualitatively different behavior under the various measurement methods.
Rebound hardnessAlso known as dynamic or absolute hardness, rebound hardness measures the height of rebound of an indenter dropped onto a material using an instrument known as a scleroscope
Hardness
σTS = 500 x HB
36
Hardness
37
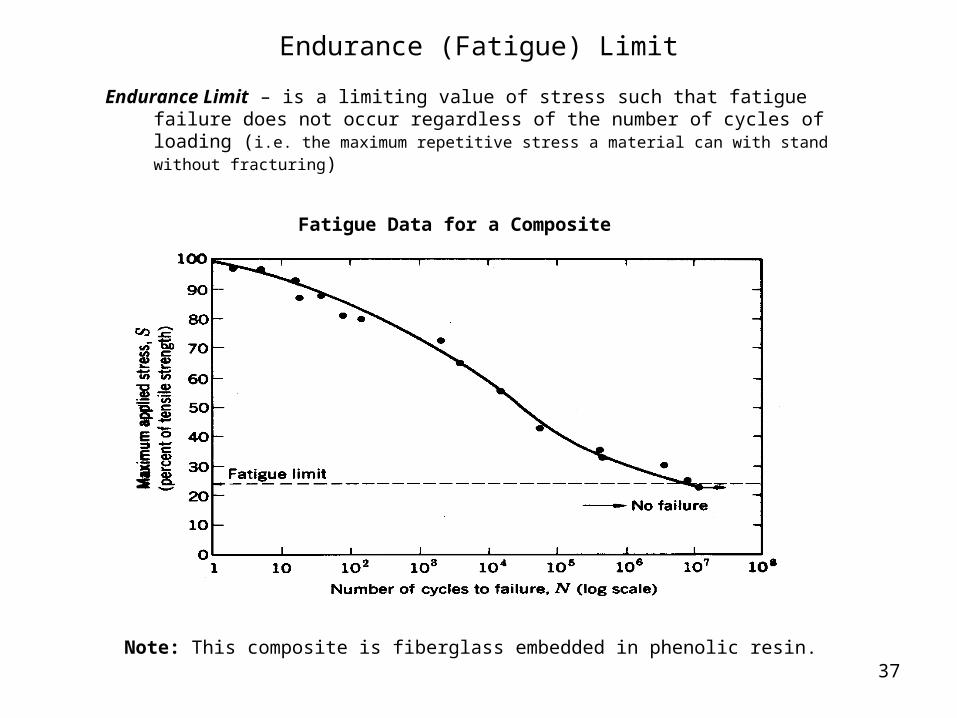
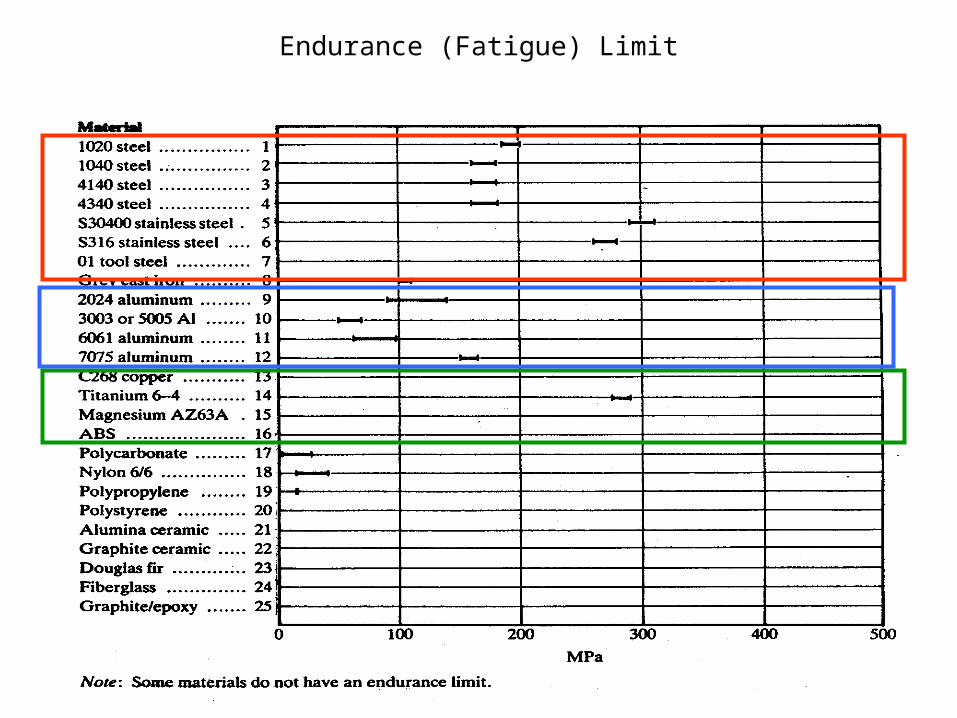
Endurance (Fatigue) Limit
Endurance Limit – is a limiting value of stress such that fatigue failure does not occur regardless of the number of cycles of loading (i.e. the maximum repetitive stress a material can
with stand without fracturing)
Fatigue Data for a Composite
Note: This composite is fiberglass embedded in phenolic resin.
38
Endurance (Fatigue) Limit
39
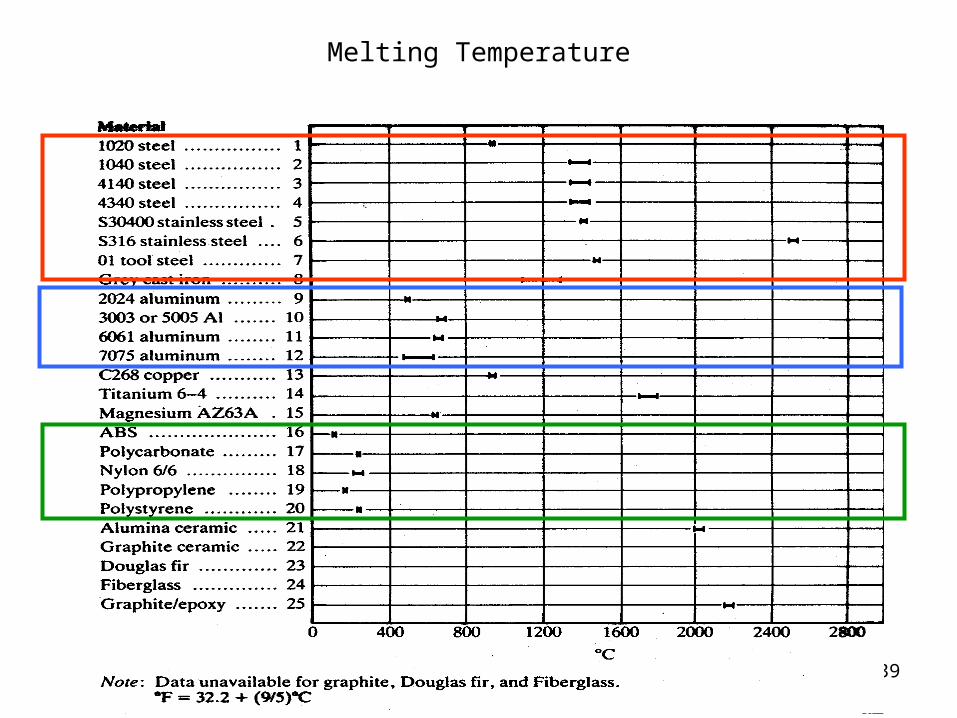
Melting Temperature
40
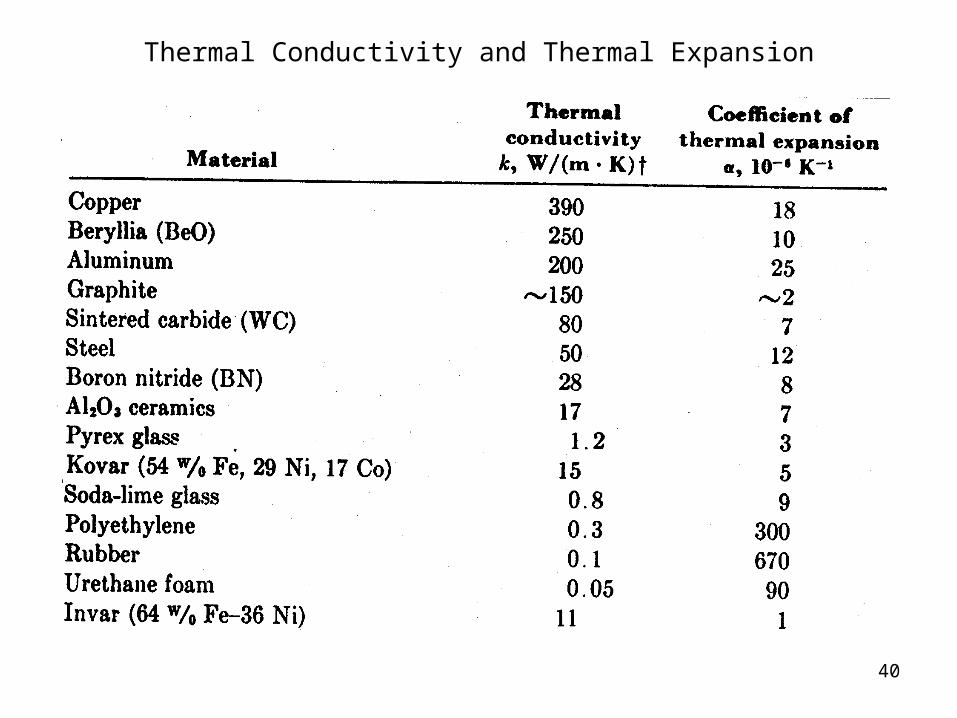
Thermal Conductivity and Thermal Expansion
41
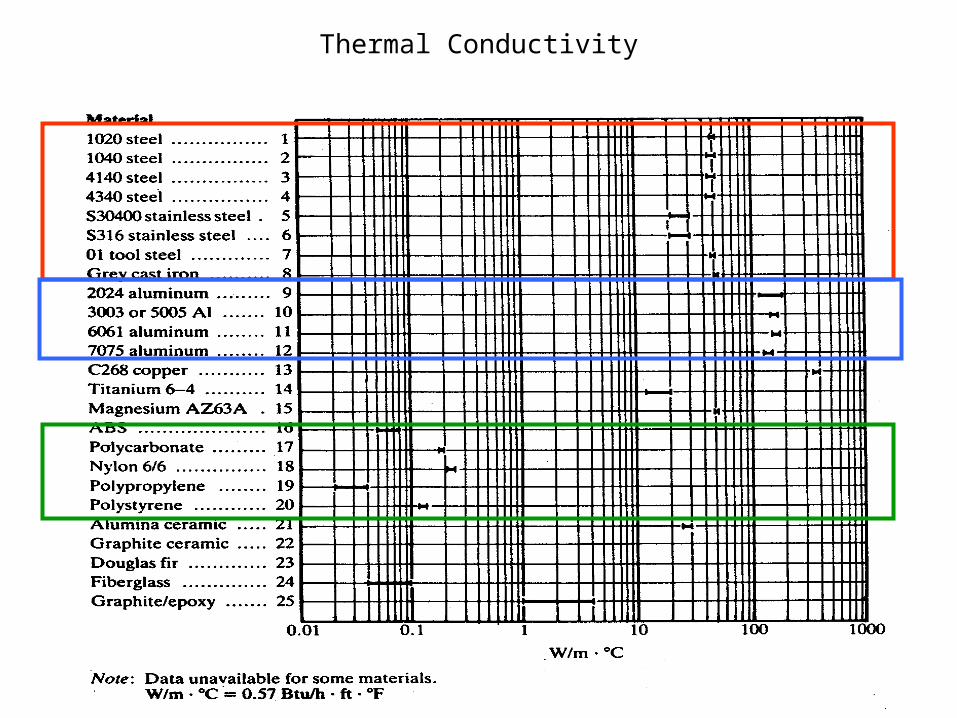
Thermal Conductivity
42
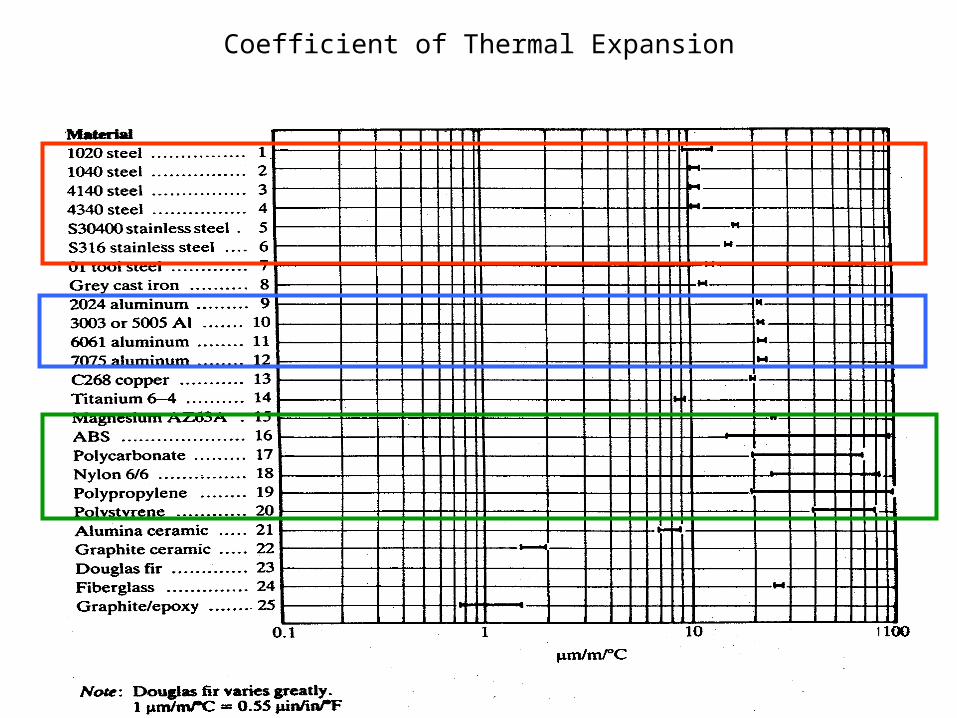
Coefficient of Thermal Expansion
43
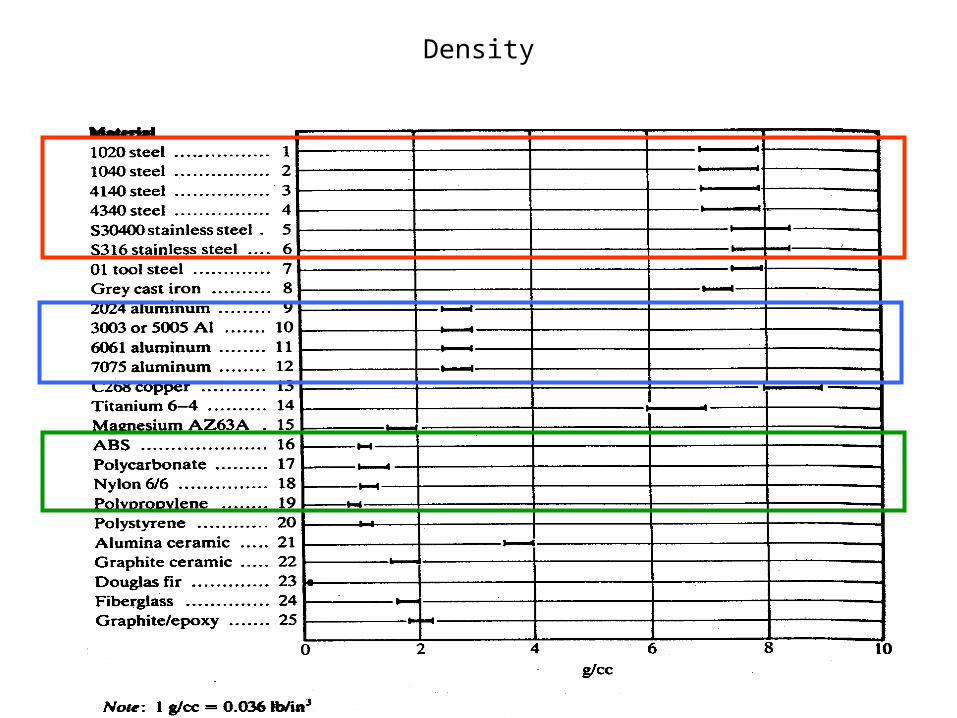
Density
44
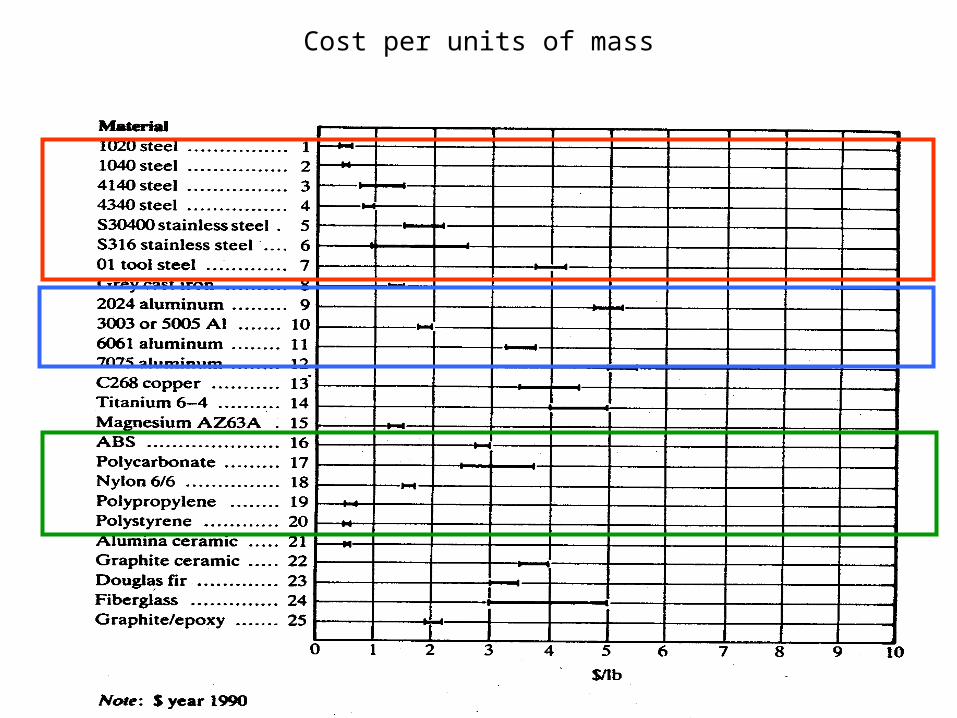
Cost per units of mass
45
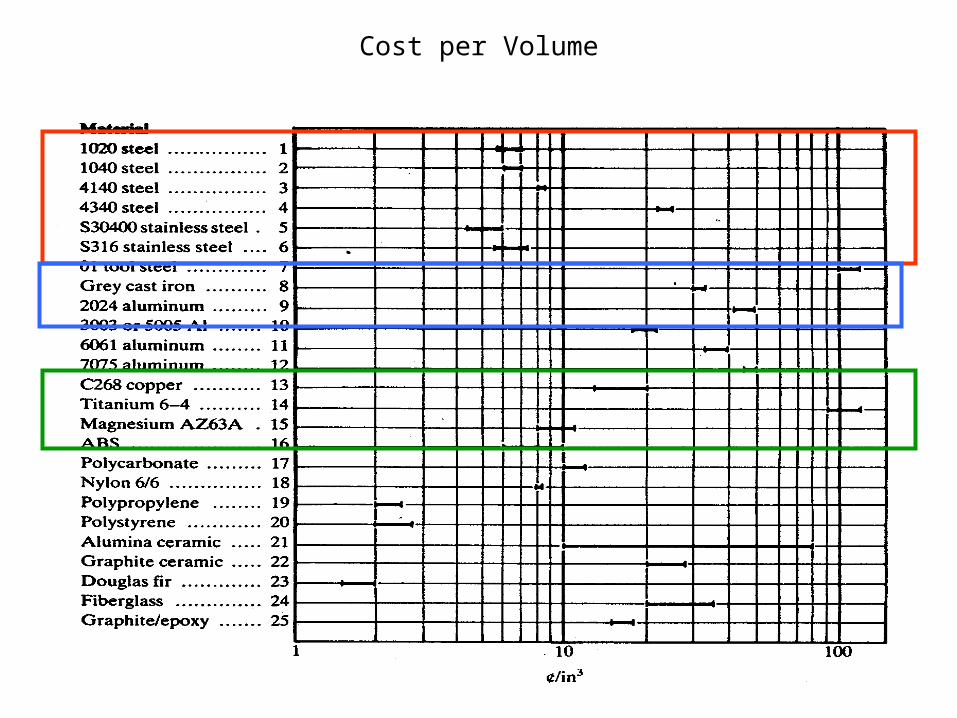
Cost per Volume
46
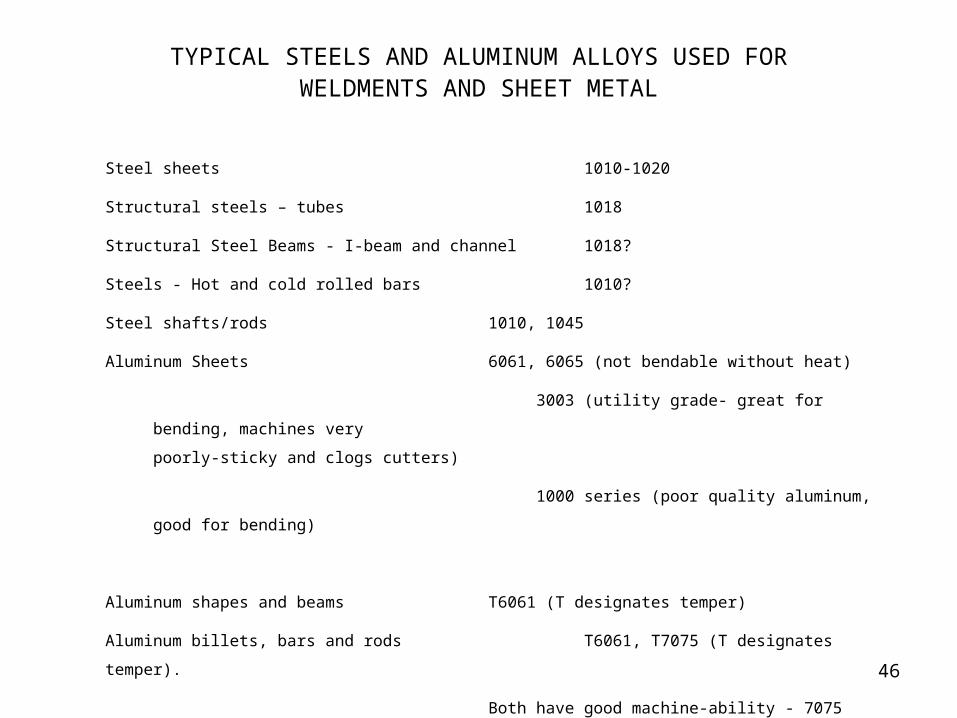
TYPICAL STEELS AND ALUMINUM ALLOYS USED FOR WELDMENTS AND SHEET METAL
Steel sheets 1010-1020
Structural steels – tubes 1018
Structural Steel Beams - I-beam and channel 1018?
Steels - Hot and cold rolled bars 1010?
Steel shafts/rods 1010, 1045
Aluminum Sheets 6061, 6065 (not bendable without heat)
3003 (utility grade- great for bending, machines
very poorly-sticky and clogs cutters)
1000 series (poor quality aluminum, good for
bending)
Aluminum shapes and beams T6061 (T designates temper)
Aluminum billets, bars and rods T6061, T7075 (T designates temper).
Both have good machine-ability - 7075 machines better
and will polish better too.
47
MATERIAL SELECTION
Materials selection is based on material properties (part
performance) and material processing (part manufacturing). Most
material selection is based on past experiences (but doesn't
necessarily produce optimal solutions).
There are a large number of materials available (eg. over 40,000
metallic alloys alone).
An improperly chosen material can lead to:
• failure of the part or component
• unnecessary costs
48
BASIC STEPS IN MATERIALS SELECTION
1. Analyze material requirements - determine the conditions of service and
environment that the product must withstand.
2. Screen candidate materials - compare the needed properties with a large materials
property data-base to select the most promising materials for the application.
3. Select candidate materials - analyze candidate materials in terms of trade -offs of:
product performance, cost, fabrication, availability, etc..
4. Develop design data – if necessary, determine experimentally the key material
properties for the selected material to obtain statistically reliable measures of the
material performance under specific conditions expected to be encountered in
service.
49
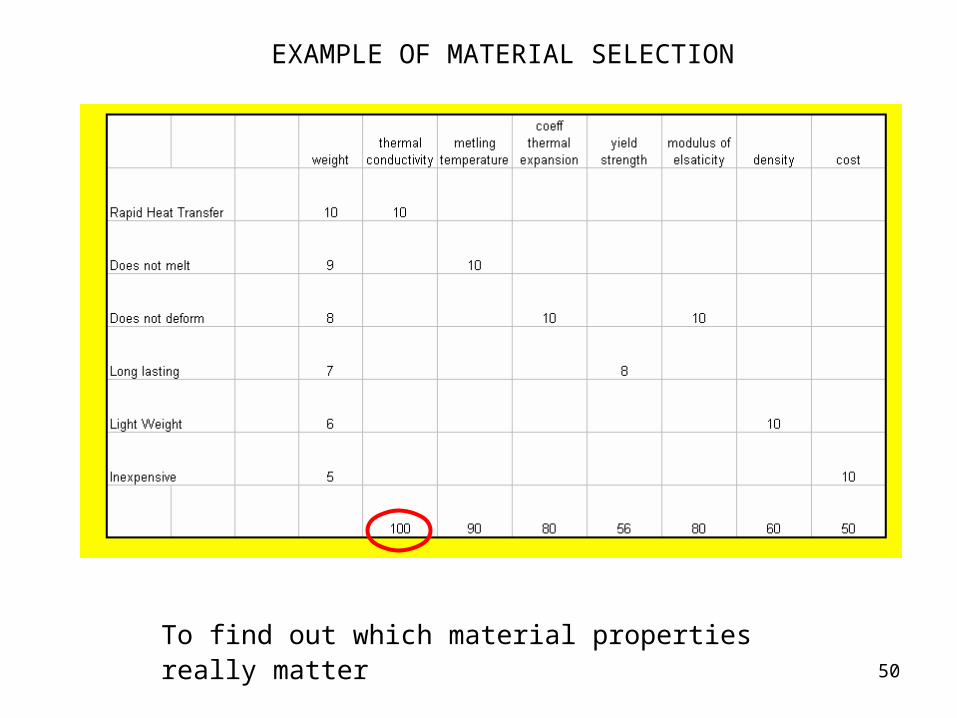
Problem:
Select a material suitable for designing the core of an automobile radiator.
Material Performance Requirements: ( What the material should do)
Rapid Heat Transfer
Does not melt
Does not deform
Long lasting
Light Weight
Inexpensive
EXAMPLE OF MATERIAL SELECTION
50
To find out which material properties really matter
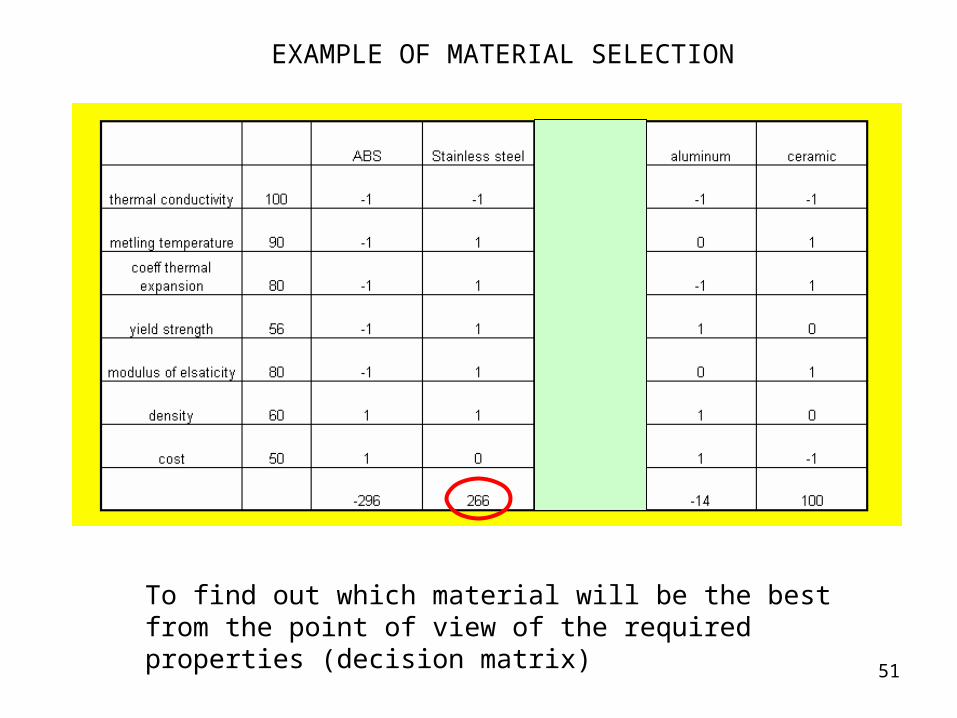
EXAMPLE OF MATERIAL SELECTION
51
To find out which material will be the best from the point of view of the required properties (decision matrix)
EXAMPLE OF MATERIAL SELECTION
Recommended


![Construction of Third Angle Orthographic Projection [Latest] (1)](https://img.pdfslide.us/doc/110x75/55cf981c550346d03395a388/construction-of-third-angle-orthographic-projection-latest-1.jpg)