1
1Q12 Earnings
Results Presentation
09/05/2012
2
This release contains forward-looking statements relating to the prospects of the business, estimates for operating and financial results, and those related to growth prospects of TPI – Triunfo Participações e Investimentos S.A. These are merely projections and, as such, are based exclusively on the expectations of the Company’s management concerning the future of the business. Such forward-looking statements depend substantially on changes in market conditions, the performance of the Brazilian economy, the sector and the international markets, and are, therefore, subject to changes without previous notice. The information is presented in proportion to the participation of Triunfo in each subsidiary. The operational numbers correspond to 100% of the business. The information includes the performance of the subsidiary Rio Verde.
Forward-Looking Statements

3
Digite aqui o Título
da Palestra
Digite aqui o Nome do Palestrante e a Data
I - Highlights
4
I – Highlights 1Q12
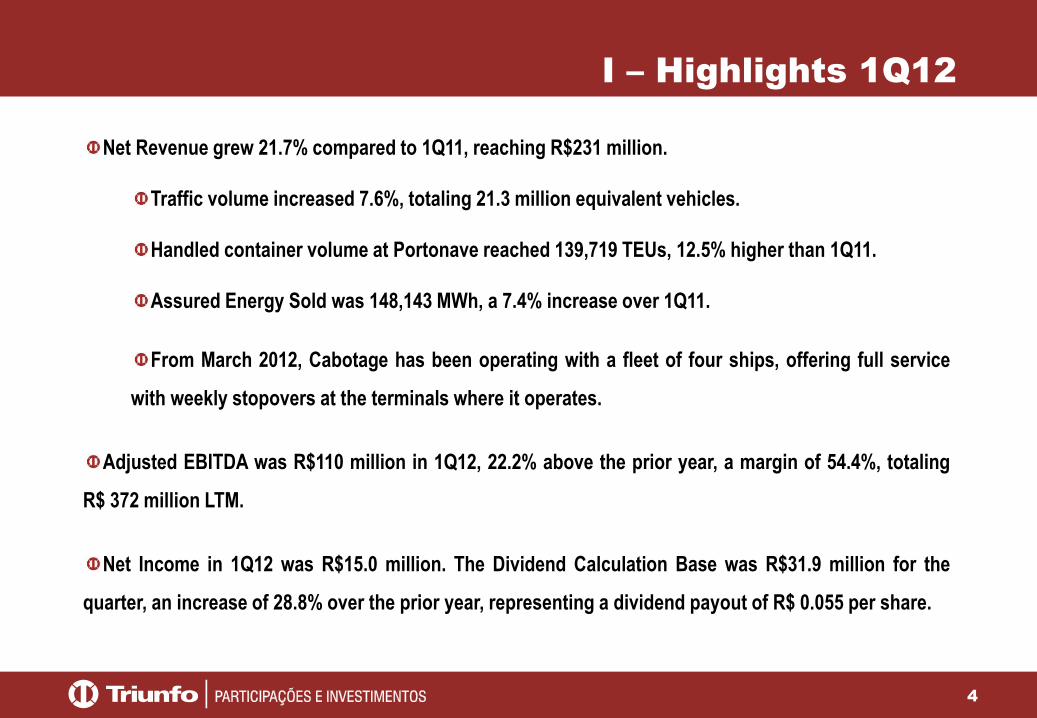
Net Revenue grew 21.7% compared to 1Q11, reaching R$231 million.
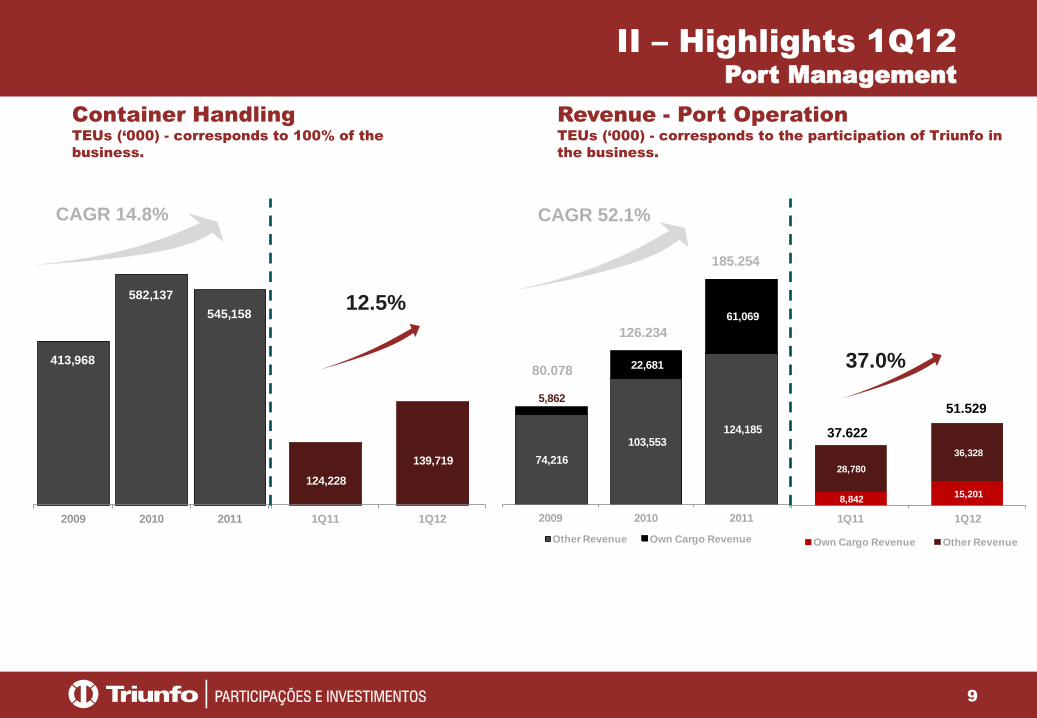
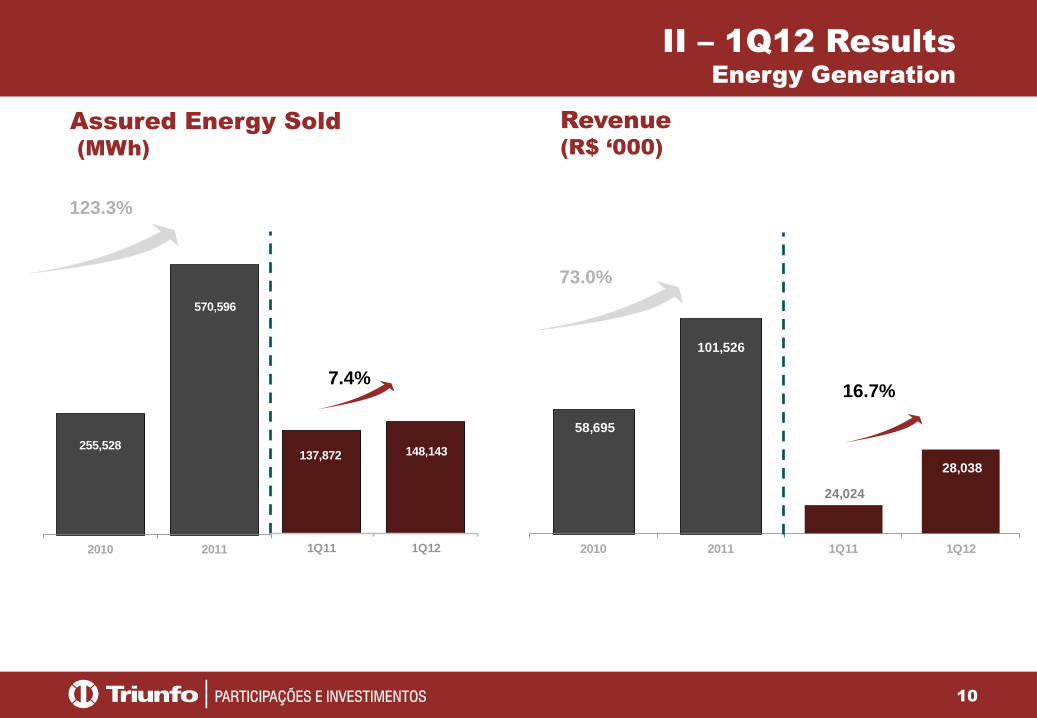
Traffic volume increased 7.6%, totaling 21.3 million equivalent vehicles. Handled container volume at Portonave reached 139,719 TEUs, 12.5% higher than 1Q11. Assured Energy Sold was 148,143 MWh, a 7.4% increase over 1Q11. From March 2012, Cabotage has been operating with a fleet of four ships, offering full service
with weekly stopovers at the terminals where it operates.
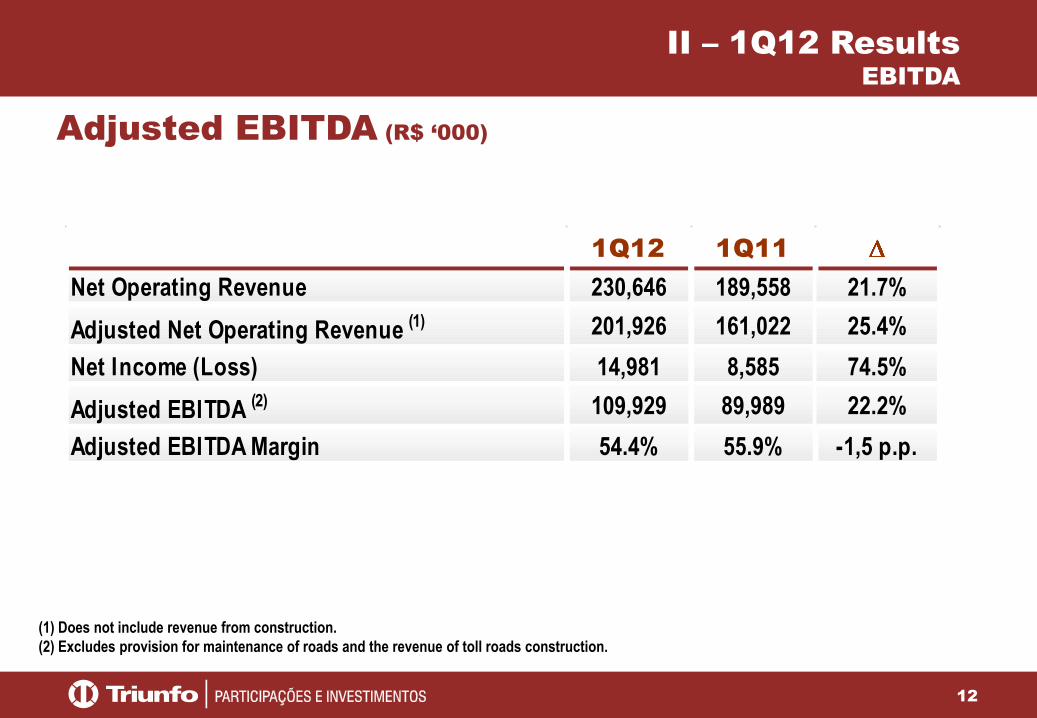
Adjusted EBITDA was R$110 million in 1Q12, 22.2% above the prior year, a margin of 54.4%, totaling
R$ 372 million LTM. Net Income in 1Q12 was R$15.0 million. The Dividend Calculation Base was R$31.9 million for the
quarter, an increase of 28.8% over the prior year, representing a dividend payout of R$ 0.055 per share.
5
I - Highlights 1Q12
In February 2012, the Company, in partnership with UTC Participações S.A and Egis Airport Operation,
won the auction for the expansion, maintenance and operation of the Campinas International Airport. The
result was ratified by the National Civil Aviation Agency (ANAC) in April.
In March 2012, the Company’s Board of Directors approved the first issuance of Promissory Notes
amounting to R$300 million with a maturity of 180 days. The use of proceeds is to pay the outstanding
balance of the 2nd debentures of the Company, and for investments in the Company and its subsidiaries.

6
Digite aqui o Título
da Palestra
Digite aqui o Nome do Palestrante e a Data
II – 1Q12 Results
7
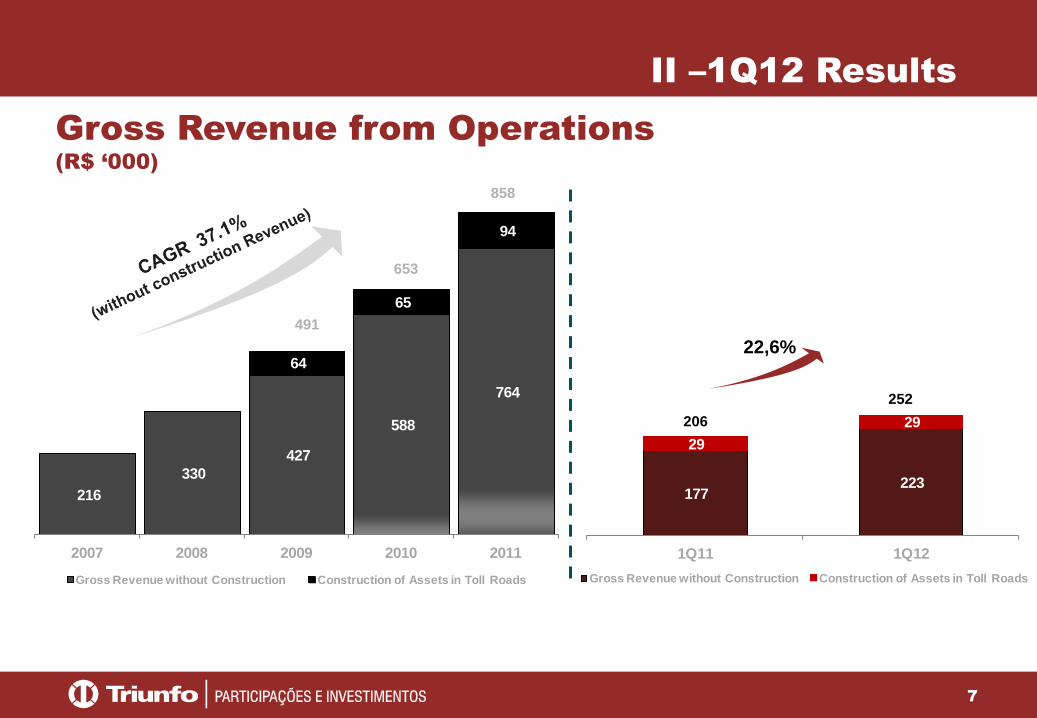
216
330
427
588
764
64
65
94
2007 2008 2009 2010 2011
Gross Revenue without Construction Construction of Assets in Toll Roads
177 223
29
29
1Q11 1Q12
Gross Revenue without Construction Construction of Assets in Toll Roads
Gross Revenue from Operations
(R$ ‘000)
22,6%
II –1Q12 Results
252
206
858
653
491
8
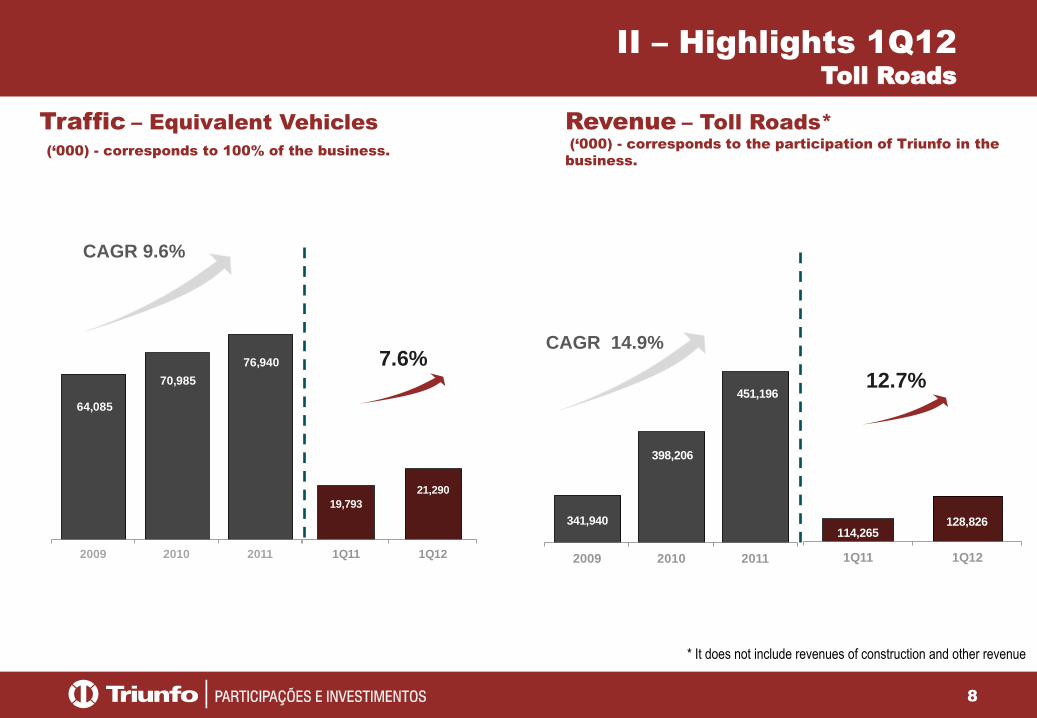
19,793
21,290
1Q11 1Q12
64,085
70,985
76,940
2009 2010 2011
Traffic – Equivalent Vehicles
(‘000) - corresponds to 100% of the business.
CAGR 9.6%
Revenue – Toll Roads*
(‘000) - corresponds to the participation of Triunfo in the
business.
7.6%
* It does not include revenues of construction and other revenue
114,265 128,826
1Q11 1Q12
341,940
398,206
451,196
2009 2010 2011
12.7%
II – Highlights 1Q12
Toll Roads
CAGR 14.9%
9
413,968
582,137
545,158
2009 2010 2011
124,228
139,719
1Q11 1Q12
74,216
103,553 124,185
5,862
22,681
61,069
2009 2010 2011
Other Revenue Own Cargo Revenue
8,842 15,201
28,780
36,328
1Q11 1Q12
Own Cargo Revenue Other Revenue
Container Handling
TEUs (‘000) - corresponds to 100% of the
business.
Revenue - Port Operation
TEUs (‘000) - corresponds to the participation of Triunfo in
the business.
37.0%
CAGR 14.8% CAGR 52.1%
12.5%
II – Highlights 1Q12
Port Management
185.254
126.234
80.078
51.529
37.622
10
Assured Energy Sold
(MWh)
II – 1Q12 Results
Energy Generation
Revenue
(R$ ‘000)
137,872 148,143
1Q11 1Q12
255,528
570,596
2010 2011
123.3%
7.4%
58,695
101,526
2010 2011
24,024
28,038
1Q11 1Q12
16.7%
73.0%
11
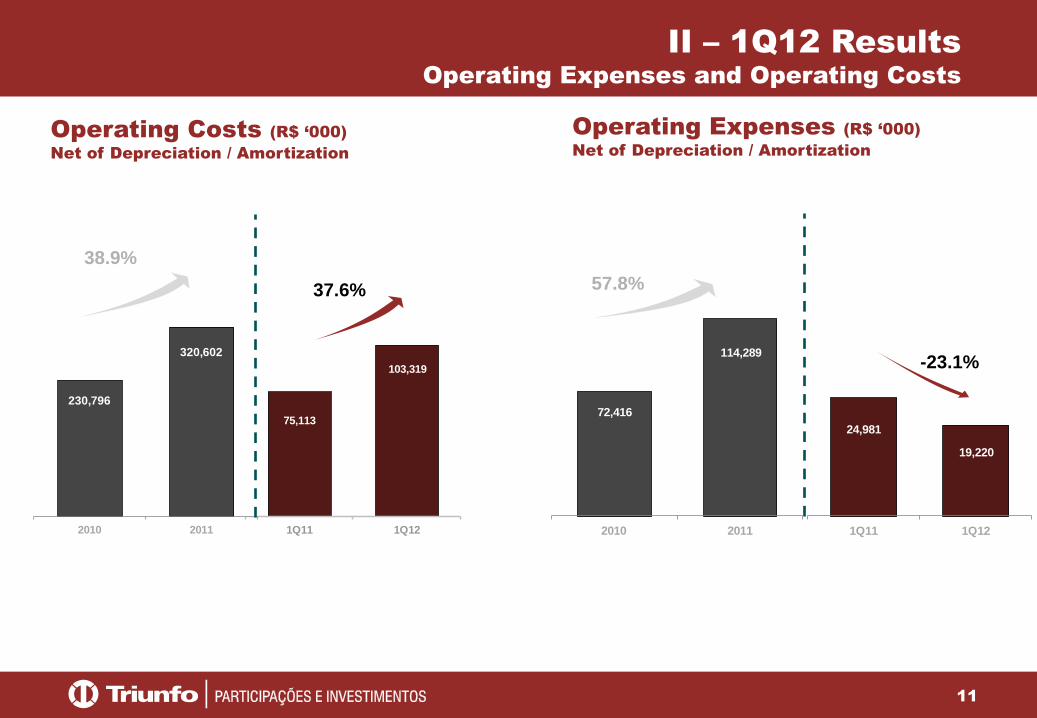
Operating Expenses (R$ ‘000)
Net of Depreciation / Amortization
II – 1Q12 Results
Operating Expenses and Operating Costs
Operating Costs (R$ ‘000)
Net of Depreciation / Amortization
75,113
103,319
1Q11 1Q12
230,796
320,602
2010 2011
24,981
19,220
1Q11 1Q12
72,416
114,289
2010 2011
37.6%
-23.1%
38.9%
57.8%
12
II – 1Q12 Results
EBITDA
Adjusted EBITDA (R$ ‘000)
(1) Does not include revenue from construction. (2) Excludes provision for maintenance of roads and the revenue of toll roads construction.
1Q12 1Q11
Net Operating Revenue 230,646 189,558 21.7%Adjusted Net Operating Revenue (1) 201,926 161,022 25.4%Net Income (Loss) 14,981 8,585 74.5%Adjusted EBITDA (2) 109,929 89,989 22.2%Adjusted EBITDA Margin 54.4% 55.9% -1,5 p.p.
13
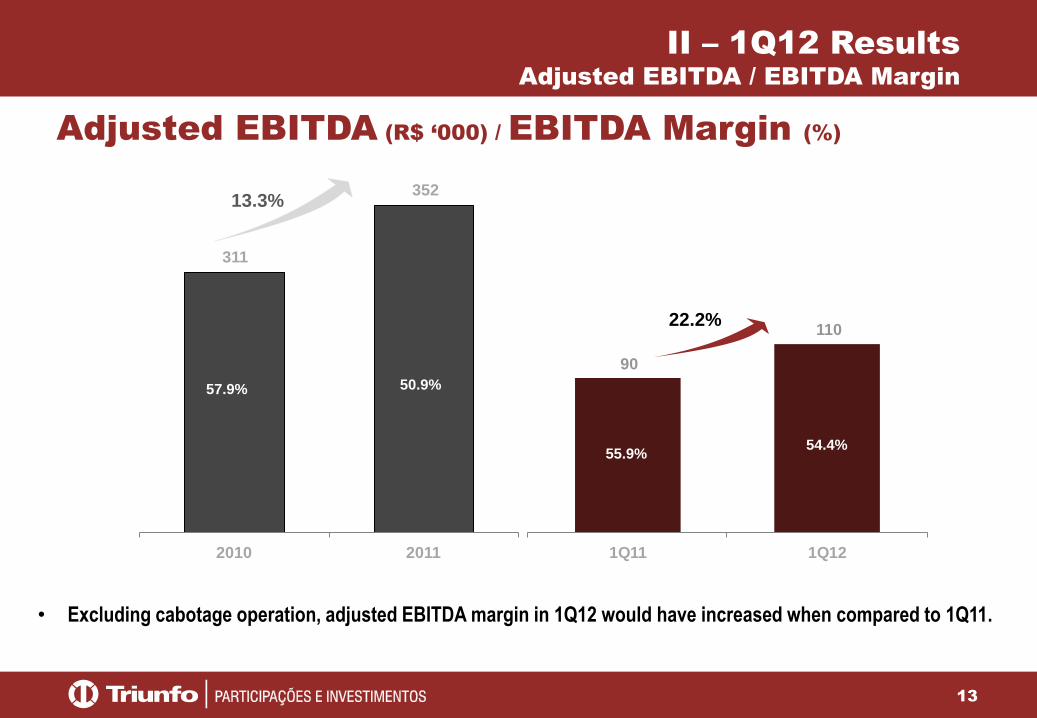
Adjusted EBITDA (R$ ‘000) / EBITDA Margin (%)
58.1%
54.8%
50.9% 57.9%
90
110
1Q11 1Q12
311
352
2010 2011
57.9% 50.9%
55.9% 54.4%
13.3%
22.2%
• Excluding cabotage operation, adjusted EBITDA margin in 1Q12 would have increased when compared to 1Q11.
II – 1Q12 Results
Adjusted EBITDA / EBITDA Margin
14
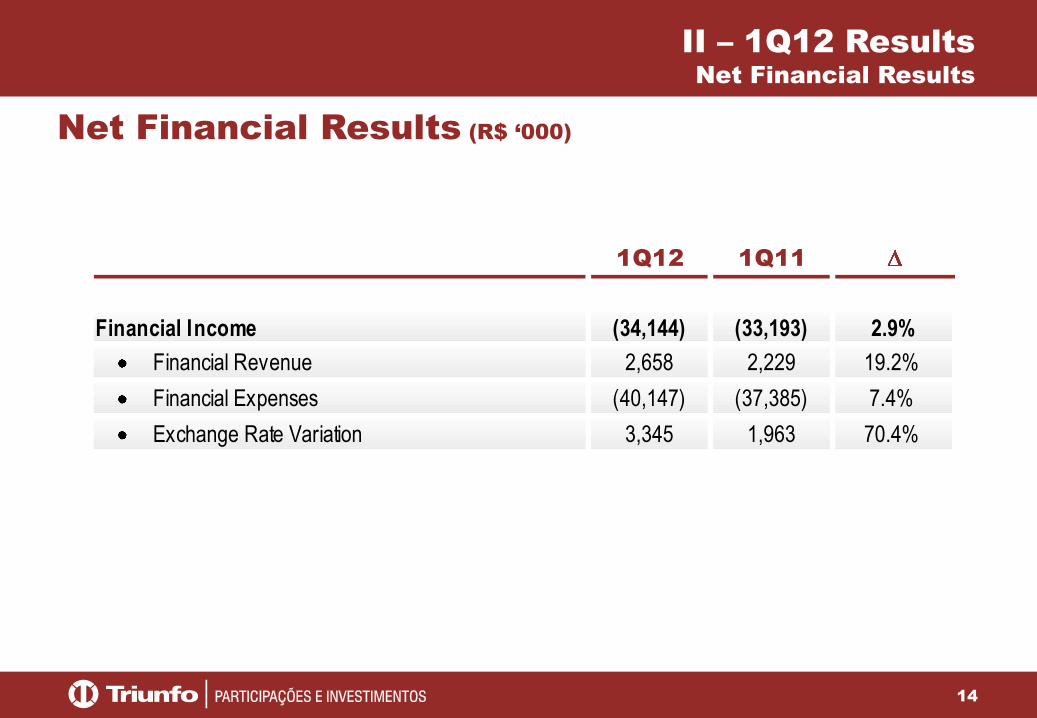
Net Financial Results (R$ ‘000)
1Q12 1Q11
Financial Income (34,144) (33,193) 2.9% Financial Revenue 2,658 2,229 19.2%
Financial Expenses (40,147) (37,385) 7.4%
Exchange Rate Variation 3,345 1,963 70.4%
II – 1Q12 Results
Net Financial Results
15
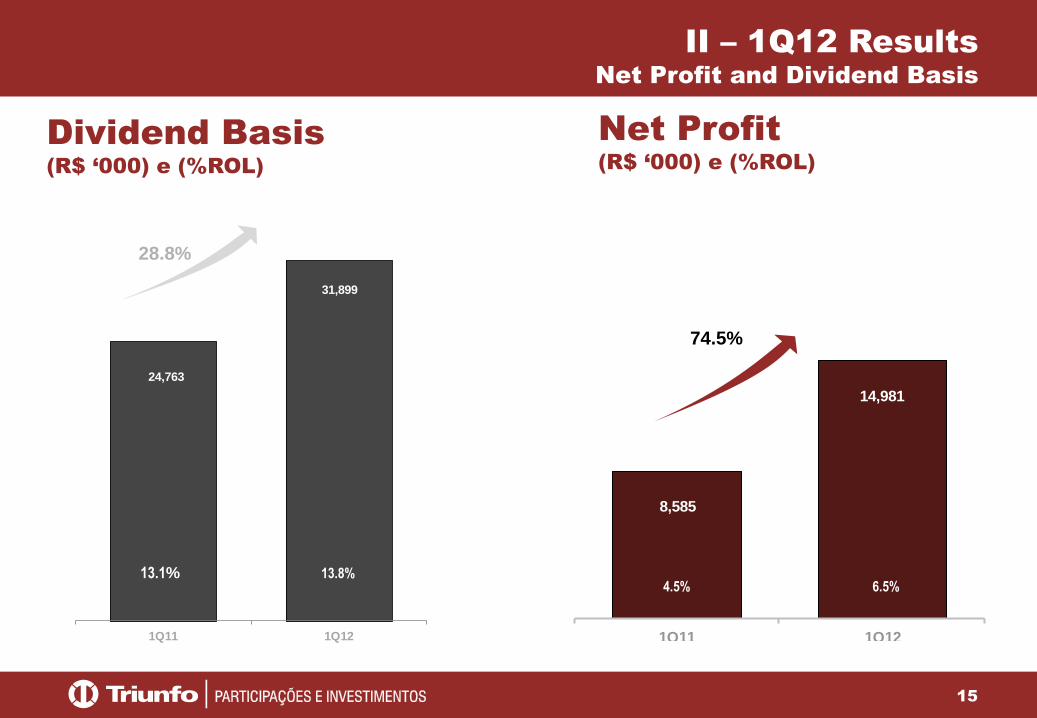
Net Profit
(R$ ‘000) e (%ROL)
II – 1Q12 Results
Net Profit and Dividend Basis
Dividend Basis
(R$ ‘000) e (%ROL)
8,585
14,981
1Q11 1Q12
24,763
31,899
1Q11 1Q12
74.5%
28.8%
6.5% 4.5% 13.8% 13.1%
16
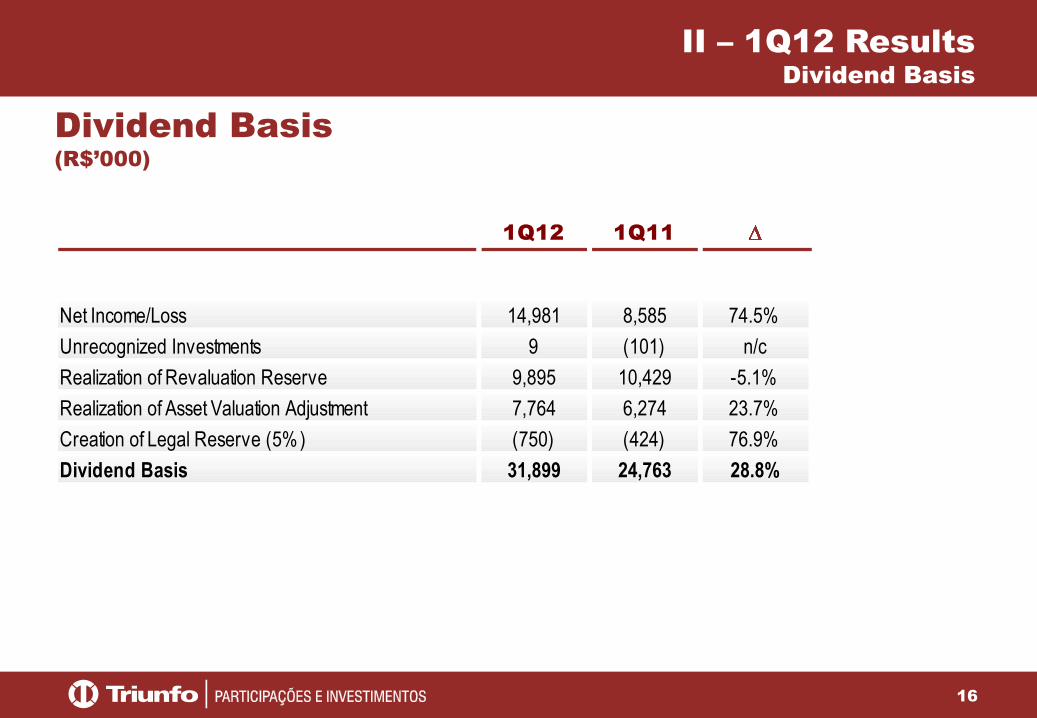
Dividend Basis
(R$’000)
1Q12 1Q11
Net Income/Loss 14,981 8,585 74.5%
Unrecognized Investments 9 (101) n/c
Realization of Revaluation Reserve 9,895 10,429 -5.1%
Realization of Asset Valuation Adjustment 7,764 6,274 23.7%
Creation of Legal Reserve (5%) (750) (424) 76.9%
Dividend Basis 31,899 24,763 28.8%
II – 1Q12 Results
Dividend Basis
17
ENERGY
ROAD
SEGMENT
PORT
COMPANY
SUBTOTAL
PARENT
COMPANY
CABOTAGE
SEGMENT
TOTAL
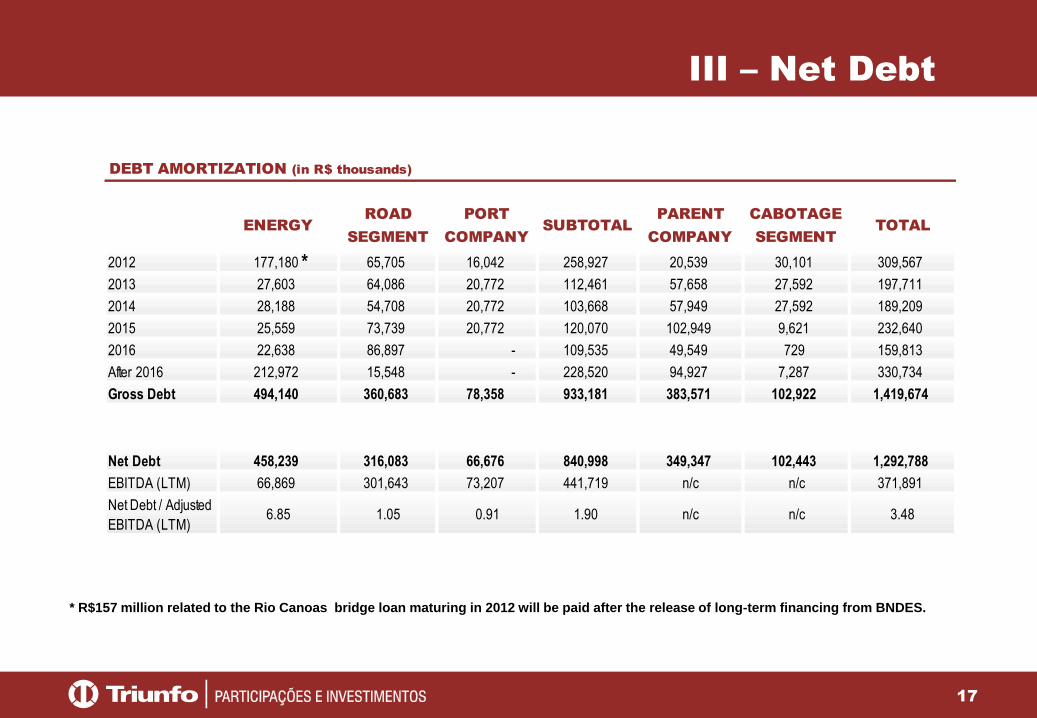
2012 177,180 65,705 16,042 258,927 20,539 30,101 309,567
2013 27,603 64,086 20,772 112,461 57,658 27,592 197,711
2014 28,188 54,708 20,772 103,668 57,949 27,592 189,209
2015 25,559 73,739 20,772 120,070 102,949 9,621 232,640
2016 22,638 86,897 - 109,535 49,549 729 159,813
After 2016 212,972 15,548 - 228,520 94,927 7,287 330,734
Gross Debt 494,140 360,683 78,358 933,181 383,571 102,922 1,419,674
Net Debt 458,239 316,083 66,676 840,998 349,347 102,443 1,292,788EBITDA (LTM) 66,869 301,643 73,207 441,719 n/c n/c 371,891
Net Debt / Adjusted
EBITDA (LTM) 6.85 1.05 0.91 1.90 n/c n/c 3.48
DEBT AMORTIZATION (in R$ thousands)
III – Net Debt
*
* R$157 million related to the Rio Canoas bridge loan maturing in 2012 will be paid after the release of long-term financing from BNDES.
18
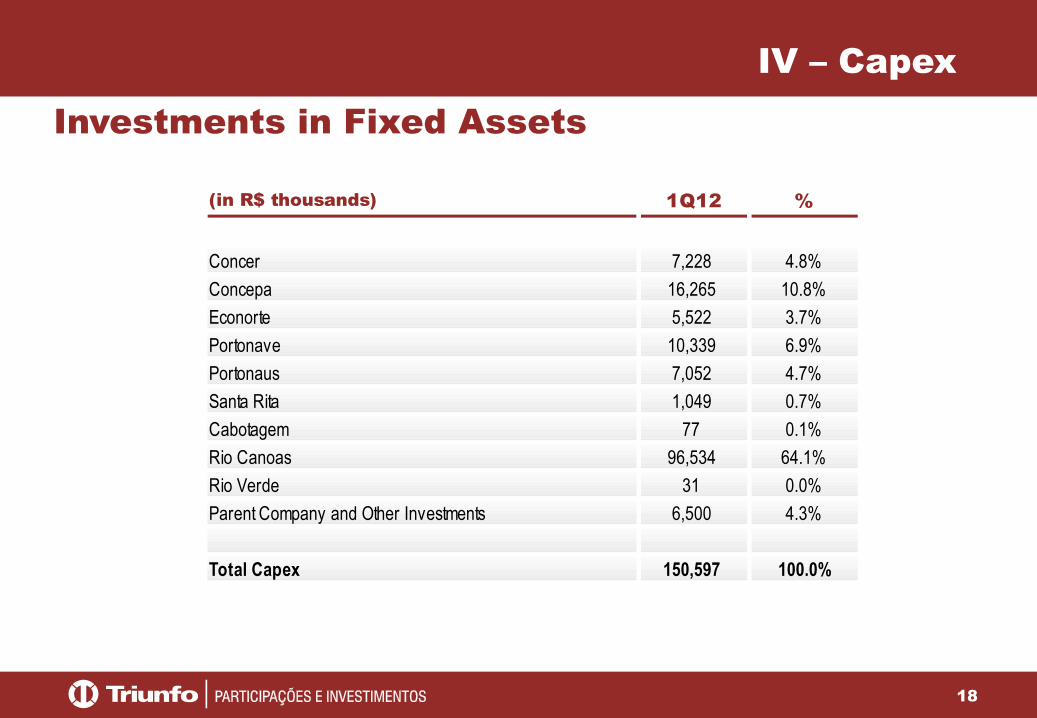
IV – Capex
Investments in Fixed Assets
(in R$ thousands) 1Q12 %
Concer 7,228 4.8%
Concepa 16,265 10.8%
Econorte 5,522 3.7%
Portonave 10,339 6.9%
Portonaus 7,052 4.7%
Santa Rita 1,049 0.7%
Cabotagem 77 0.1%
Rio Canoas 96,534 64.1%
Rio Verde 31 0.0%
Parent Company and Other Investments 6,500 4.3%
Total Capex 150,597 100.0%

19
www.tpisa.com.br
Triunfo São Paulo
Rua Olimpíadas 205 14º andar cj. 1402
CEP 04551-000 São Paulo SP BR
Fone 55 11 2169 3999
Fax 55 11 2169 3969
Rua Olimpíadas 205 14º andar cj. 1402 CEP 04551-000 São Paulo SP BR
Fone 55 11 2169 3999 Fax 55 11 2169 3939
www.triunfo.com
Recommended