1
Philip CoxChief Executive Officer
Investor PresentationSeptember 2005
2
A leading global power generatorPortfolio approach - regional focus
Key Hydro Coal Gas Other
Note: This map shows net capacity for IPRand excludes assets under construction Hazelwood
Pelican Point
Synergen
Hays
Midlothian I & IIHartwell
Milford Blackstone
RugeleyDeeside
EOP
HUBCO
KAPCO
Uni-Mar
Malakoff
Oyster Creek
Bellingham
Pluak Daeng
Pego
Al Kamil
North America Europe
Middle East
Asia
Australia
UmmAl Nar
EcoEléctrica
Valley PowerLoy Yang B
Kwinana
Canunda
Paiton
Shuweihat
TurbogásSpanish Hydro
ISAB
Derwent
First Hydro
Uch
Gross capacity in operation 28,181 MWNet capacity in operation 16,372 MWNet capacity under construction 1,706 MW
Saltend
SEAgas pipeline
3
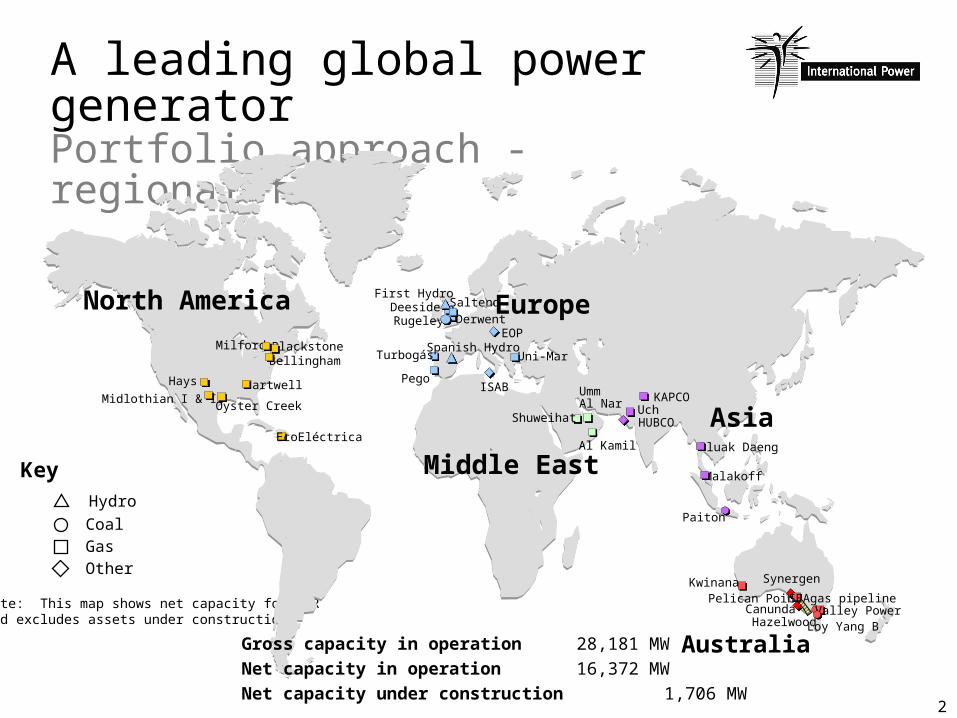
Capacity analysisNet MW geography and fuel type
28%
35%
Asia NorthAmerica
Europe
Australia
Geography
20%
13%
MiddleEast
4%25%
62%
Coal
Gas
Oil3%
Fuel
9%
Pumpedstorage
Wind 0.5%Hydro 0.5%
As at 30 June 2005
4
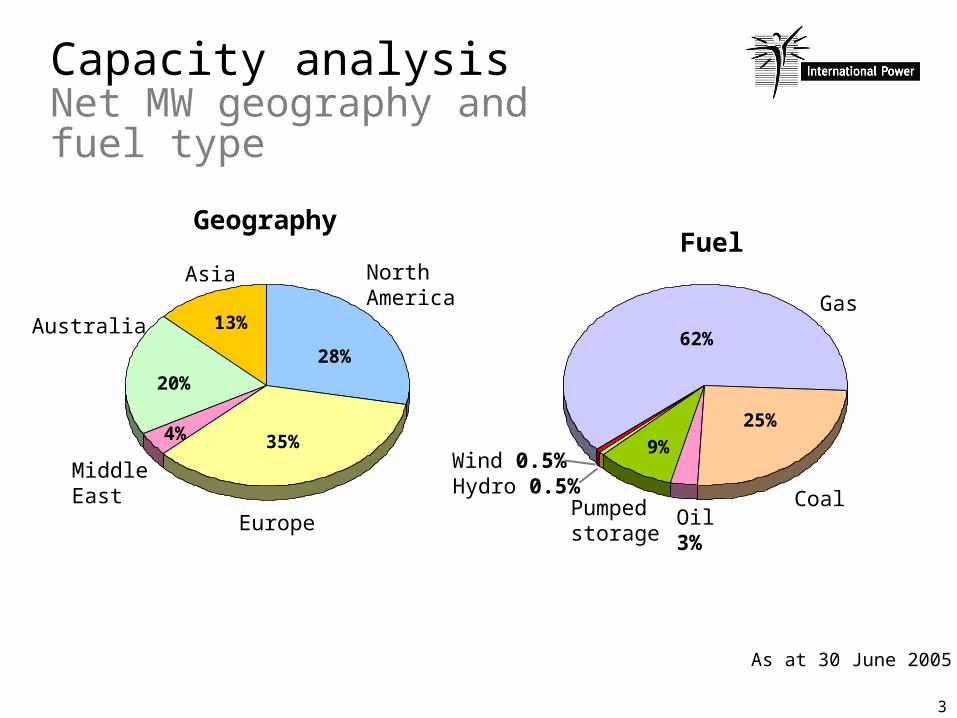
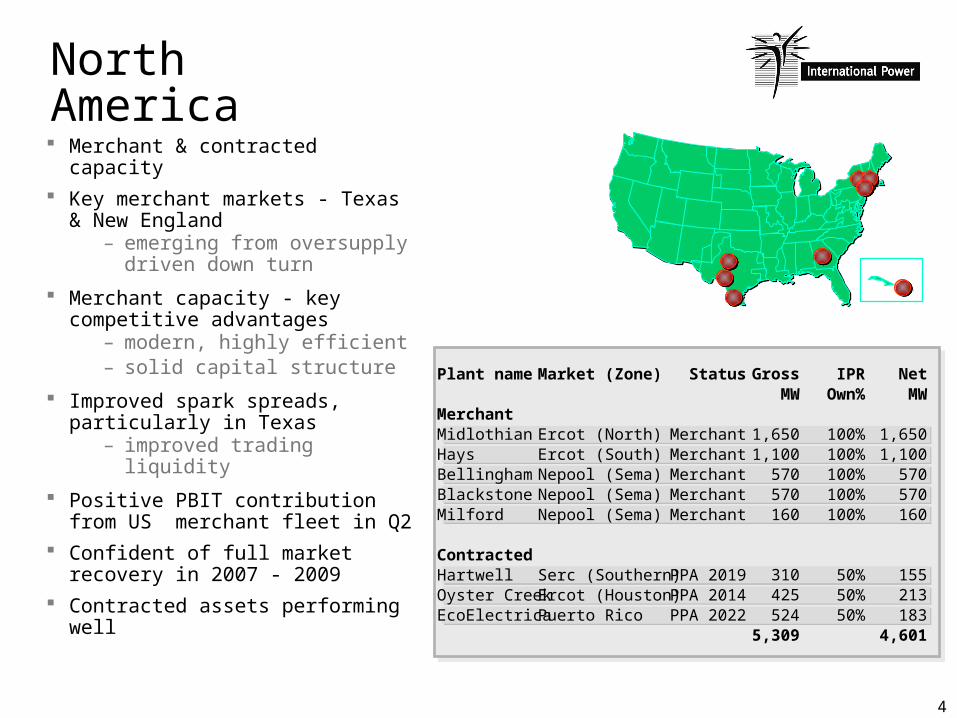
North America Merchant & contracted
capacity Key merchant markets - Texas
& New England– emerging from
oversupply driven down turn
Merchant capacity - key competitive advantages
– modern, highly efficient– solid capital structure
Improved spark spreads, particularly in Texas
– improved trading liquidity
Positive PBIT contribution from US merchant fleet in Q2
Confident of full market recovery in 2007 - 2009
Contracted assets performing well
Plant name
MerchantMidlothianHaysBellinghamBlackstoneMilford
ContractedHartwellOyster CreekEcoElectrica
Status
MerchantMerchantMerchantMerchantMerchant
PPA 2019PPA 2014PPA 2022
GrossMW
1,6501,100
570570160
310425524
5,309
IPROwn%
100%100%100%100%100%
50%50%50%
NetMW
1,6501,100
570570160
155213183
4,601
Market (Zone)
Ercot (North)Ercot (South)Nepool (Sema)Nepool (Sema)Nepool (Sema)
Serc (Southern)Ercot (Houston)Puerto Rico
5
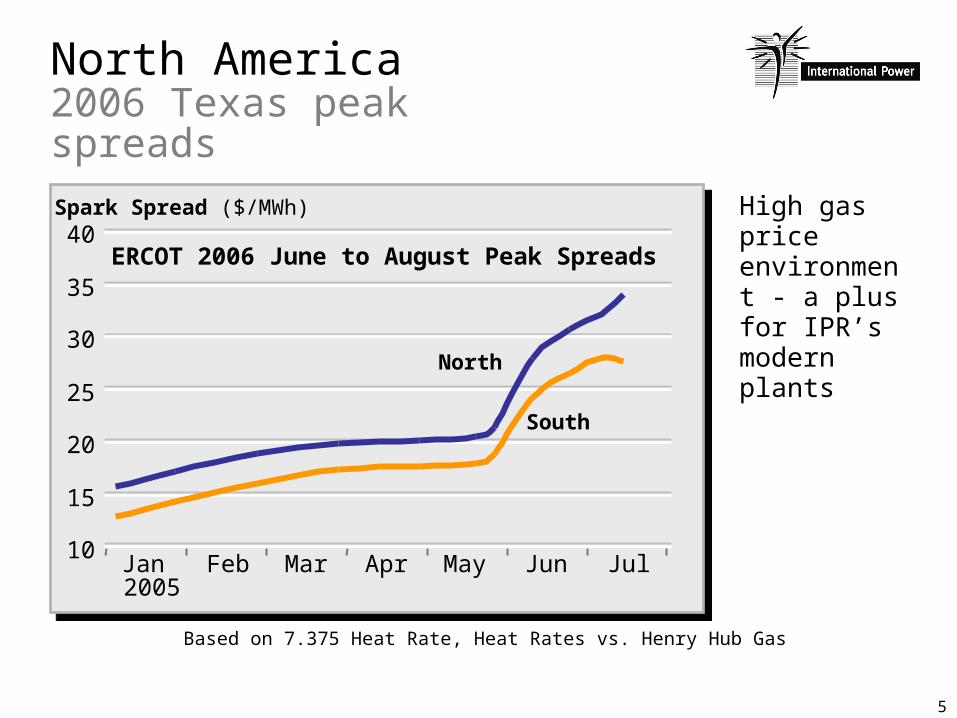
North America2006 Texas peak spreads
10
15
20
25
30
35
40
Jan Feb Mar Apr May Jun Jul2005
ERCOT 2006 June to August Peak Spreads
Spark Spread ($/MWh)
Based on 7.375 Heat Rate, Heat Rates vs. Henry Hub Gas
North
South
High gas price environment - a plus for IPR’s modern plants
6
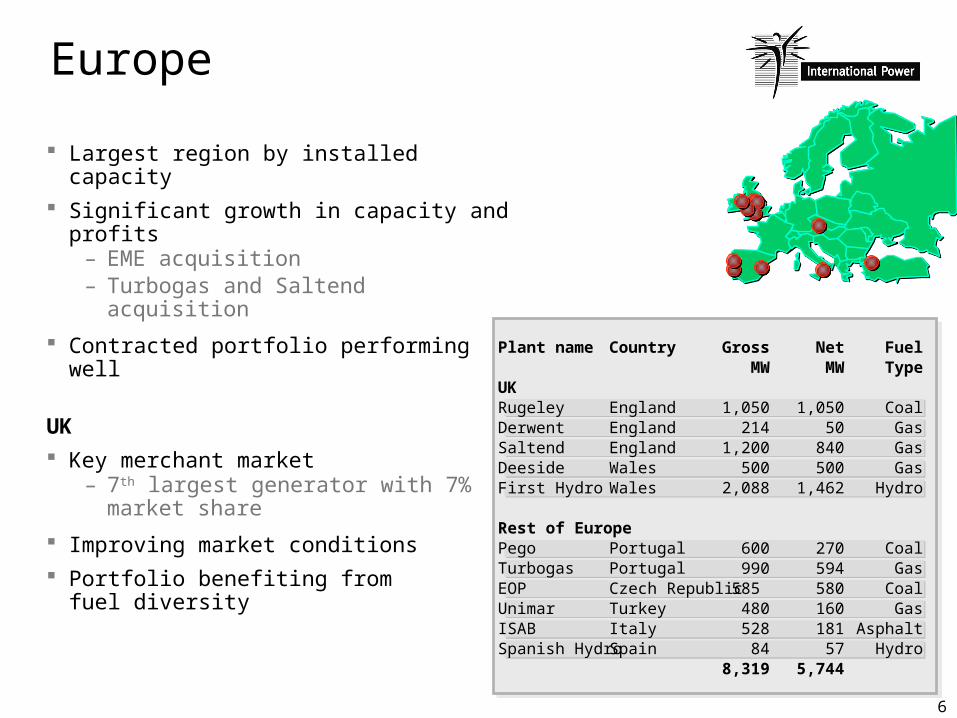
Largest region by installed capacity Significant growth in capacity and
profits– EME acquisition– Turbogas and Saltend acquisition
Contracted portfolio performing well
UK Key merchant market
– 7th largest generator with 7% market share
Improving market conditions Portfolio benefiting from
fuel diversity
GrossMW
1,050214
1,200500
2,088
600990
585 480528
848,319
NetMW
1,05050
840500
1,462
270594580160181
575,744
FuelType
CoalGasGasGas
Hydro
CoalGasCoalGas
AsphaltHydro
Plant name
UKRugeleyDerwentSaltendDeesideFirst Hydro
Rest of EuropePegoTurbogasEOPUnimarISABSpanish Hydro
Country
EnglandEnglandEnglandWalesWales
PortugalPortugalCzech RepublicTurkey Italy Spain
Europe
7
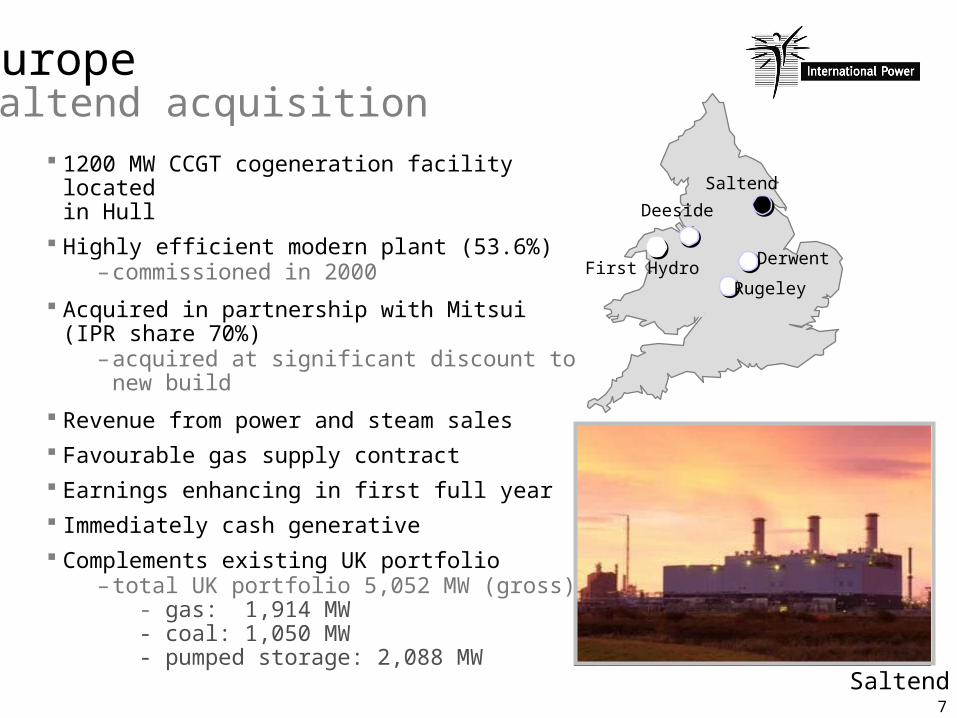
Rugeley
Saltend
First Hydro
Deeside
Derwent
1200 MW CCGT cogeneration facility located
in Hull Highly efficient modern plant (53.6%)
– commissioned in 2000
Acquired in partnership with Mitsui (IPR share 70%)
– acquired at significant discount to new build
Revenue from power and steam sales Favourable gas supply contract Earnings enhancing in first full year Immediately cash generative Complements existing UK portfolio
– total UK portfolio 5,052 MW (gross) - gas: 1,914 MW - coal: 1,050 MW - pumped storage: 2,088 MW
EuropeSaltend acquisition
Saltend
8
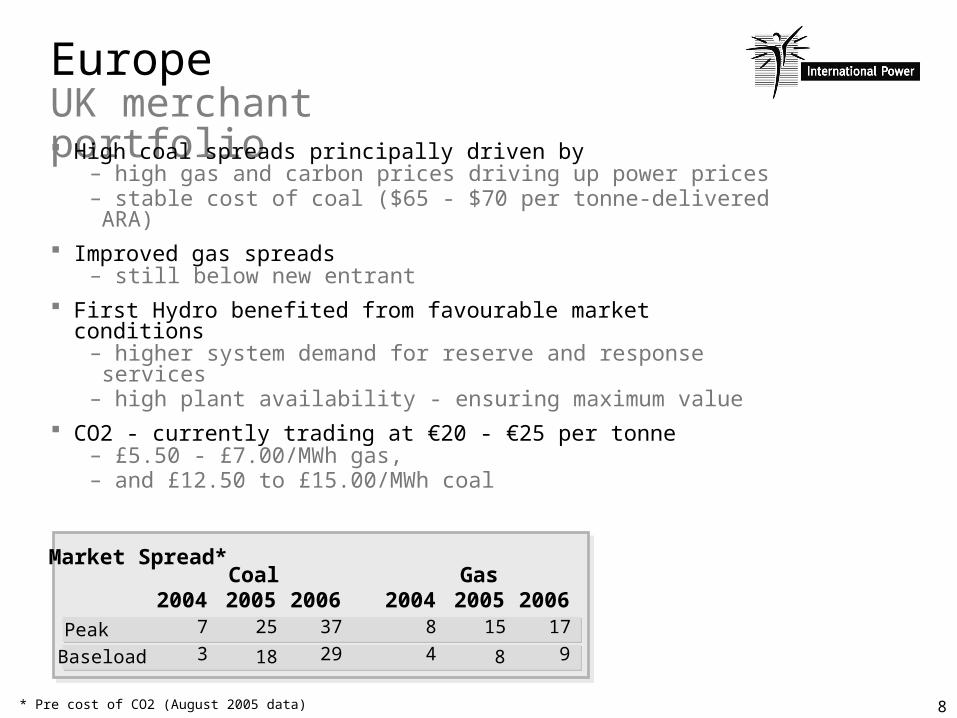
EuropeUK merchant portfolio High coal spreads principally driven by
– high gas and carbon prices driving up power prices– stable cost of coal ($65 - $70 per tonne-delivered ARA)
Improved gas spreads– still below new entrant
First Hydro benefited from favourable market conditions– higher system demand for reserve and response services
– high plant availability - ensuring maximum value CO2 - currently trading at €20 - €25 per tonne
– £5.50 - £7.00/MWh gas, – and £12.50 to £15.00/MWh coal
PeakBaseload
Coal2005 20062004Gas
8 15 17
4 8 9
2005 200620047 25 37
3 18 29
Market Spread*
* Pre cost of CO2 (August 2005 data)
9
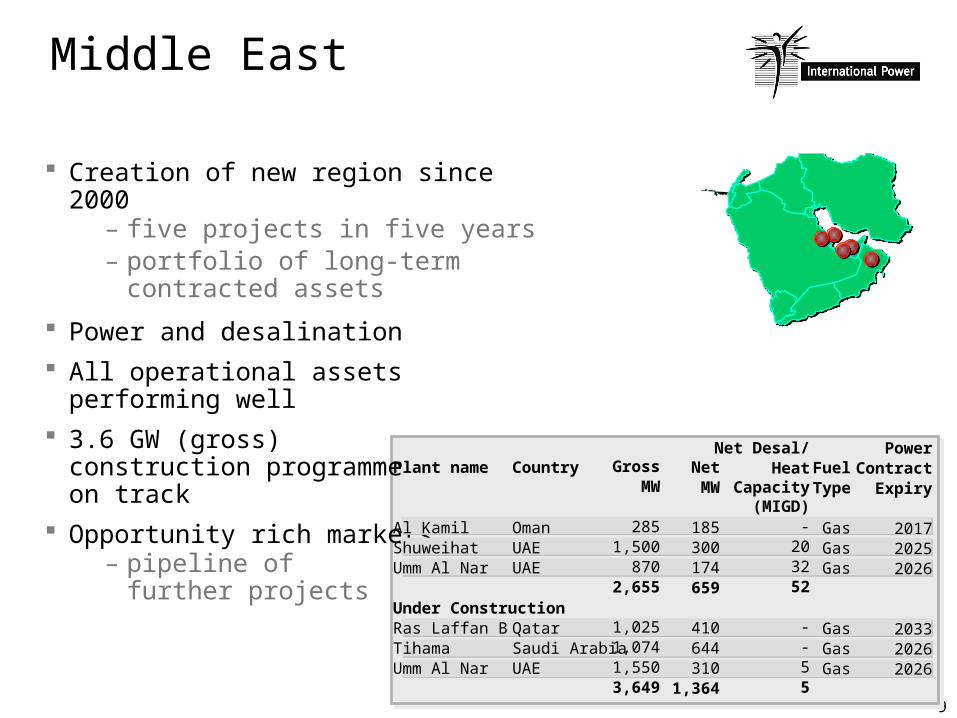
Middle East
Creation of new region since 2000– five projects in five years– portfolio of long-term
contracted assets
Power and desalination All operational assets performing
well 3.6 GW (gross)
construction programme on track
Opportunity rich markets– pipeline of
further projects
GrossMW
2851,500
8702,655
1,0251,0741,5503,649
NetMW
185300174659
410644310
1,364
FuelType
GasGasGas
GasGasGas
PowerContract
Expiry
201720252026
203320262026
Net Desal/Heat
Capacity(MIGD)
-203252
--55
Country
OmanUAEUAE
QatarSaudi ArabiaUAE
Plant name
Al KamilShuweihatUmm Al Nar
Under ConstructionRas Laffan BTihamaUmm Al Nar
10
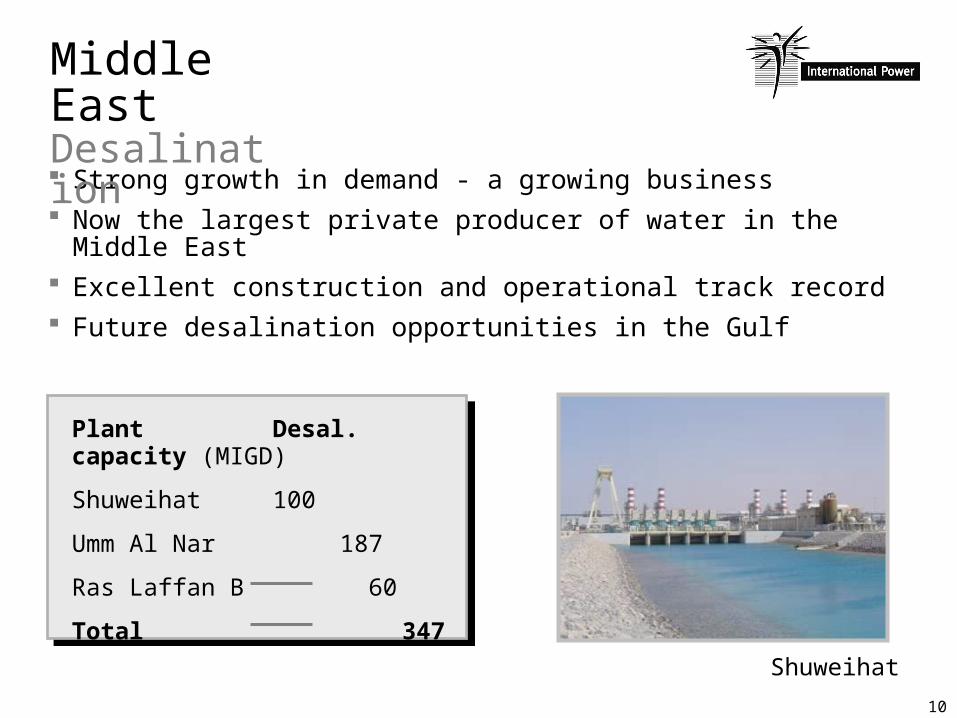
Strong growth in demand - a growing business Now the largest private producer of water in the Middle
East Excellent construction and operational track record Future desalination opportunities in the Gulf
Middle East Desalination
Shuweihat
Plant Desal. capacity (MIGD)
Shuweihat 100
Umm Al Nar 187
Ras Laffan B 60
Total 347
11
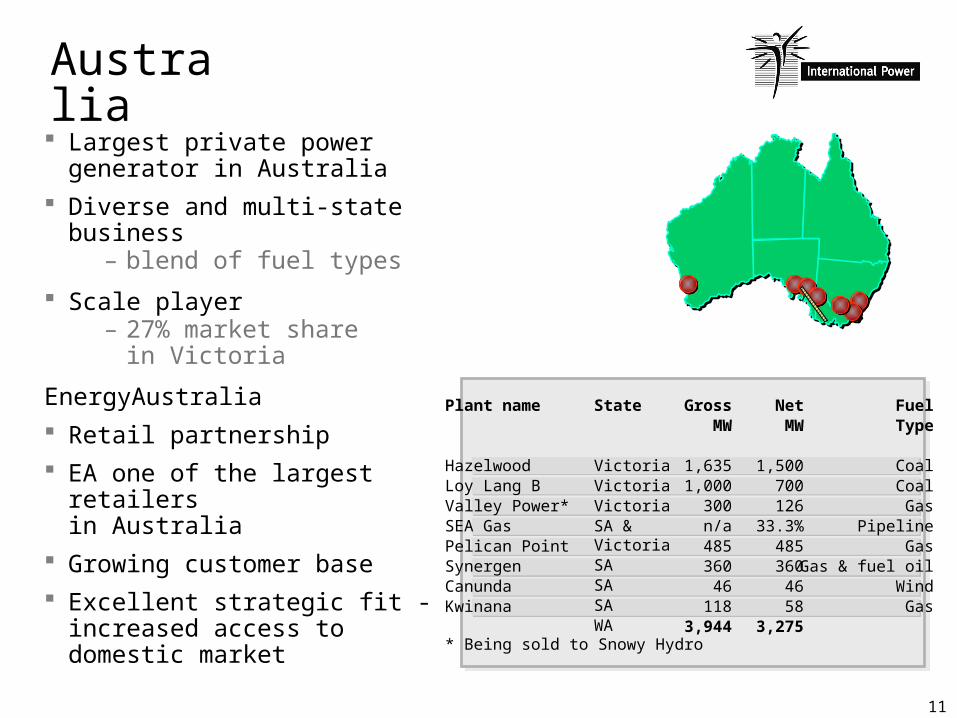
Australia Largest private power
generator in Australia Diverse and multi-state
business– blend of fuel types
Scale player– 27% market share
in Victoria
EnergyAustralia Retail partnership EA one of the largest
retailers in Australia
Growing customer base Excellent strategic fit -
increased access to domestic market
GrossMW
1,6351,000
300n/a
485360
46118
3,944
NetMW
1,500700126
33.3%485360
4658
3,275
FuelType
CoalCoalGas
PipelineGas
Gas & fuel oilWindGas
Plant name
HazelwoodLoy Lang BValley Power*SEA GasPelican PointSynergenCanundaKwinana
* Being sold to Snowy Hydro
State
Victoria Victoria Victoria SA & Victoria SASASAWA
12
AustraliaMerchant markets Key merchant market No major change in electricity price
environment– supply/demand balance remains attractive– liquid forward market– sustained demand peaks/trigger required
to expedite price increases– mild weather continues
Portfolio well hedged for the balance of 2005 (>75%)
13
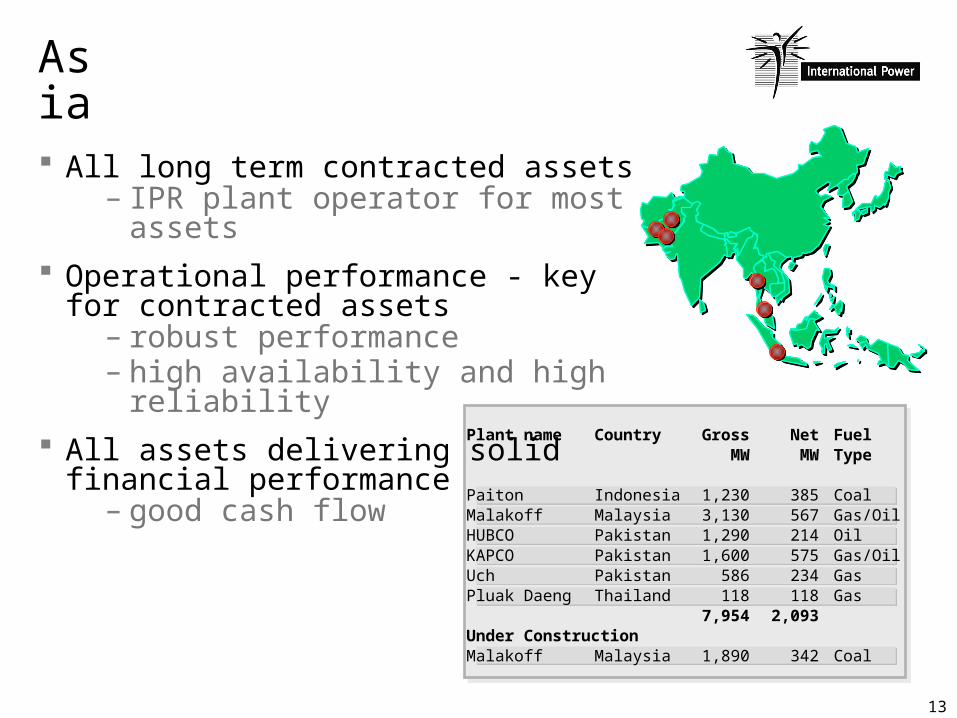
Asia All long term contracted assets
– IPR plant operator for most assets
Operational performance - key for contracted assets
– robust performance– high availability and high
reliability All assets delivering solid
financial performance – good cash flow
GrossMW
1,2303,1301,2901,600
586118
7,954
1,890
NetMW
385567214575234118
2,093
342
FuelType
CoalGas/OilOilGas/OilGasGas
Coal
Country
IndonesiaMalaysiaPakistanPakistanPakistanThailand
Malaysia
Plant name
PaitonMalakoffHUBCOKAPCOUchPluak Daeng
Under ConstructionMalakoff
14
Global portfolio
Portfolio approach delivers: Risk mitigation across 5 core regional markets Access to optimum growth opportunities
– greenfield– acquisitions
In depth regional market knowledge/customer contracts
Balance of contracted (stable return) and merchant (upside potential) markets
Knowledge/skills transfer
15
Financial highlights - H1 2005
Good financial performance– EPS of 6.7p - up 40% (H1 2004: 4.8p*)– profit from operations £233m up 96% (H1 2004:
£119m) Profit from operations up in all regions
– significant increase in Europe and Asia– improved performance in the US
Cash flow strong across the portfolio– free cash flow significantly up at £134m (H1
2004: £41m) EME integration complete 2005 earnings guidance upgraded
– revised 2005 EPS range of 12.0p - 13.0p*adjusted for Rights Issue
16
Capital structure
Non-recourse project debt the fundamental building block
Liquid resources at IPR corporate– cash– headroom– borrowing capacity
Free Cash Flow generation strong and consistent Debt capitalisation 56% (at 30 June 2005)
17
Summary A leading global power generator
– regional balance - 5 core regions– contracted and merchant markets
Core competencies– greenfield development– acquisitions– financing– plant operations– trading and commercial structuring
Asset management– delivery of results
Growth opportunities Portfolio performing well
– operationally and financially
18
Appendix
19
All numbers exclude exceptional items
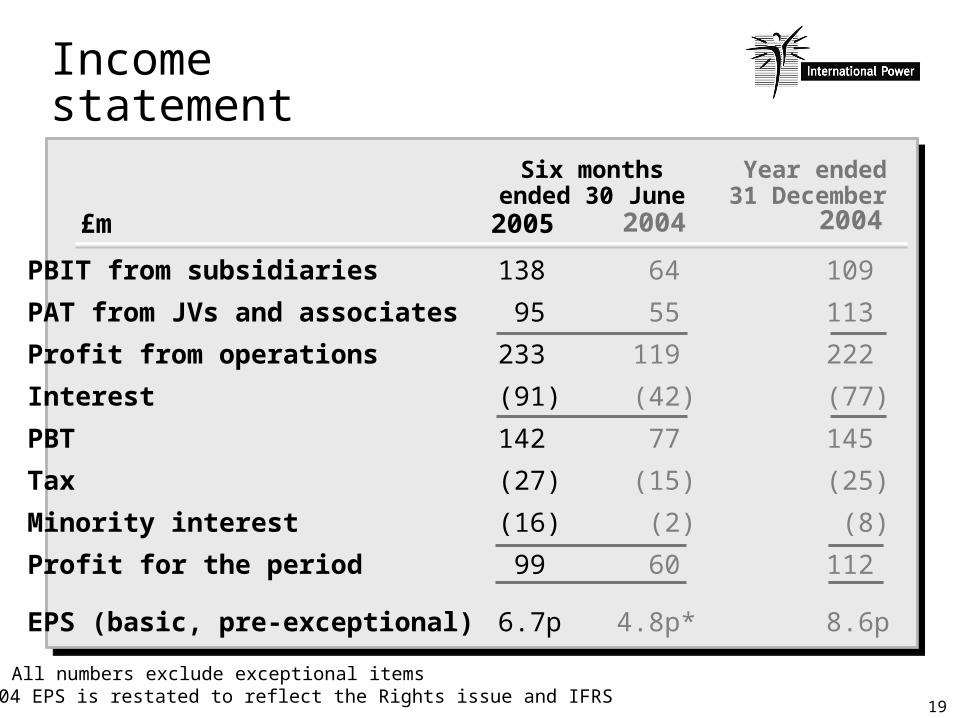
Income statement
Six months ended 30 June
20042005£m
* 2004 EPS is restated to reflect the Rights issue and IFRS
Year ended31 December
2004
PBIT from subsidiaries
PAT from JVs and associates
Profit from operations
Interest
PBT
Tax
Minority interest
Profit for the period
EPS (basic, pre-exceptional)
138
95
233
(91)
142
(27)
(16)
99
6.7p
64
55
119
(42)
77
(15)
(2)
60
4.8p*
109
113
222
(77)
145
(25)
(8)
112
8.6p
20
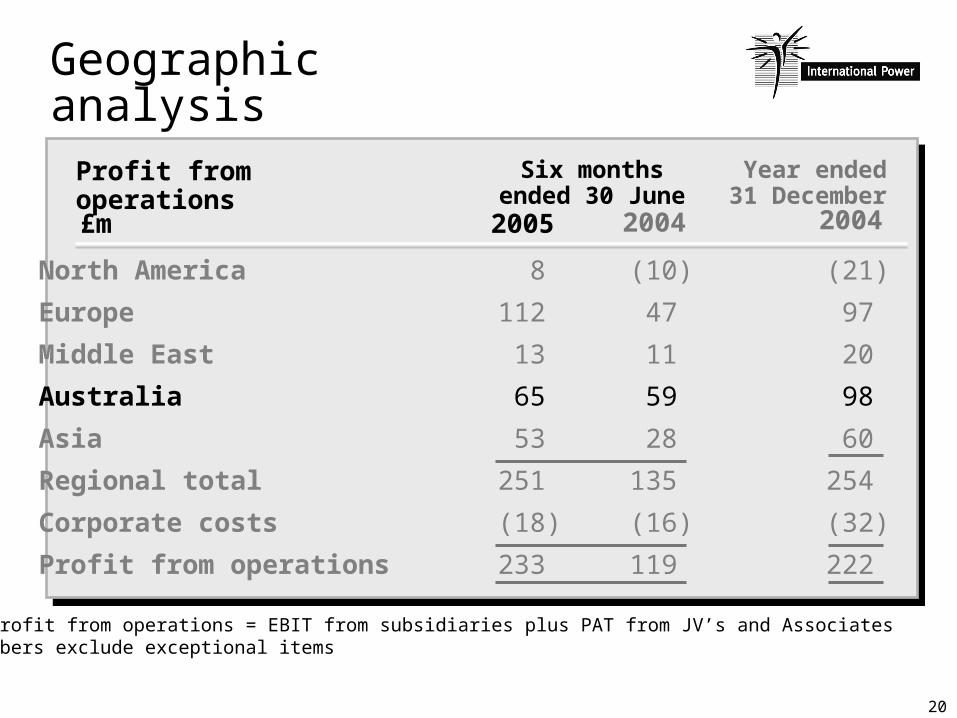
Geographic analysis
Note: Profit from operations = EBIT from subsidiaries plus PAT from JV’s and AssociatesAll numbers exclude exceptional items
Six months ended 30 June
20042005£m
Year ended31 December
2004
North America
Europe
Middle East
Australia
Asia
Regional total
Corporate costs
Profit from operations
8
112
13
65
53
251
(18)
233
(10)
47
11
59
28
135
(16)
119
(21)
97
20
98
60
254
(32)
222
Profit from operations
21
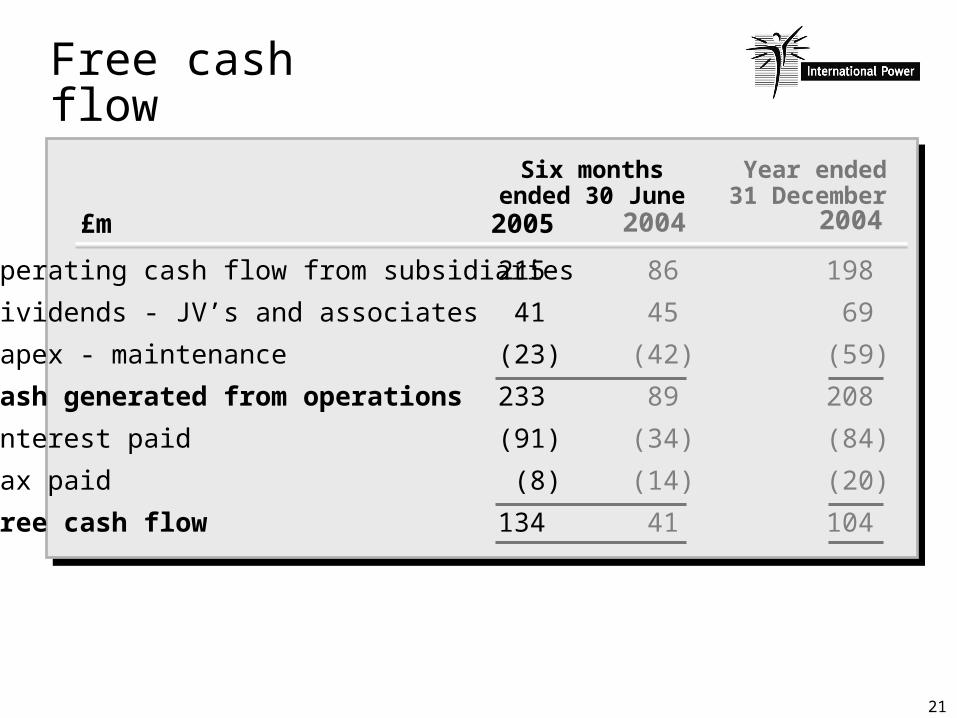
Free cash flow
Six months ended 30 June
20042005£m
Year ended31 December
2004
Operating cash flow from subsidiaries
Dividends - JV’s and associates
Capex - maintenance
Cash generated from operations
Interest paid
Tax paid
Free cash flow
215
41
(23)
233
(91)
(8)
134
86
45
(42)
89
(34)
(14)
41
198
69
(59)
208
(84)
(20)
104
22
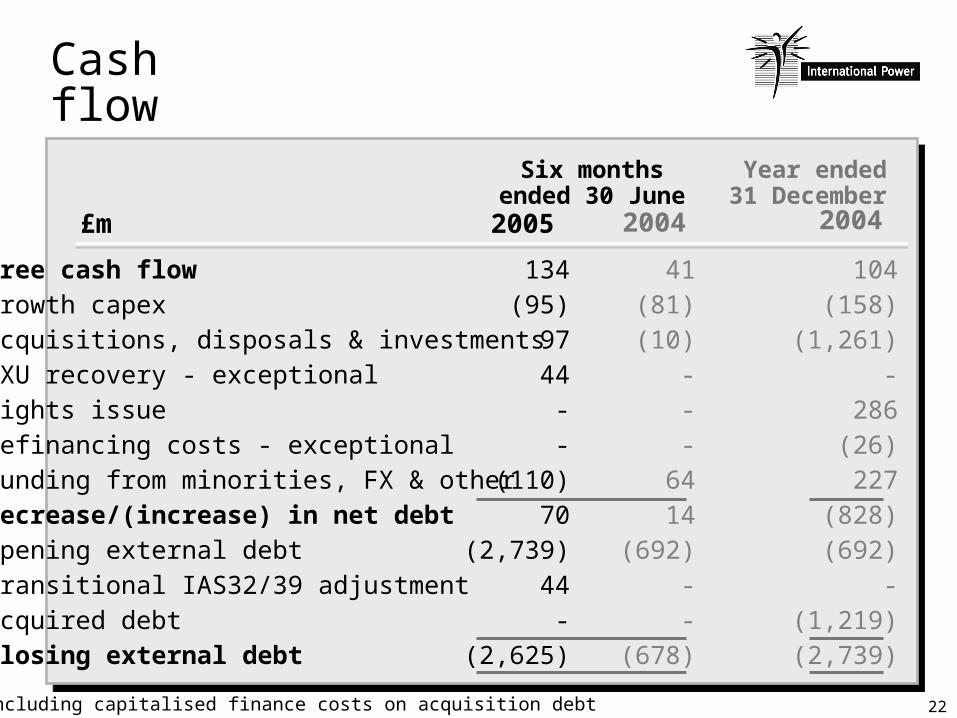
Cash flow
Six months ended 30 June
20042005£m
Year ended31 December
2004
Free cash flowGrowth capexAcquisitions, disposals & investmentsTXU recovery - exceptional Rights issueRefinancing costs - exceptional Funding from minorities, FX & otherDecrease/(increase) in net debtOpening external debtTransitional IAS32/39 adjustmentAcquired debt Closing external debt
134(95)
9744
--
(110)70
(2,739)44
-(2,625)
41(81)(10)
---
6414
(692)--
(678)
104(158)
(1,261)-
286(26)227
(828)(692)
-(1,219)(2,739)
* Including capitalised finance costs on acquisition debt
23
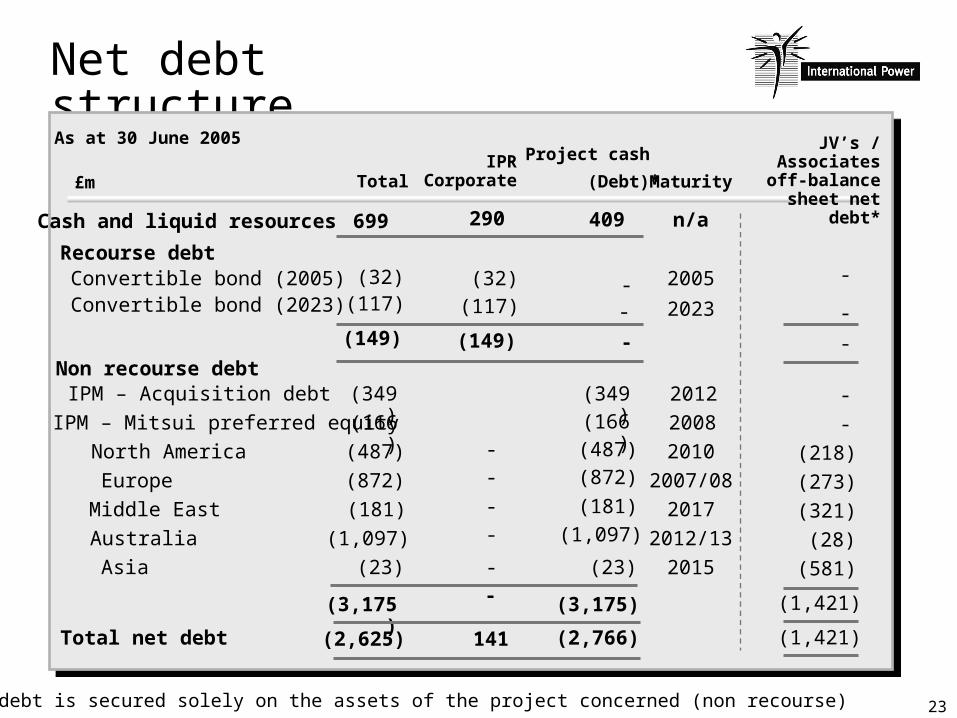
Net debt structure
Total net debt
Europe Middle East
Asia Australia
North America
Non recourse debt
Convertible bond (2023) Convertible bond (2005)
Recourse debt
Cash and liquid resources
£m
IPM – Acquisition debt
(2,625)
(3,175)
(23)
(181)(872)
(1,097)
(487)
(149)
(117)(32)
699
Total
(349)
141
-
-
-
-
(149)
-
-
(117)(32)
290
IPRCorporate
(2,766)
(3,175)
(23)
(181)
(872)
(1,097)
(487)
-
--
409
Project cash
(Debt)*
(349)
2015
20172007/08
2012/13
2010
2023
n/a
Maturity
2012
2005
2008(166)
(166)
IPM – Mitsui preferred equity
(1,421)
(581)
(321)(273)
(28)
(218)
JV’s / Associates off-balance
sheet net debt*
-
(1,421)
-
-
-
-
* Project debt is secured solely on the assets of the project concerned (non recourse)
As at 30 June 2005
Recommended