1
Patron Queuing System
Team GongArchit Agarwal
Thanh Nguyen
Adnan Salam
2
Overview
Background MDR Specifications Restrictions Principles of operation System block diagram Sensor configurations MySQL Database Marketing Q & A
3
Background
Customers waiting in line Avoid wasting time
– Avoid waiting in line– Profitable to businesses
Less waiting time = more happy customers = more business = more money
Consistent customer flow
4
MDR Specification
A robust sensor system– With environmental protection
Intelligent algorithms computing waiting time MySQL Database Web server User friendly web site ECS portal advertising

5
Special Restriction
The PQS system can only work in the presence of an Wireless Internet connection
The sensing area should be narrow enough so that only one patron will get counted at a time
Different settings require different setups; i.e. it’s not generic
Any further restrictions will be considered upon evaluation results

6
Principle of Operation
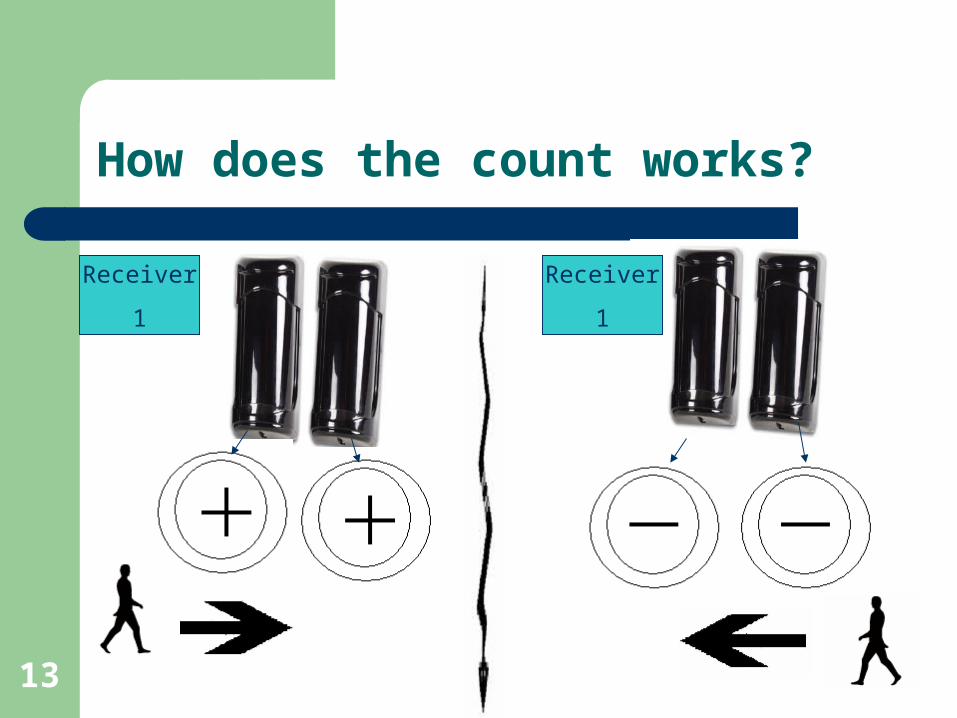
Simple setup – One transmitter and two receivers
The PQS project relies heavily on the accuracy of the sensors
The controller board stores the current count for the number of customers at our clients location
Determine Congestion Level

7
Principle of Operation
Apache server hosting a multi-thread java server and Web services
A real time updated graph – every 30 seconds interval
Advanced Algorithms will be used to calculate wait time
Data transmitted via WIFI network
8
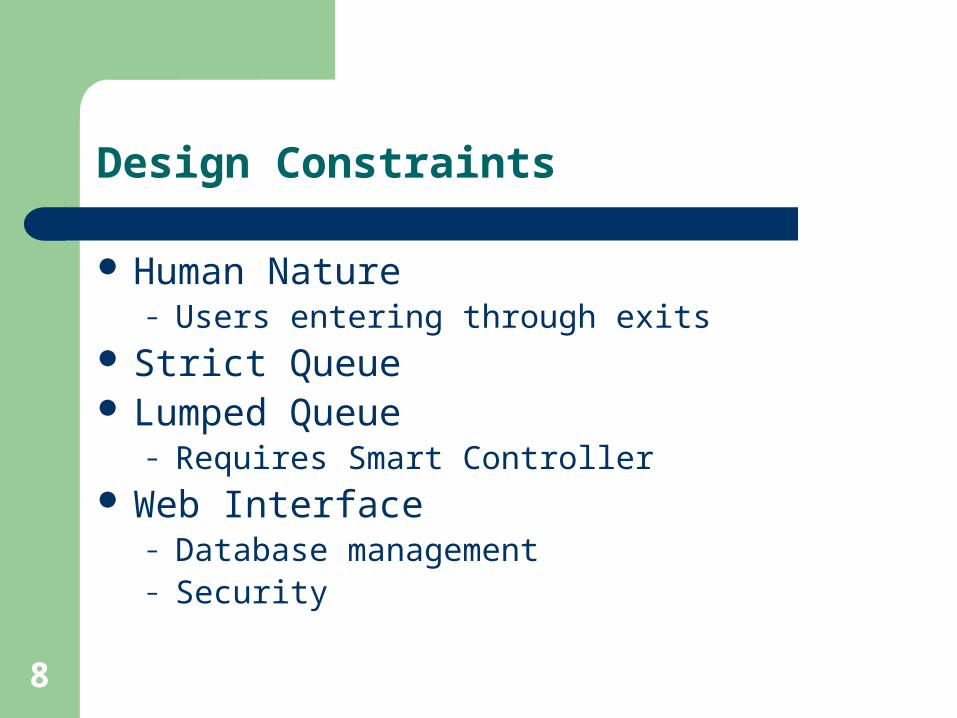
Design Constraints
Human Nature– Users entering through exits
Strict Queue Lumped Queue
– Requires Smart Controller Web Interface
– Database management– Security
9
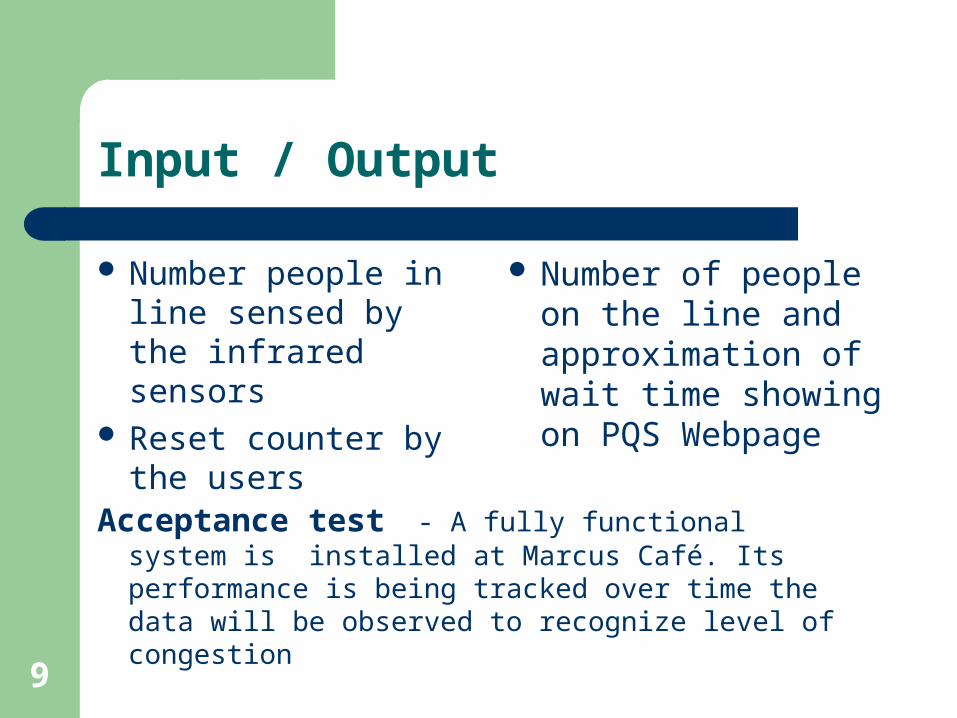
Input / Output
Number people in line sensed by the infrared sensors
Reset counter by the users
Number of people on the line and approximation of wait time showing on PQS Webpage
Acceptance test - A fully functional system is installed at Marcus Café. Its performance is being tracked over time the data will be observed to recognize level of congestion
10
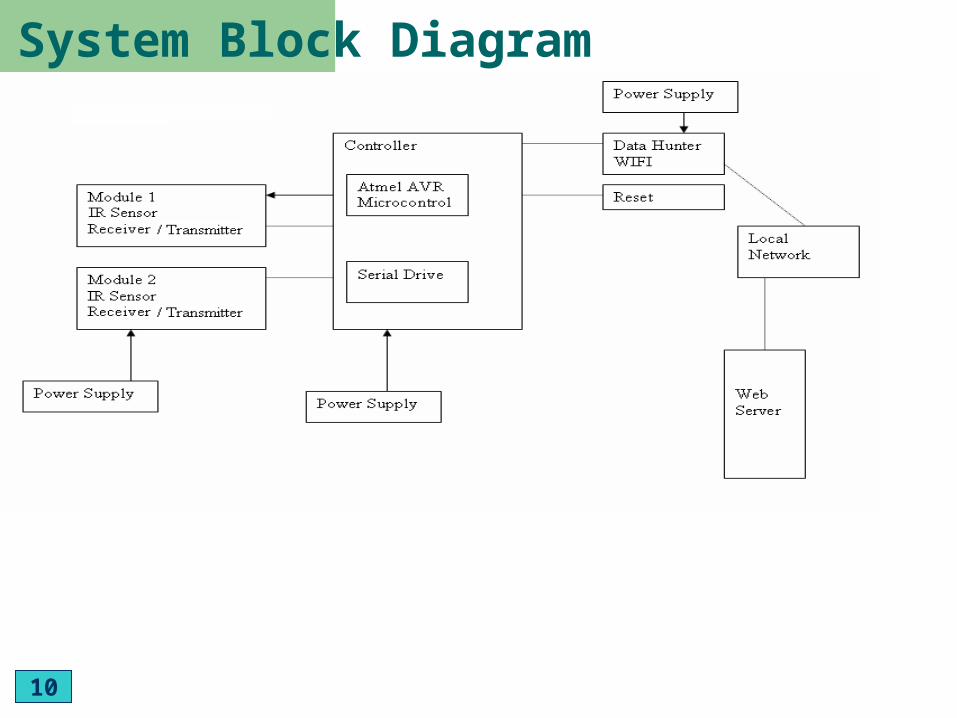
System Block Diagram
10

11
Sensor Configurations
Lensed optics reinforce beam strength and provide excellent immunity to false alarms
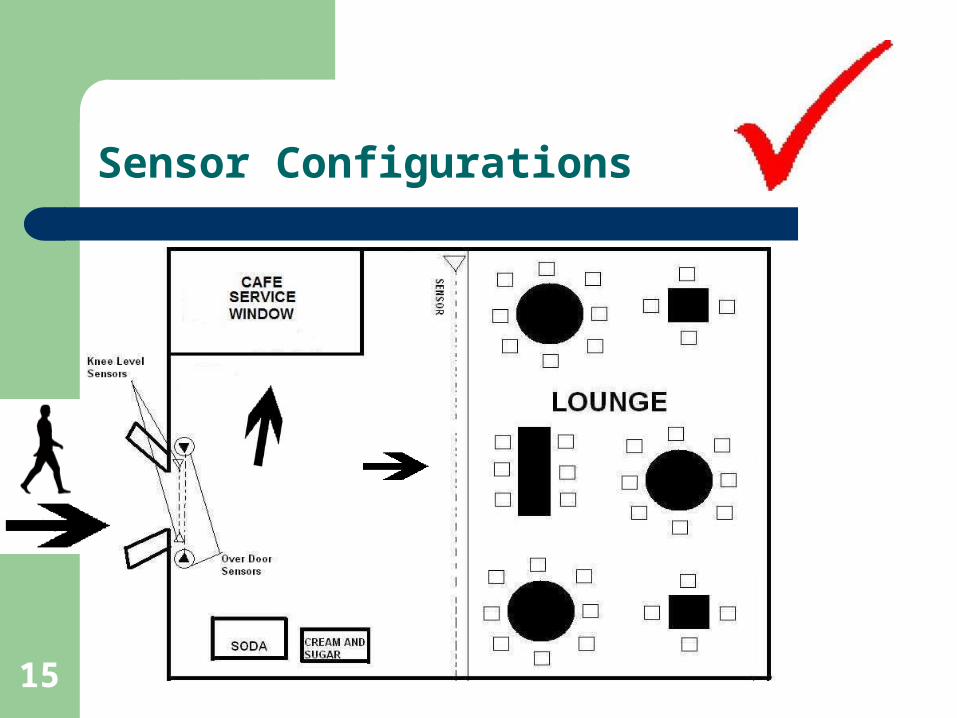
– 2 sets of sensors for the receiver– 100 meters range– Power Via Ethernet (5V) or DC power adapter– A delay time of 50ms. (700ms)– Built in laser beam alignment system
Automatic input power filtering with special noise rejection circuitry
12
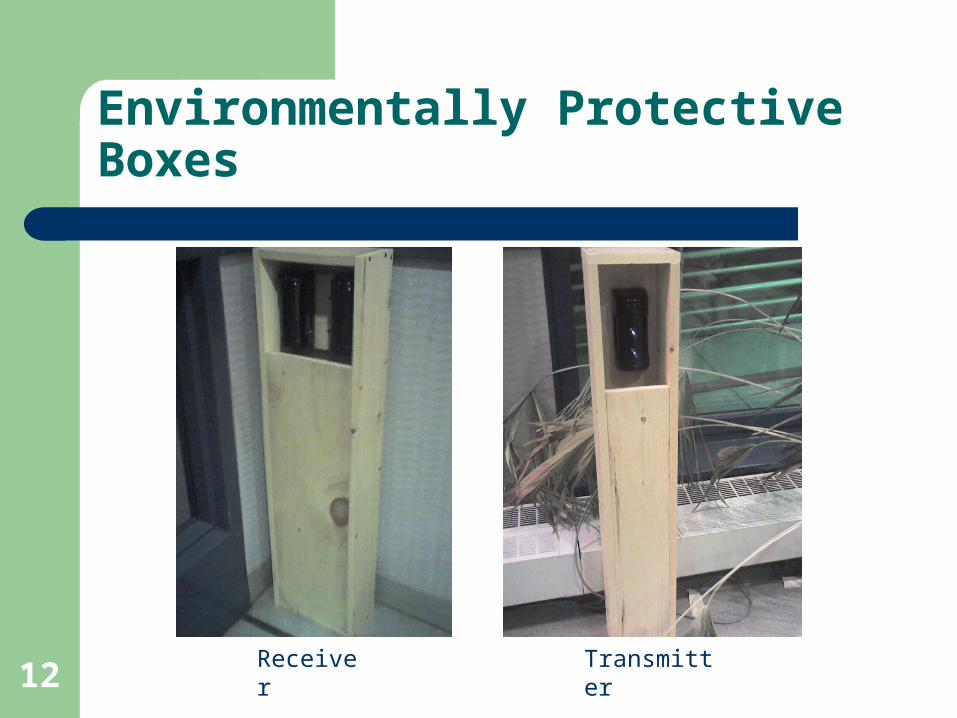
Environmentally Protective Boxes
TransmitterReceiver
13
How does the count works?
Receiver
1
Receiver
1
14
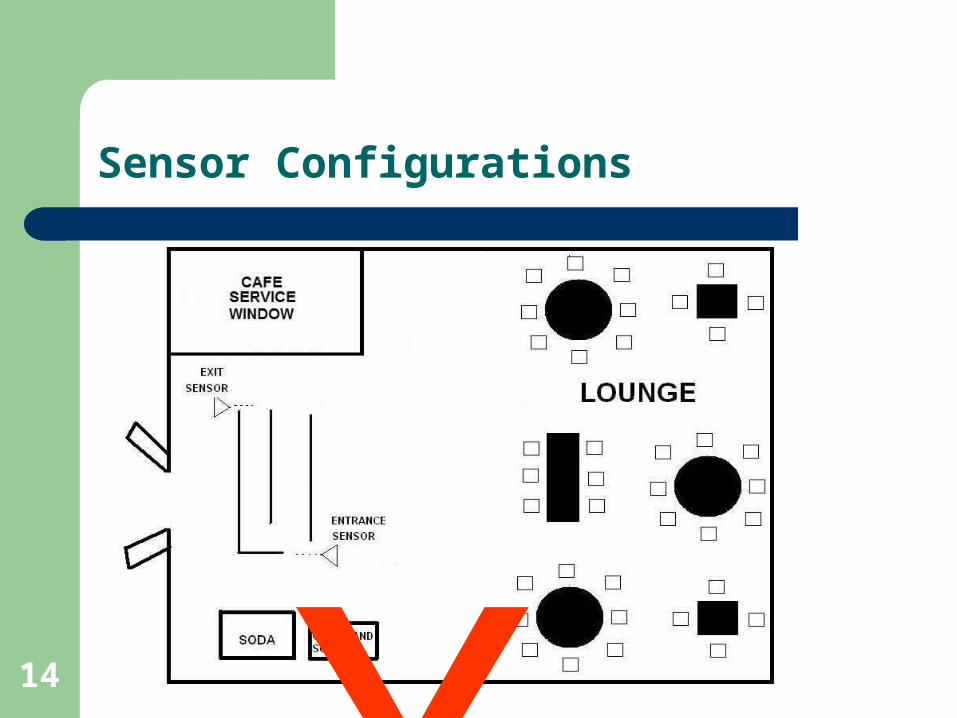
Sensor Configurations
X
15
Sensor Configurations
16
MySQL Database
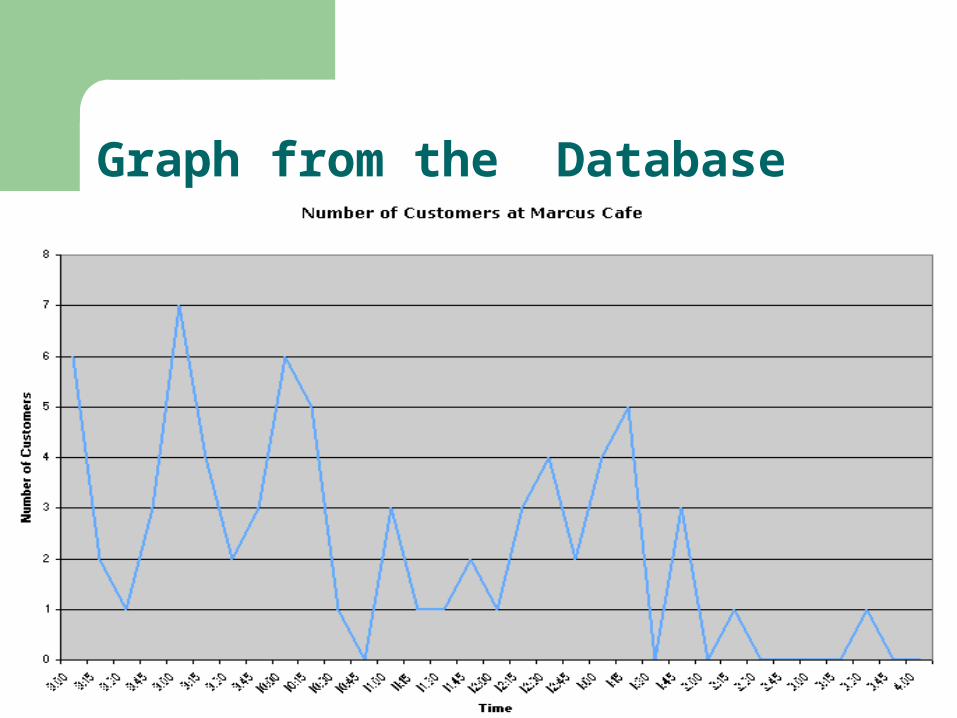
4 tables storing data every 30 seconds, 5 minutes, 15 minutes, and 30 minutes.– Data stored every 30 seconds for an hour– 5 minutes for a week– 15 minutes for 6 months– 30 minutes for 3 years
30 second table is used for wait time approximation; rest are used for statistics purposes
17
Graph from the Database
18
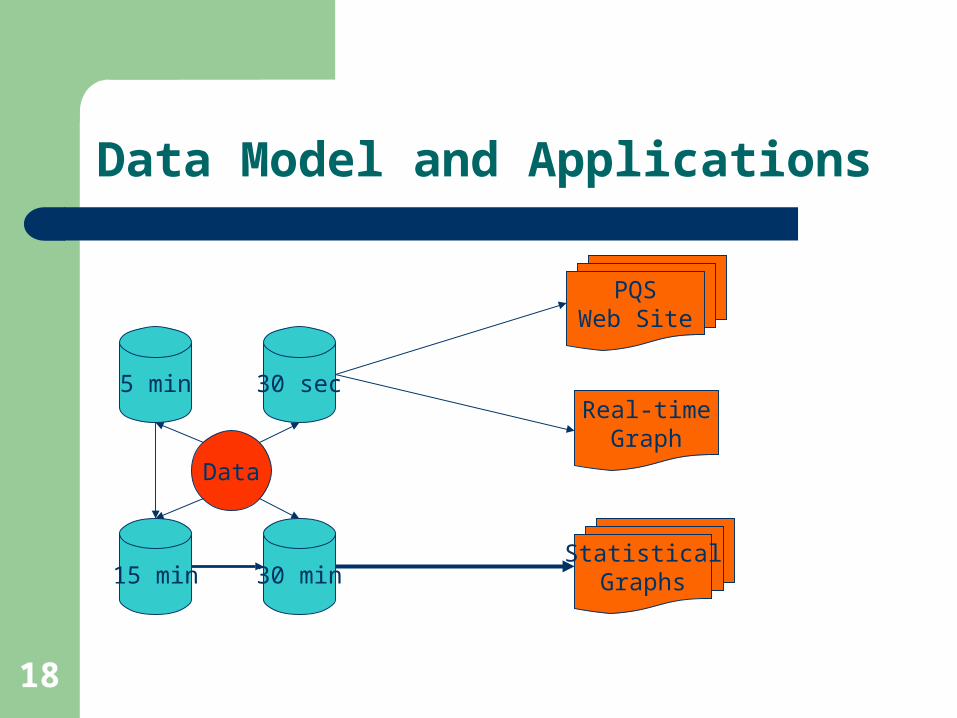
Data Model and Applications
30 sec
30 min15 min
5 min
Data
PQSWeb Site
StatisticalGraphs
Real-timeGraph
19
Wait Time Algorithm
Compare number of people leaving in last 10 minutes to get approximate time / person.
Multiply the approximate time / person with number of people in line.
In case no customers were in line in last 5-10 minutes, use a default approximate multiplier.
20
Determining Success
Installed and Functioning PQS PQS data corresponds to observed data Will install in Bursars office (Permission
process) Customer Feedback Reasonable Cost
21
Marketing
Marcus Café– Market Web site– ECS Portal
Bursars Office– Daily Collegian– Posters
22
Why PQS ????
Testing – Functional testing– User interface testing– Maintenance testing
Marketing– Most engineers have low opinion about marketing– Consumer approach

23
Q & A
Questions and Comments
Recommended