1
MGT 821/ECON 873
Volatility Smiles &
Extension of Models

What is a Volatility Smile?
It is the relationship between implied volatility and strike price for options with a certain maturity
The volatility smile for European call options should be exactly the same as that for European put options
The same is at least approximately true for American options
2

3
Why the Volatility Smile is the Same for Calls and Put
Put-call parity p +S0e-qT = c +Ke–r T holds for market prices (pmkt and cmkt) and for Black-Scholes prices (pbs and cbs)
It follows that pmkt−pbs=cmkt−cbs
When pbs=pmkt, it must be true that cbs=cmkt
It follows that the implied volatility calculated from a European call option should be the same as that calculated from a European put option when both have the same strike price and maturity

4
The Volatility Smile for Foreign The Volatility Smile for Foreign Currency Options Currency Options
ImpliedVolatility
StrikePrice

5
Implied Distribution for Foreign Currency Options
Both tails are heavier than the lognormal distribution
It is also “more peaked” than the lognormal distribution

6
The Volatility Smile for The Volatility Smile for Equity OptionsEquity Options
ImpliedVolatility
Strike
Price

7
Implied Distribution for Equity Options
The left tail is heavier and the right tail is less heavy than the lognormal distribution

8
Other Volatility Smiles?
What is the volatility smile if True distribution has a less heavy left tail and
heavier right tail True distribution has both a less heavy left
tail and a less heavy right tail
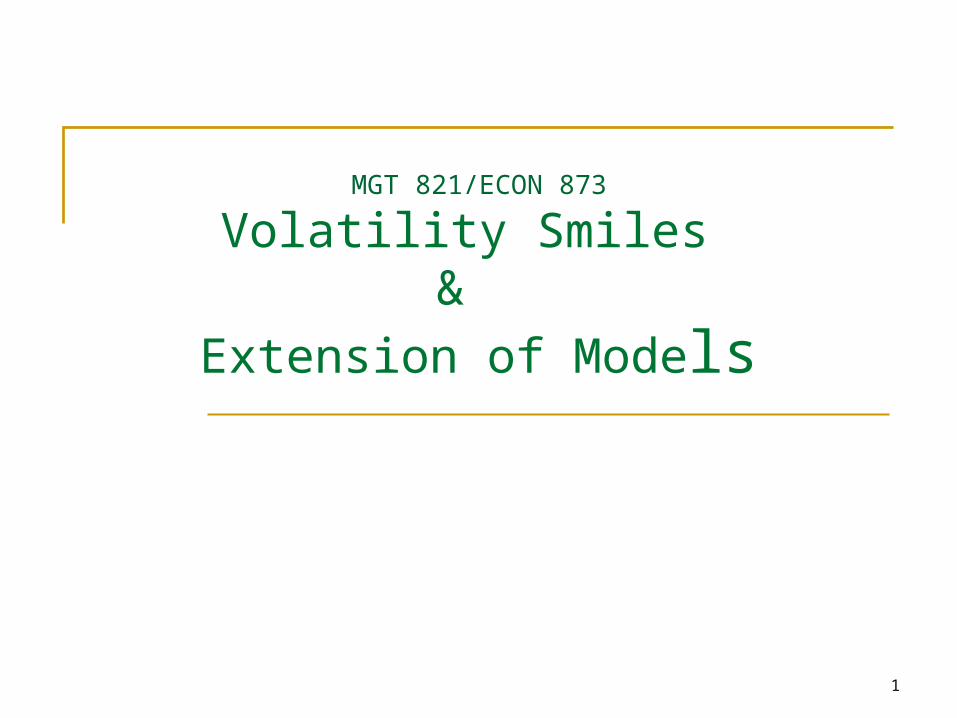
Ways of Characterizing the Volatility Smiles Plot implied volatility against K/S0 (The volatility
smile is then more stable) Plot implied volatility against K/F0 (Traders usually
define an option as at-the-money when K equals the forward price, F0, not when it equals the spot price S0)
Plot implied volatility against delta of the option (This approach allows the volatility smile to be applied to some non-standard options. At-the money is defined as a call with a delta of 0.5 or a put with a delta of −0.5. These are referred to as 50-delta options)
9

10
Possible Causes of Volatility Smile Asset price exhibits jumps rather than
continuous changes Volatility for asset price is stochastic
In the case of an exchange rate volatility is not heavily correlated with the exchange rate. The effect of a stochastic volatility is to create a symmetrical smile
In the case of equities volatility is negatively related to stock prices because of the impact of leverage. This is consistent with the skew that is observed in practice
11
Volatility Term Structure
In addition to calculating a volatility smile, traders also calculate a volatility term structure
This shows the variation of implied volatility with the time to maturity of the option

12
Volatility Term Structure
The volatility term structure tends to be downward sloping when volatility is high and upward sloping when it is low

13
Example of a Volatility Example of a Volatility SurfaceSurface
K/S0 0.90 0.95 1.00 1.05 1.10
1 mnth 14.2 13.0 12.0 13.1 14.5
3 mnth 14.0 13.0 12.0 13.1 14.2
6 mnth 14.1 13.3 12.5 13.4 14.3
1 year 14.7 14.0 13.5 14.0 14.8
2 year 15.0 14.4 14.0 14.5 15.1
5 year 14.8 14.6 14.4 14.7 15.0
Greek Letters
If the Black-Scholes price, cBS is expressed as a function of the stock price, S, and the implied volatility, imp, the delta of a call is
Is the delta higher or lower than
14
S
c
S
c
imp
imp
BSBS
S
c
BS

15
Three Alternatives to Geometric Three Alternatives to Geometric Brownian MotionBrownian Motion
Constant elasticity of variance (CEV) Mixed Jump diffusion Variance Gamma

16
CEV Model
When = 1 the model is Black-Scholes When > 1 volatility rises as stock price
rises When < 1 volatility falls as stock price
risesEuropean option can be value analytically in terms of the cumulative non-central chi square distribution
dzSSdtqrdS )(

17
CEV Models Implied Volatilities
imp
K
< 1
> 1
18
Mixed Jump Diffusion
Merton produced a pricing formula when the asset price follows a diffusion process overlaid with random jumps
dp is the random jump k is the expected size of the jump dt is the probability that a jump occurs in the next interval of length dt
dpdzdtkqrSdS )(/

19
Jumps and the Smile
Jumps have a big effect on the implied volatility of short term options
They have a much smaller effect on the implied volatility of long term options

20
The Variance-Gamma ModelThe Variance-Gamma Model Define g as change over time T in a variable
that follows a gamma process. This is a process where small jumps occur frequently and there are occasional large jumps
Conditional on g, ln ST is normal. Its variance proportional to g
There are 3 parameters v, the variance rate of the gamma process the average variance rate of ln S per unit time a parameter defining skewness

21
Understanding the Variance-Understanding the Variance-Gamma ModelGamma Model g defines the rate at which information arrives
during time T (g is sometimes referred to as measuring economic time)
If g is large the change in ln S has a relatively large mean and variance
If g is small relatively little information arrives and the change in ln S has a relatively small mean and variance

22
Time Varying Volatility
Suppose the volatility is 1 for the first year and 2 for the second and third
Total accumulated variance at the end of three years is 1
2 + 222
The 3-year average volatility is2 2
2 2 2 1 21 2
23 2 ;
3

23
Stochastic Volatility Models
When V and S are uncorrelated a European option price is the Black-Scholes price integrated over the distribution of the average variance
VL
S
dzVdtVVadV
dzVdtqrS
dS
)(
)(

24
Stochastic Volatility Models Stochastic Volatility Models continuedcontinued
When V and S are negatively correlated we obtain a downward sloping volatility skew similar to that observed in the market for equities
When V and S are positively correlated the skew is upward sloping. (This pattern is sometimes observed for commodities)

25
The IVF ModelThe IVF Model
SdztSSdttqtrdS
SdzSdtqrdS
),()]()([
by replaced is
)(
model
motion Brownian geomeric usual The prices.
option observed matchesexactly that price
asset for the process a create todesigned
is modelfunction y volatilitimplied The

26
The Volatility FunctionThe Volatility Function
The volatility function that leads to the model matching all European option prices is
)(
)]()([)(2
)],([
222
2
KcK
KctqtrKctqtc
tK
mkt
mktmktmkt

27
Strengths and Weaknesses of the IVF Model The model matches the probability distribution
of asset prices assumed by the market at each future time
The models does not necessarily get the joint probability distribution of asset prices at two or more times correct
Recommended