1
Math 10
Part 3Discrete Random Variables
© Maurice Geraghty 2013
2
Random Variable The value of the variable depends
on an experiment, observation or measurement.
The result is not known in advance. For the purposes of this class, the
variable will be numeric.
3
Random Variables Discrete – Data that you Count
Defects on an assembly line Reported Sick days RM 7.0 earthquakes on San Andreas
Fault Continuous – Data that you Measure
Temperature Height Time
4
Discrete Random Variable List Sample Space Assign probabilities P(x) to each event
x Use “relative frequencies” Must follow two rules
P(x) 0 P(x) = 1
P(x) is called a Probability Distribution Function or pdf for short.
5
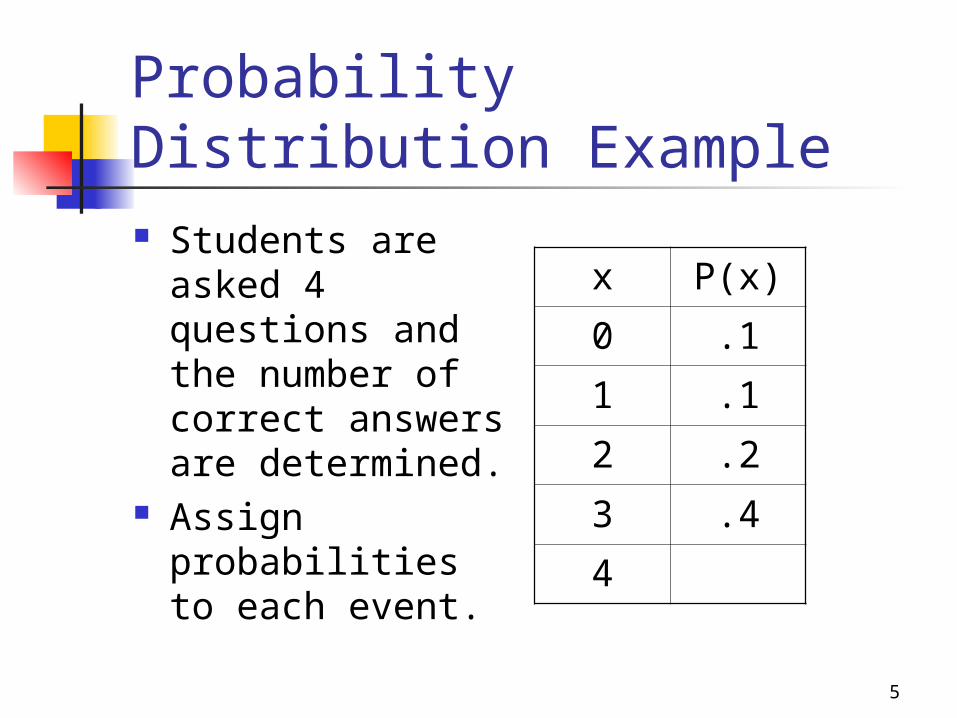
Probability Distribution Example Students are
asked 4 questions and the number of correct answers are determined.
Assign probabilities to each event.
x P(x)
0 .1
1 .1
2 .2
3 .4
4

6
Probability Distribution Example Students are
asked 4 questions and the number of correct answers are determined.
Assign probabilities to each event.
x P(x)
0 .1
1 .1
2 .2
3 .4
4 .2
7
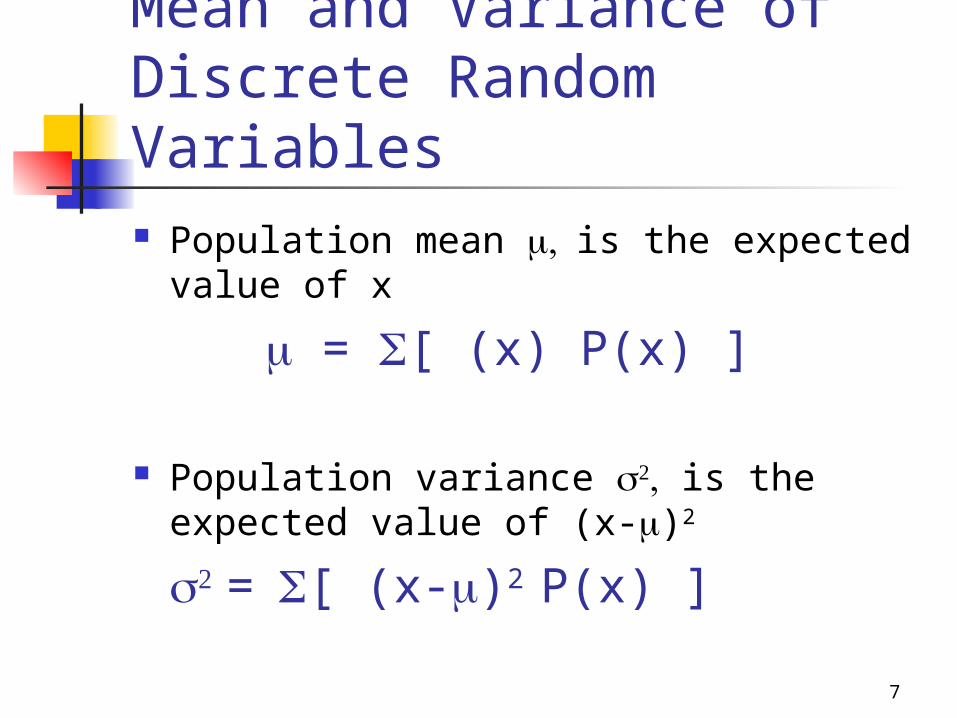
Mean and Variance of Discrete Random Variables Population mean is the expected
value of x
= [ (x) P(x) ]
Population variance is the expected value of (x-)2
=[ (x-)2 P(x) ]
8
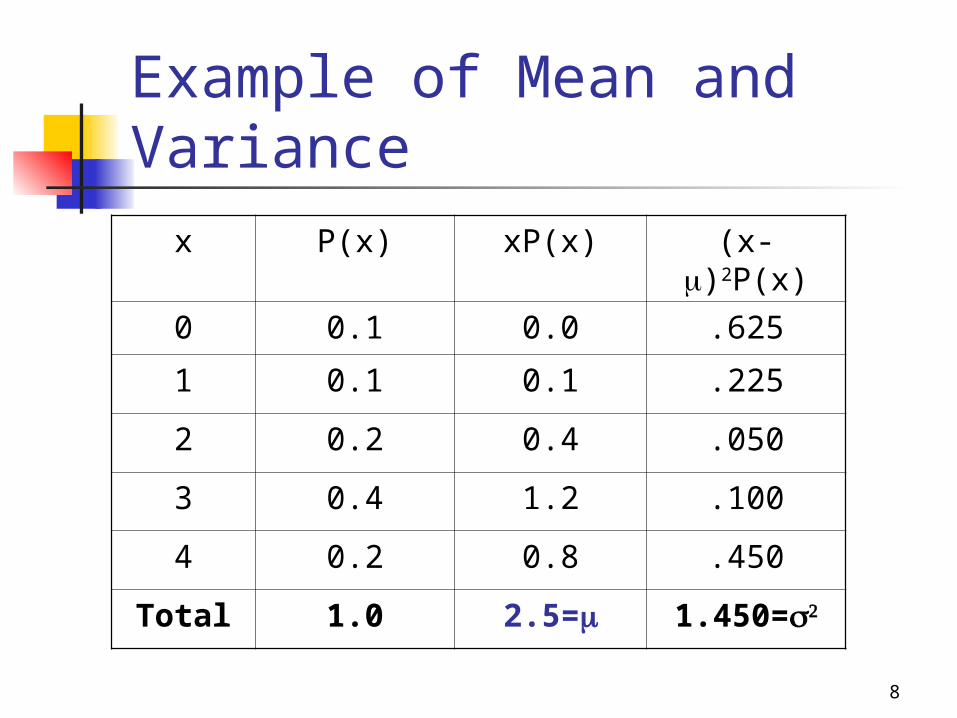
Example of Mean and Variance
x P(x) xP(x) (x-)2P(x)
0 0.1 0.0 .625
1 0.1 0.1 .225
2 0.2 0.4 .050
3 0.4 1.2 .100
4 0.2 0.8 .450
Total 1.0 2.5= 1.450=
9
Bernoulli Distribution Experiment is one trial 2 possible outcomes
(Success,Failure) p=probability of success q=probability of failure X=number of successes (1 or 0) Also known as Indicator Variable
10
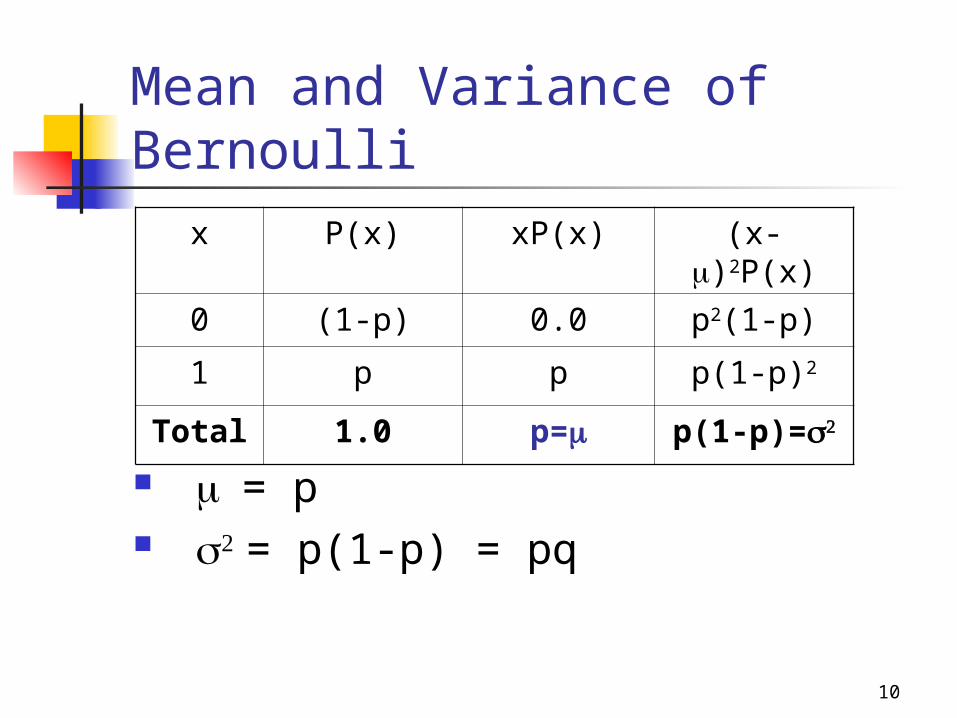
Mean and Variance of Bernoulli
= p= p(1-p) = pq
x P(x) xP(x) (x-)2P(x)
0 (1-p) 0.0 p2(1-p)
1 p p p(1-p)2
Total 1.0 p= p(1-p)=
11
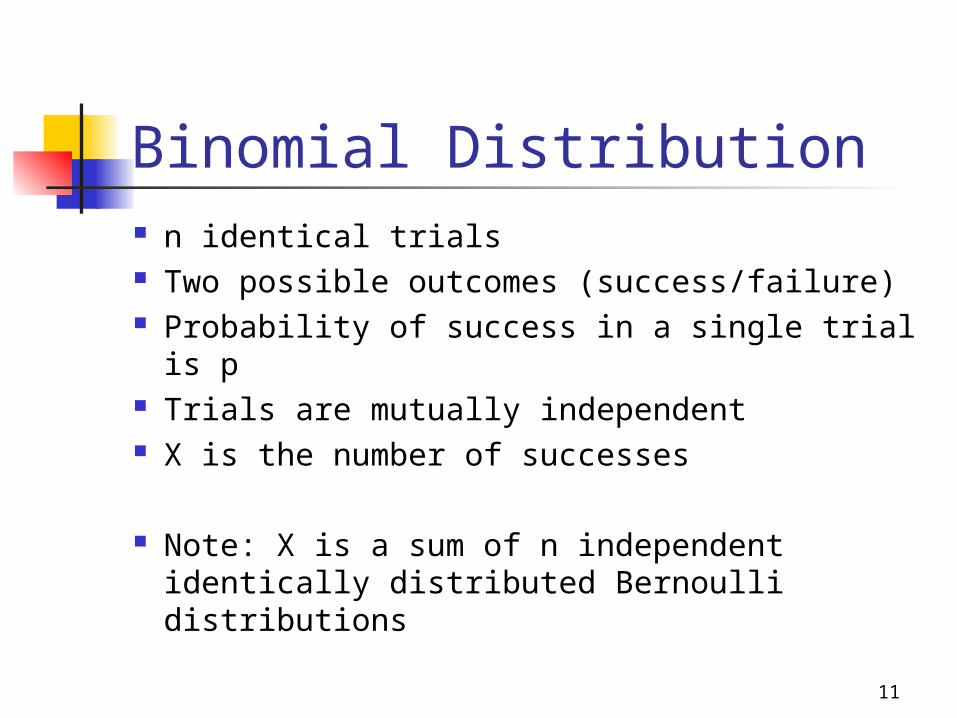
Binomial Distribution n identical trials Two possible outcomes (success/failure) Probability of success in a single trial is p Trials are mutually independent X is the number of successes
Note: X is a sum of n independent identically distributed Bernoulli distributions

12
Binomial Distribution n independent Bernoulli trials Mean and Variance of Binomial Distribution is
just sample size times mean and variance of Bernoulli Distribution
)1()(
)(
)1()(
2 pnpXVar
npXE
ppCxp xnxxn
13
Binomial Examples The number of defective parts in a
fixed sample. The number of adults in a sample
who support the war in Iraq. The number of correct answers if
you guess on a multiple choice test.
14
Binomial Example 90% of intake valves manufactured
are good (not defective). A sample of 10 is selected.
Find the probability of exactly 8 good valves being chosen.
Find the probability of 9 or more good valves being chosen.
Find the probability of 8 or less good valves being chosen.
15
Using Technology
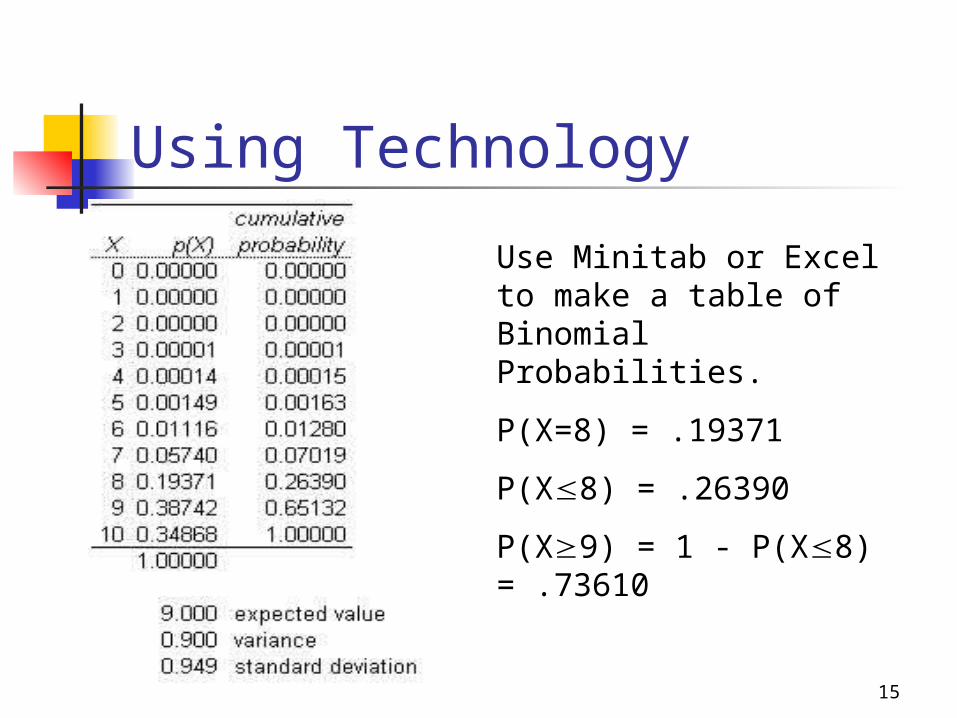
Use Minitab or Excelto make a table of Binomial Probabilities.
P(X=8) = .19371
P(X8) = .26390
P(X9) = 1 - P(X8) = .73610
16
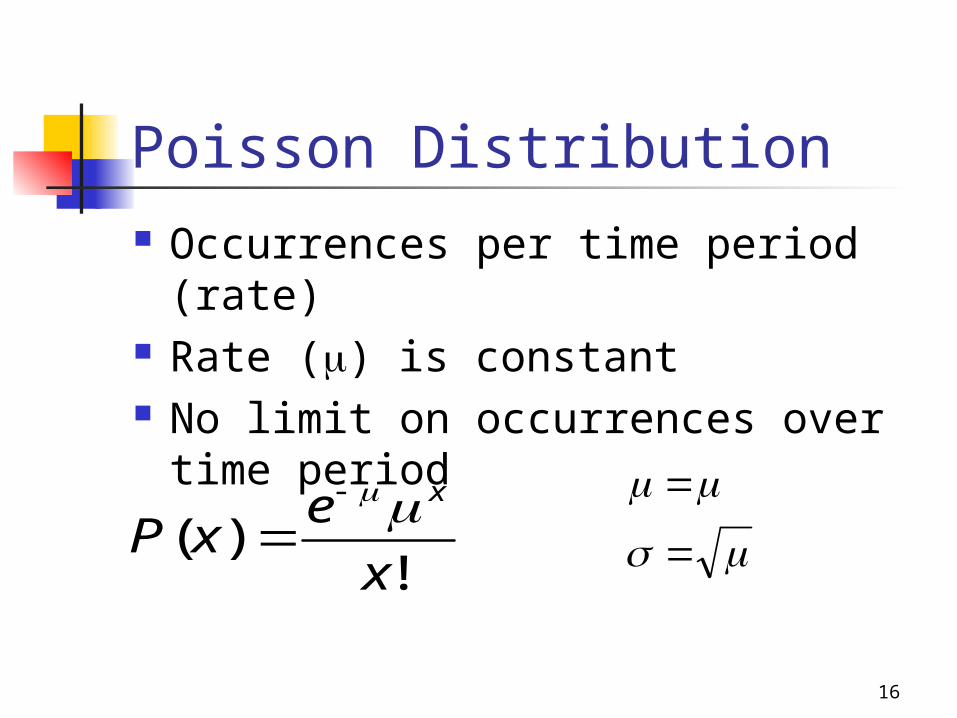
Poisson Distribution Occurrences per time period (rate) Rate () is constant No limit on occurrences over time
period
!)(
x
exP
x
17
Examples of Poisson Text messages in the next hour Earthquakes on a fault Customers at a restaurant Flaws in sheet metal produced Lotto winnersNote: A binomial distribution with a large n and small p is
approximately Poisson with np.
18
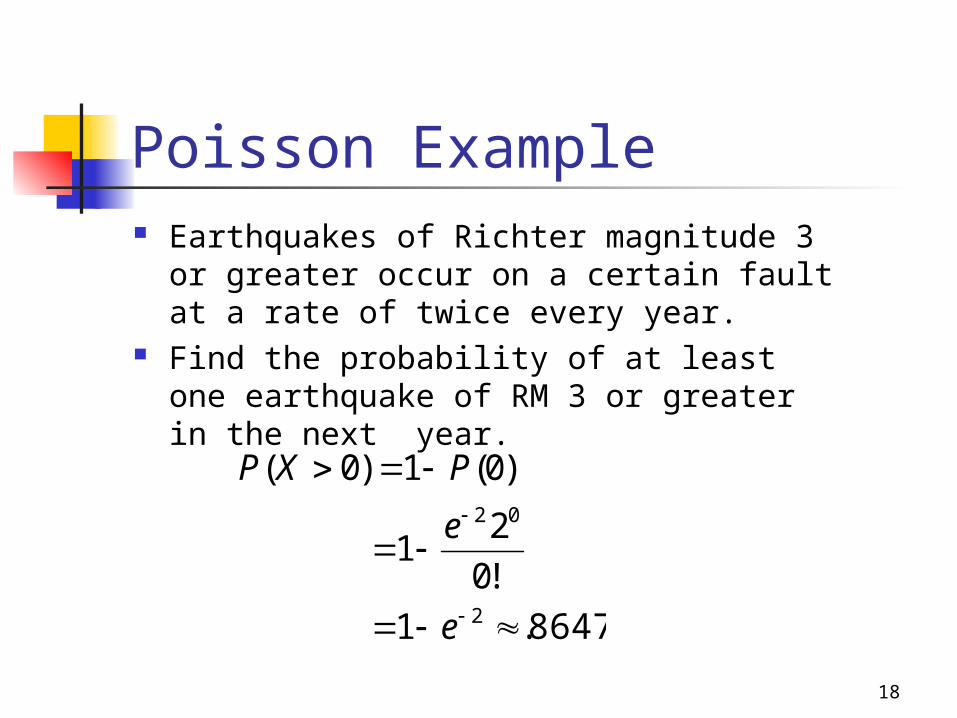
Poisson Example Earthquakes of Richter magnitude 3 or
greater occur on a certain fault at a rate of twice every year.
Find the probability of at least one earthquake of RM 3 or greater in the next year.
8647.1
!0
21
)0(1)0(
2
02
e
e
PXP
19
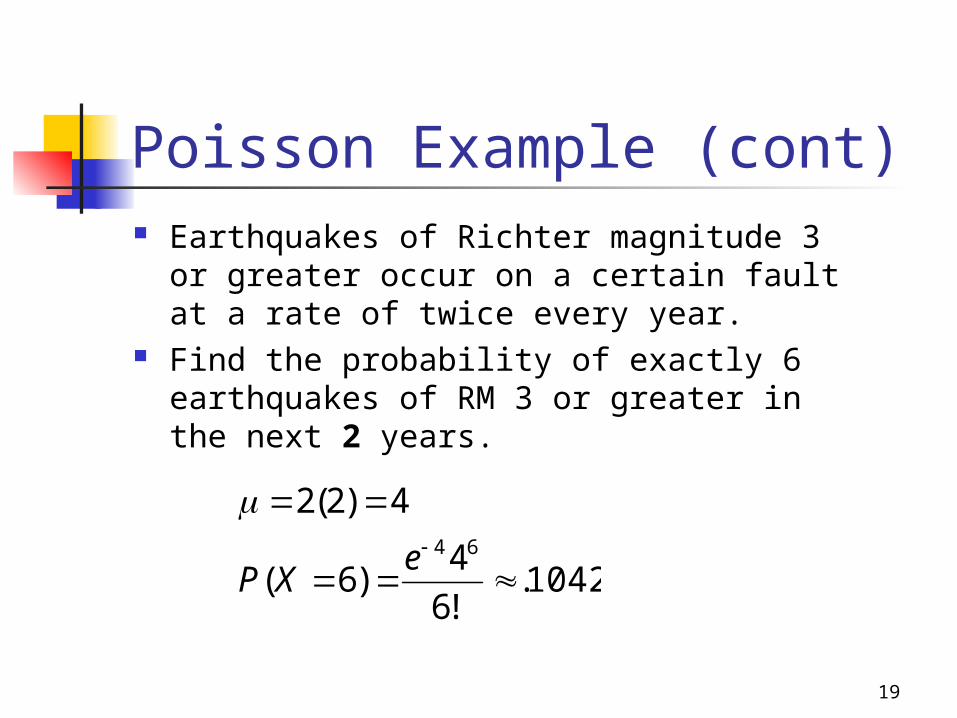
Poisson Example (cont) Earthquakes of Richter magnitude 3 or
greater occur on a certain fault at a rate of twice every year.
Find the probability of exactly 6 earthquakes of RM 3 or greater in the next 2 years.
1042.!6
4)6(
4)2(264
e
XP
Recommended