1
Intelligent Modeling for Decision Making
Katta G. MurtyIndustrial and Operations Engineering
University of Michigan Ann Arbor, Michigan 48109-2117 USA
2
Operations Research (OR) Deals With Making Optimal Decisions
Main strategy: Construct math model for decision problem
List all relevant decision variables, bounds and constraints on them (from the way the system operates), objective function(s) to optimize
Solve model using efficient algorithm to find optimal solutions
Make necessary changes and implement solution

3
Math Modeling
OR theory developed efficient algorithms to solve several single objective decision models
But practitioners find no model in OR theory fits their problem well Real world problems usually multi-objective and lack nice structure
of models discussed in theory, there is a big gap between theory and practice.
The gap between practice and theory and its bridge
4
Math Modeling (continued)
To get good results, essential to model intelligently using heuristic modifications, approximations, relaxations, hierarchical decomposition
Will illustrate this using work done at Hong Kong Container Port, and a bus rental company in Seoul
5
“Achieving Elastic Capacity Through Data-intensive
Decision Support System (DSS)”
Professor Katta G. Murty
Industrial and Operations EngineeringUniversity of Michigan, Ann Arbor
Hong Kong University of Science & Technology
Work done at Hong Kong Container Port
6
HHong Kong ng Kong International TerminalsInternational Terminals
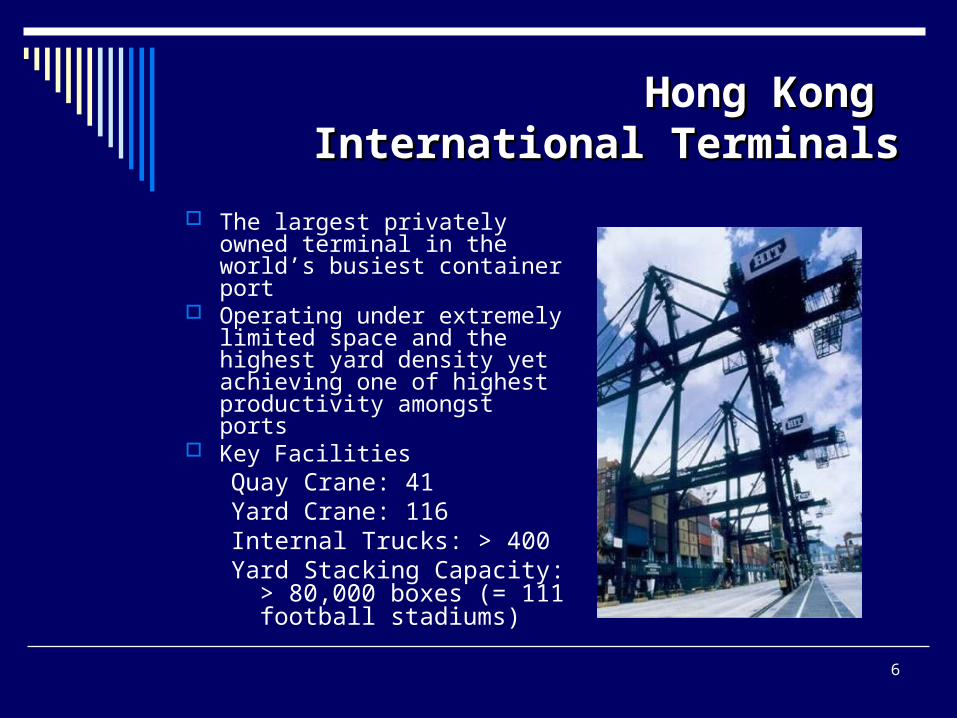
The largest privately owned terminal in the world’s busiest container port
Operating under extremely limited space and the highest yard density yet achieving one of highest productivity amongst ports
Key FacilitiesQuay Crane: 41Yard Crane: 116Internal Trucks: > 400Yard Stacking Capacity: >
80,000 boxes (= 111 football stadiums)
7
The Container Storage Yard
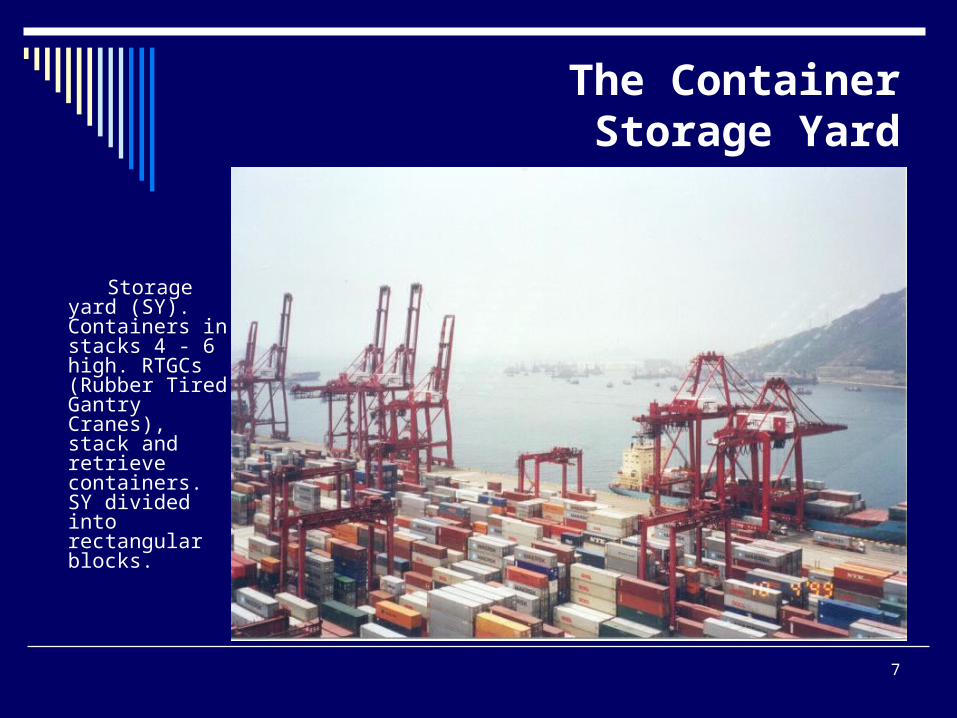
Storage yard (SY). Containers in stacks 4 - 6 high. RTGCs (Rubber Tired Gantry Cranes), stack and retrieve containers. SY divided into rectangular blocks.
8
Storage Block
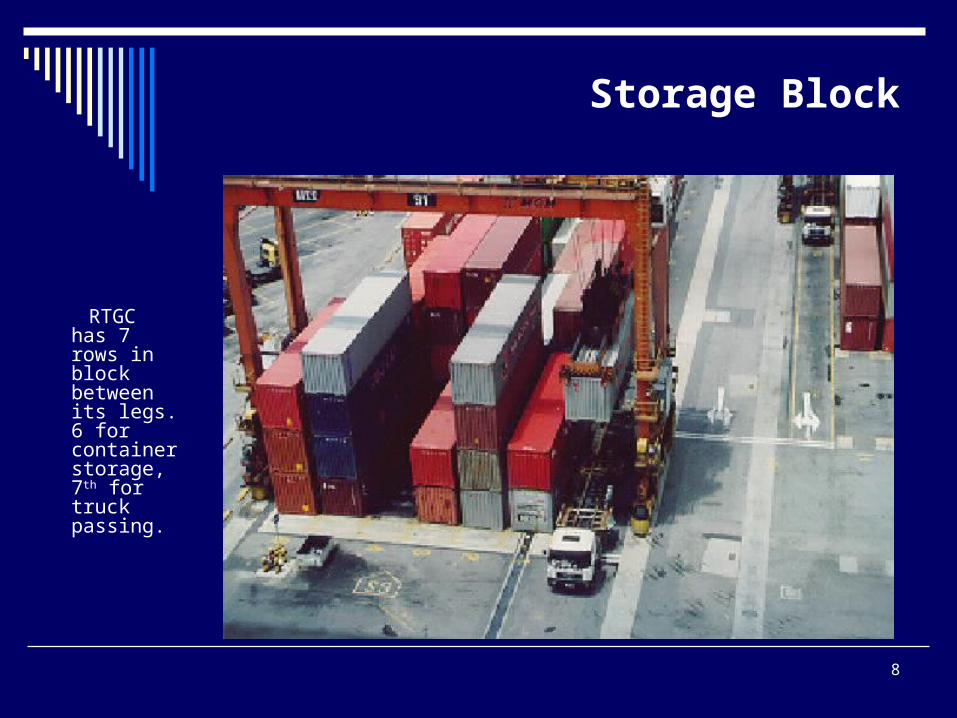
RTGC has 7 rows in block between its legs. 6 for container storage, 7th for truck passing.
9
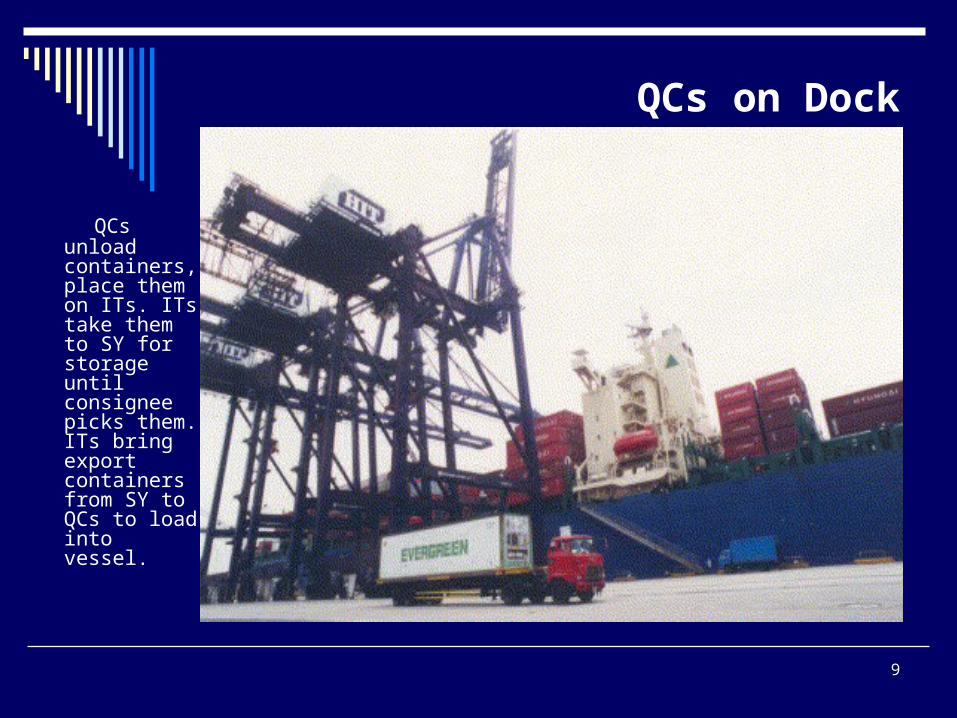
QCs on Dock
QCs unload containers, place them on ITs. ITs take them to SY for storage until consignee picks them. ITs bring export containers from SY to QCs to load into vessel.
10
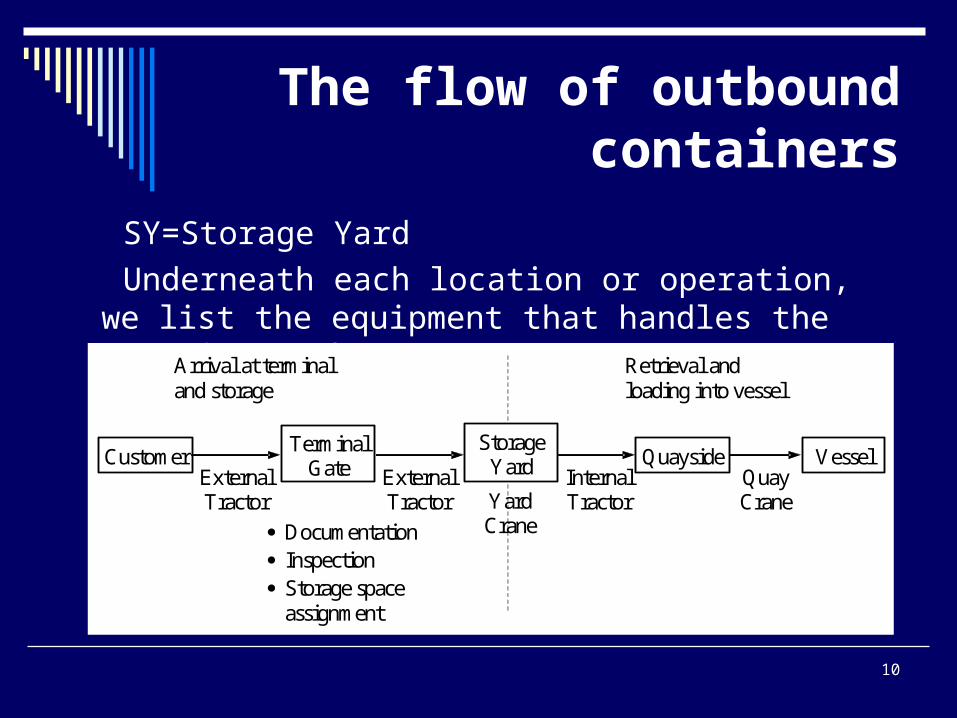
The flow of outbound containers
SY=Storage Yard
Underneath each location or operation, we list the equipment that handles the containers there
Customer Quayside Vessel Terminal
Gate Storage
Yard External Tractor
Internal Tractor
Quay Crane
Arrival at terminal and storage
Retrieval and loading into vessel
Documentation Inspection Storage space
assignment
External Tractor Yard
Crane
11
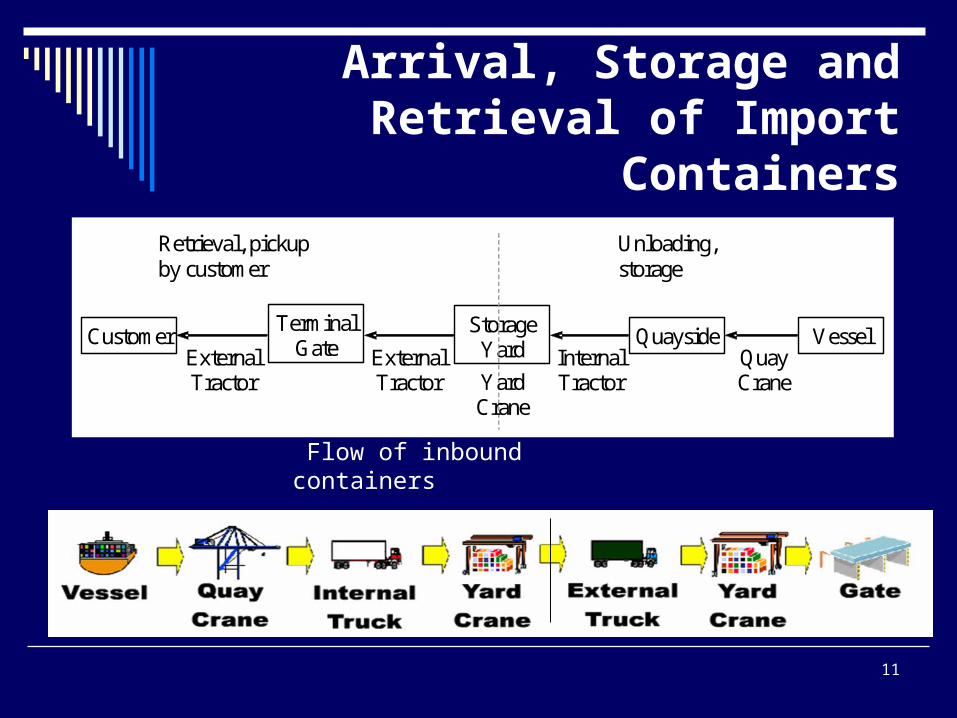
Arrival, Storage and Retrieval of Import Containers
Flow of inbound containers
Customer Quayside Vessel Terminal
Gate Storage
Yard External Tractor
Internal Tractor
Quay Crane
Retrieval, pickup by customer
Unloading, storage
External Tractor Yard
Crane
12
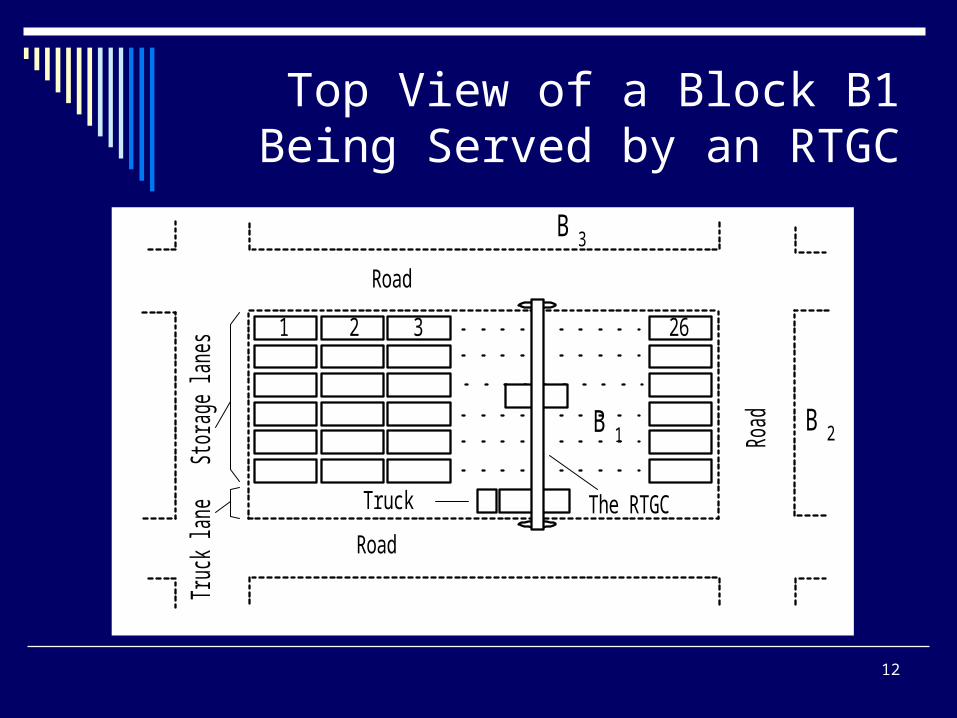
Top View of a Block B1 Being Served by an RTGC
The RTGC
Road
Road
Road
Truck
Truc
k la
neSt
orag
e lan
es
B 1
B 3
B 2
1 2632
13
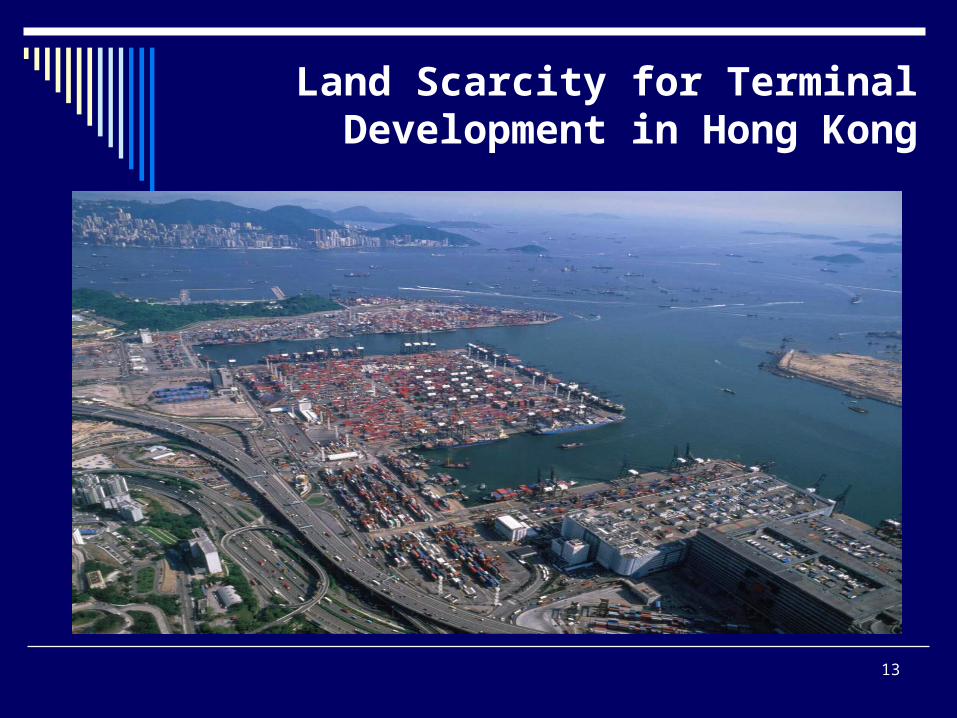
Land Scarcity for Terminal Development in Hong Kong
14
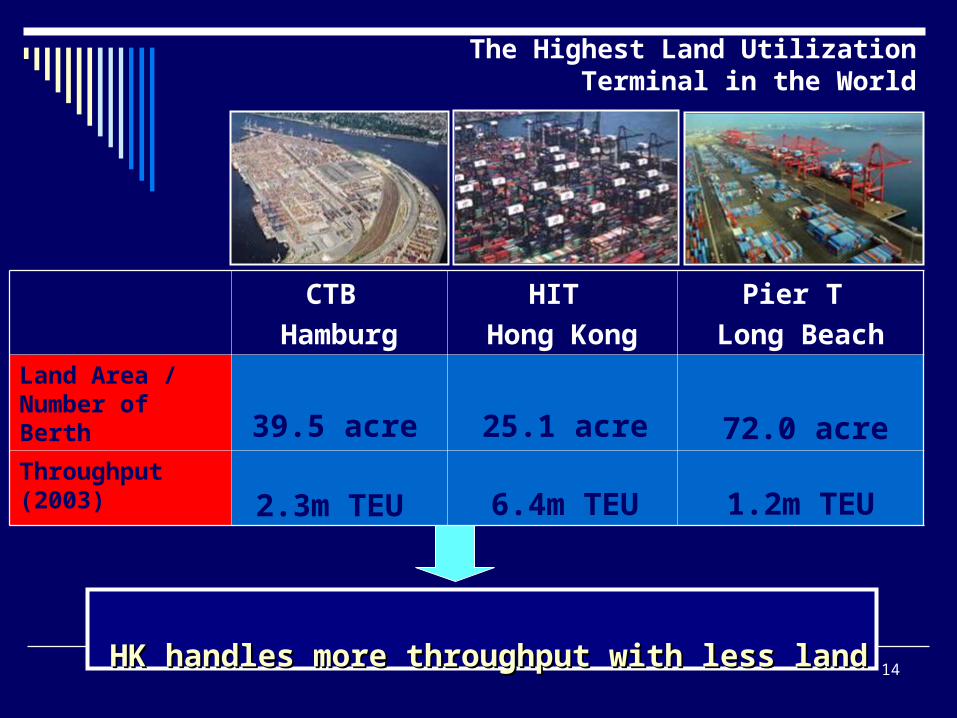
The Highest Land UtilizationTerminal in the World
HK handles more throughput with less landHK handles more throughput with less land
CTB
Hamburg
HIT
Hong Kong
Pier T
Long Beach
Land Area / Number of Berth
Throughput (2003)
39.5 acre 25.1 acre 72.0 acre
2.3m TEU 6.4m TEU 1.2m TEU
15
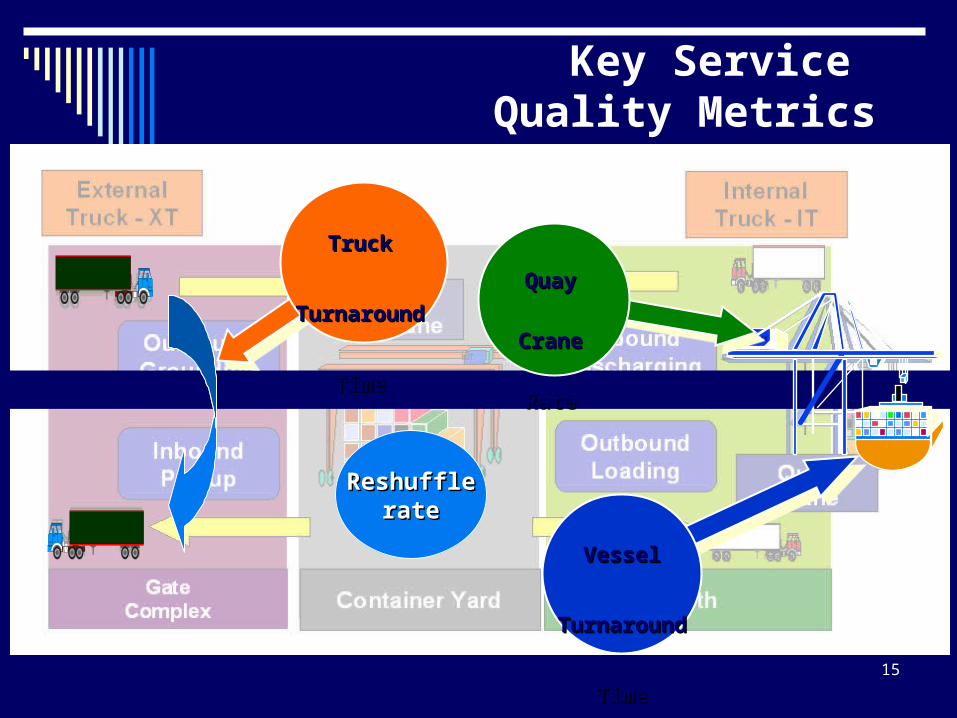
Key Service Quality Metrics
HIT
TruckTruck
TurnaroundTurnaround
TimeTime
VesselVessel
TurnaroundTurnaround
TimeTime
QuayQuay
CraneCrane
RateRate
ReshuffleReshuffleraterate
16
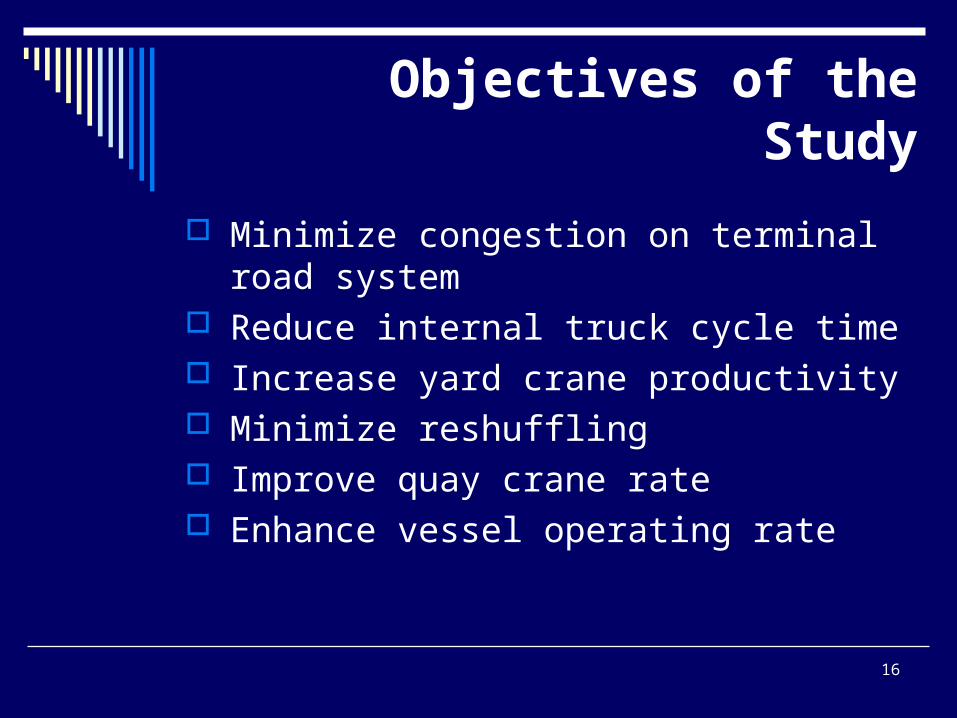
Objectives of the Study
Minimize congestion on terminal road system
Reduce internal truck cycle time Increase yard crane productivity Minimize reshuffling Improve quay crane rate Enhance vessel operating rate
17
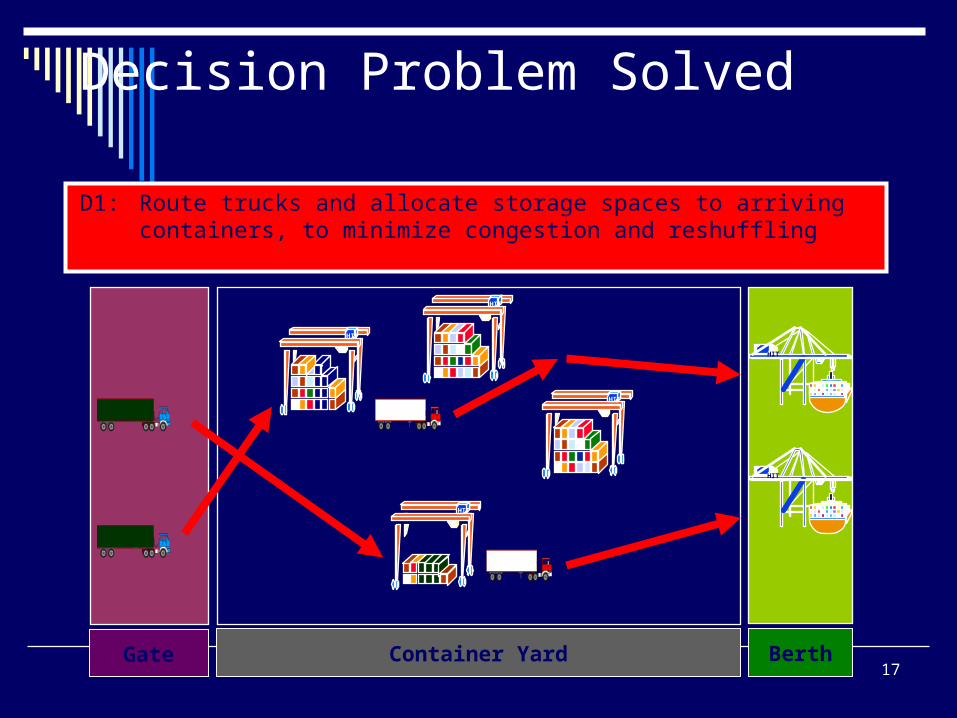
D1: Route trucks and allocate storage spaces to arriving containers, to minimize congestion and reshuffling
Gate Container Yard
HIT
Berth
HIT
HIT
HIT
HIT
HIT
Decision Problem Solved
18
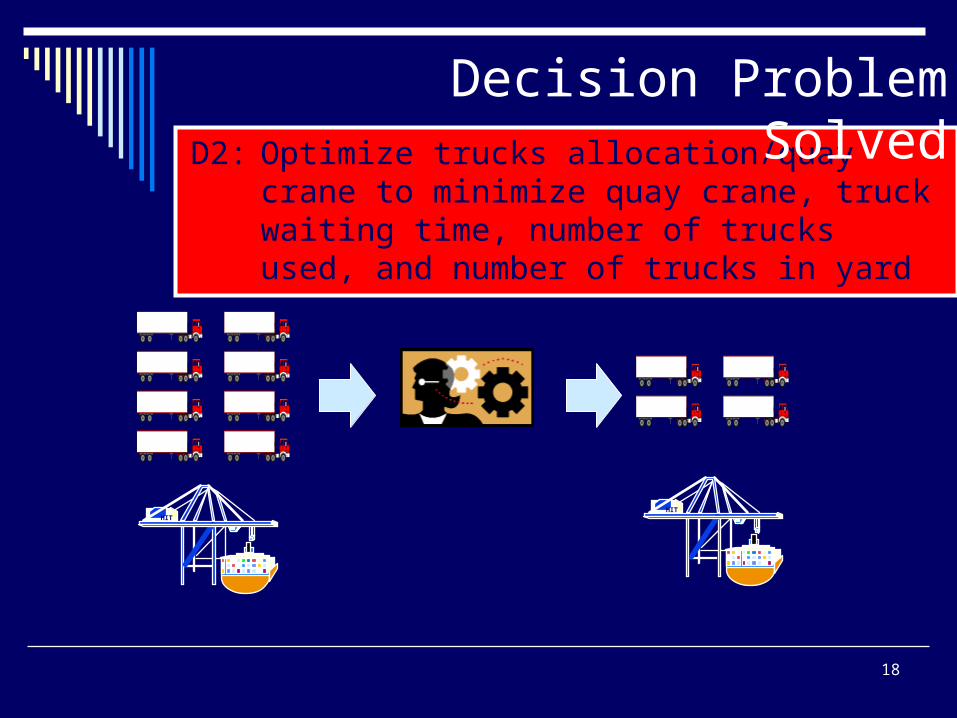
D2: Optimize trucks allocation/quay crane to minimize quay crane, truck waiting time, number of trucks used, and number of trucks in yard
Decision Problem Solved
HITHIT
19
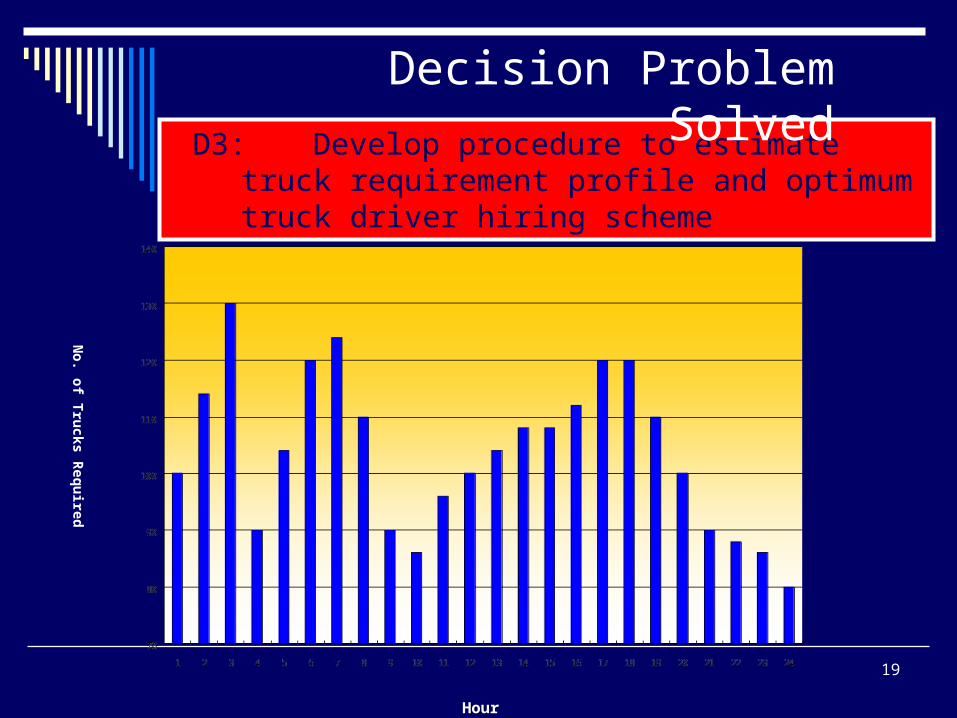
D3: Develop procedure to estimate truck requirement profile and optimum truck driver hiring scheme
No
. of
Tru
cks
Req
uir
ed
Decision Problem Solved
HourHour
20
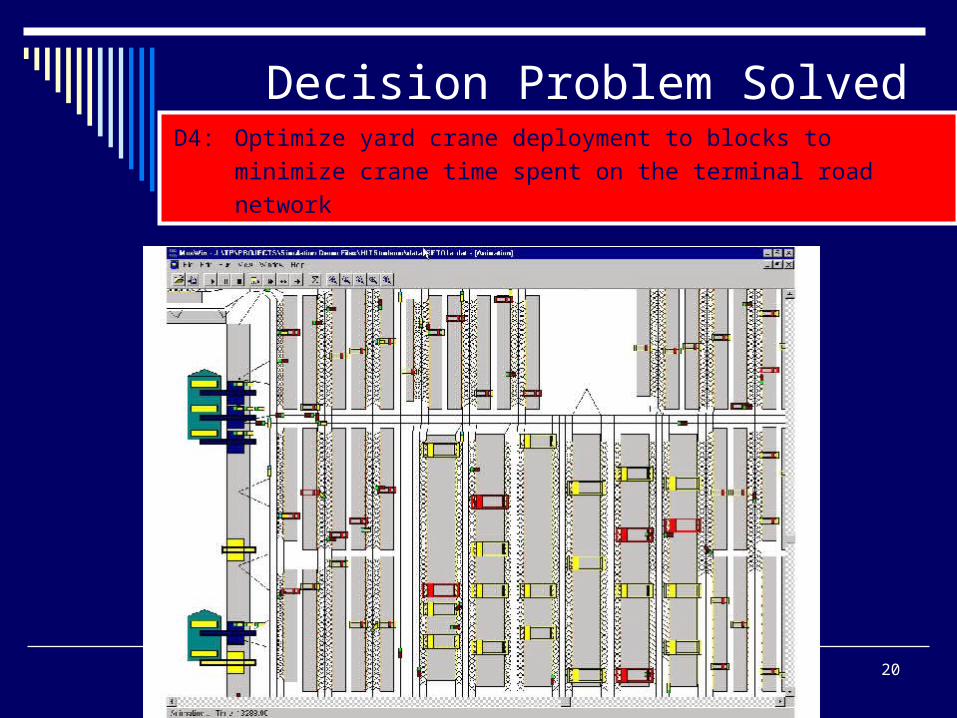
D4: Optimize yard crane deployment to blocks to minimize
crane time spent on the terminal road network
Decision Problem Solved
21
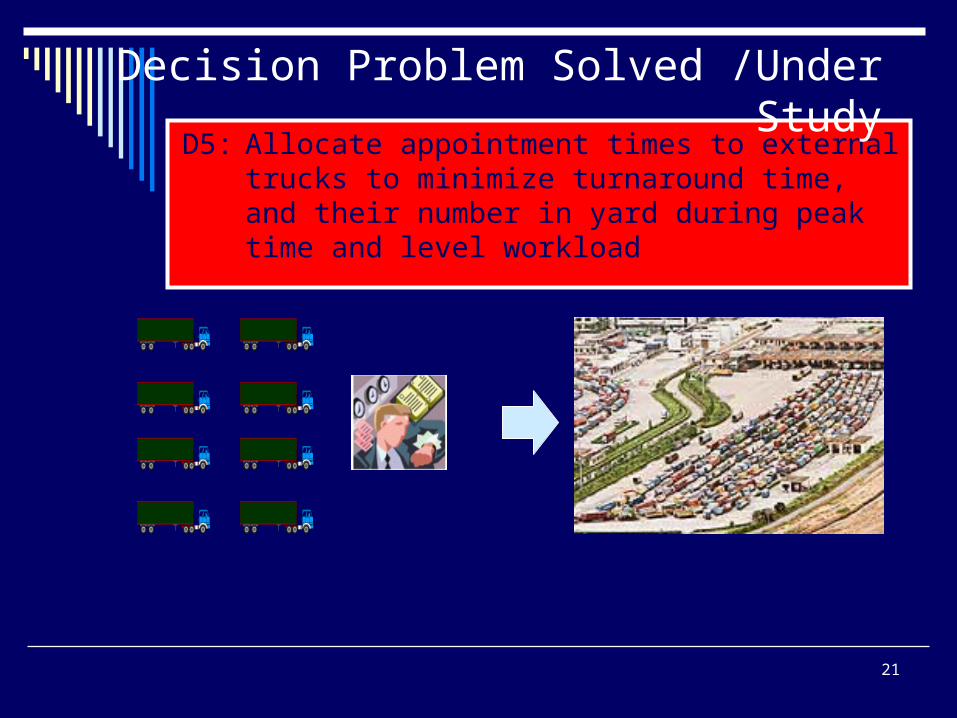
D5: Allocate appointment times to external trucks to minimize turnaround time, and their number in yard during peak time and level workload
Decision Problem Solved /Under Study

22
23
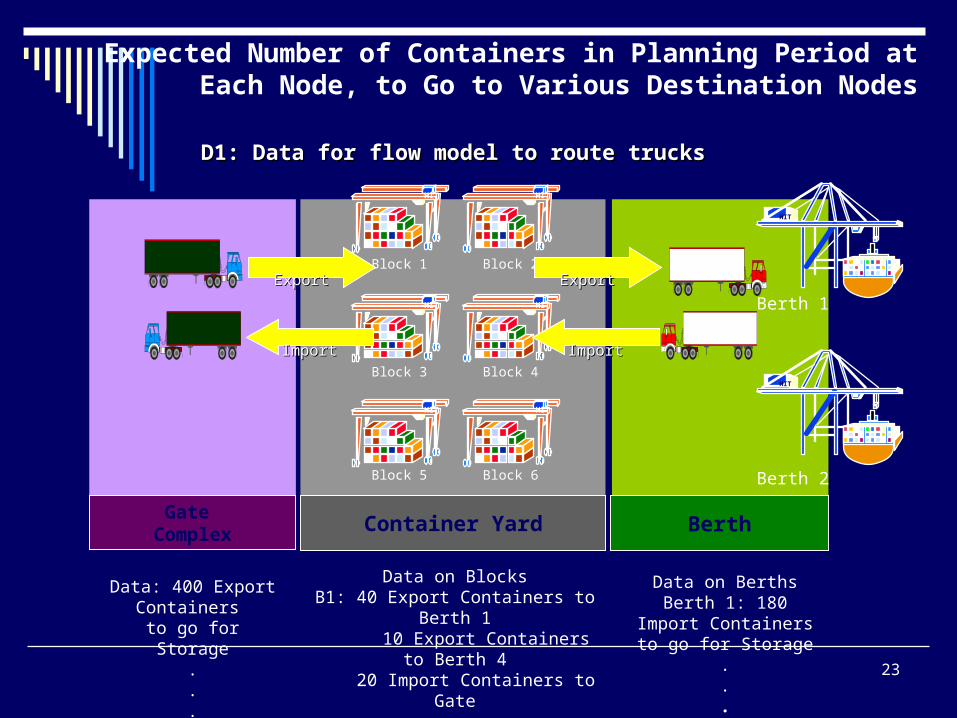
Expected Number of Containers in Planning Period at Each Node, to Go to Various Destination Nodes
HIT
Gate Complex Container Yard
HIT
Berth
Data: 400 Export Containers
to go for Storage...
Data on BlocksB1: 40 Export Containers to Berth 1 10 Export Containers to Berth 4
20 Import Containers to Gate...
HIT
HIT
HIT
HIT
HIT
Block 1 Block 2
Block 3 Block 4
Block 5 Block 6
Data on BerthsBerth 1: 180 Import Containers to go for
Storage...
HIT
Berth 1
Berth 2
ExportExport
ImportImport
ExportExport
ImportImport
D1: Data for flow model to route trucksD1: Data for flow model to route trucks
24
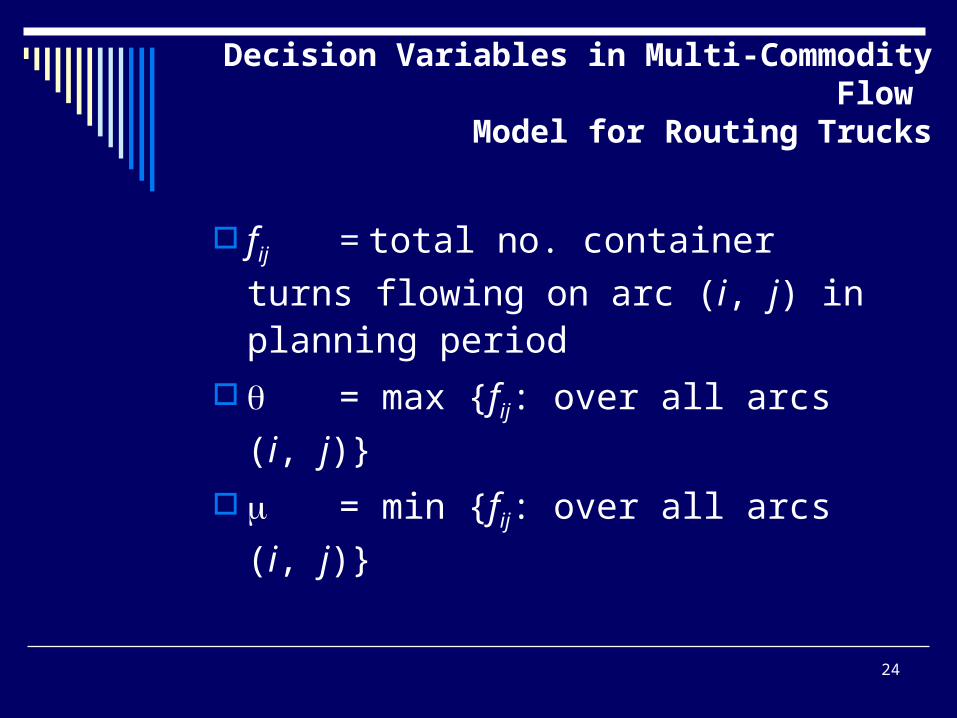
Decision Variables in Multi-Commodity Flow Model for Routing Trucks
fij = total no. container turns
flowing on arc (i, j) in planning period
= max {fij: over all arcs (i, j)}
= min {fij: over all arcs (i, j)}
25
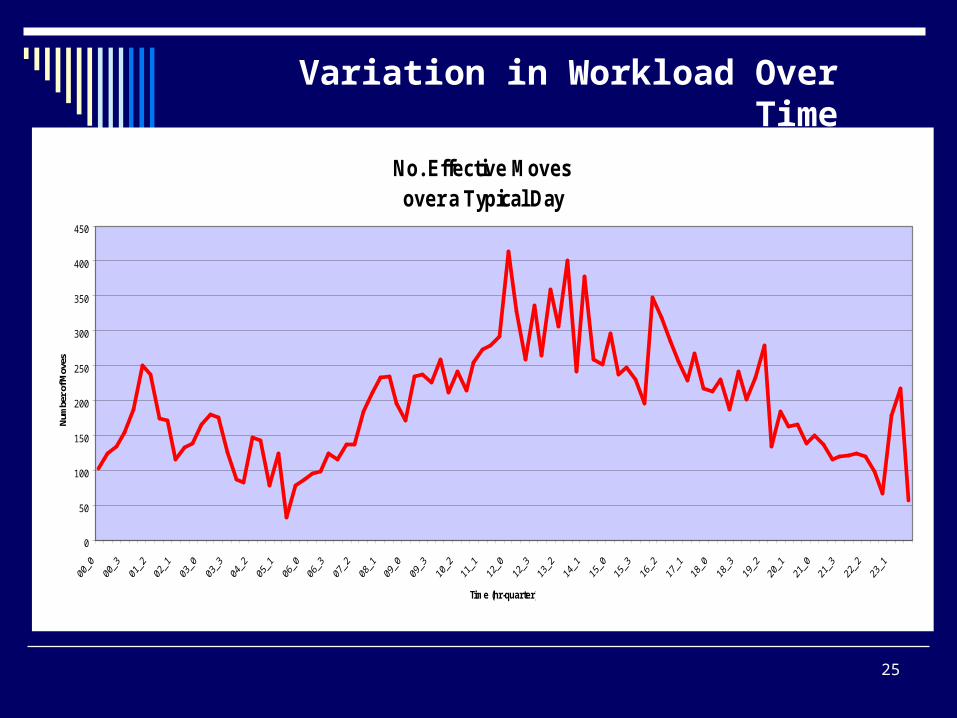
Variation in Workload Over Time
No. Effective Movesover a Typical Day
0
50
100
150
200
250
300
350
400
450
Time (hr-quarter)
Num
ber
of M
oves

26

27
28
Three Separate Policies
Equalize fill ratios in blocks
Truck dispatching policy
Storage space assignment in a block
29
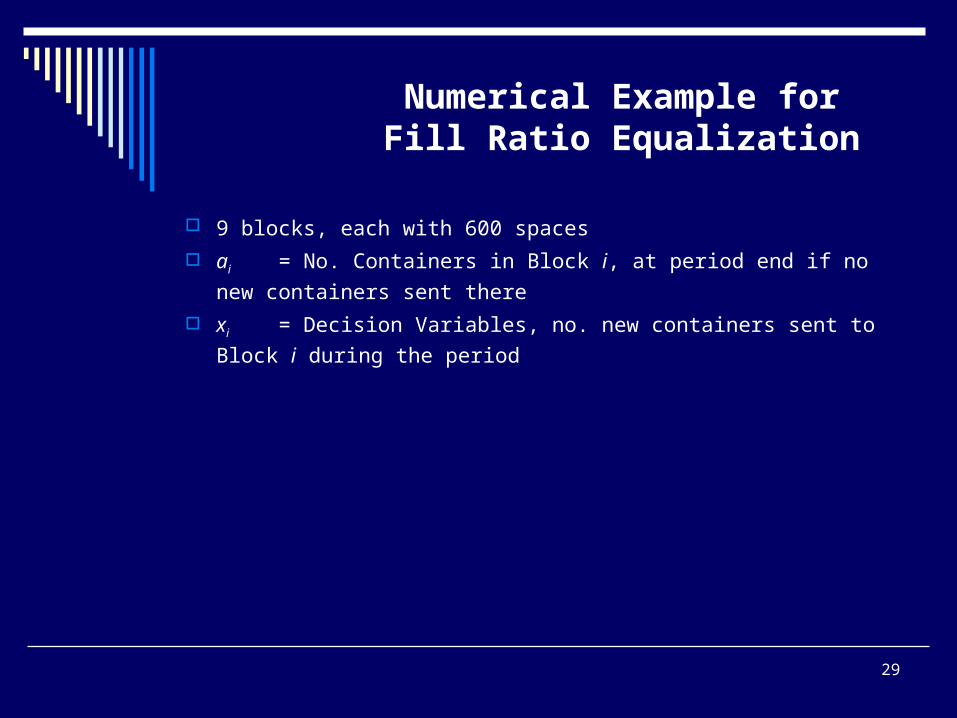
Numerical Example for Fill Ratio Equalization
9 blocks, each with 600 spaces
ai = No. Containers in Block i, at period end if no new containers
sent there
xi = Decision Variables, no. new containers sent to Block i during
the period
30
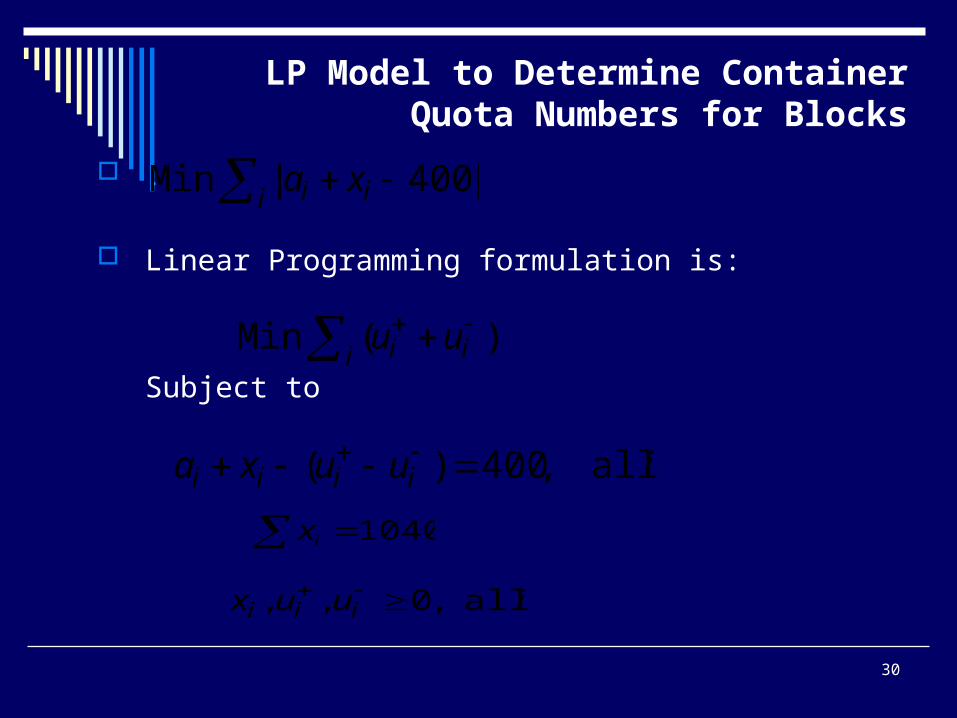
LP Model to Determine Container Quota Numbers for Blocks
.
Linear Programming formulation is:
Subject to i ii uu )(Min
iuuxa iiii all ,400)(
1040 ix
iuux iii all ,0 , ,
i ii xa |400|Min
31
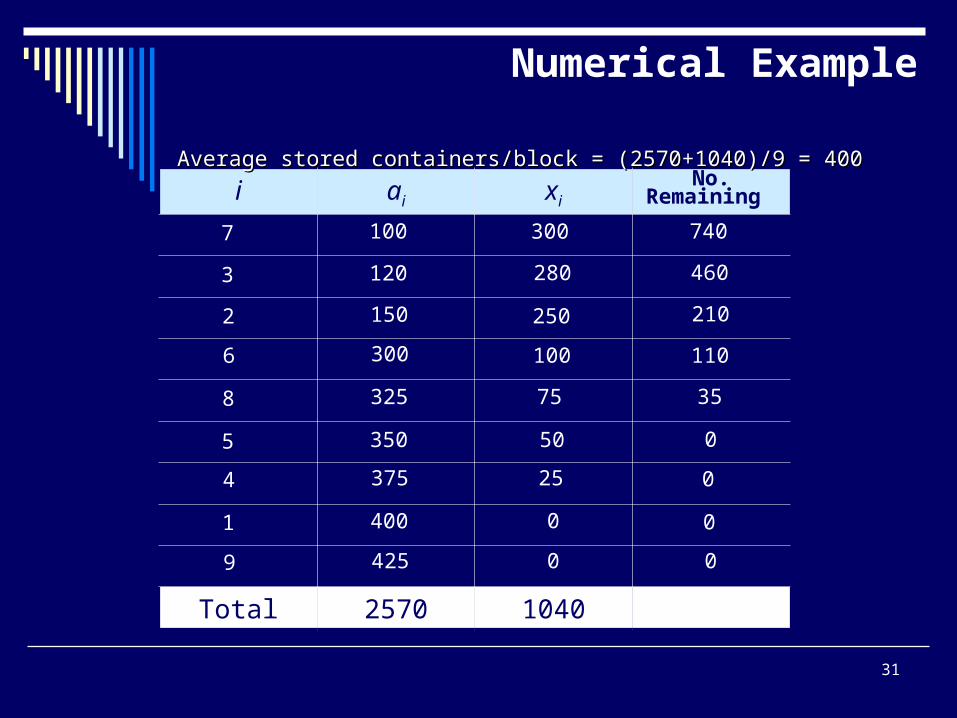
Numerical Example
i ai xiNo.
Remaining
Total 2570 1040
1007
1203
1502
3006
3258
3505
3754
4001
4259
300 740
280 460
250 210
100 110
75 35
50 0
25
0
0
0 0
0
---
Average stored containers/block = (2570+1040)/9 = 400Average stored containers/block = (2570+1040)/9 = 400
32
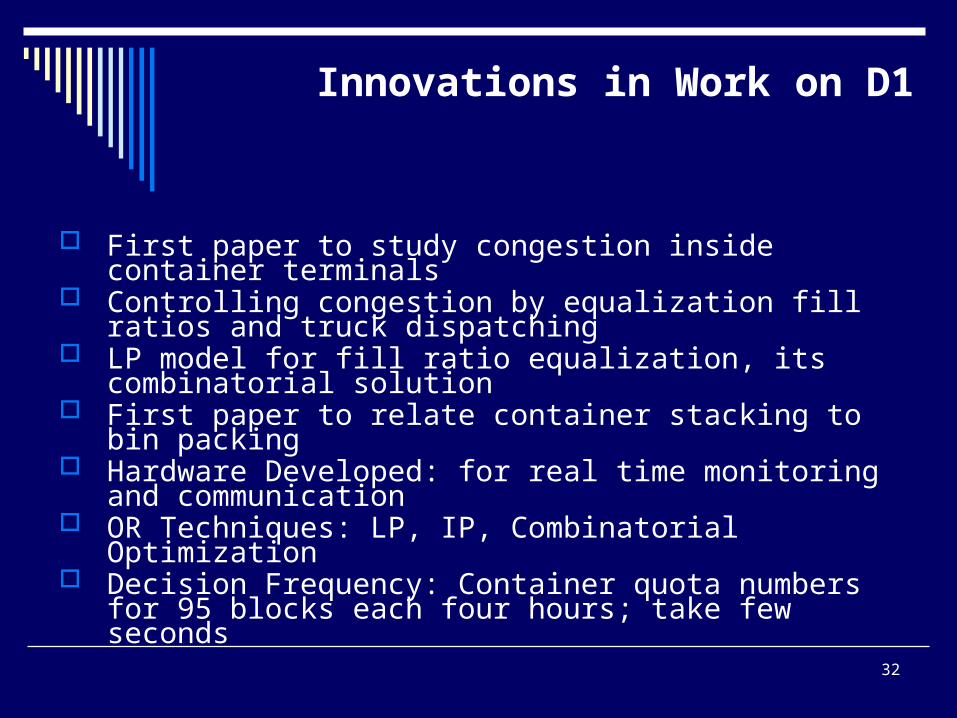
Innovations in Work on D1
First paper to study congestion inside container terminals Controlling congestion by equalization fill ratios and truck
dispatching LP model for fill ratio equalization, its combinatorial solution First paper to relate container stacking to bin packing Hardware Developed: for real time monitoring and
communication OR Techniques: LP, IP, Combinatorial Optimization Decision Frequency: Container quota numbers for 95 blocks
each four hours; take few seconds
33
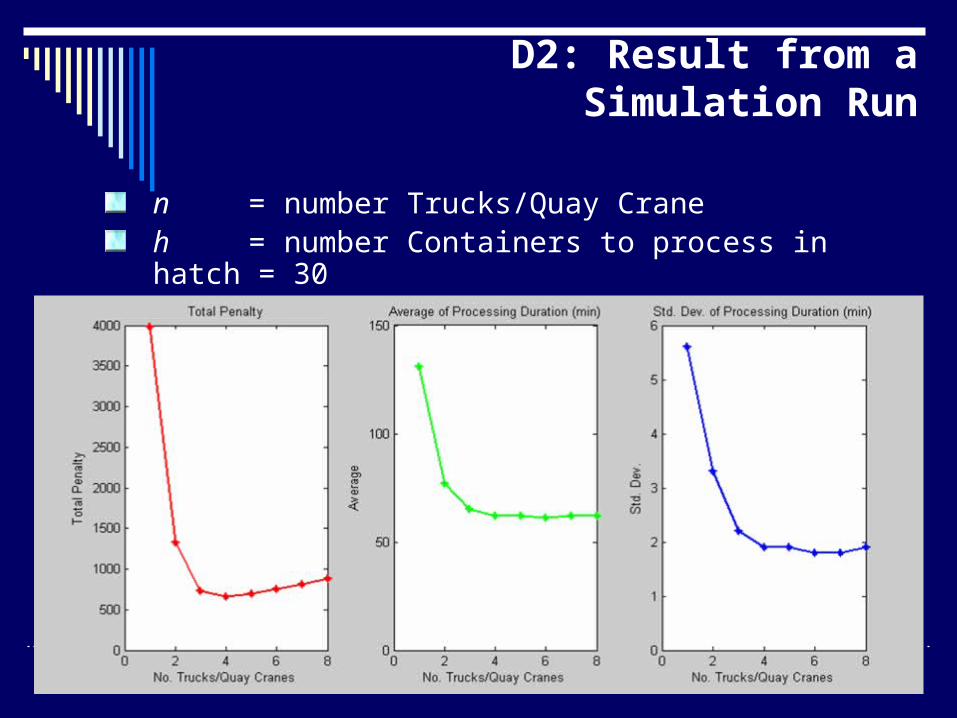
D2: Result from a Simulation Run
n = number Trucks/Quay Craneh = number Containers to process in hatch = 30
34
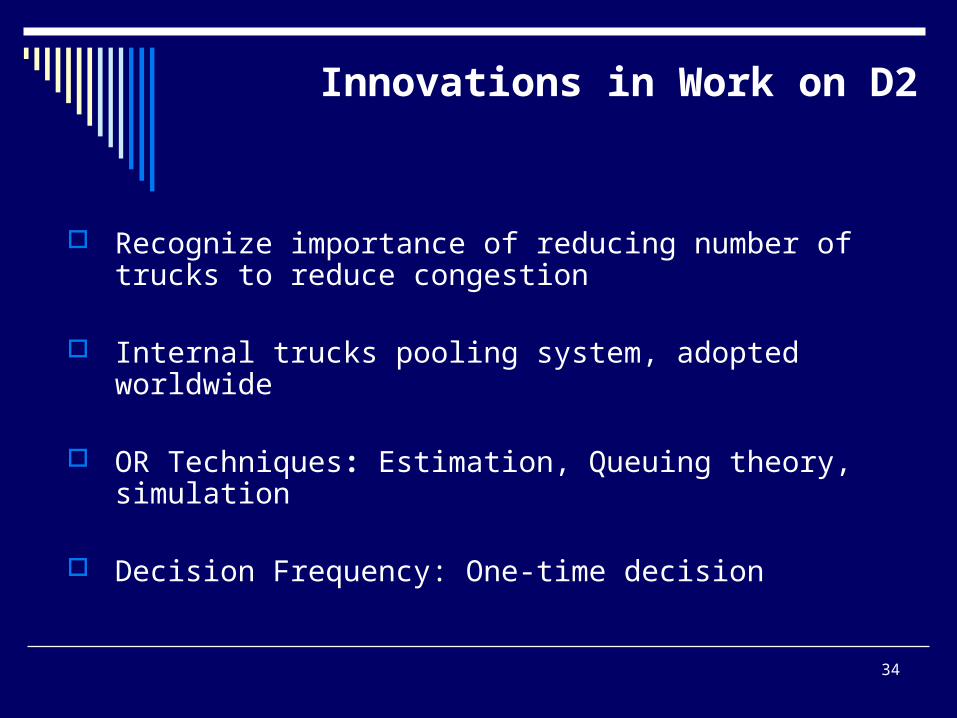
Innovations in Work on D2
Recognize importance of reducing number of trucks to reduce congestion
Internal trucks pooling system, adopted worldwide
OR Techniques: Estimation, Queuing theory, simulation
Decision Frequency: One-time decision
35
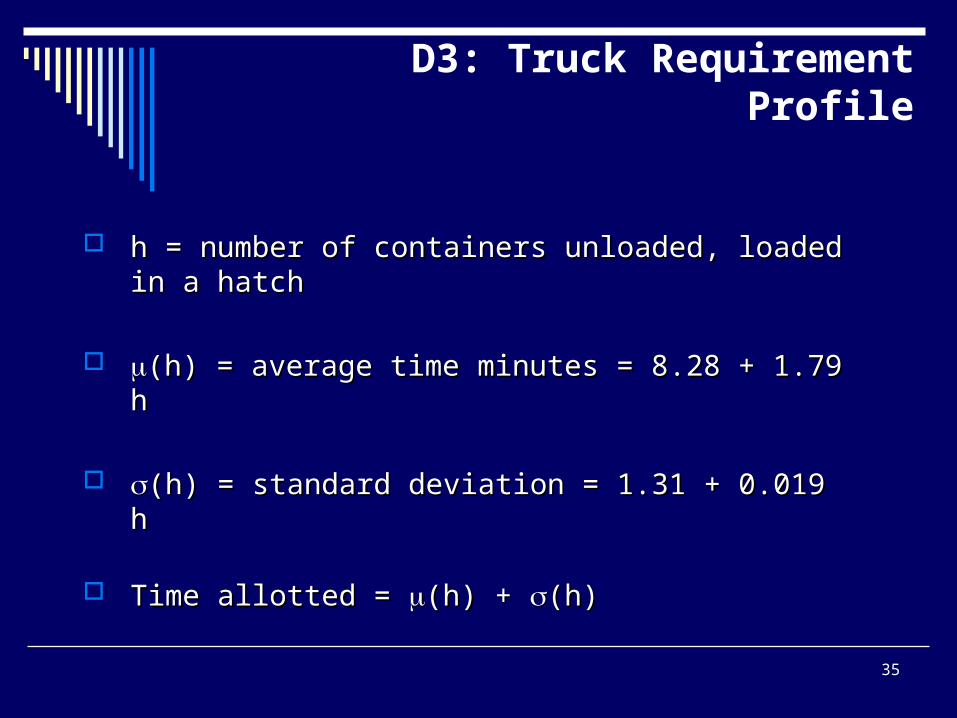
D3: Truck Requirement Profile
h = number of containers unloaded, loaded in a hatchh = number of containers unloaded, loaded in a hatch
(h) = average time (h) = average time minutes = 8.28 + 1.79 hminutes = 8.28 + 1.79 h
(h) = standard deviation = 1.31 + 0.019 h (h) = standard deviation = 1.31 + 0.019 h
Time allotted = Time allotted = (h) + (h) + (h)(h)
36
Benefits from Work on D3
Estimate hourly truck requirements for planning
OR Techniques: Estimation, simulation, linear regression
Decision frequency: Daily; takes few minutes
37
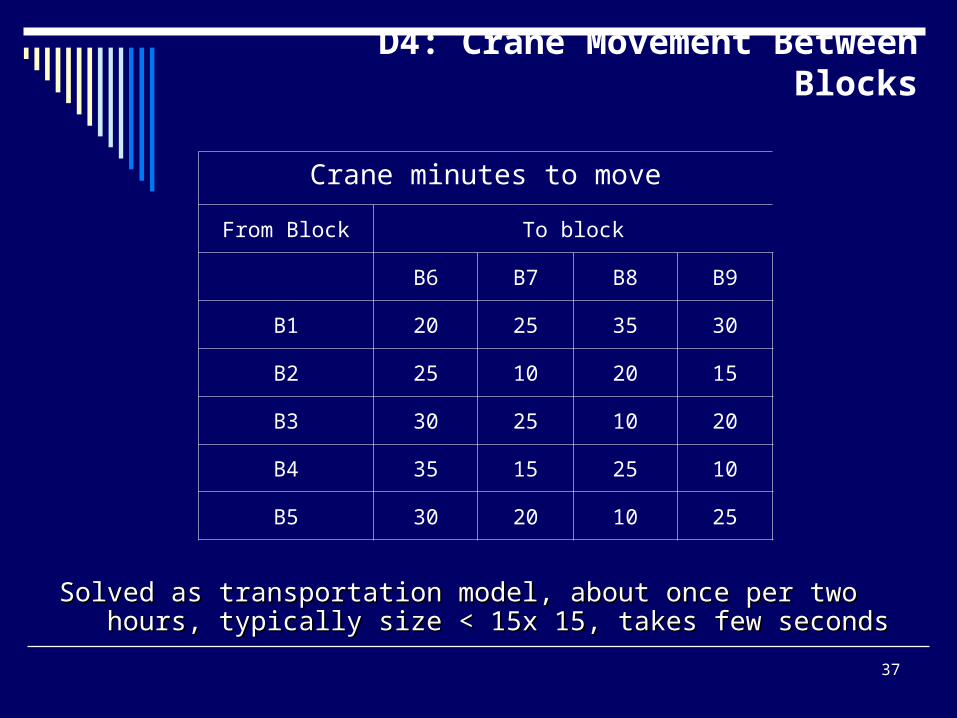
D4: Crane Movement Between Blocks
Solved as transportation model, about once per two hours, typically size Solved as transportation model, about once per two hours, typically size < 15x 15, takes few seconds< 15x 15, takes few seconds
Crane minutes to move
From Block To block
B6 B7 B8 B9
B1 20 25 35 30
B2 25 10 20 15
B3 30 25 10 20
B4 35 15 25 10
B5 30 20 10 25
38
D5: Appointment Times for External Trucks to Pickup During Peak Hours
Optimal quota number for external trucks to pick up in each 30 minute interval determined by simulation
Appointment time booking system is automated telephone-based system
39
Benefits from Work on D5
Quota for half hour determined by simulation
Innovation: First terminal to introduce “booking” to reduce number of external trucks in peak hours & their turnaround time
Hardware Developed: Automated telephone-based booking system
OR Techniques Used: Estimating probability distributions, queuing theory, and simulation
Decision Frequency: One-time decision
40
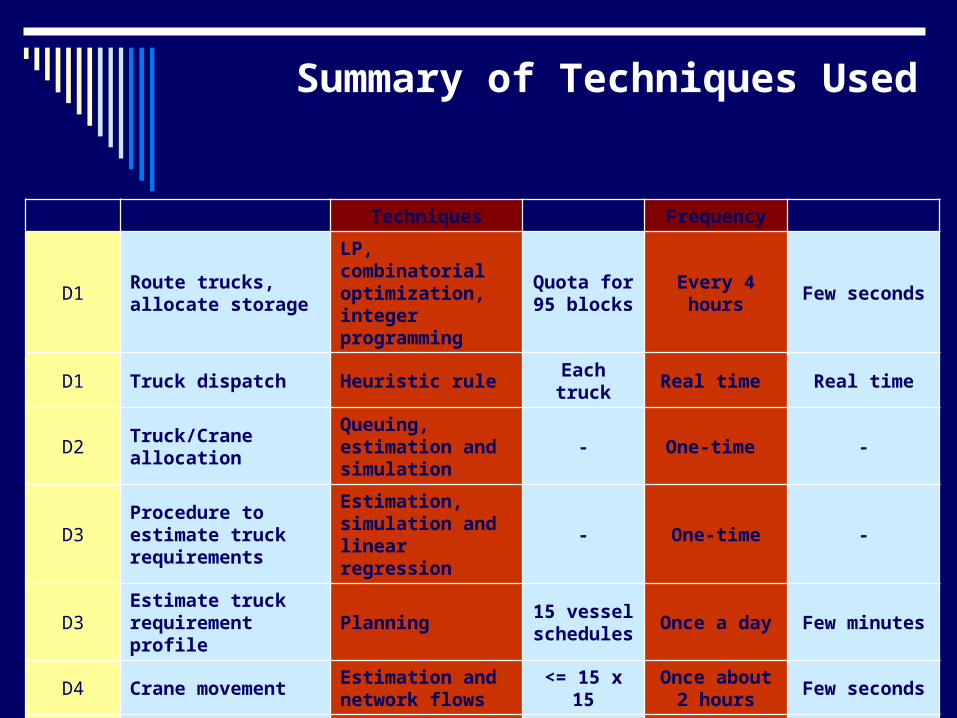
Summary of Techniques Used
Problem Techniques Size Frequency Comp. Time
D1Route trucks, allocate storage
LP, combinatorial optimization, integer programming
Quota for 95 blocks
Every 4 hours Few seconds
D1 Truck dispatch Heuristic rule Each truck Real time Real time
D2Truck/Crane allocation
Queuing, estimation and simulation
- One-time -
D3Procedure to estimate truck requirements
Estimation, simulation and linear regression
- One-time -
D3Estimate truck requirement profile
Planning15 vessel schedules
Once a day Few minutes
D4 Crane movementEstimation and network flows
<= 15 x 15Once about 2
hoursFew seconds
D5 Booking systemEstimation, queuing and simulation
- One-time -
41
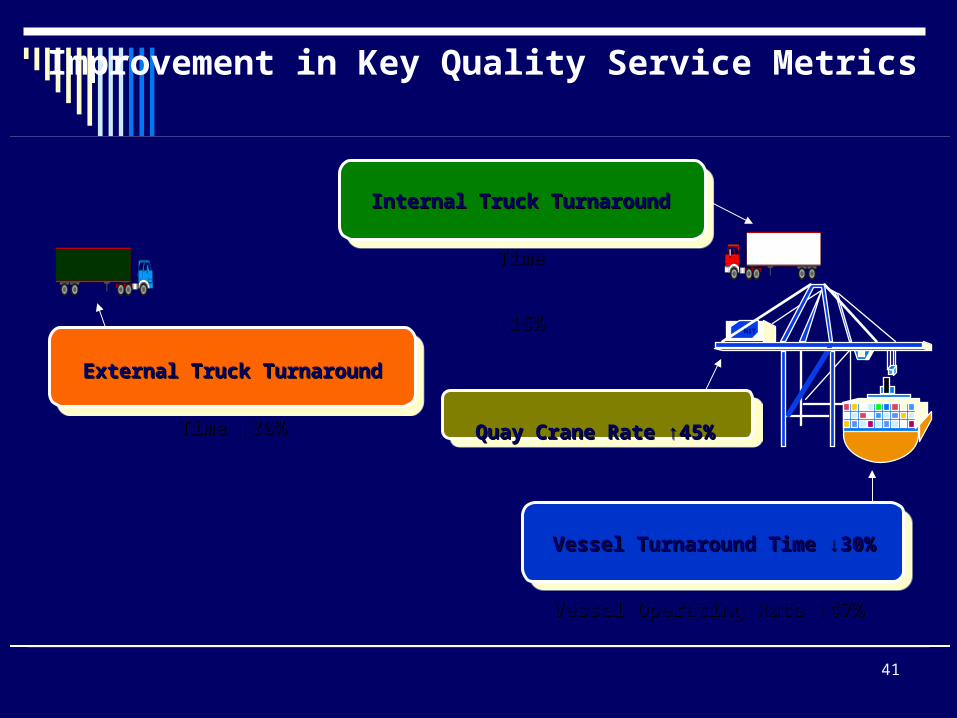
Improvement in Key Quality Service Metrics
HIT
External Truck Turnaround Time External Truck Turnaround Time
↓30%↓30%
Internal Truck Turnaround TimeInternal Truck Turnaround Time
↓↓16%16%
Vessel Turnaround Time Vessel Turnaround Time ↓30%↓30%
Vessel Operating Rate ↑47%Vessel Operating Rate ↑47%
Quay Crane Rate ↑45%Quay Crane Rate ↑45%
42
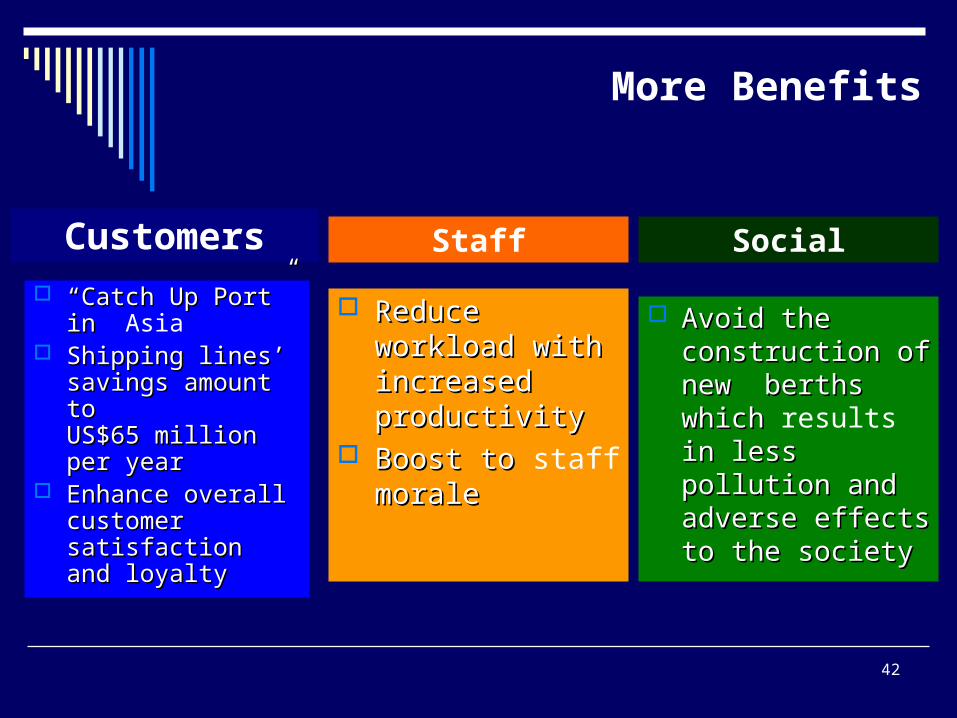
More Benefits
Reduce workload Reduce workload with increased with increased productivityproductivity
Boost to Boost to staff moralemorale
StaffCustomers
““Catch Up Port” in Catch Up Port” in Asia
Shipping lines’ Shipping lines’ savings amount to savings amount to US$65 million per US$65 million per yearyear
Enhance overall Enhance overall customer customer satisfaction and satisfaction and loyaltyloyalty
Social
Avoid the Avoid the construction of construction of new berths which new berths which results in less in less pollution and pollution and adverse effects to adverse effects to the societythe society
43
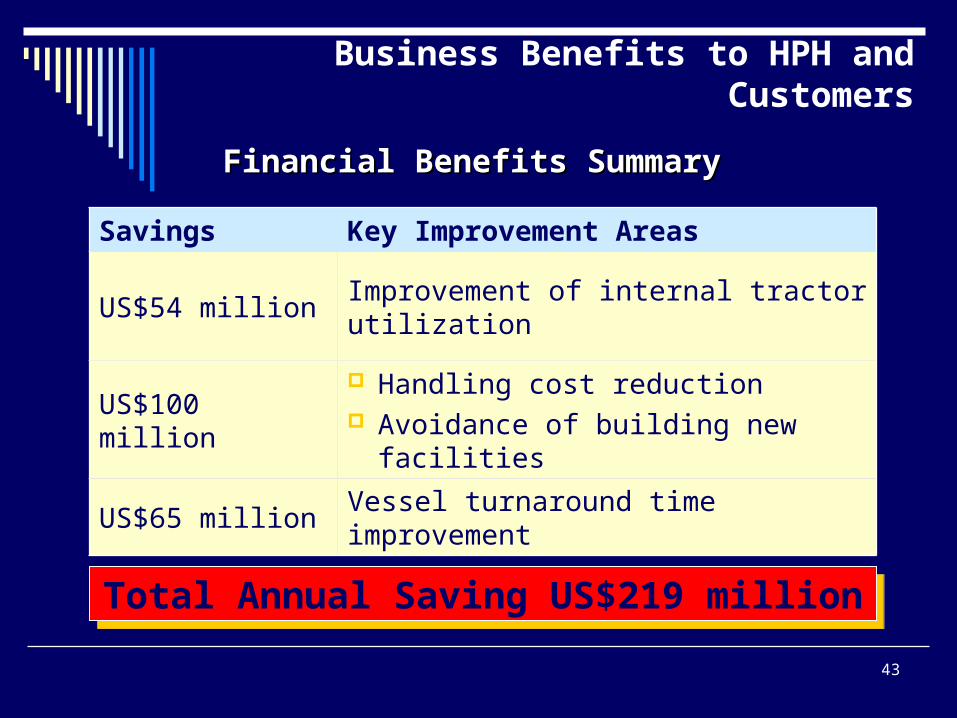
Business Benefits to HPH and Customers
Financial Benefits SummaryFinancial Benefits Summary
Savings Key Improvement Areas
US$54 million Improvement of internal tractor utilization
US$100 million Handling cost reduction Avoidance of building new facilities
US$65 million Vessel turnaround time improvement
Total Annual Saving US$219 millionTotal Annual Saving US$219 million
44
References
1. Katta G. Murty, Yat-Wah Wan, Jiyin Liu, Mitchell M. Tseng, Edmond Leung, Kam-Keung Lai, Herman W. C. Chiu, ``Hong Kong International Terminals Gains Elastic Capacity Using a Data-Intensive Decision Support System'', 2004 Edelman Contest Finalist Paper, to appear in Interfaces, January-February 2005.
2. Katta G. Murty, Jiyin Liu, Yat-Wah Wan, Richard Linn, ``A decision support system for operations in a container terminal'', to appear in Decision Support Systems, 2005; available online at www.sciencedirect.com
3. Katta G. Murty, Woo-Je Kim, ``Intelligent DMSS for Chartered Bus Allocation in Seoul, South Korea'', November 2004.
Recommended