1. Economy
•EconomicAggregates
•ForeignTrade
•Prices
•FinancialStatistics
•GovernmentFinance
•WagesandCompensation
•ForeignInvestment
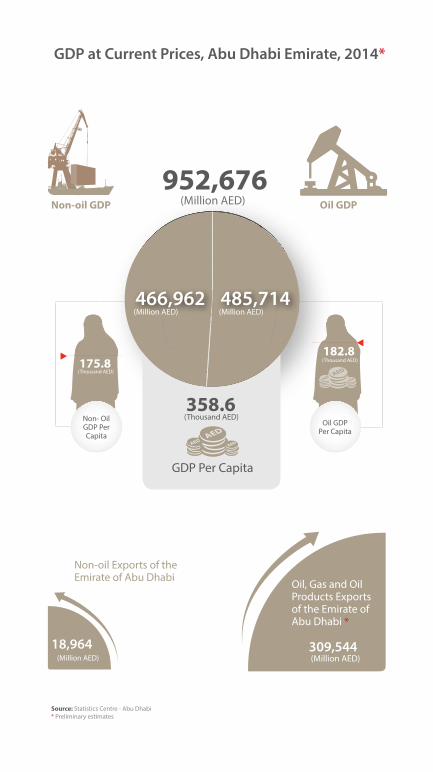
485,714466,962
GDP at Current Prices, Abu Dhabi Emirate, 2014*
952,676Oil GDPNon-oil GDP
309,54418,964
Oil,GasandOilProductsExportsoftheEmirateofAbuDhabi*
Non-oilExportsoftheEmirateofAbuDhabi
GDPPerCapita
358.6(ThousandAED)
(MillionAED)
(MillionAED)(MillionAED)
(MillionAED) (MillionAED)
Source: StatisticsCentre-AbuDhabi*Preliminaryestimates
182.8(ThousandAED)
OilGDPPerCapita
175.8(ThousandAED)
Non-OilGDPPerCapita
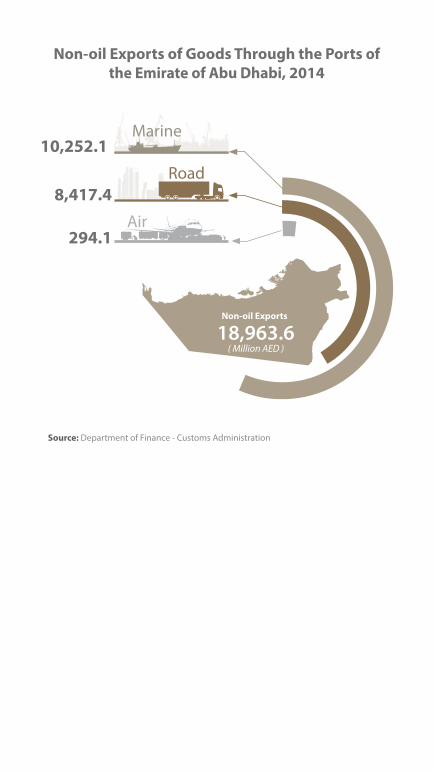
Non-oil Exports of Goods Through the Ports of the Emirate of Abu Dhabi, 2014
Source: DepartmentofFinance-CustomsAdministration
Non-oil Exports
( Million AED )18,963.6
8,417.4
294.1
10,252.1
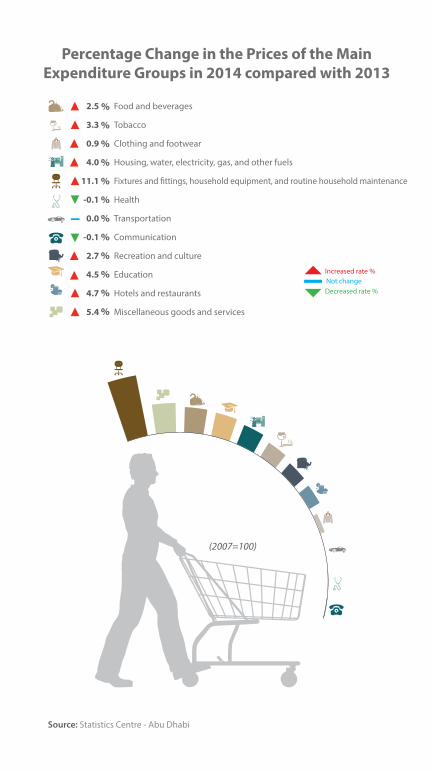
Percentage Change in the Prices of the Main Expenditure Groups in 2014 compared with 2013
Source:StatisticsCentre-AbuDhabi
(2007=100)
Increasedrate%
Decreasedrate%Notchange
Foodandbeverages
Tobacco
Clothingandfootwear
Housing,water,electricity,gas,andotherfuels
Fixturesandfittings,householdequipment,androutinehouseholdmaintenance
Health
Transportation
Communication
Recreationandculture
Education
Hotelsandrestaurants
Miscellaneousgoodsandservices
2.5
3.3
0.9
4.0
11.1
-0.1
0.0
-0.1
2.7
4.5
4.7
5.4
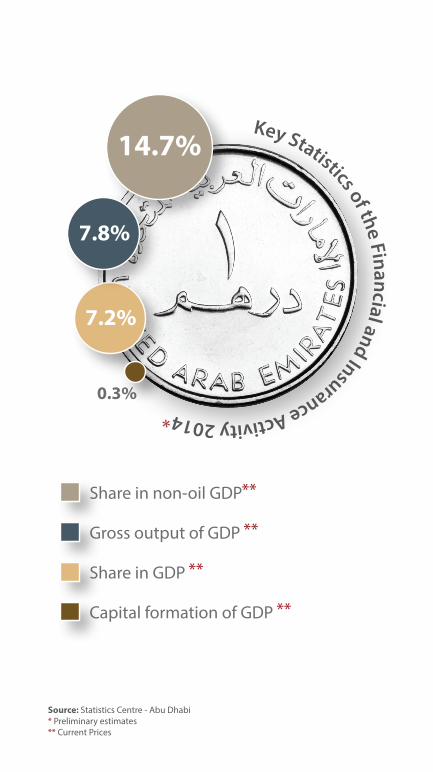
ShareinGDP
Key Statistics of the Financial and Insurance Activity 2014*
0.3%
14.7%
7.8%
7.2%
Source: StatisticsCentre-AbuDhabi*Preliminaryestimates**CurrentPrices
Shareinnon-oilGDP
GrossoutputofGDP
CapitalformationofGDP
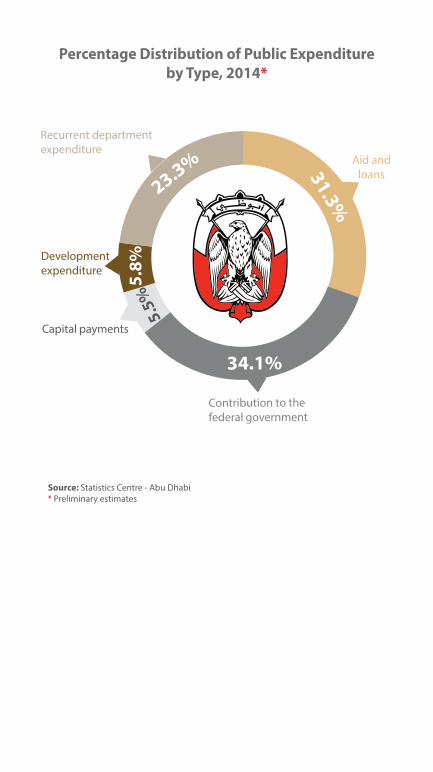
Aidandloans
Developmentexpenditure
Percentage Distribution of Public Expenditure by Type, 2014*
Source: StatisticsCentre-AbuDhabi*Preliminaryestimates
Capitalpayments
Contributiontothefederalgovernment
Recurrentdepartmentexpenditure
31.3%
5.8%
34.1%
5.5%
23.3%
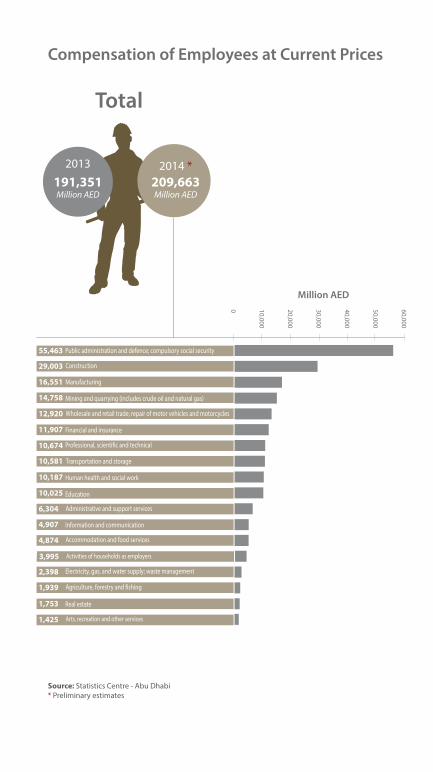
60,000
50,000
40,000
30,000
20,000
10,000
0
191,351Million AED
2013
209,663Million AED
2014*
Compensation of Employees at Current Prices
Million AED
Total
Source: StatisticsCentre-AbuDhabi*Preliminaryestimates
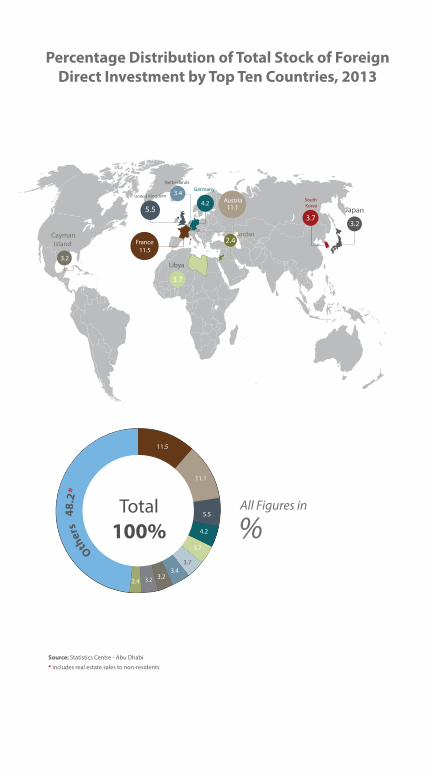
Oth
er co
untri
es 48
.2
CaymanIsland
Percentage Distribution of Total Stock of Foreign Direct Investment by Top Ten Countries, 2013
%All Figures in
Source: StatisticsCentre-AbuDhabi
* Includesrealestatesalestonon-residents
Total100%
Other
s4
8.2*
2. Industry and Business
•BusinessEnvironment
•Manufacturing
•OilandGas
•Petrochemicals
•ElectricityandWater
•Construction
•Transport
•ICT
•Hotels
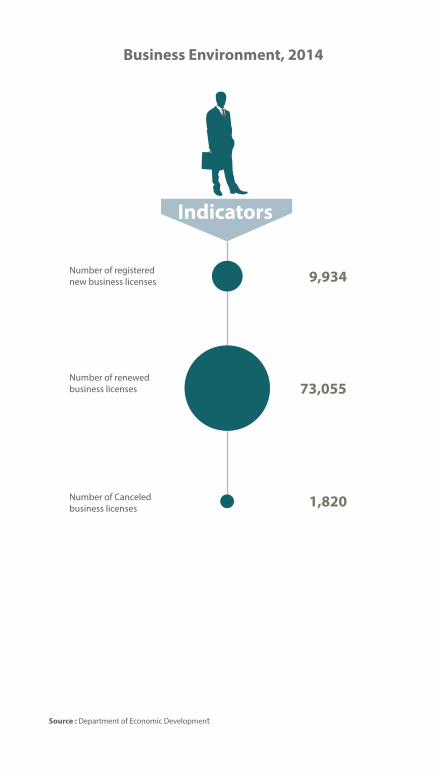
Business Environment, 2014
Source :DepartmentofEconomicDevelopment
1,820
73,055Numberofrenewedbusinesslicenses
Numberofregisterednewbusinesslicenses 9,934
NumberofCanceledbusinesslicenses
Indicators
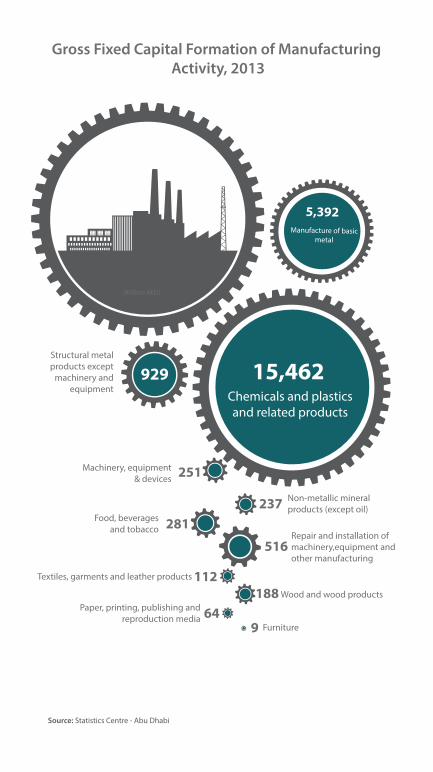
9
112188
251
516
237281
929
5,392
15,462
64Woodandwoodproducts
Non-metallicmineralproducts(exceptoil)
Repairandinstallationofmachinery,equipmentandothermanufacturing
Manufactureofbasicmetal
Machinery,equipment&devices
Chemicalsandplasticsandrelatedproducts
Gross Fixed Capital Formation of Manufacturing Activity, 2013
(Million AED)
Total23,440
Source:StatisticsCentre-AbuDhabi
Textiles,garmentsandleatherproducts
Paper,printing,publishingandreproductionmedia
Food,beveragesandtobacco
Structuralmetalproductsexceptmachineryand
equipment
Furniture
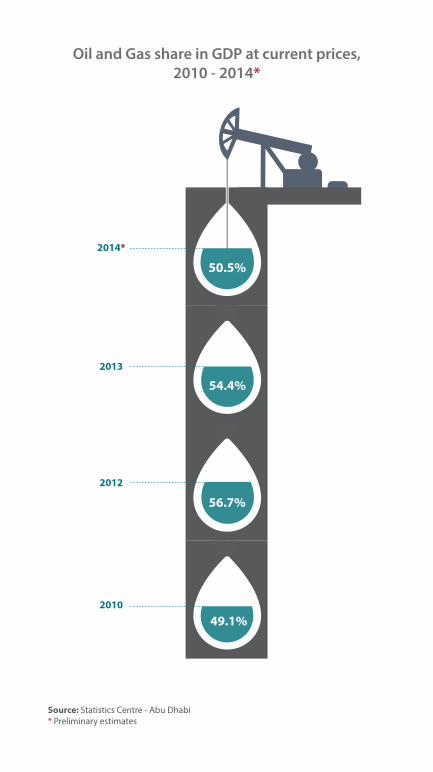
2010
2013
Oil and Gas share in GDP at current prices, 2010 - 2014*
49.1%
50.5%
54.4%
Source: StatisticsCentre-AbuDhabi*Preliminaryestimates
2012
56.7%
2014*
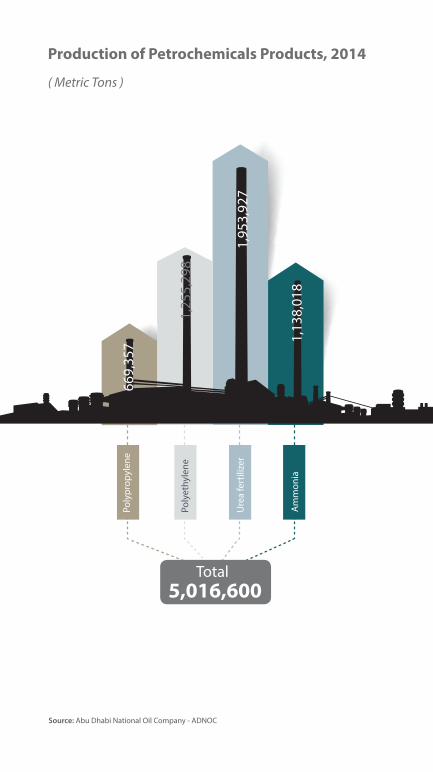
Production of Petrochemicals Products, 2014
( Metric Tons )
Source:AbuDhabiNationalOilCompany-ADNOC
Total5,016,600
1,13
8,01
8
1,95
3,92
7
1,25
5,29
8
669,35
7
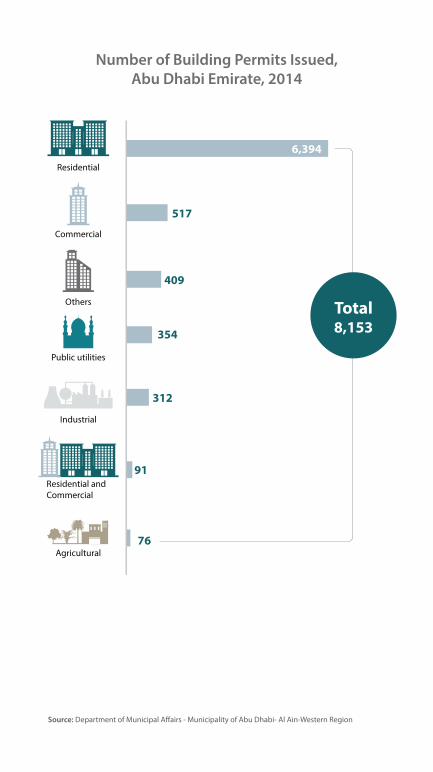
Number of Building Permits Issued, Abu Dhabi Emirate, 2014
Source:DepartmentofMunicipalAffairs-MunicipalityofAbuDhabi-AlAin-WesternRegion
Publicutilities
Agricultural
Industrial
Residential
ResidentialandCommercial
Commercial
6,394
517
312
76
354
91
Total 8,153
Others
409
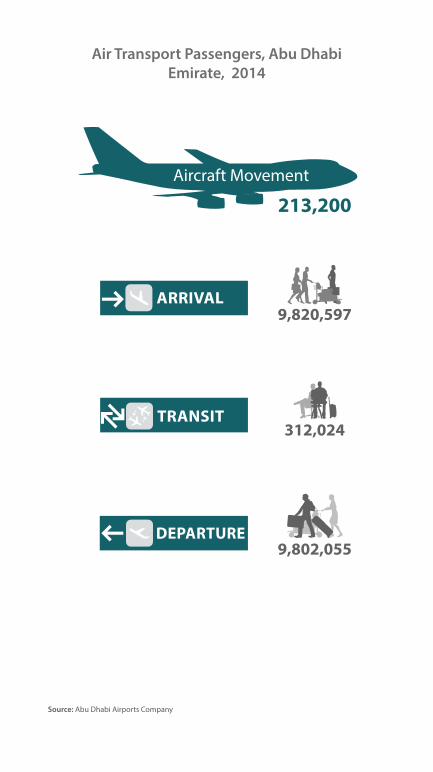
AircraftMovement
Source:AbuDhabiAirportsCompany
Air Transport Passengers, Abu Dhabi Emirate, 2014
213,200
9,820,597
312,024
9,802,055
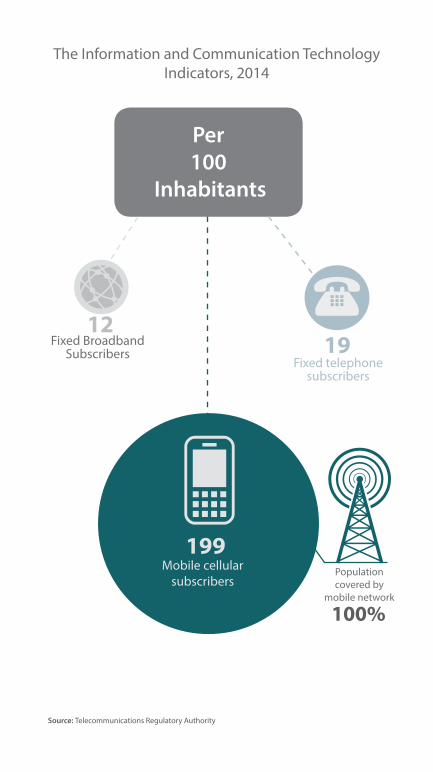
Per100
Inhabitants
FixedBroadbandSubscribers
Fixedtelephonesubscribers
Mobilecellularsubscribers
Source: TelecommunicationsRegulatoryAuthority
Populationcoveredby
mobilenetwork
100%
199
TheInformationandCommunicationTechnologyIndicators,2014
1912
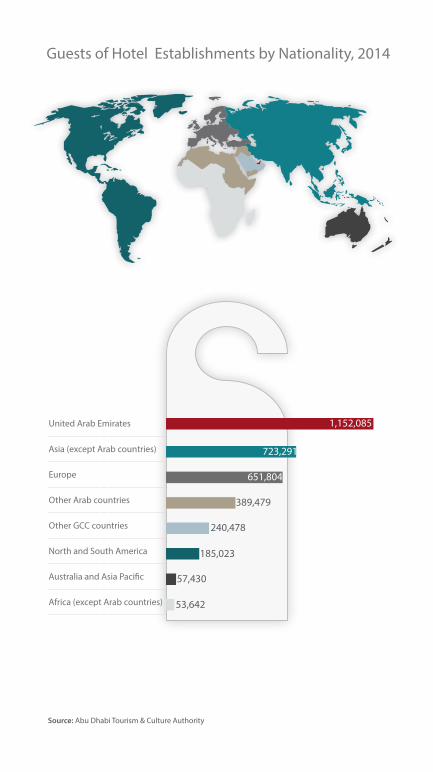
GuestsofHotelEstablishmentsbyNationality,2014
Source: AbuDhabiTourism&CultureAuthority
UnitedArabEmirates
Asia(exceptArabcountries)
Europe
OtherArabcountries
OtherGCCcountries
NorthandSouthAmerica
AustraliaandAsiaPacific
Africa(exceptArabcountries)
1,152,085
723,291
651,804
389,479
240,478
185,023
57,430
53,642
3. Population and Demography
•Population
•BirthsandDeaths
•MarriageandDivorce
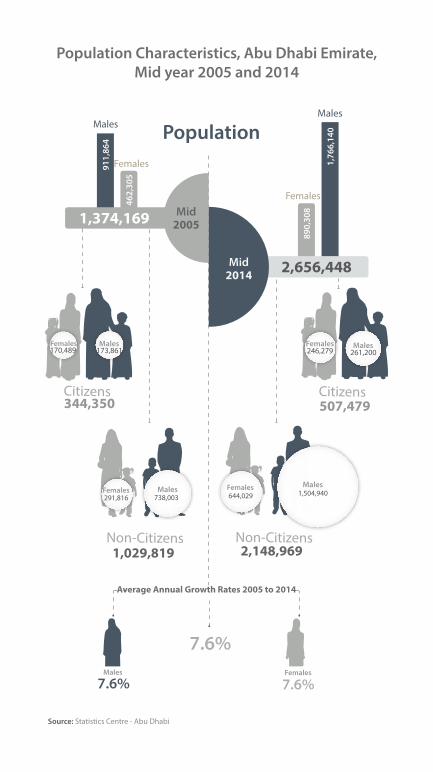
Mid2005
Mid2014
1,374,169
2,656,448
911,
864
1,76
6,14
0
890,
308
462,
305
Females
Females
MalesMales
Average Annual Growth Rates 2005 to 2014
7.6% 7.6%
344,350 507,479
7.6%
Non-Citizens2,148,969
261,200
Citizens
Males Females
Males
Population
Population Characteristics, Abu Dhabi Emirate, Mid year 2005 and 2014
Source:StatisticsCentre-AbuDhabi
Citizens
1,029,819
738,003Males
291,816Females
Males173,861
1,504,940Males
644,029Females
Non-Citizens
Females170,489 246,279
Females
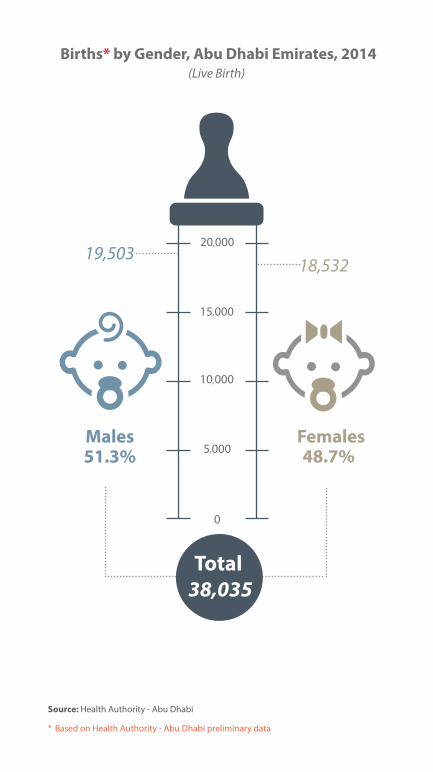
Source: HealthAuthority-AbuDhabi
* BasedonHealthAuthority-AbuDhabipreliminarydata
Births* by Gender, Abu Dhabi Emirates, 2014(Live Birth)
48.7%FemalesMales
19,50318,532
51.3%
Total 38,035
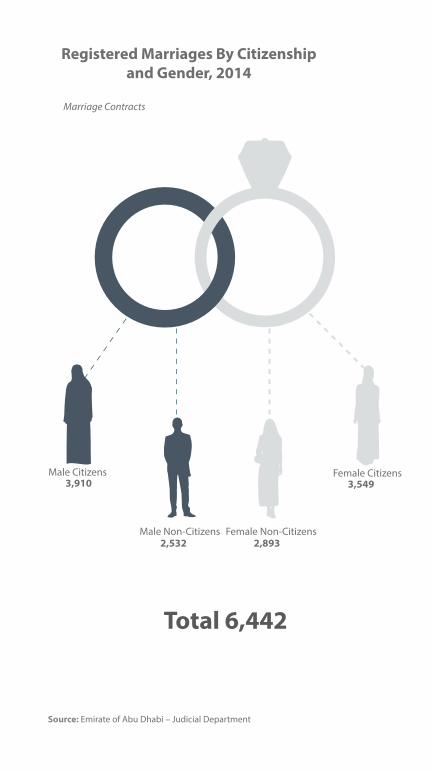
Registered Marriages By Citizenship and Gender, 2014
Marriage Contracts
Source:EmirateofAbuDhabi–JudicialDepartment
3,910
2,532 2,893
3,549
Total 6,442
FemaleCitizens
FemaleNon-Citizens
MaleCitizens
MaleNon-Citizens

4. Social
. Education
. Health
. SocialWelfare
. CultureandHeritage
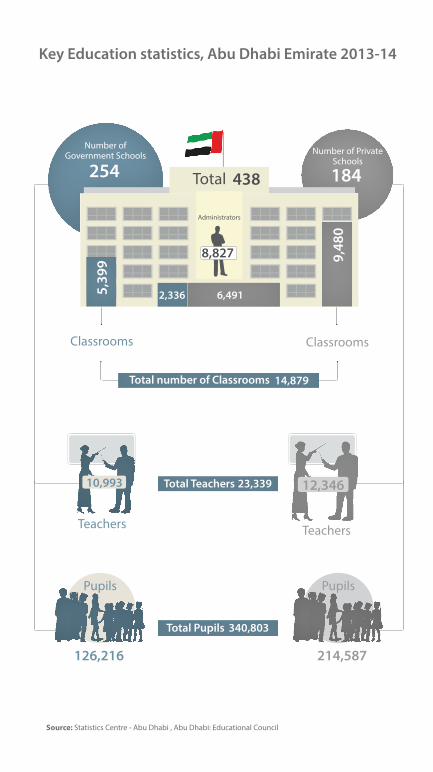
254 438 184
5,39
9 9,48
0
340,803
23,339
2,336 6,491
8,827
12,346
126,216 214,587
10,993
Key Education statistics, Abu Dhabi Emirate 2013-14
TeachersTeachers
NumberofGovernmentSchools NumberofPrivate
Schools
Total
Administrators
PupilsPupils
Source: StatisticsCentre-AbuDhabi,AbuDhabi:EducationalCouncil
Total Pupils
Total Teachers
ClassroomsClassrooms
14,879Total number of Classrooms
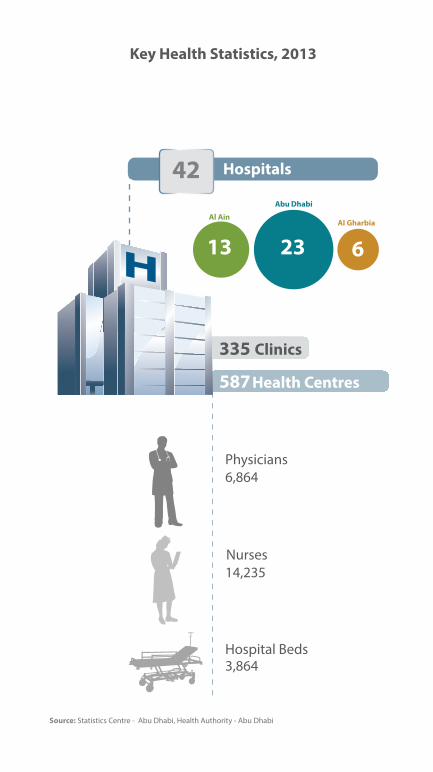
Key Health Statistics, 2013
Source:StatisticsCentre-AbuDhabi,HealthAuthority-AbuDhabi
6,864
3,864
14,235
335
13 623
587Health Centres
Hospitals
Clinics
42
Physicians
Nurses
HospitalBeds
Al Gharbia
Abu Dhabi
Al Ain
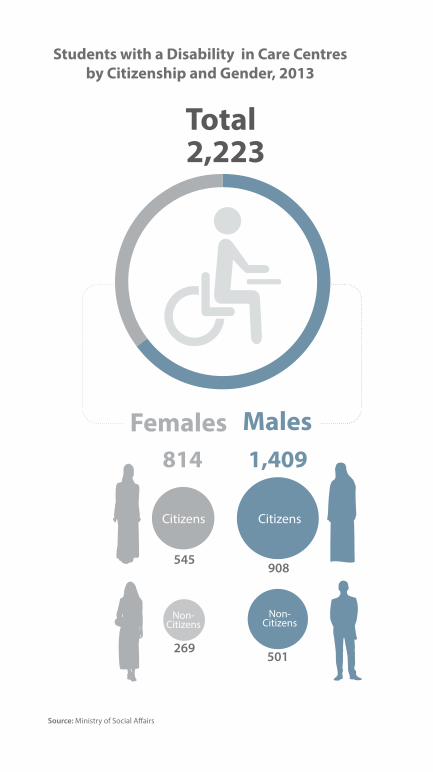
1,409814
908
501
545
269
2,223
Students with a Disability in Care Centres by Citizenship and Gender, 2013
Total
MalesFemales
Citizens
Non-Citizens
Non-Citizens
Citizens
Source:MinistryofSocialAffairs
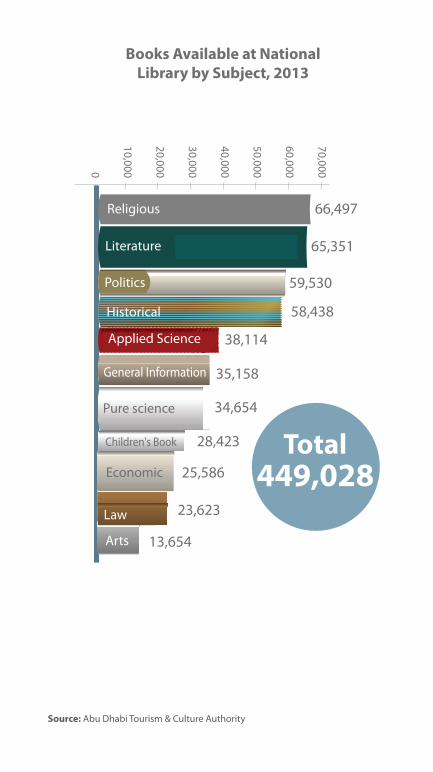
70,000
60,000
50,000
40,000
30,000
20,000
10,0000
Books Available at National Library by Subject, 2013
449,028

5. Labour Force
•LabourForceStructure
•Employment
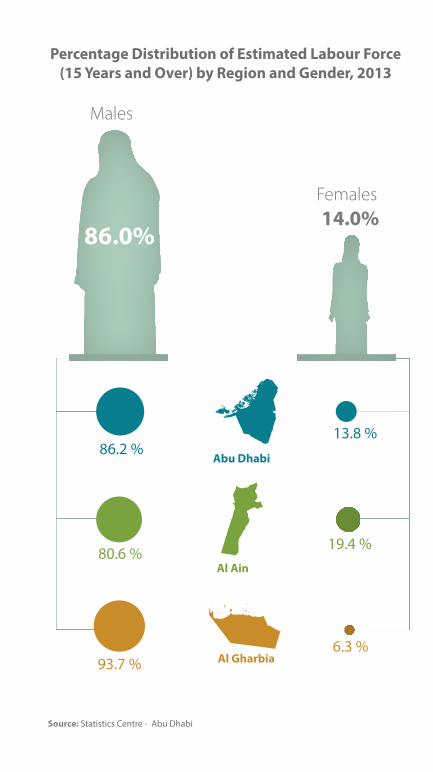
86.0%14.0%
Percentage Distribution of Estimated Labour Force (15 Years and Over) by Region and Gender, 2013
Source:StatisticsCentre-AbuDhabi
Males
Females
13.8%
19.4%
6.3%
86.2%
80.6%
93.7% Al Gharbia
Abu Dhabi
Al Ain
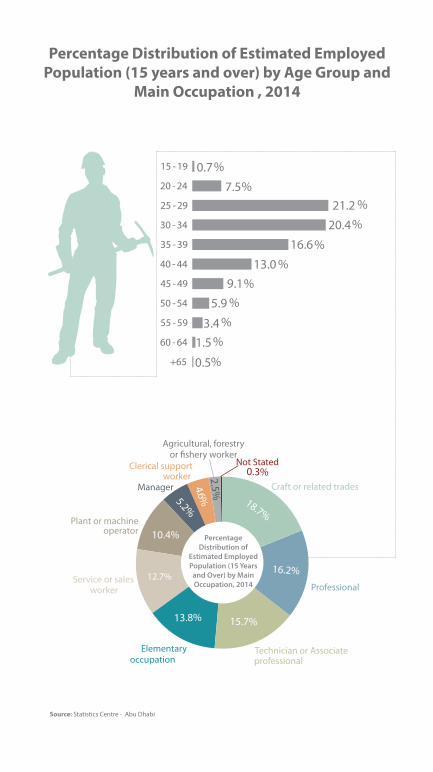
Percentage Distribution of Estimated Employed Population (15 years and over) by Age Group and
Main Occupation , 2014
Source:StatisticsCentre-AbuDhabi
%0.77.5
21.220.4
16.6
%%
%
%%
%%
%%
%
0.3%
13.09.1
5.9
3.4
0.5
18.7%
16.2%
15.7%13.8%
12.7%
10.4%
5.2%4.6%
Percentage Distribution of
Estimated Employed Population (15 Years
and Over) by Main Occupation, 2014
2.5%

6. Agriculture and Environment
• Agriculture
• Environment
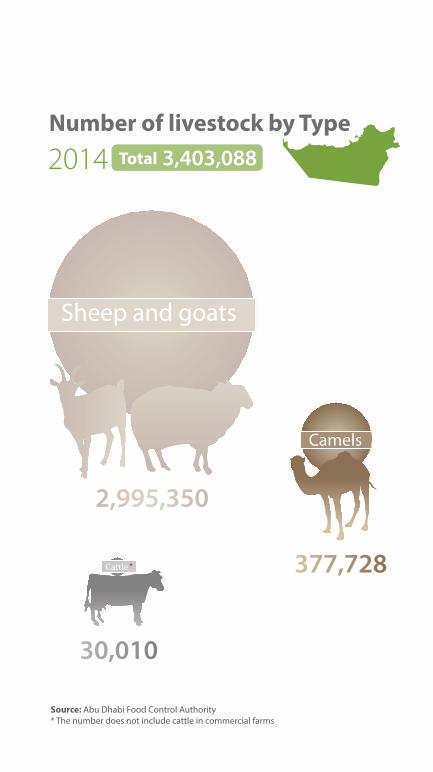
Source: AbuDhabiFoodControlAuthority*Thenumberdoesnotincludecattleincommercialfarms
2014 3,403,088
2,995,350
377,728
30,010
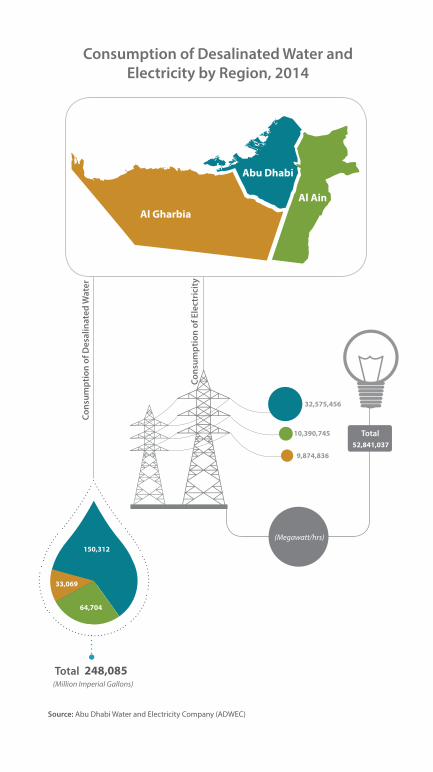
Source:AbuDhabiWaterandElectricityCompany(ADWEC)
Consumption of Desalinated Water and Electricity by Region, 2014
52,841,037
150,312
64,704
33,069
10,390,745
9,874,836
32,575,456
Cons
umpt
ion
of E
lect
rici
ty
Cons
umpt
ion
of D
esal
inat
ed W
ater
Total
(Megawatt/hrs)
(Million Imperial Gallons)Total 248,085
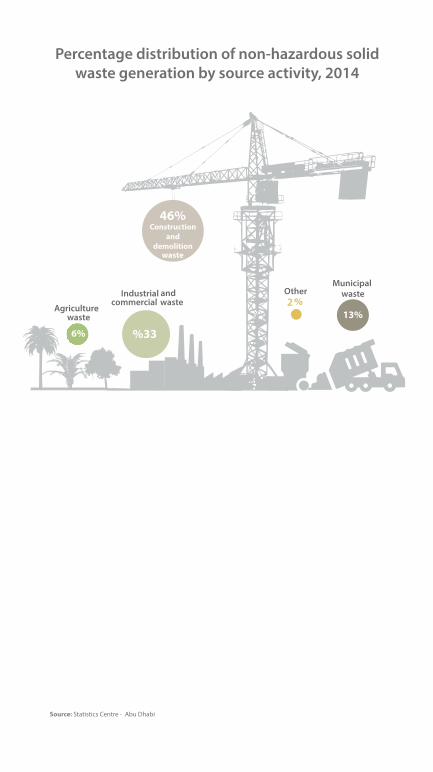
Percentage distribution of non-hazardous solid waste generation by source activity, 2014
Source:StatisticsCentre-AbuDhabi
2
waste
wastewaste
waste
Recommended