1
BASIN ANALYSIS AND HYDROCARBON POTENTIAL OF THE PAPUAN BASIN,
A FRONTIER BASIN IN PAPUA NEW GUINEA
A THESIS
SUBMITTED TO THE GRADUATE SCHOOL
IN PARTIAL FULFILLMENT OF THE REQUIREMENTS
FOR THE DEGREE
MASTER OF SCIENCE
BY
BRANDON S. RECKER
DR. RICHARD FLUEGEMAN – ADVISOR
BALL STATE UNIVERSITY
MUNCIE, INDIANA
JULY 2017

2
Table of Contents
List of Figures 4
List of Tables 6
List of Appendices 7
Abstract 9
Introduction 11
Geologic Background 14
Exploration History 14
Depositional Megasequences 16
Tectonics of the Papuan Basin 21
Lithology 25
Stratigraphy 28
Possible Source Rocks 31
Possible Reservoir Rocks 31
Methods 32
Data Collection 32
Data Preparation 32
Database Construction and Utilization 33
Results 35
Jurassic and Cretaceous Sourced Interval 40
Miocene Carbonate Sourcing 55
Structural Cross Section’s 58
Gulf of Papua Extensional Faulting and Reef Structures 75
3
Discussion 77
Hydrocarbon Trap Modeling: Structural Cross-Section’s and PETRA Modeling 79
Jurassic Sourced Rift Play 80
Jurassic Sourced Thrust Play 82
Tertiary Gas-Condensate Play 86
Conclusion 89
Future Work 90
References 91
Appendix 96
4
LIST OF FIGURES
Figure 1: Satellite imagery of Papua New Guinea 12
Figure 2: Outline of the Papuan Basin and the Shelf Platform 13
Figure 3: Location of recently targeted hydrocarbon plays 15
Figure 4: Generalized depositional megasequence summary for the Western Papuan Basin 17
Figure 5: Geologic-cross section across part of the Papuan Basin 22
Figure 6: Location map of various tectonic and structural features 24
Figure 7: Regional Stratigraphic Column for the Papuan Basin 26
Figure 8: Map of Papua New Guinea 34
Figure 9: Structural map of Papua New Guinea 35
Figure 10: Interpreted fault locations in reference to the Jurassic-Cretaceous units 36
Figure 11: Constructed basement grid map 37
Figure 12: A 3D model of the Basement rock in the Papuan Basin 38
Figure 13: 3D structural model of the Magobu Formation 40
Figure 14: Constructed grid map of the Magobu Formation 41
Figure 15: 3D structural model of the Middle Jurassic Barikewa Formation 42
Figure 16: Structural contour map of the Barikewa Formation 43
Figure 17: 3D structural model of the Koi-Iange Formation 44
Figure 18: Structural contour map of the Koi-Iange Formation 45
Figure 19: Contoured isopach map of the Imburu Formation 46
Figure 20: 3D model of the Jurassic Imburu Mudstone 47
Figure 21: Structural contour map of the Jurassic Imburu Formation 48
Figure 22: Contoured isopach map of the Jurassic Toro Sandstone 49
Figure 23: 3D contour map of the Jurassic Toro Sandstone 50
Figure 24: Structural contour map of the Jurassic Toro Sandstone 51
Figure 25: 3D model of the Jurassic Ieru Formation 52
Figure 26: Structural contour map of the Jurassic Ieru Formation 53
5
Figure 27: 3D model of the Miocene Darai Limestone 55
Figure 28: Contoured map of the Miocene Darai Limestone 56
Figure 29: Structural subsurface cross section between the wells Iehi – Barikewa – Omati 1 58
Figure 30: Structural subsea cross section between the wells Kanau – Iehi – Orie 60
Figure 31: Cross section between Kiunga – Lake Murray 1 – Lake Murray 2 – and Morehead 62
Figure 32: Structural cross section between Orie – Dara – Aramia 64
Figure 33: Structural cross section between Darai and Barikewa 66
Figure 34: Structural cross section between Komewu 2 – Omati 1 – and Muabu 68
Figure 35: Structural cross section between Kiunga – Mananda – Iehi – Bwata 69
Figure 36: Structural cross section between Mananda – Kanau – Darai 70
Figure 37: Structural cross section between Barikewa – Uramu – Puri – Pasca A1 71
Figure 38: Structural cross section between Muabu – Uramu - Dibiri 72
Figure 39: Structural cross section between Morehead – Mutare – Wuroi - Kusa 73
Figure 40: 1979 reprocessed seismic line of the Pasca A3 well 74
Figure 41: Normal faults extending into the offshore Gulf of Papua 75
Figure 42: Diagram of Fault Block Rotation 82

6
LIST OF TABLES
Table 1: Well symbols used within the Petra database 32

7
LIST OF APPENDICIES
Appendix A: Dry Hole Analysis 95
Appendix B: Chart of well locations and well type 99
Appendix C: Well production amounts 100
Appendix D: Additional 3D Modeling of Jurassic units 101
Appendix E: Contoured grid maps of additional formations in the Papuan Basin 104

8
ACKNOWLEDGEMENTS
First and foremost, I would like to thank my advisor, Dr. Rick Fluegeman, for his
countless support during my academic career. Dr. Fluegeman has been a wealth of information
during this project, and has graciously provided financial support for conference presentations. I
would like to thank each of my committee members, Dr. Jeffry Grigsby and Dr. Kirsten
Nicholson, for all their help during this project. I would like to thank the providers of the Bogue
Hunt database for allowing me the opportunity to work with this data set. I would also like to
thank Mike Kutis for all his support dealing with computer software installation. Mike helped me
sort through the dataset provided to the University.
In addition, I would like to thank the staff at Parsley Energy for allowing me to shadow
their office in Austin, TX over the Summer. Their staff provided me with technical support for
using Petra and other Geologic software. I would like to thank my friends and family for their
support as I went through this process. Finally, I would like to thank my girlfriend Jenna Boyd
for her years of support while I completed my undergraduate and graduate degrees.

9
ABSTRACT
The Papuan Basin is a lightly explored foreland basin on the Western portion of the
island of Papua New Guinea. The Papuan Basin consists of several drilled wells on both the
onshore and offshore portions of the basin. Presently, the Papuan Basin is considered a frontier
basin due to the presence of many dry exploration wells. Some of these wells have limited
production, while most are dry holes. Limited seismic control, combined with a structurally
complex basin and poor infrastructure, have hindered current exploration activities. This study
attempts to understand why the Papuan Basin is still considered a frontier basin, and address the
hydrocarbon potential of the basin. Existing log data will be used to better comprehend the
Geologic processes surrounding hydrocarbon generation and reservoir formation. Advances in
modern modeling software has allowed for new stratigraphic and structural correlations to be
made across the basin, which will ultimately lead to new hydrocarbon discoveries.
Currently, we interpret two major hydrocarbon producing sources within the Papuan
Basin. These consist of the Jurassic Imburu Formation, and Miocene carbonates such as the Yala
and Darai limestones. Cretaceous sandstones, such as the Toro, provide excellent reservoir rocks
for migrated hydrocarbons that are ultimately sealed by interbedded shales and the Cretaceous
Ieru Formation. Our investigation suggests that maturation of organic material took place within
large grabens and basement lows at depths greater than 2000 meters in the central part of the
onshore Papuan Basin. Jurassic units within grabens have plunged deep enough to enter the zone
for thermal maturation of hydrocarbons. Hydrocarbons would have migrated up fault planes into
structural and stratigraphic traps. However, the timing of oil migration throughout the basin is
poorly understood due to the basins complex structural history. Ideal structural traps are located
within anticlinal structures on the upthrown blocks of reverse faults. These anticlinal structures

10
developed because of fault wedge rotation. The Antelope and Gobe fields are model fields for
this petroleum system. The offshore Papuan Basin shelf platform is dominated by a productive
Miocene carbonate reef system that extends into the Gulf of Papua.
Outside of these two production zones, formations in the Jurassic are relatively
unproductive at depths shallower than 2000 meters. Further seismic exploration and well log data
will need to be gathered in order to analyze the stratigraphic gaps between numerous wells.
Locations around basement lows and grabens are plausible exploration zones for future well
development.
11
INTRODUCTION
Statement of Problem
The Papuan Basin has been considered a frontier basin since the early 1960’s, and
scientists have been unable to explain the lack of hydrocarbon productivity. While oil and gas
wells are abundant in the Papuan Fold Belt to the Northeast, there has been limited success in the
Papuan foreland basin. Unprofitable oil and gas prices have halted current exploration projects in
the region. Scientists believe the Papuan Basin might contain large unexplored oil and gas
reserves. However, there is a limited understanding of the petroleum systems in the Papuan
Basin.
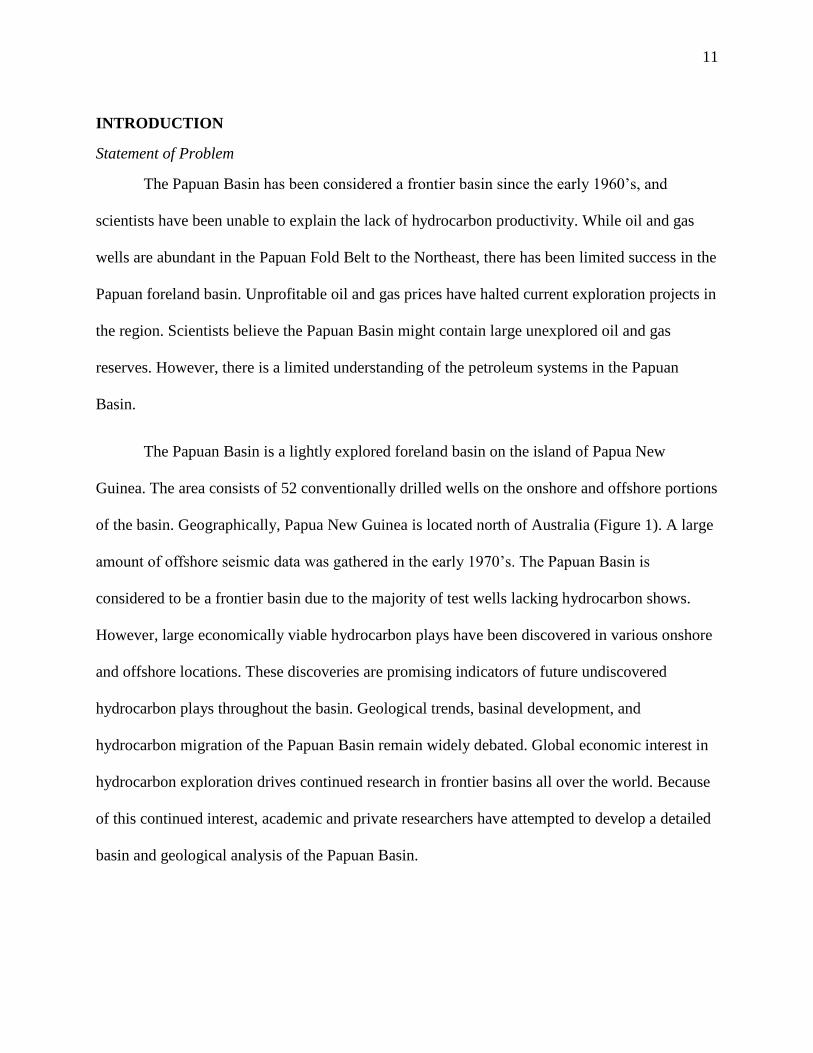
The Papuan Basin is a lightly explored foreland basin on the island of Papua New
Guinea. The area consists of 52 conventionally drilled wells on the onshore and offshore portions
of the basin. Geographically, Papua New Guinea is located north of Australia (Figure 1). A large
amount of offshore seismic data was gathered in the early 1970’s. The Papuan Basin is
considered to be a frontier basin due to the majority of test wells lacking hydrocarbon shows.
However, large economically viable hydrocarbon plays have been discovered in various onshore
and offshore locations. These discoveries are promising indicators of future undiscovered
hydrocarbon plays throughout the basin. Geological trends, basinal development, and
hydrocarbon migration of the Papuan Basin remain widely debated. Global economic interest in
hydrocarbon exploration drives continued research in frontier basins all over the world. Because
of this continued interest, academic and private researchers have attempted to develop a detailed
basin and geological analysis of the Papuan Basin.
12
Advancement in the understanding of the Geology within Papua New Guinea was
conducted by the Australasian Petroleum Company in 1961 (Rickwood, 1968; Thompson, 1967).
However, continued exploration and development has been hindered by the high risk/reward
association of hydrocarbon plays within the basin. Few advancements into the Geology of Papua
New Guinea have been made since the initial data collection in the early 1970’s. The lack of
physical core data, combined with large geographical gaps in well log data, has generated
inconsistent interpretations among scholars. Continued modeling and interpretation of the
Papuan Basin is important for two reasons: 1) it provides updated hydrocarbon models using
more advanced modeling software, 2) it allows for better understanding for future commercial oil
and gas development. With the advancement of computer programs, existing well data can be
analyzed to better understand the development of hydrocarbon resources within the Papuan
Basin. With a detailed understanding of basinal stratigraphy and structure, correlation between
oil/gas producing wells will provide a better analogue for the hydrocarbon production in the
Figure 1: Satellite imagery of Papua New Guinea. Source: “Papua New Guinea.”
6˚33’22.60”S 146˚06’27.37”E. Google Earth. December 13, 2015. January 5, 2017.
13
basin. In addition to producing wells, dry wells within the basin may provide information on
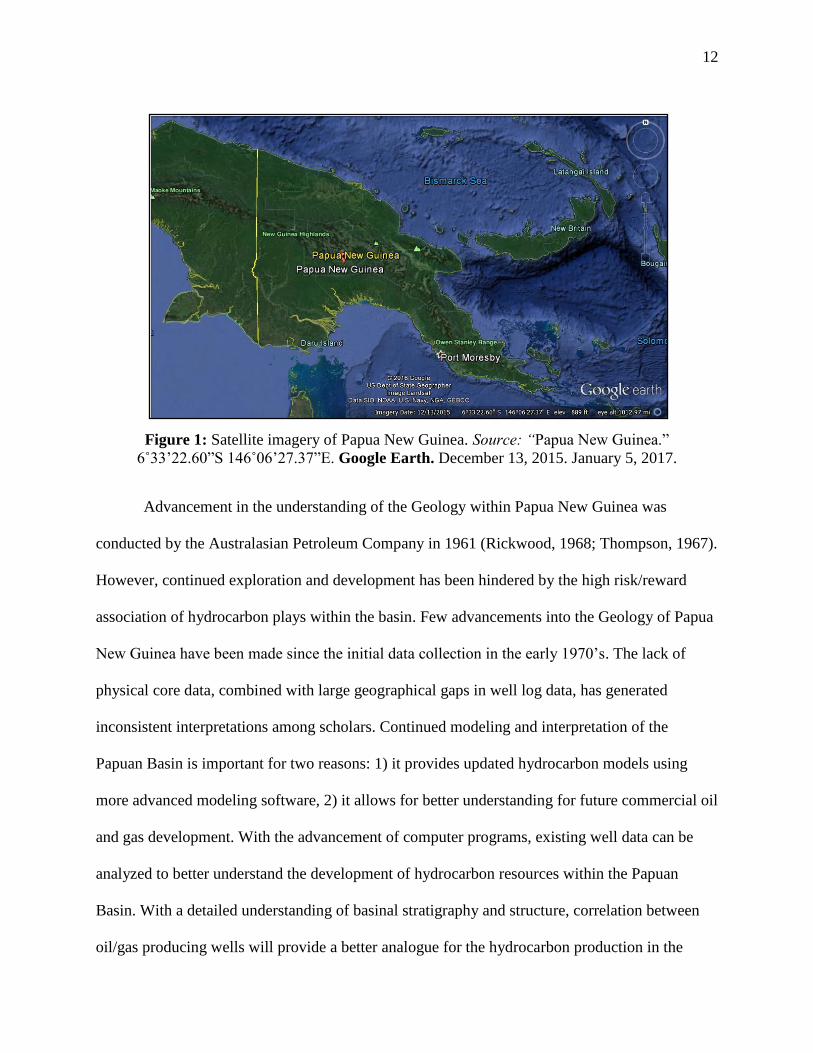
failed prospects. The purpose of this study is to understand the reasoning surrounding limited
hydrocarbon production within the extent of the Papuan Basin (Figure 2). Specifically, this study
attempts to answer the question of “Why is the Papuan Basin a frontier basin?” Existing data will
be used to better comprehend the Geologic processes surrounding hydrocarbon accumulation and
reservoir Formation.
Figure 2: This figure shows the extent of the Papuan Basin and the Shelf Platform
(from Steinshouer, et al. 1997). Red dots indicate gas-producing wells. Black dots
represent oil-producing wells.

14
GEOLOGIC BACKGROUND
Exploration History and Hydrocarbon Plays
The island of Papua New Guinea has been a prospect for hydrocarbon deposits since
early discoveries of oil seeps within the Papuan Fold belt in 1911 (Boult, 1997). Consequently,
current oil and gas discoveries have been constrained to the Papuan Fold belt. Limited success in
the Western Papuan Basin has plagued recent exploration. The Papuan Basin has a complex
structural history, combined with significant uncertainty surrounding the hydrocarbon generation
and migration history (Earnshaw et al. 1993). Discoveries of gas in 1986, represented the first
major commercially viable discovery in the Papuan Basin (Boult, 1997). The Pale Sandstone was
one of the early sedimentary units identified that showed promising reservoir potential (Ahmed
et al. 2012). Several exploration wells were drilled in the early 1950’s on the onshore portion of
the basin following previous discoveries in 1911. More wells were drilled in the following years
until the late 1980’s. The majority of wells drilled were at depths of less than 1,500 meters
(Boult, 1997). Hydrocarbon shows were observed in several of these wells; however, no wells
were economically viable at the time (Boult, 1997). Despite a handful of producing wells
(Appendix C), the onshore Papuan Basin remains a frontier basin in the early stages of
development. Rickwood (1990) identified a potential relationship between the lack of oil seeps,
and areas of low population density (Rickwood 1990; Barndollar, 1993). Thus, a correlation
between hydrocarbon production and population density may explain the lack of recent
discoveries in other remote locations.
Exploration in the offshore Papuan Basin has been targeting Miocene reef systems. The
Gulf of Papua is part of the foreland basin that developed because of the collision between the
15
Australian and Pacific plates (Palinkas et al. 2006). Seismic exploration of the offshore Gulf of
Papua has provided data sets for potential hydrocarbon prospects; however, a lack of well control
makes interpretation difficult. Roughly 11,770 kilometers of seismic work has been conducted
(Wise, 1976). Miocene reef limestones have been intensely studied for trap potential (Durkee,
1990). Early test wells discovered the presence of gas and condensate in Middle Miocene reefs
(Wise, 1976). Most notably, the Pasca reef located in the central Gulf of Papua, has been the
most productive Miocene well. Middle to Upper Jurassic source rocks in the Gulf of Papua have
shown promising hydrocarbon potential within thicker sedimentary units (Thompson, 1965;
Gordon et al. 2000). However, the current extent of the Jurassic units is currently unknown. A
detailed review of the early hydrocarbon exploration history is adequately represented by reports
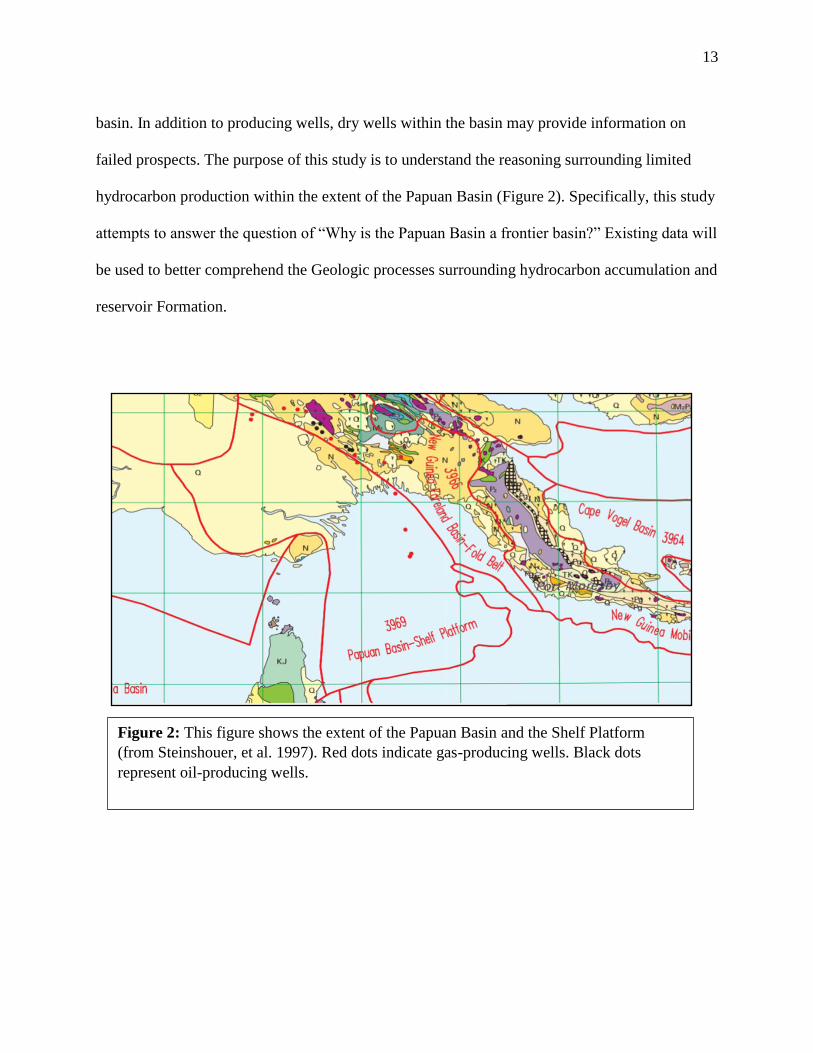
from the Australasian Petroleum Company and J. E Thompson (Oppel, 1970). Gordon et al.
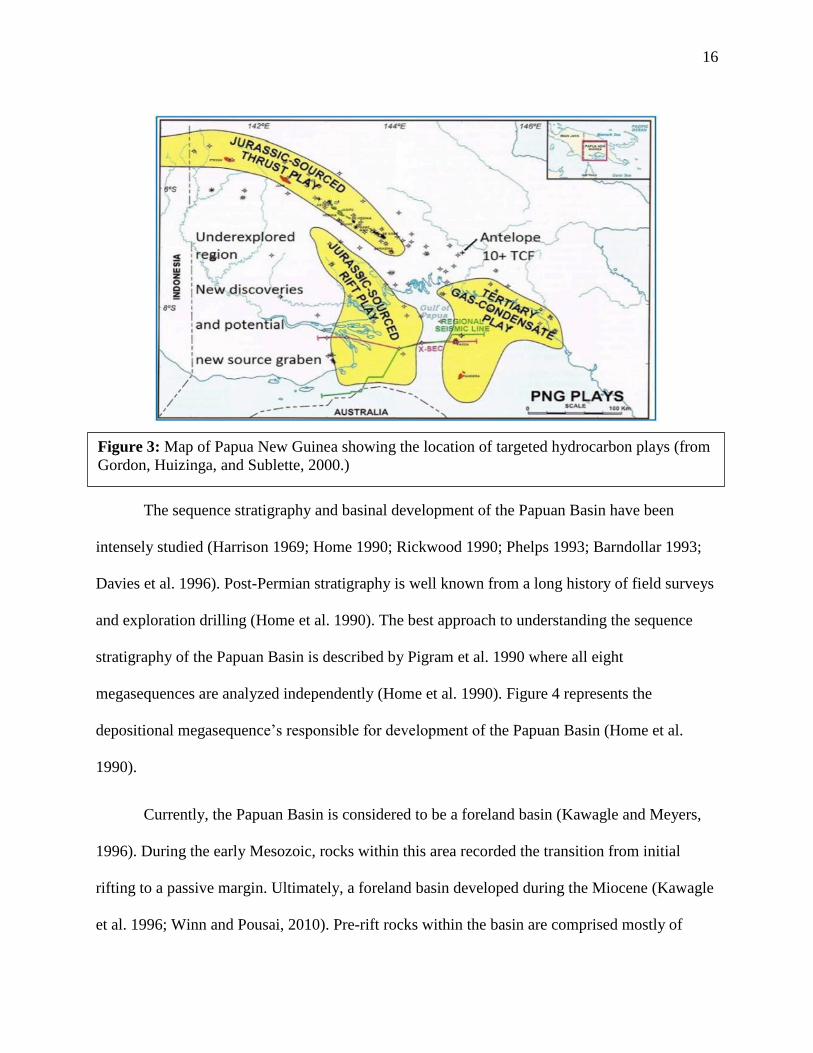
(2000) identified two major Jurassic plays located in the Papuan foreland (Fig. 3) (Gordon,
Huizinga and Sublette, 2000): 1) a Jurassic sourced thrust play, 2) a Jurassic sourced rift play. In
addition to the Jurassic plays, a Tertiary gas-condensate play is present within Eocene and
Miocene carbonates. Figure 3 shows the approximate location of all the Hydrocarbon play
locations.
16
Depositional Megasequences
The sequence stratigraphy and basinal development of the Papuan Basin have been
intensely studied (Harrison 1969; Home 1990; Rickwood 1990; Phelps 1993; Barndollar 1993;
Davies et al. 1996). Post-Permian stratigraphy is well known from a long history of field surveys
and exploration drilling (Home et al. 1990). The best approach to understanding the sequence
stratigraphy of the Papuan Basin is described by Pigram et al. 1990 where all eight
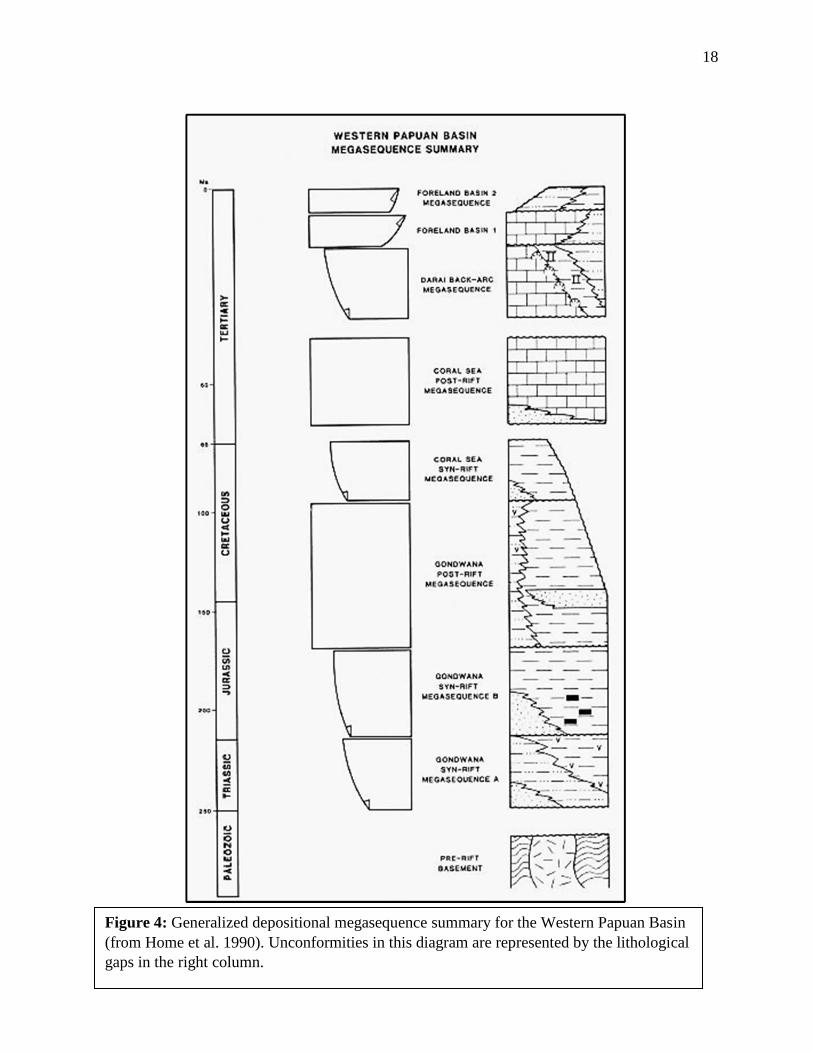
megasequences are analyzed independently (Home et al. 1990). Figure 4 represents the
depositional megasequence’s responsible for development of the Papuan Basin (Home et al.
1990).
Currently, the Papuan Basin is considered to be a foreland basin (Kawagle and Meyers,
1996). During the early Mesozoic, rocks within this area recorded the transition from initial
rifting to a passive margin. Ultimately, a foreland basin developed during the Miocene (Kawagle
et al. 1996; Winn and Pousai, 2010). Pre-rift rocks within the basin are comprised mostly of
Figure 3: Map of Papua New Guinea showing the location of targeted hydrocarbon plays (from
Gordon, Huizinga, and Sublette, 2000.)
17
igneous plutons that make pre-Mesozoic reconstruction difficult (Home et al. 1990). The Kubor
Granodiorite and the Strickland Granite are the respective names for intrusive igneous rocks in
the Western portion of the basin (Home et al. 1990). Pre-rift sedimentary rocks are restricted to
the center of the Kubor Anticline (Home et al. 1990). Rifting in the Papuan Basin is largely the
result of the breakup of the Australasian portion of Gondwana during the Late Carboniferous
(Kawagle et al. 1996). Separation of the Tibetan, Indonesian, and Pacific plate fragments,
allowed for the development of early rifting observed within the Papuan Basin (Kawagle et al.
1996). The seperated Australasian portion of Gondwana during the Late Carboniferous collided
with the Papuan Basin during the Gondwana Syn-Rift at 250-215Ma (Home et al. 1990;
Kawagle et al. 1996).
18
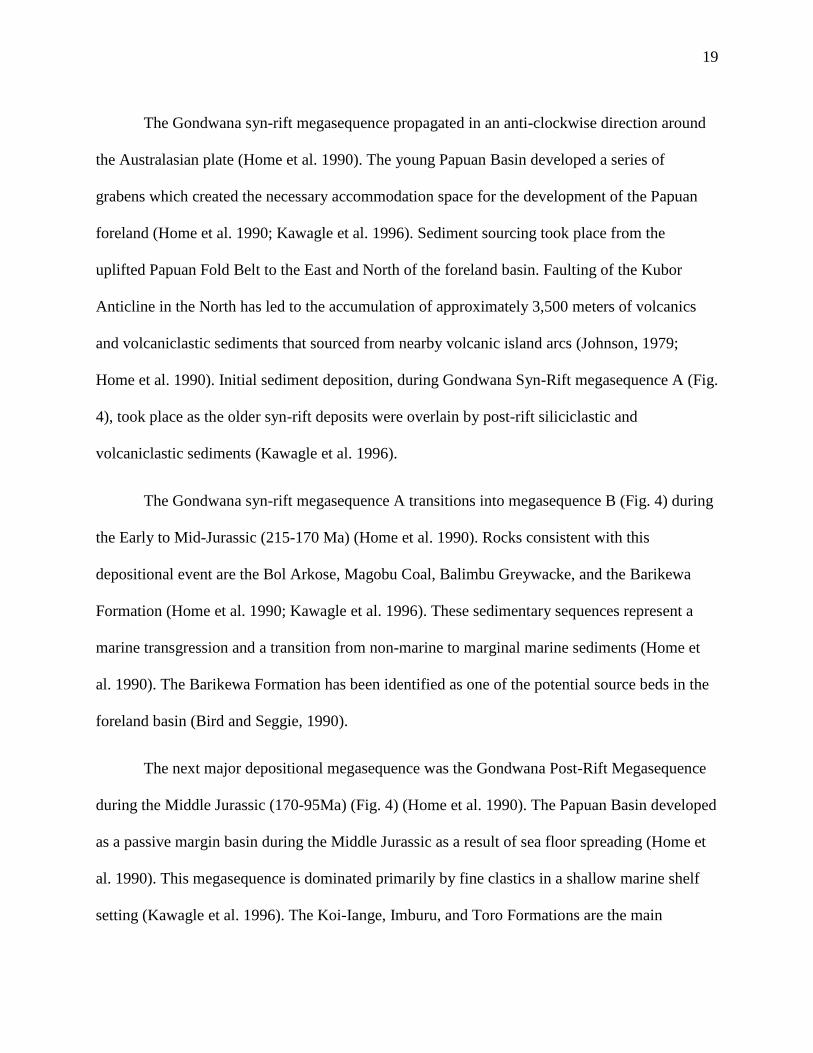
Figure 4: Generalized depositional megasequence summary for the Western Papuan Basin
(from Home et al. 1990). Unconformities in this diagram are represented by the lithological
gaps in the right column.
19
The Gondwana syn-rift megasequence propagated in an anti-clockwise direction around
the Australasian plate (Home et al. 1990). The young Papuan Basin developed a series of
grabens which created the necessary accommodation space for the development of the Papuan
foreland (Home et al. 1990; Kawagle et al. 1996). Sediment sourcing took place from the
uplifted Papuan Fold Belt to the East and North of the foreland basin. Faulting of the Kubor
Anticline in the North has led to the accumulation of approximately 3,500 meters of volcanics
and volcaniclastic sediments that sourced from nearby volcanic island arcs (Johnson, 1979;
Home et al. 1990). Initial sediment deposition, during Gondwana Syn-Rift megasequence A (Fig.
4), took place as the older syn-rift deposits were overlain by post-rift siliciclastic and
volcaniclastic sediments (Kawagle et al. 1996).
The Gondwana syn-rift megasequence A transitions into megasequence B (Fig. 4) during
the Early to Mid-Jurassic (215-170 Ma) (Home et al. 1990). Rocks consistent with this
depositional event are the Bol Arkose, Magobu Coal, Balimbu Greywacke, and the Barikewa
Formation (Home et al. 1990; Kawagle et al. 1996). These sedimentary sequences represent a
marine transgression and a transition from non-marine to marginal marine sediments (Home et
al. 1990). The Barikewa Formation has been identified as one of the potential source beds in the
foreland basin (Bird and Seggie, 1990).
The next major depositional megasequence was the Gondwana Post-Rift Megasequence
during the Middle Jurassic (170-95Ma) (Fig. 4) (Home et al. 1990). The Papuan Basin developed
as a passive margin basin during the Middle Jurassic as a result of sea floor spreading (Home et
al. 1990). This megasequence is dominated primarily by fine clastics in a shallow marine shelf
setting (Kawagle et al. 1996). The Koi-Iange, Imburu, and Toro Formations are the main
20
sedimentary units deposited during the Gondwana Post-Rift megasequence (Kawagle et al.
1996). Deposition of the Toro Formation is interpreted as multiple marine regressive phases,
with a coarsening upward sequence (Sari, 1990). Overall, this period of time was dominated by a
wide scale transgressive sequence taking place during initial Gondwana rifting (Home et al.
1990).
Following the Gondwana Post-Rift, the Coral Sea Syn-Rift Megasequence took place
during the Late Cretaceous (95-65 Ma) (Fig. 4) (Home et al. 1990; Kawagle et al. 1996).
Thermally driven regional uplift in the Southeastern portion of the Papuan Basin accelerated the
erosion and accumulation of approximately two kilometers of sediments (Home et al. 1990).
This erosional event is referred to as the Tertiary-Mesozoic unconformity. The major lithological
units deposited during this megasequence were the Ieru and Chim Formations (Kawagle et al.
1996). The Tertiary-Mesozoic unconformity overlies the Ieru Formation, and marks the
boundary between the Coral Sea syn-rift, and the Coral Sea post-rift (Kawagle et al. 1996).
Figure 4 demonstrates the Tertiary-Mesozoic unconformity as a gap in the lithology column
between this time interval.
The Coral Sea post-rift megasequence encompasses all deposited sediments that are
Paleocene to Eocene in age. This megasequence was identified by Home et al. (1990), as
occurring approximately 65-35 Ma (Fig. 4). Siliciclastics in the lower portion of the sequence
consist of the Moogli Mudstone, Urubea Sandstone, and carbonates in the upper portion
(Kawagle et al. 1996). Carbonates present in the upper portion of the post-rift megasequence are
referred to as the Yala, Chimbu, and Nebilyer Limestones (Home et al. 1990; Kawagle et al.
1996). Conditions during the Coral Sea post-rift were sufficient to generate widespread
21
carbonate platform development. Climatic conditions during this rifting phase were tropical as
the Papuan Basin migrated around the equator (Harris et al. 1996).
The Darai Back Arc megasequence followed the coral sea rifting phase during the Late
Oligocene (35-15 Ma) (Home et al. 1990; Kawagle et al. 1996) (Fig. 4). After deposition of the
Darai Limestone during a tectonically stable period, reactivation of the Fly, Komewu, and Darai
faults took place during back-arc basin development (Kawagle et al. 1996). Carbonate and clastic
sediments comprised the bulk of the deposited sediment during this megasequence. The top of
the megasequence is marked by a correlative disconformity (Kawagle et al. 1996). Deposition of
large carbonate Formations during this megasequence provide good reflective boundaries for
seismic identification.
Two Foreland Basin megasequences follow deposition of the Darai Back Arc
megasequence (Fig. 4). These megasequences date from 15 Ma to present day (Home et al.
1990). Widespread basin inversion and regional compression developed after the conclusion of
back arc extension (Home et al. 1990). The second Foreland Basin megasequence was a result of
Late Miocene collisional tectonics (Home et al. 1990). Uplift of the fold belt and island-arc
terrains, provided a sediment source for the accumulation of clastic sediments in the Papuan
Basin. Thermal subsidence was widespread in the Gulf of Papua (Kawagle et al. 1996). The
major formations deposited during this megasequence are the Orudabi and Apinaipi Formations
(Kawagle et al. 1996).

22
Tectonics of the Papuan Basin
Tectonically, the onshore Papuan Basins complexity is apparent in the extreme structural
and stratigraphic discrepancies throughout the basin. The Papuan Basin developed by rifting,
thinning, and subsidence of the Australian portion of continental crust during the Mesozoic
(Davies et al. 1996). Foreland basin development began in the Cenozoic, which led to eventual
thrust and fold belt development during the Pliocene (Davies et al. 1996). Home et al. (1990) laid
the framework for basinal development in terms of individual megasequence deposition (Fig. 4).
Brown et al. (1978) subdivided Papua New Guinea into three major geotectonic provenances:
The Papuan Platform, the Central Orogenic Belt, and the Northeastern Island Arc Province
(Brown et al. 1978). The Papuan Basin contains the Papuan platform and the offshore Gulf of
Papua region. A north-west to south-east trending rift system developed during the Triassic as a
response to the break-up of Gondwana (Hirst and Price, 1996). Extensional tectonics led to a
series of horst and graben faulting and trough development. These structures provided the
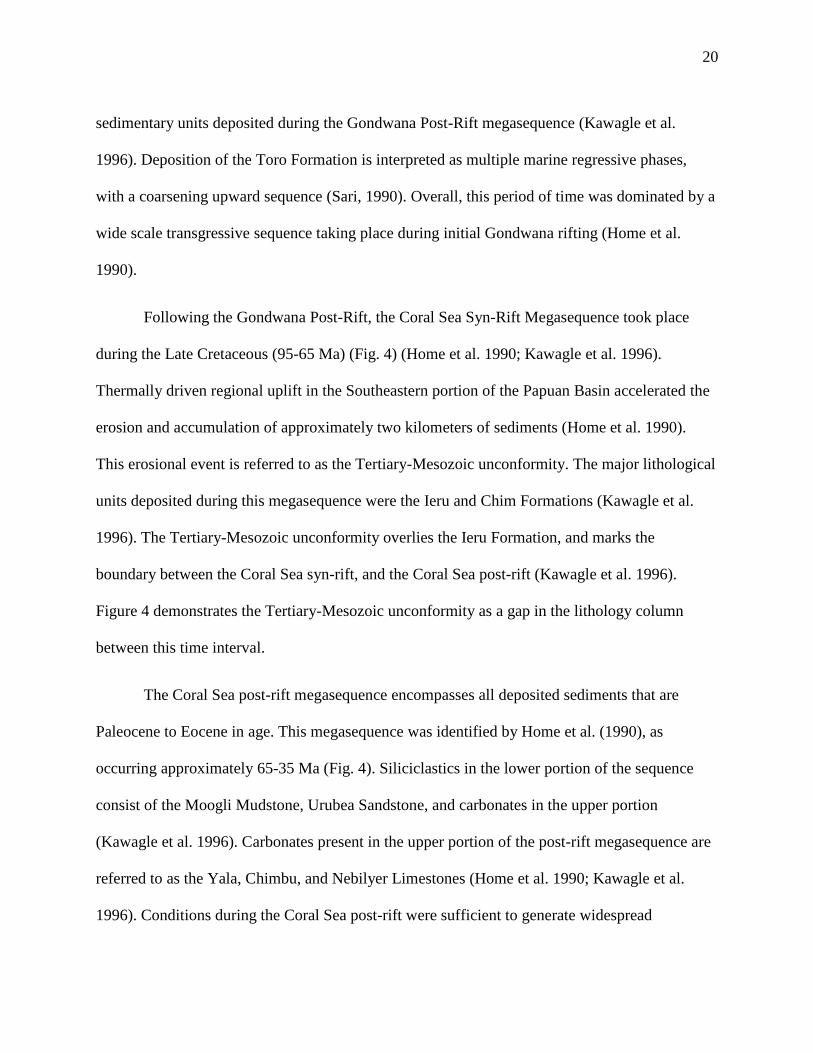
necessary accommodation space for siliciclastic deposition. Figure 5 shows the lateral
stratigraphic change in siliciclastic deposition. Tertiary compressional tectonics encompasses
much of the hydrocarbon traps within the Papuan Basin (Hill et al. 1996).
23
Fig
ure
5:
This
fig
ure
sho
ws
a geo
logic
-cro
ss s
ecti
on a
cross
par
t of
the
Pap
uan
Bas
in.
This
im
age
dem
onst
rate
s si
lici
clas
tic
dep
osi
tion (
from
Gord
on e
t al
. 2000).

24
Late Triassic to Middle Cretaceous was an important time frame for hydrocarbon
generation and accumulation (Barndollar, 1993). Rift grabens are identified as optimal
exploration locations for hydrocarbon deposits. In addition to rift structures in the Papuan Basin,
wrench faulting is observed in the reactivated Komewu Fault (Barndollar, 1993). Hydrocarbon
accumulation is primarily dependent on the presence of intraformational interbedded mudstone
seals within deep Jurassic sandstone units (Barndollar, 1993).
The tectonic framework of the Gulf of Papua is relatively unknown before Tertiary time.
Structural complexity, and overlying Eocene strata have made a tectonic framework
reconstruction difficult (Wise, 1976). However, recent advancements in seismic imaging allow
us to observe pre-Tertiary structural features. The structural opening of the Gulf of Papua took
place during the Triassic to Mid-Jurassic as a result of rifting (Gordon et al. 2000). En echelon
diapiric mudstones, which are approximately Eocene in age, are related to compressional
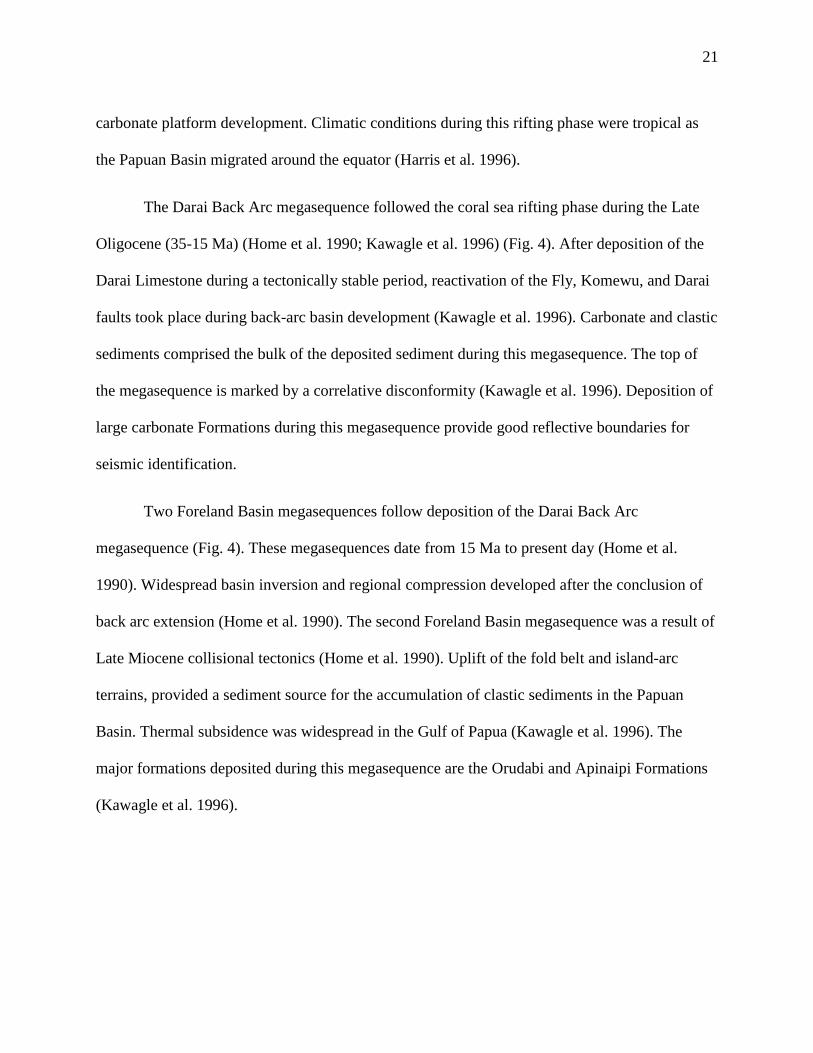
tectonics in the eastern Gulf of Papua (Wise, 1976). The currently mapped tectonic and structural
elements within the Papuan Basin are shown in Figure 6.
25
Figure 6: Location map of various tectonic and structural elements within the Papuan Basin
from (Barndollar, 1993). The blue star marks the location of wrench faulting observed near
the Komewu 2 fault.

26
Lithology
The Papuan Basin contains of a wide variety of lithologies. Lateral changes in lithology
are primarily due to development of several mini-basins during extensional tectonics. A
generalized stratigraphic column for the Papuan Basin from West to East is represented in Figure
7. Rocks within the basin are Triassic and younger in age. Hydrocarbon discoveries have been
made in the Jurassic, Cretaceous, and Miocene units. Lithological characteristics vary widely
across the basin because of changes in sediment sourcing. Several correlative unconformities
exist in the basin and are shown in a stratigraphic column (Fig. 7). Most notably, a large
unconformity is present between the Ieru Formation and overlying marine limestones (Fig. 7).
This unconformity is the result of non-deposition (Barndollar, 1993). Jurassic units in the basin
have a wide variety of lithologies. One of the lowest Jurassic units is the Magobu Formation.
This unit is largely sandstone with interbedded sub-bituminous coal. Above this unit is the
Barikewa Formation which varies in lithology from a mudstone to sandstone. Mudstones in the
Barikewa Formation are a brown/grey color. Above the Barikewa lies the Koi Iange Formation.
This unit is predominantly sandstone with interbedded siltstones. This unit is a light grey in
color, and medium grained. The Imburu Formation is primarily a mudstone that grades into a
sandy siltstone. The overlying Cretaceous Toro Formation is a coarse-grained sandstone with
interbedded mudstone. Parts of the Toro Formation are calcareous. Above the Toro sandstone
lays the Ieru Formation. This unit is primarily a very fine grained siltstone that is grey in color.
The Ieru is calcareous and pyritic in various intervals. Above the Jurassic and Cretaceous units
are the Eocene and Miocene carbonates. Both carbonates are primarily dolomitic limestones. The
Miocene Darai unit is a fossiliferous limestone that is slightly less dolomitized than older
carbonates.
27
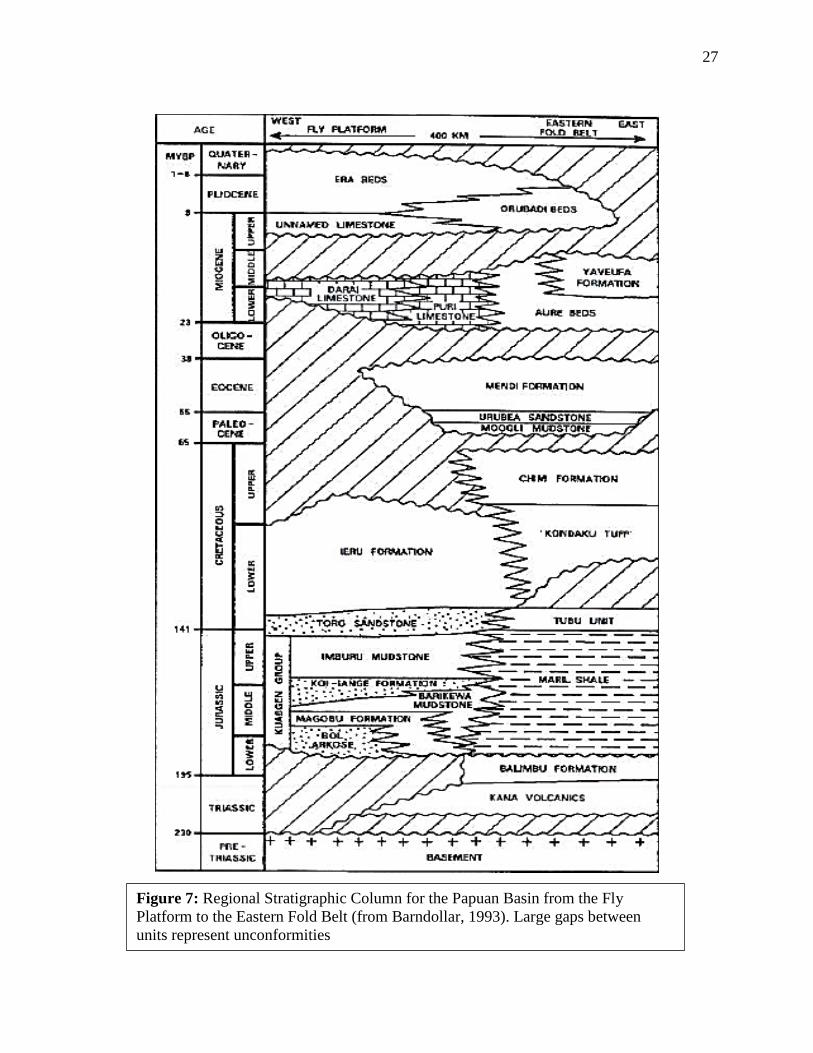
Figure 7: Regional Stratigraphic Column for the Papuan Basin from the Fly
Platform to the Eastern Fold Belt (from Barndollar, 1993). Large gaps between
units represent unconformities
28
Stratigraphy of the Papuan Basin
The post-Permian stratigraphy of the Papuan Basin has been thoroughly analyzed from
field surveys, and a long exploration history (Home et al. 1990). However, limited amounts of
good quality seismic data have resulted in a poor understanding of the structural evolution of the
Papuan Basin. In addition, thick sequences of limestone and karst features make seismic imaging
and processing difficult (Valenti and Francis, 1996). Individual megasequence boundaries were
first identified from Home et al. 1990 (Fig. 4). The first correlation of major unconformities and
megasequence boundaries was conducted by BP using well and outcrop samples (Home et al.
1990). Understanding the stratigraphic relationship between the source, reservoir, and seal rocks,
is important for future hydrocarbon development.
Mesozoic
Sediment in the Mesozoic was primarily in the form of quartz, sand, silt, and clay that
was sourced from the uplifted Australian Shield (Rickwood, 1968). The presence of the Kana
Volcanics (Fig. 7) in the Western Highlands suggests a second sediment source from a volcanic
arc (Rickwood, 1968).
The Ieru Formation (Fig. 7) is a conformable Cretaceous (late Berriasian to Campanian)
silty mudstone. The Ieru overlies the Toro sandstone conformably (Fig. 7), with some evidence
suggesting that the boundary is diachronous on a regional basis (Phelps and Denison, 1993). The
northeastern Chim Formation (Fig. 7) is the lateral equivalent to the upper Ieru Formation
(Phelps and Denison, 1993). Overlying the Ieru Formation is a regional unconformity that is a
disconformity on a local scale (Phelps and Denison, 1993). Deposition of the Ieru was consistent
with a shelfal environment that was inner to middle neritic (Phelps and Denison, 1993).
29
However, a gradual deepening during the Albian shifted the deposition of the Ieru to outer neritic
to upper bathyal (Phelps and Denison, 1993).
Toro reservoirs, along with other similar Late Jurassic to Early Cretaceous sandstones,
were deposited during a eustatic depositional cycle (Madu, 1996). The Toro was deposited
during a regressive phase, following an initial transgression and progradational flooding phase
(Madu, 1996). Toro Sandstones are interpreted to be barrier bar complexes that deposited during
these regressive intervals (Sari, 1990). Lithologically, the Toro Sandstone has 3 distinctive
intervals. These intervals consist of: a lower sandstone unit, a middle thick mudstone/siltstone
unit, and an upper sandstone unit. The lithology in these units varies; however, the Toro is
dominantly a medium bedded, grey, fine to coarse grained quartzose with glauconite (Sari,
1990). Intraformational shales within the Toro can act as hydrocarbon cap rocks for various
target zones. Evidence for this is seen in the recent Gobe field discovery where intraformational
shales within the Toro have accumulated oil deposits (Surka, 1993). The Toro and Koi Iange
Sandstones coincide with regressive cycles (Carman, 1987). Subsidence variations in the Papuan
Basin may have caused fluctuations in sea level curves and coastal onlap patterns (Carman,
1987). A better development of Cretaceous sandstones would have taken place to the North and
East because of this local subsidence (Carman, 1987).
The major source rock for the Papuan Basin has been identified as a Late Jurassic marine
shale that is Late Oxforidan to Late Kimmeridgian in age (Hirst and Price, 1996). This
Formation is known as the Imburu Formation (Fig. 7).
30
Cenozoic
The end of the Mesozoic is marked by a widespread change in the environment in
Western Papua New Guinea (Rickwood, 1968). Thick terrigenous and volcaniclastic sediment
continued to source from the Western Highlands (Rickwood, 1968). Carman (1987) noted that a
global oscillatory highstand during the Early Tertiary resulted in deposition of carbonate units
(Carman, 1987; Tcherepanov et al. 2008). Carbonate deposition began during the Maastrichtian
and Paleocene, and persisted until mid-Miocene (Davies, 2012). This transgression marks the
beginning of the Eocene, in which a thin fossiliferous detrital limestone was deposited in a
shallow water shelf environment (Rickwood, 1968). During the Miocene, a second period of
marine transgression and deposition resulted in deposition of the Darai Limestone (Fig. 7) (Wise,
1973). During the Late Miocene, reef growth stopped due to the input of clastic sediment
deposition from continued erosion of the New Guinea Highlands (Wise, 1973). Overlying
Pliocene and Pleistocene sequences are primarily mudstones with sandstone intervals.
Conditions during this time were consistent with a deep water tropical environment (Wise,
1973). Diapiric folds occurred within plastic Pliocene mudstones (Wise, 1973).
31
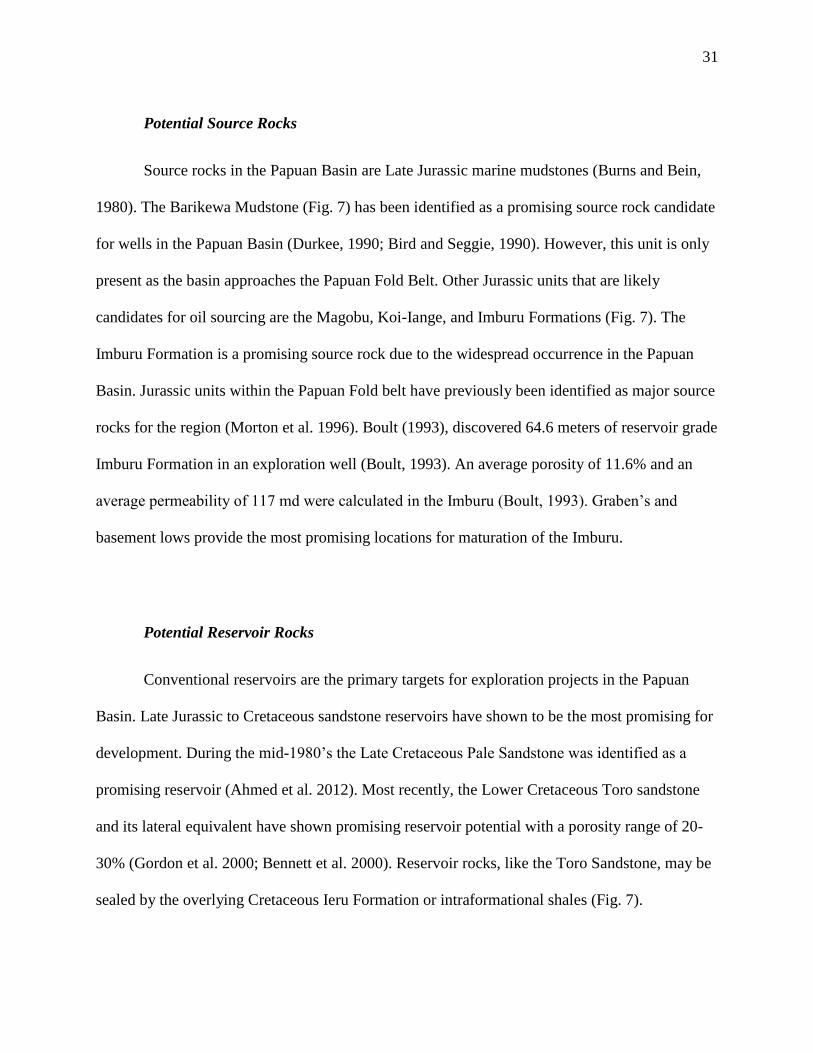
Potential Source Rocks
Source rocks in the Papuan Basin are Late Jurassic marine mudstones (Burns and Bein,
1980). The Barikewa Mudstone (Fig. 7) has been identified as a promising source rock candidate
for wells in the Papuan Basin (Durkee, 1990; Bird and Seggie, 1990). However, this unit is only
present as the basin approaches the Papuan Fold Belt. Other Jurassic units that are likely
candidates for oil sourcing are the Magobu, Koi-Iange, and Imburu Formations (Fig. 7). The
Imburu Formation is a promising source rock due to the widespread occurrence in the Papuan
Basin. Jurassic units within the Papuan Fold belt have previously been identified as major source
rocks for the region (Morton et al. 1996). Boult (1993), discovered 64.6 meters of reservoir grade
Imburu Formation in an exploration well (Boult, 1993). An average porosity of 11.6% and an
average permeability of 117 md were calculated in the Imburu (Boult, 1993). Graben’s and
basement lows provide the most promising locations for maturation of the Imburu.
Potential Reservoir Rocks
Conventional reservoirs are the primary targets for exploration projects in the Papuan
Basin. Late Jurassic to Cretaceous sandstone reservoirs have shown to be the most promising for
development. During the mid-1980’s the Late Cretaceous Pale Sandstone was identified as a
promising reservoir (Ahmed et al. 2012). Most recently, the Lower Cretaceous Toro sandstone
and its lateral equivalent have shown promising reservoir potential with a porosity range of 20-
30% (Gordon et al. 2000; Bennett et al. 2000). Reservoir rocks, like the Toro Sandstone, may be
sealed by the overlying Cretaceous Ieru Formation or intraformational shales (Fig. 7).
32
METHODS
Data Collection
Data for this project area was donated to Ball State University by L. Bogue Hunt. This
database is commonly referred as the “Hunt Database”. The database contains well-log data,
lithological data, drilling reports, 2D seismic data, structural maps, and geological reports for
various exploration sites. A large portion of the Hunt Database is comprised of physical well-log
data and numerous seismic lines. Well-logs contain lithological, geochemical, and
paleontological data. Additionally, gamma ray, spontaneous potential (SP), and resistivity data
are available for each of the wells within the Papuan Basin. Geographical locations for each of
the well sites are provided in the form of Latitude and Longitude. Shot-point and navigation data
for 2D seismic lines are provided in their corresponding navigation logs.
Data Preparation
In order to construct meaningful geologic maps, the original data from the Hunt Database
was processed to become suitable for mapping programs. Well-log data was collected and
entered into an Excel sheet. Well names, locations, and total depth were recorded. Values were
entered in meters for continuity. Gamma ray, SP, and resistivity logs were extracted from the
database, and calibrated manually for depth scales. Formation tops were picked from a
combination of lithological data, and changes in the recorded values from gamma ray, SP, and
resistivity profiles. These tops are important marker points for stratigraphic correlation. Rock
descriptions were provided in well reports where drill cuttings and core data was available.
Drilling remarks were important for understanding hydrocarbon shows and production rates
present within each well.

33
Database Construction and Utilization
The mapping program Petra was used to construct a database for the Papuan Basin. Petra
is a useful program for the construction and interpretation of geologic maps, cross-section lines,
and 3D models. Collected well-log data was entered into Petra in the form of an uncalibrated
raster image file. This image file allows for the manual entry of Formation tops and depth values
for each well location. Physical information such as the Kelly Bushing Elevation, total well
depth, and geographic location were entered into the database to produce a point on the map
symbolizing the well. Georeferenced Tiff images were used to construct the outline of Papua
New Guinea. A corresponding symbol was assigned to each well to describe the production
potentials observed in the drilling remarks. These symbols are available in Table 1.
Table 1: This table consists of well symbols used within the Petra database. Well
symbols were assigned based off of well log information provided from the Bogue Hunt
Database.
Once a database for the Papuan Basin was constructed, various mapping tools within
Petra were made available. Detailed contoured grid maps were constructed for each Formation
top within the basin. A depth to basement map was used to analyze sediment distribution and
sedimentary thickness across the basin. Geologic cross-sections were constructed through

34
various wells to correlate stratigraphic units, and infer structural features. Isopach maps were
created to analyze Formation thicknesses for the Ieru and Imburu Formations. Several 3D models
were created using Petra’s 3Dviz Simulator. Cross sections and 3D models were analyzed using
an 18x vertical exaggeration to identify subsurface structures. Seismic data was analyzed for
structural features that extend out into the Gulf of Papua.
35
RESULTS
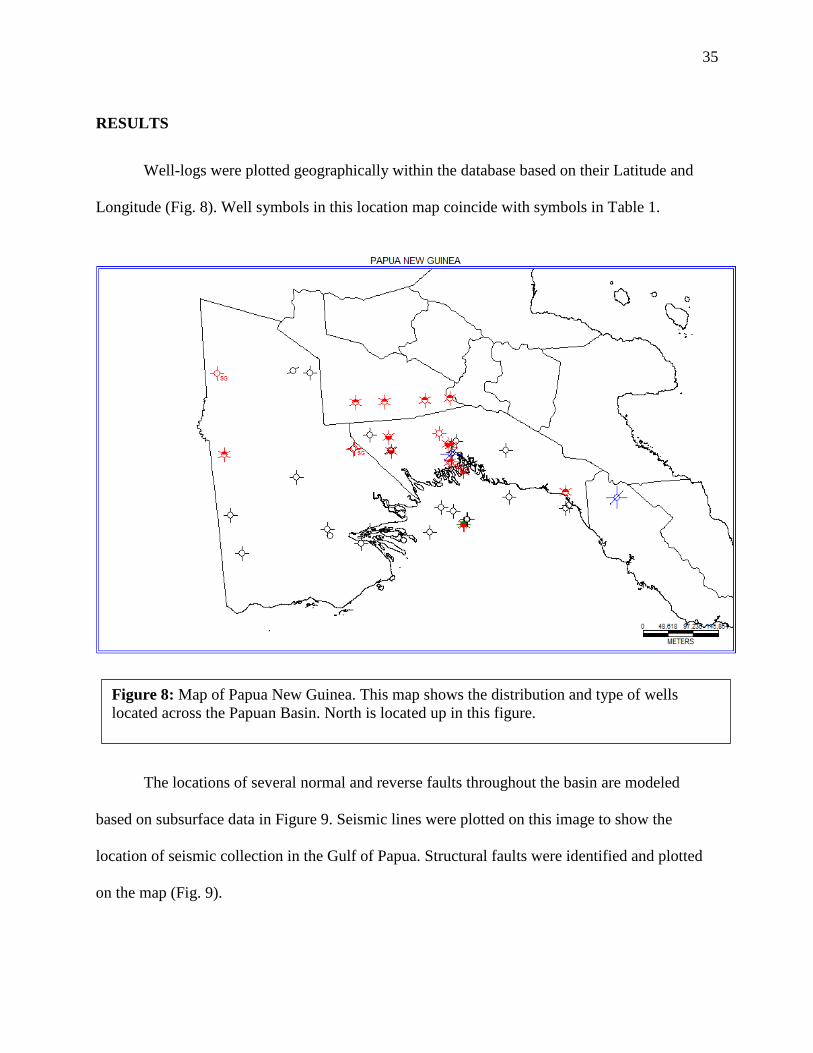
Well-logs were plotted geographically within the database based on their Latitude and
Longitude (Fig. 8). Well symbols in this location map coincide with symbols in Table 1.
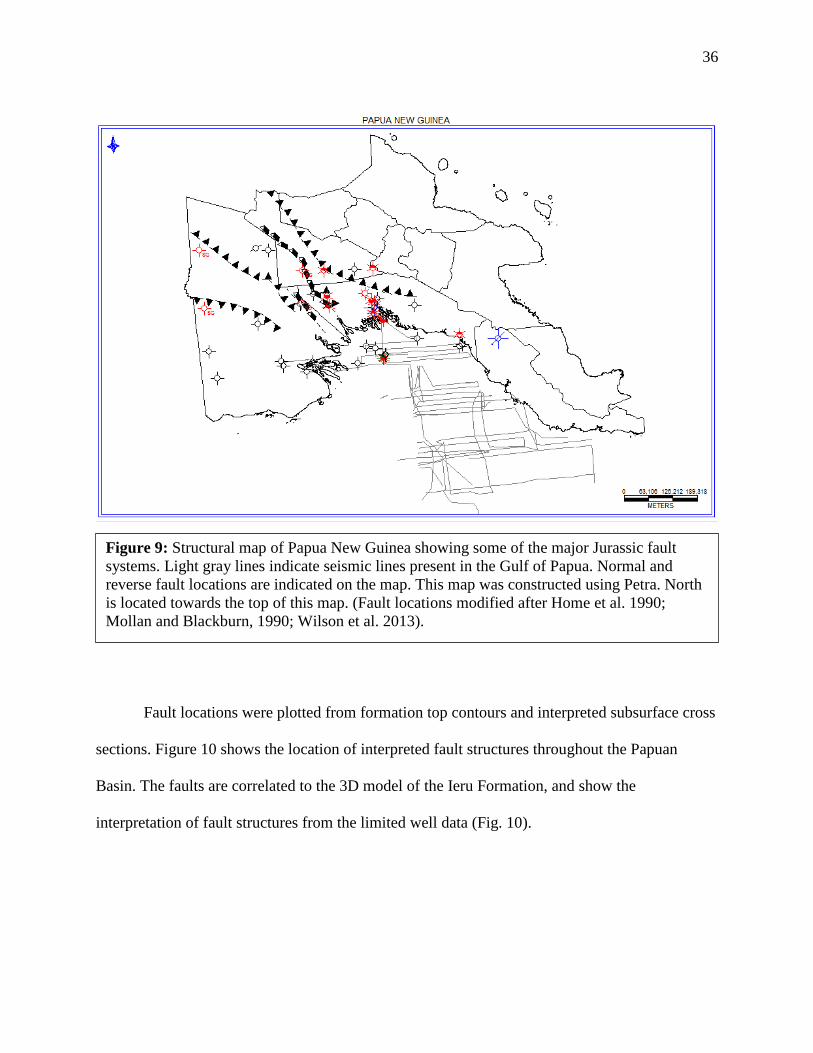
The locations of several normal and reverse faults throughout the basin are modeled
based on subsurface data in Figure 9. Seismic lines were plotted on this image to show the
location of seismic collection in the Gulf of Papua. Structural faults were identified and plotted
on the map (Fig. 9).
Figure 8: Map of Papua New Guinea. This map shows the distribution and type of wells
located across the Papuan Basin. North is located up in this figure.
36
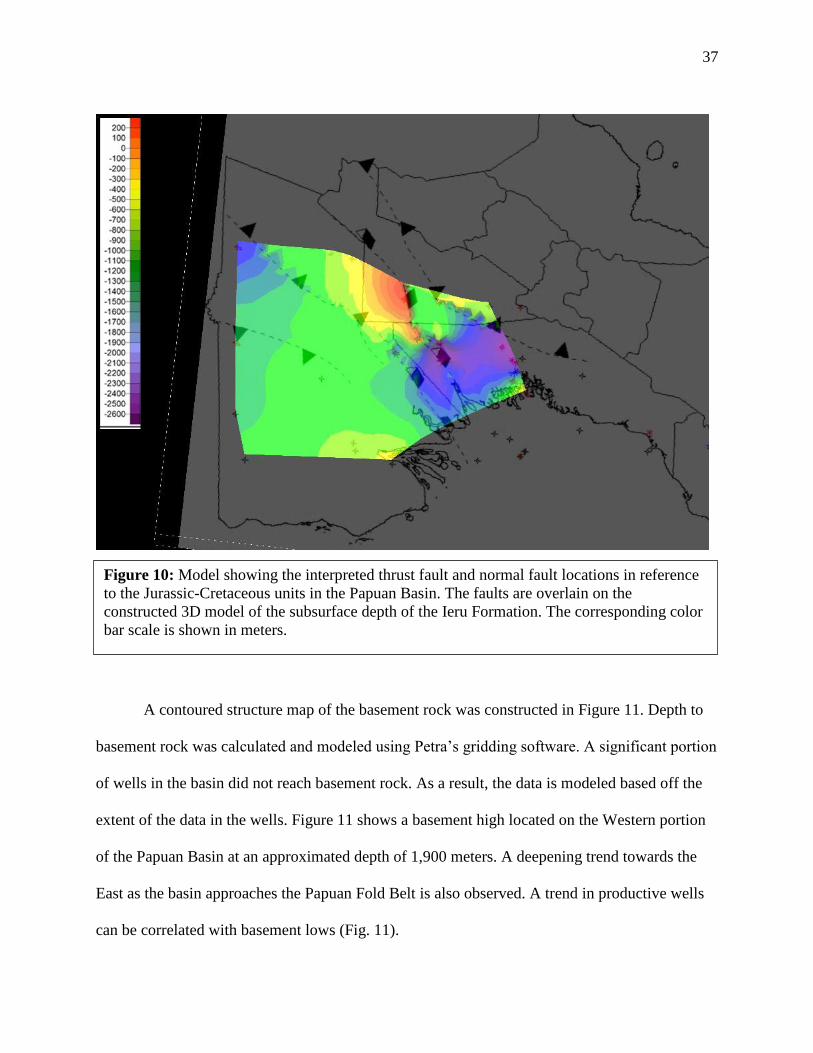
Fault locations were plotted from formation top contours and interpreted subsurface cross
sections. Figure 10 shows the location of interpreted fault structures throughout the Papuan
Basin. The faults are correlated to the 3D model of the Ieru Formation, and show the
interpretation of fault structures from the limited well data (Fig. 10).
Figure 9: Structural map of Papua New Guinea showing some of the major Jurassic fault
systems. Light gray lines indicate seismic lines present in the Gulf of Papua. Normal and
reverse fault locations are indicated on the map. This map was constructed using Petra. North
is located towards the top of this map. (Fault locations modified after Home et al. 1990;
Mollan and Blackburn, 1990; Wilson et al. 2013).
37
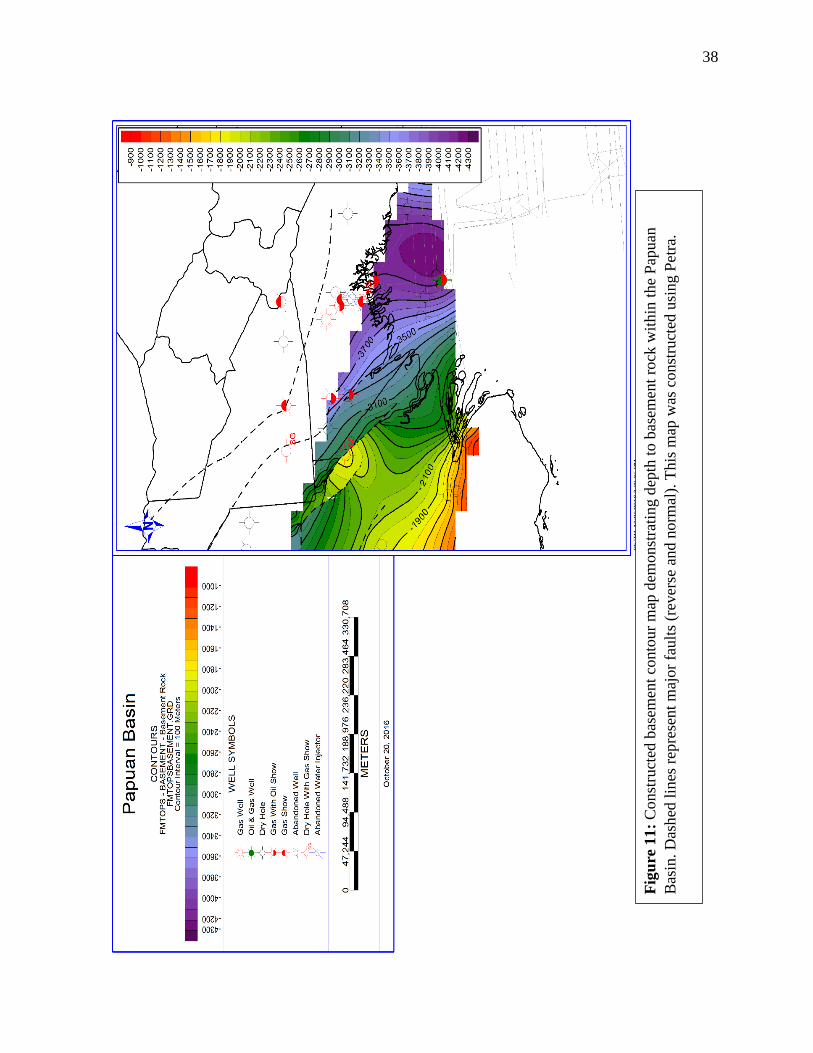
A contoured structure map of the basement rock was constructed in Figure 11. Depth to
basement rock was calculated and modeled using Petra’s gridding software. A significant portion
of wells in the basin did not reach basement rock. As a result, the data is modeled based off the
extent of the data in the wells. Figure 11 shows a basement high located on the Western portion
of the Papuan Basin at an approximated depth of 1,900 meters. A deepening trend towards the
East as the basin approaches the Papuan Fold Belt is also observed. A trend in productive wells
can be correlated with basement lows (Fig. 11).
Figure 10: Model showing the interpreted thrust fault and normal fault locations in reference
to the Jurassic-Cretaceous units in the Papuan Basin. The faults are overlain on the
constructed 3D model of the subsurface depth of the Ieru Formation. The corresponding color
bar scale is shown in meters.
38
Fig
ure
11
: C
onst
ruct
ed b
asem
ent
conto
ur
map
dem
onst
rati
ng d
epth
to b
asem
ent
rock
wit
hin
the
Pap
uan
Bas
in. D
ash
ed l
ines
rep
rese
nt
maj
or
fault
s (r
ever
se a
nd n
orm
al).
This
map
was
const
ruct
ed u
sing P
etra
.

39
A 3D model of the constructed basement grid map is represented in Figure 12. 3D
modeling of the basement top was conducted at a scale of 20x vertical exaggeration to show
changing structural features across the Papuan Basin. The location of North in Figure 12 is
represented by the blue shaded box.
Figure 12: A 3D model of the Basement rock in the Papuan Basin. The blue box represents
North. This model was constructed using Petra. VE: 20x. The color scale corresponds to the
structural contour map.

40
Jurassic and Cretaceous Sourced Interval
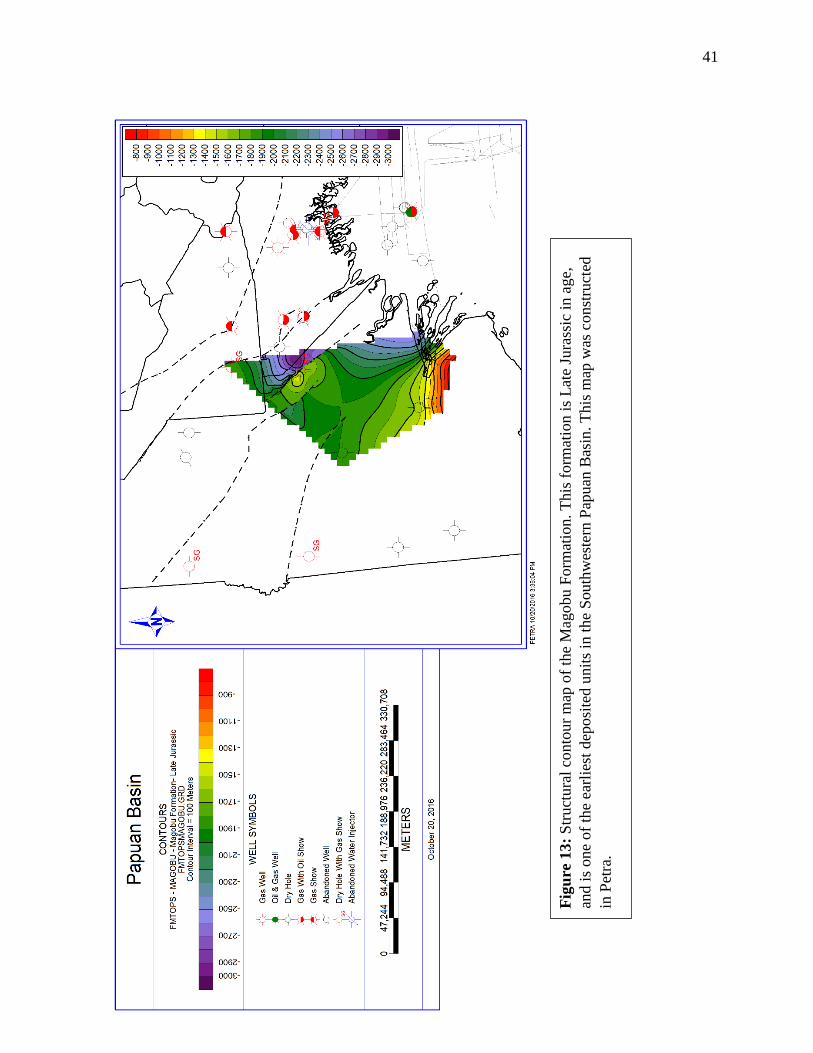
Figure 13 represents the structural contour map of the lower Jurassic Magobu Formation
(Fig. 7). Deposition of the Magobu is restricted to the Southwest portion of the onshore Papuan
Basin. The average depth of the Magobu follows a similar trend to the basement depth (Fig. 11).
The Magobu Formation has a low source potential and poor reservoir quality as indicated on
drilling logs. The Magobu Formation (Fig. 13) was contoured using a 100 meter interval, and
assigned a specific color range.
41
Fig
ure
13
: S
truct
ura
l co
nto
ur
map
of
the
Mag
obu
Form
atio
n. T
his
form
atio
n i
s L
ate
Jura
ssic
in a
ge,
and i
s one
of
the
earl
iest
dep
osi
ted u
nit
s in
the
South
wes
tern
Pap
uan
Bas
in. T
his
map
was
const
ruct
ed
in P
etra
.
42
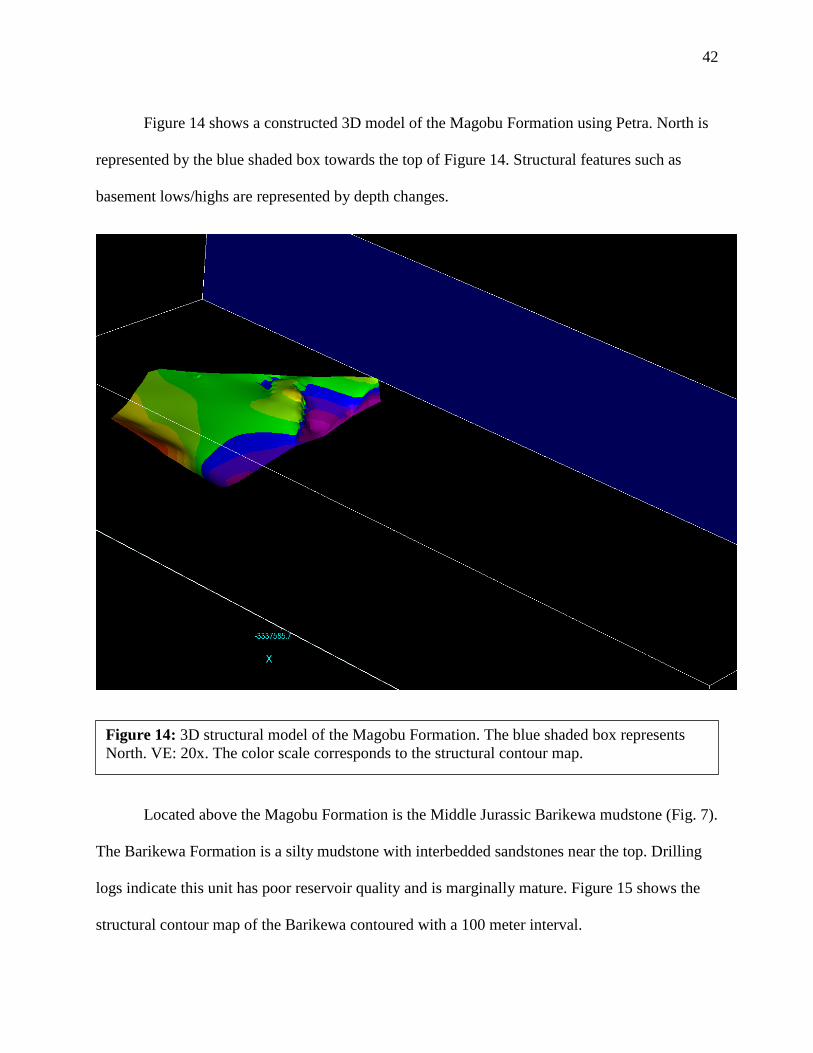
Figure 14 shows a constructed 3D model of the Magobu Formation using Petra. North is
represented by the blue shaded box towards the top of Figure 14. Structural features such as
basement lows/highs are represented by depth changes.
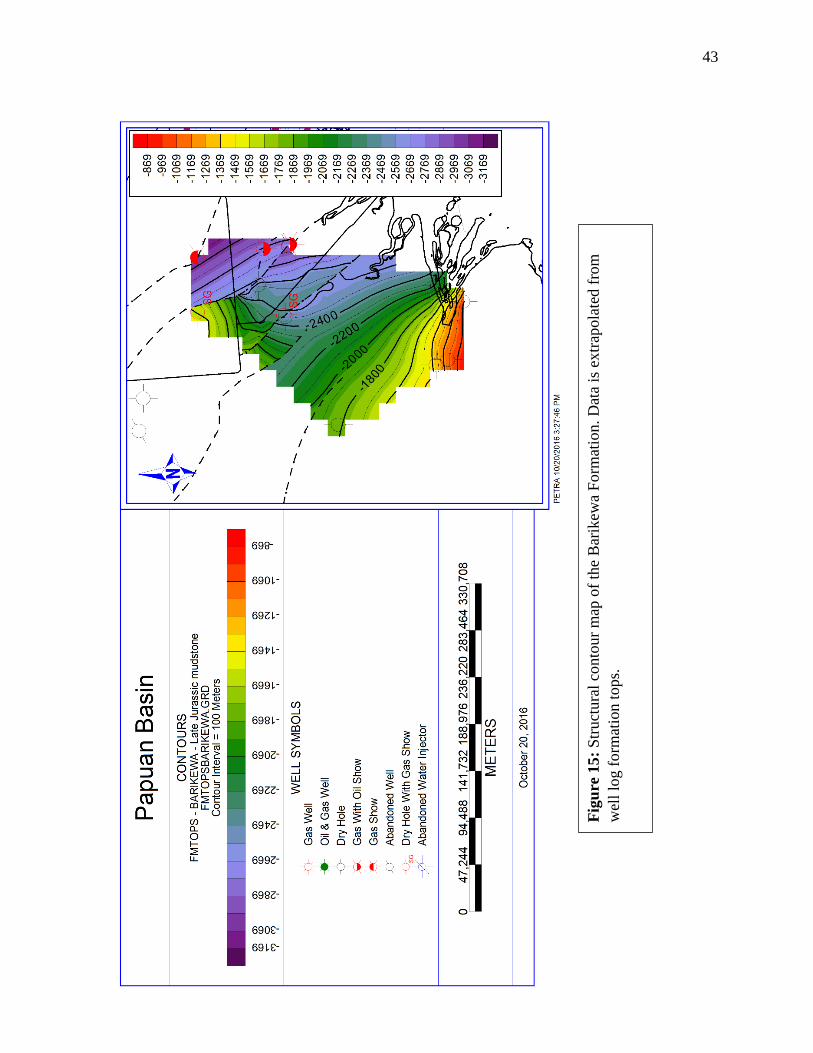
Located above the Magobu Formation is the Middle Jurassic Barikewa mudstone (Fig. 7).
The Barikewa Formation is a silty mudstone with interbedded sandstones near the top. Drilling
logs indicate this unit has poor reservoir quality and is marginally mature. Figure 15 shows the
structural contour map of the Barikewa contoured with a 100 meter interval.
Figure 14: 3D structural model of the Magobu Formation. The blue shaded box represents
North. VE: 20x. The color scale corresponds to the structural contour map.
43
Fig
ure
15
: S
truct
ura
l co
nto
ur
map
of
the
Bar
ikew
a F
orm
atio
n. D
ata
is e
xtr
apola
ted f
rom
wel
l lo
g f
orm
atio
n t
ops.
44
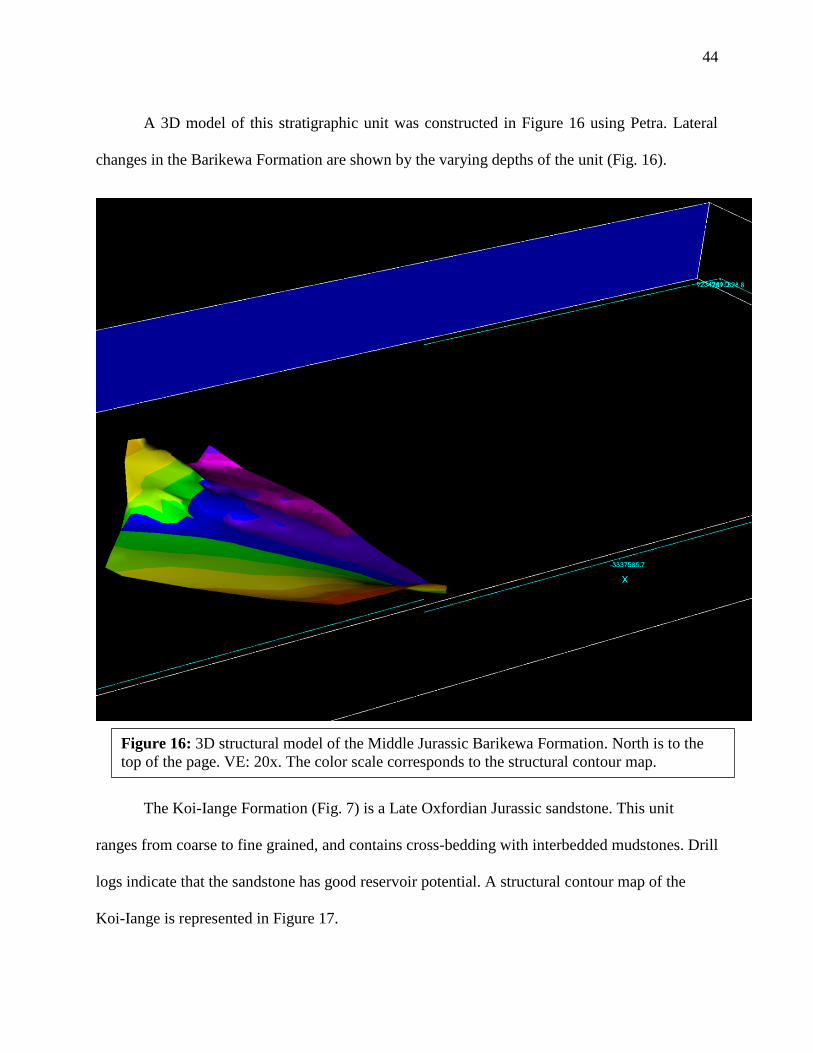
A 3D model of this stratigraphic unit was constructed in Figure 16 using Petra. Lateral
changes in the Barikewa Formation are shown by the varying depths of the unit (Fig. 16).
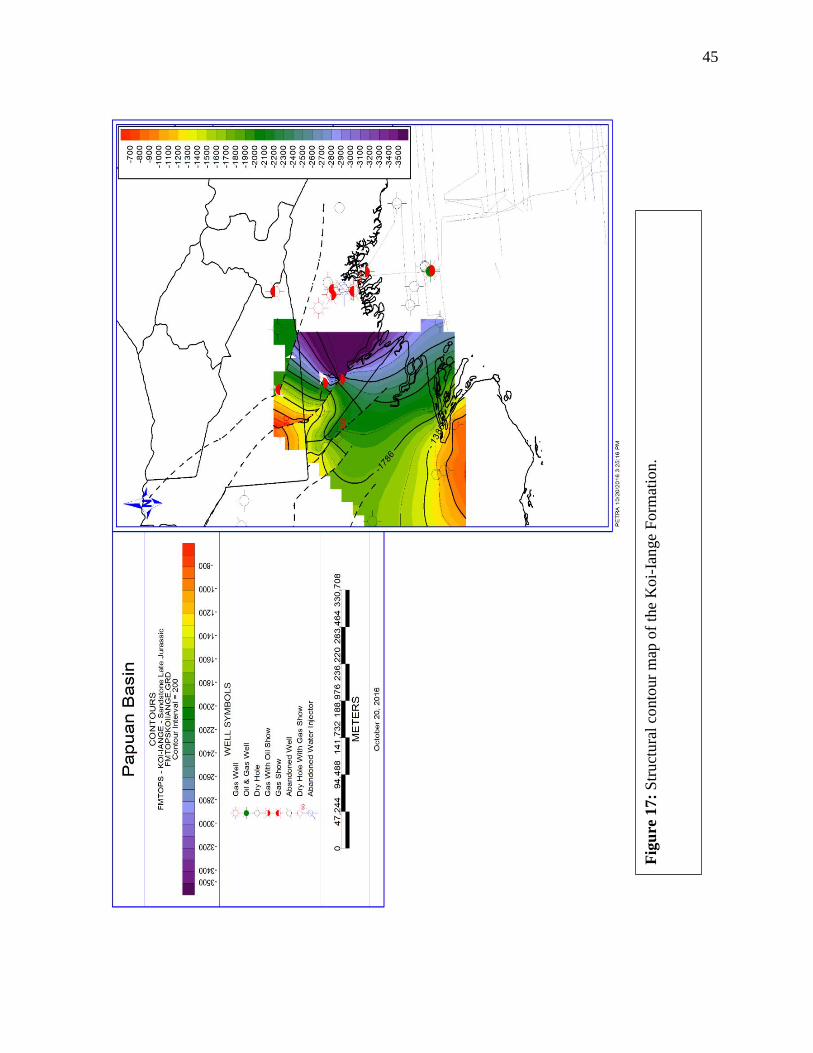
The Koi-Iange Formation (Fig. 7) is a Late Oxfordian Jurassic sandstone. This unit
ranges from coarse to fine grained, and contains cross-bedding with interbedded mudstones. Drill
logs indicate that the sandstone has good reservoir potential. A structural contour map of the
Koi-Iange is represented in Figure 17.
Figure 16: 3D structural model of the Middle Jurassic Barikewa Formation. North is to the
top of the page. VE: 20x. The color scale corresponds to the structural contour map.
45
Fig
ure
17
: S
truct
ura
l co
nto
ur
map
of
the
Koi-
Ian
ge
Form
atio
n.
46
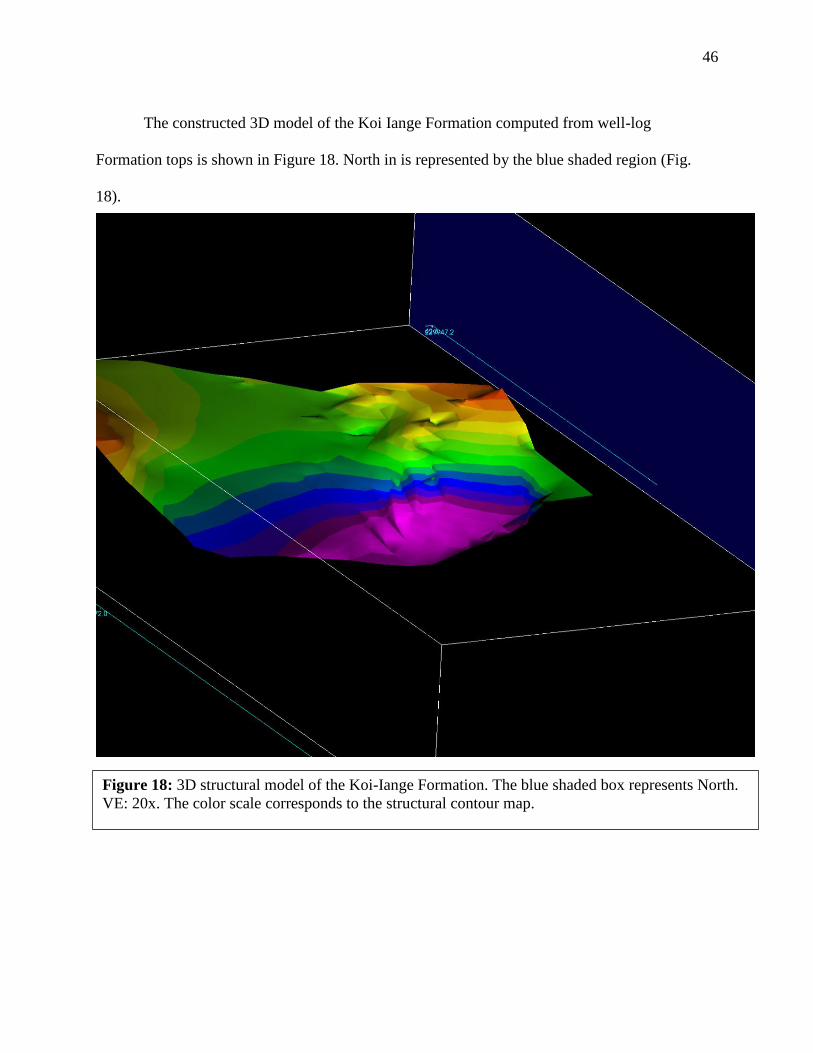
The constructed 3D model of the Koi Iange Formation computed from well-log
Formation tops is shown in Figure 18. North in is represented by the blue shaded region (Fig.
18).
Figure 18: 3D structural model of the Koi-Iange Formation. The blue shaded box represents North.
VE: 20x. The color scale corresponds to the structural contour map.
47
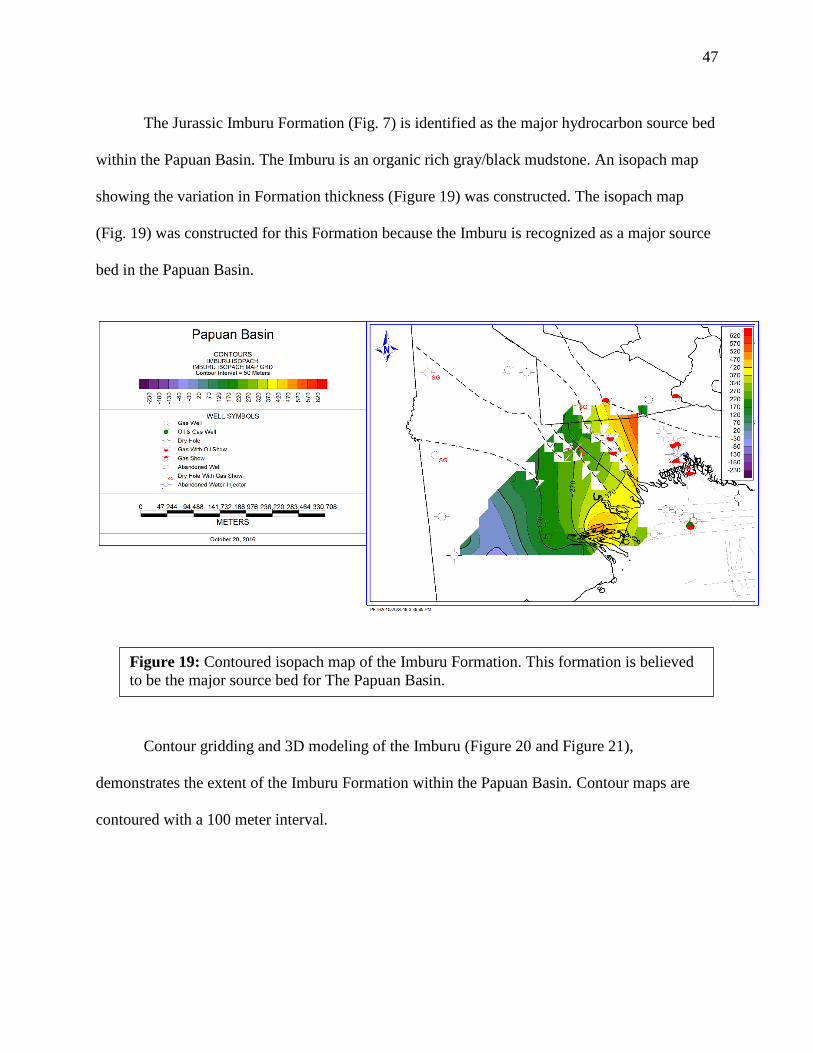
The Jurassic Imburu Formation (Fig. 7) is identified as the major hydrocarbon source bed
within the Papuan Basin. The Imburu is an organic rich gray/black mudstone. An isopach map
showing the variation in Formation thickness (Figure 19) was constructed. The isopach map
(Fig. 19) was constructed for this Formation because the Imburu is recognized as a major source
bed in the Papuan Basin.
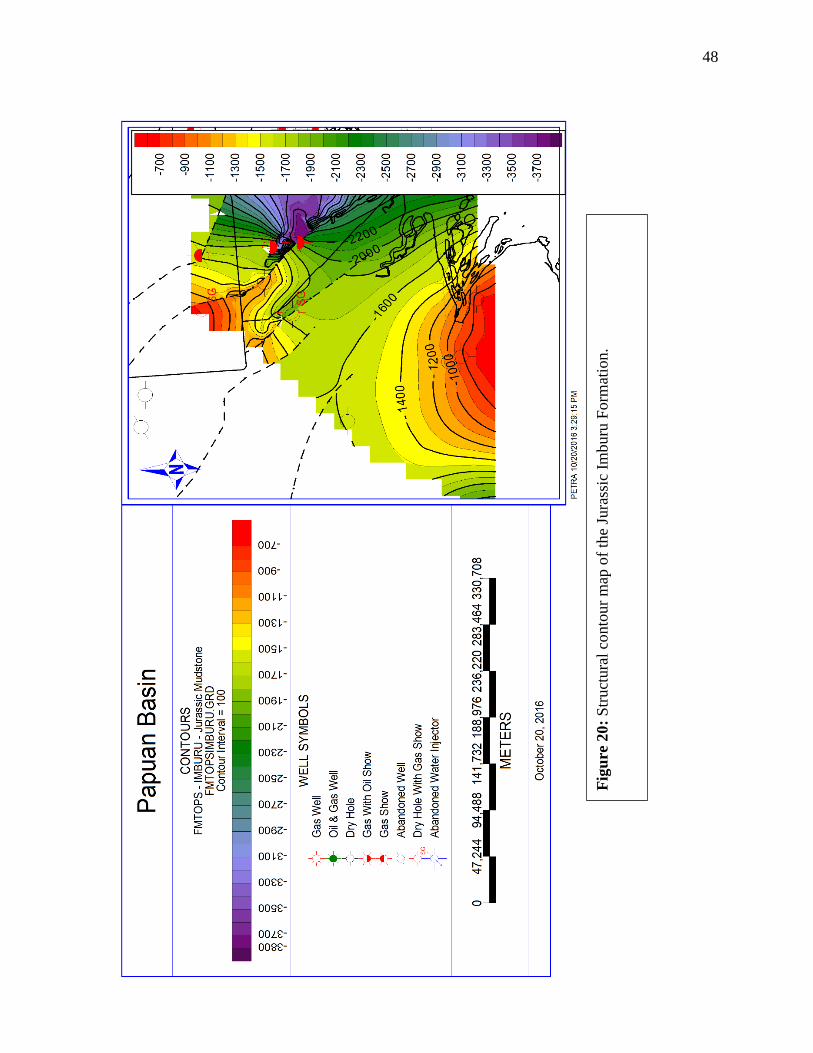
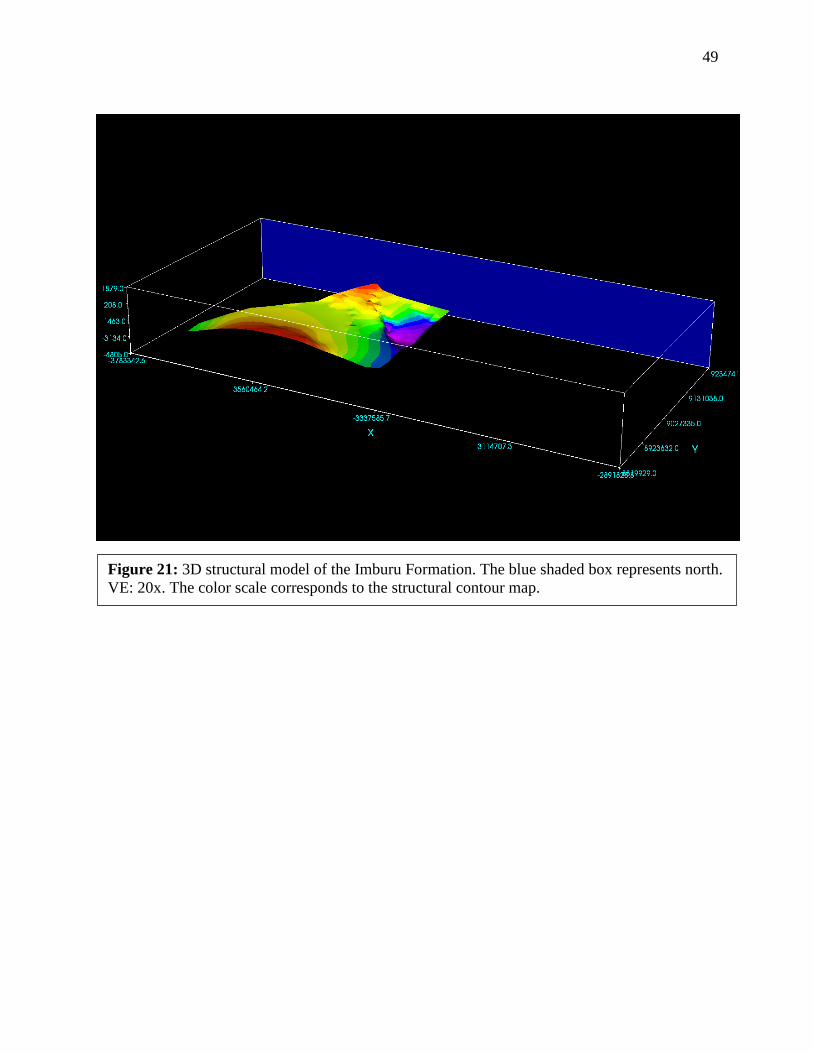
Contour gridding and 3D modeling of the Imburu (Figure 20 and Figure 21),
demonstrates the extent of the Imburu Formation within the Papuan Basin. Contour maps are
contoured with a 100 meter interval.
Figure 19: Contoured isopach map of the Imburu Formation. This formation is believed
to be the major source bed for The Papuan Basin.
48
Fig
ure
20
: S
truct
ura
l co
nto
ur
map
of
the
Jura
ssic
Im
buru
Form
atio
n.
49
Figure 21: 3D structural model of the Imburu Formation. The blue shaded box represents north.
VE: 20x. The color scale corresponds to the structural contour map.
50
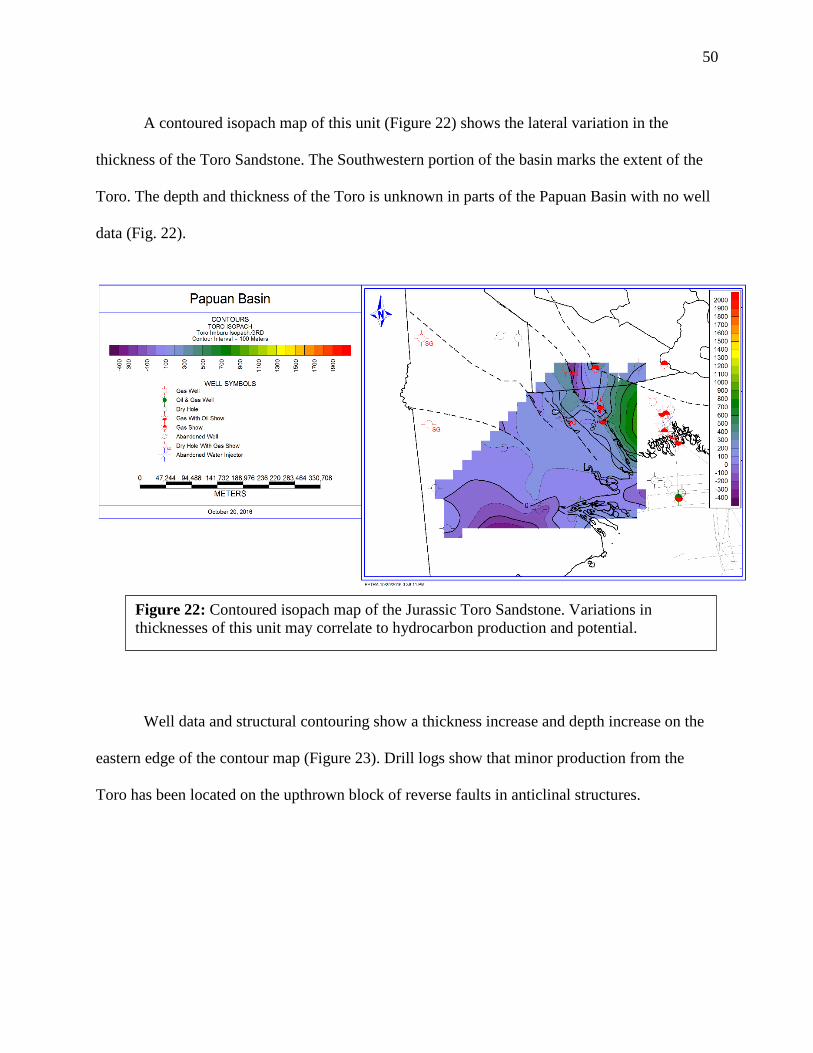
A contoured isopach map of this unit (Figure 22) shows the lateral variation in the
thickness of the Toro Sandstone. The Southwestern portion of the basin marks the extent of the
Toro. The depth and thickness of the Toro is unknown in parts of the Papuan Basin with no well
data (Fig. 22).
Well data and structural contouring show a thickness increase and depth increase on the
eastern edge of the contour map (Figure 23). Drill logs show that minor production from the
Toro has been located on the upthrown block of reverse faults in anticlinal structures.
Figure 22: Contoured isopach map of the Jurassic Toro Sandstone. Variations in
thicknesses of this unit may correlate to hydrocarbon production and potential.
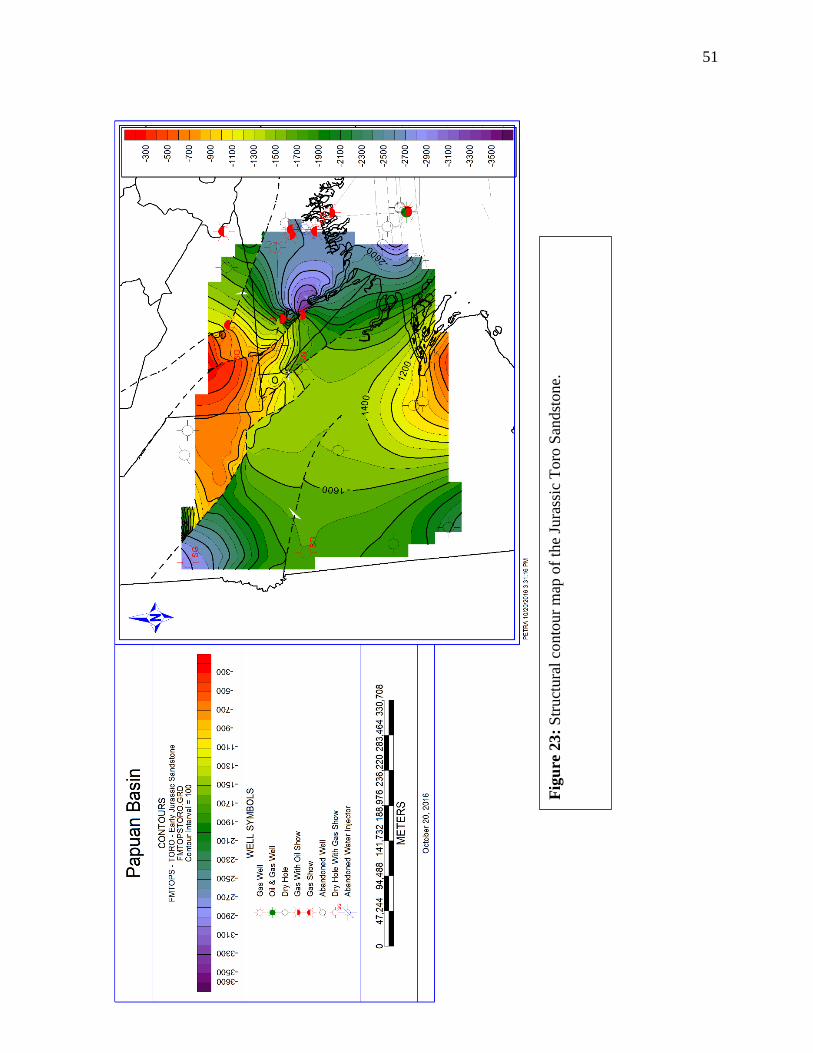
51
Fig
ure
23
: S
truct
ura
l co
nto
ur
map
of
the
Jura
ssic
Toro
San
dst
one.
52
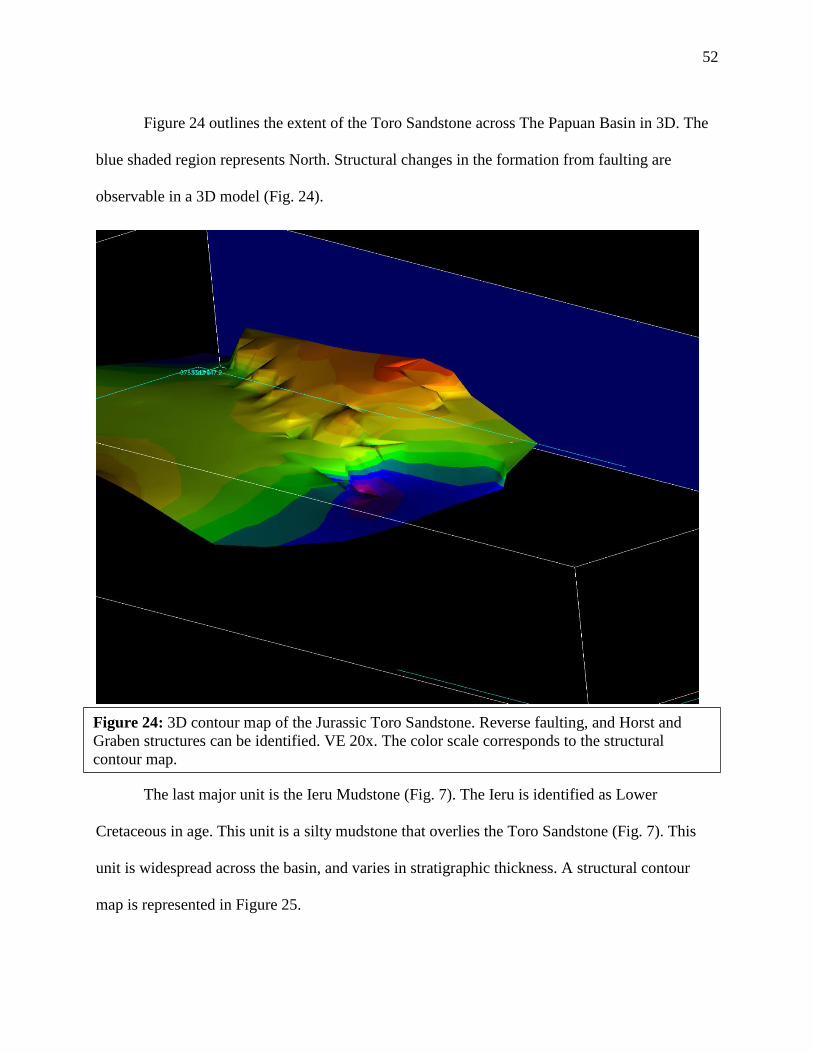
Figure 24 outlines the extent of the Toro Sandstone across The Papuan Basin in 3D. The
blue shaded region represents North. Structural changes in the formation from faulting are
observable in a 3D model (Fig. 24).
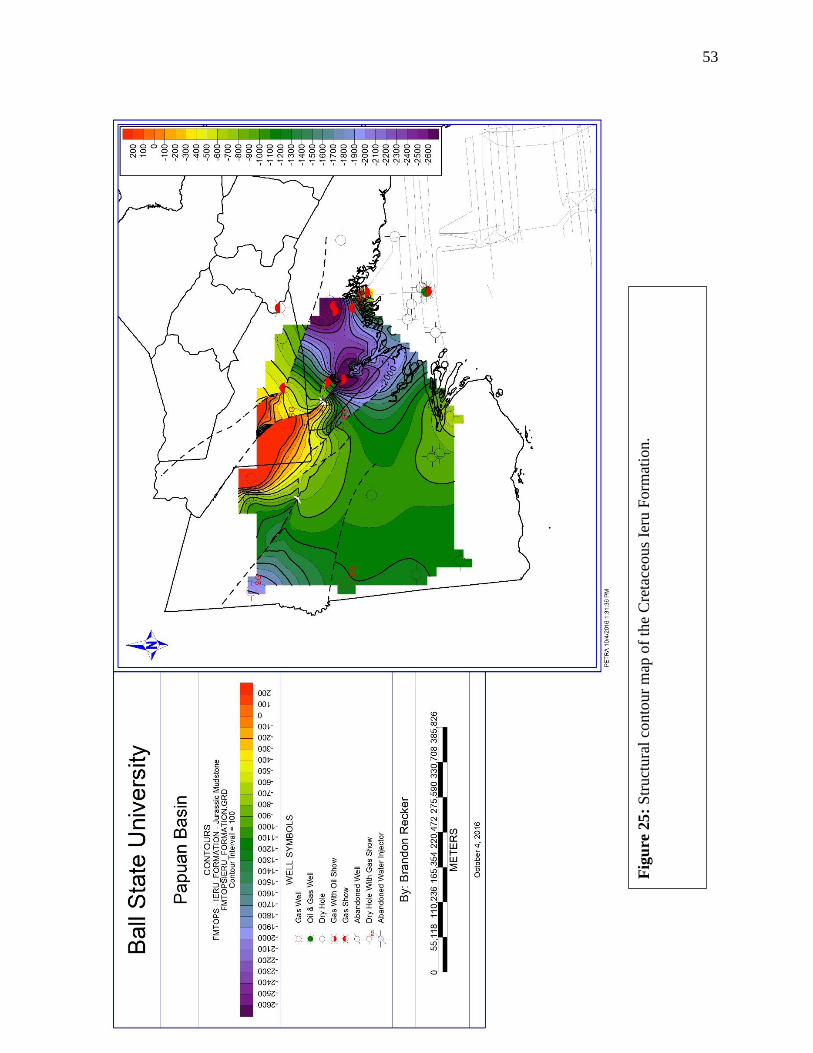
The last major unit is the Ieru Mudstone (Fig. 7). The Ieru is identified as Lower
Cretaceous in age. This unit is a silty mudstone that overlies the Toro Sandstone (Fig. 7). This
unit is widespread across the basin, and varies in stratigraphic thickness. A structural contour
map is represented in Figure 25.
Figure 24: 3D contour map of the Jurassic Toro Sandstone. Reverse faulting, and Horst and
Graben structures can be identified. VE 20x. The color scale corresponds to the structural
contour map.
53
Fig
ure
25
: S
truct
ura
l co
nto
ur
map
of
the
Cre
tace
ous
Ieru
Form
atio
n.
54
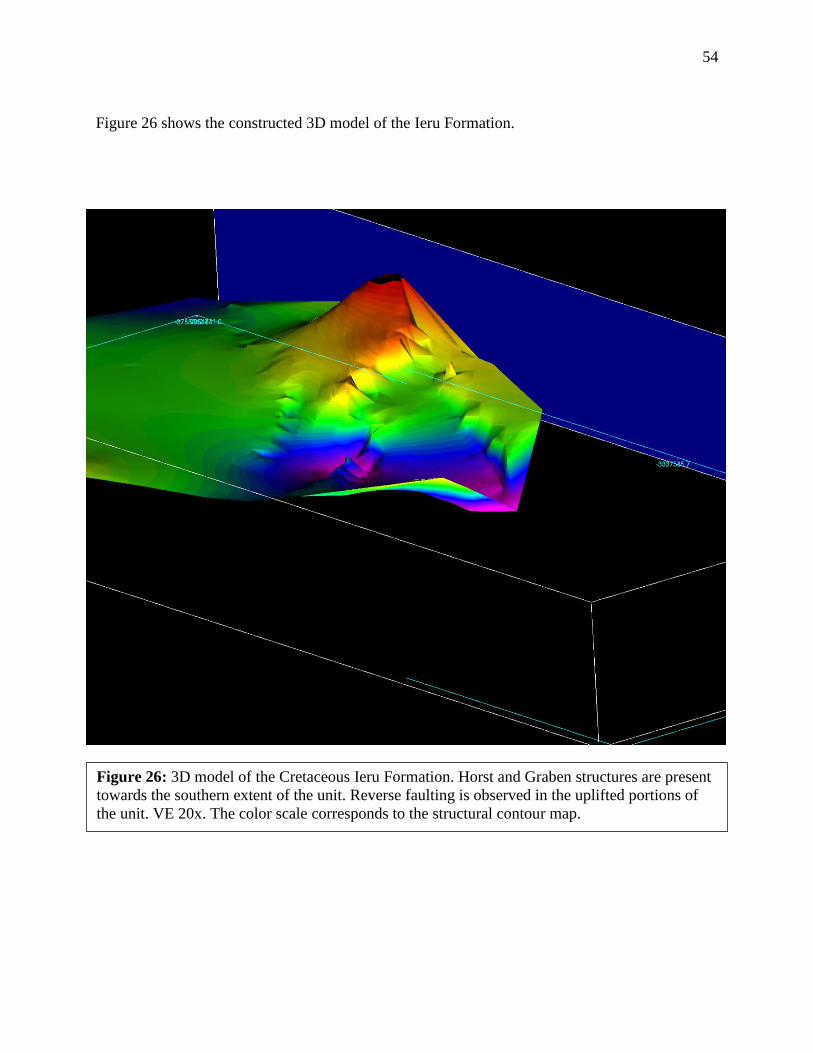
Figure 26 shows the constructed 3D model of the Ieru Formation.
Figure 26: 3D model of the Cretaceous Ieru Formation. Horst and Graben structures are present
towards the southern extent of the unit. Reverse faulting is observed in the uplifted portions of
the unit. VE 20x. The color scale corresponds to the structural contour map.

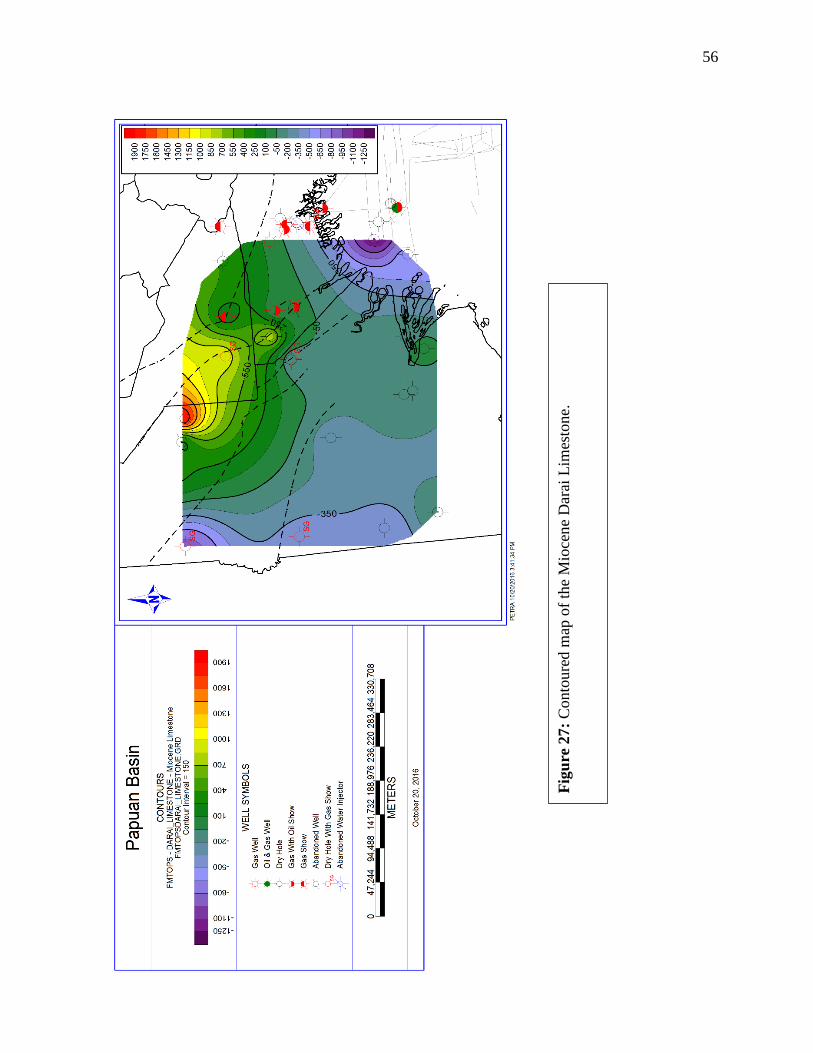
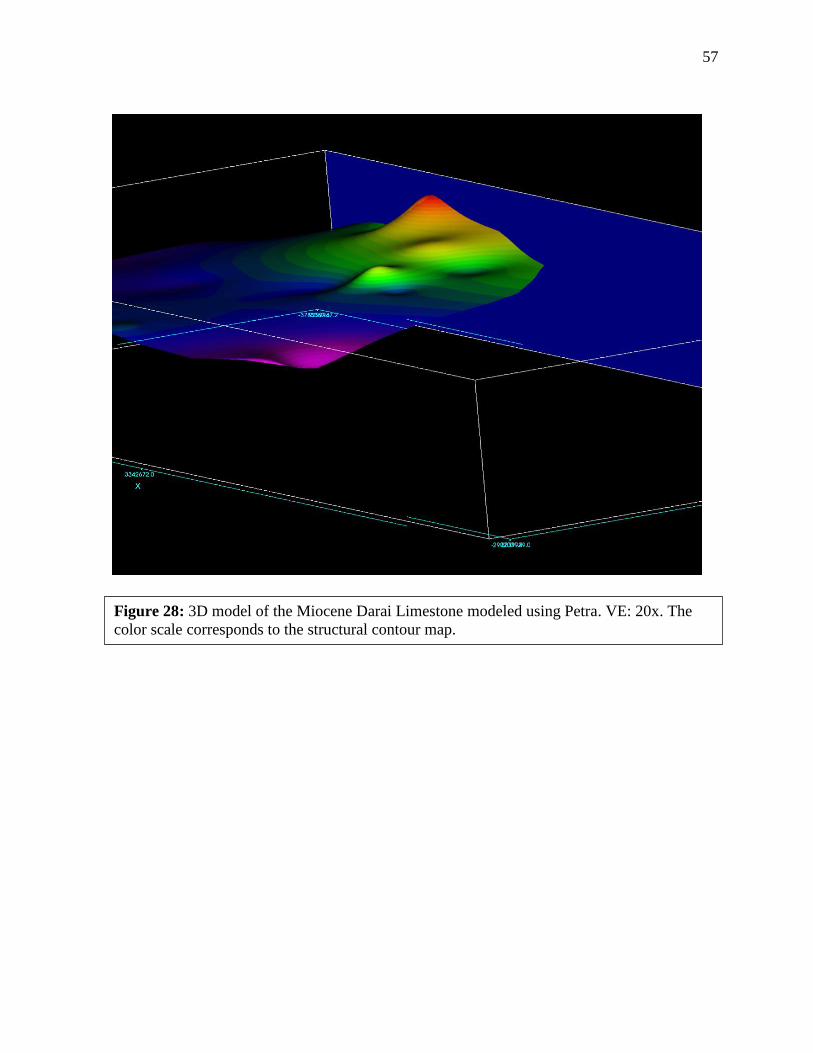
55
Miocene Carbonate Sourcing
The Darai back arc megasequence (Fig. 4) shows the timeframe for the deposition of the
Darai Limestone. A structural contour map of the Darai is represented in Figure 27, with the
corresponding 3D model in Figure 28. Careful examination of these 3D models allows us to
better visualize subsurface data.
56
Fig
ure
27
: C
onto
ure
d m
ap o
f th
e M
ioce
ne
Dar
ai L
imes
tone.
57
Figure 28: 3D model of the Miocene Darai Limestone modeled using Petra. VE: 20x. The
color scale corresponds to the structural contour map.

58
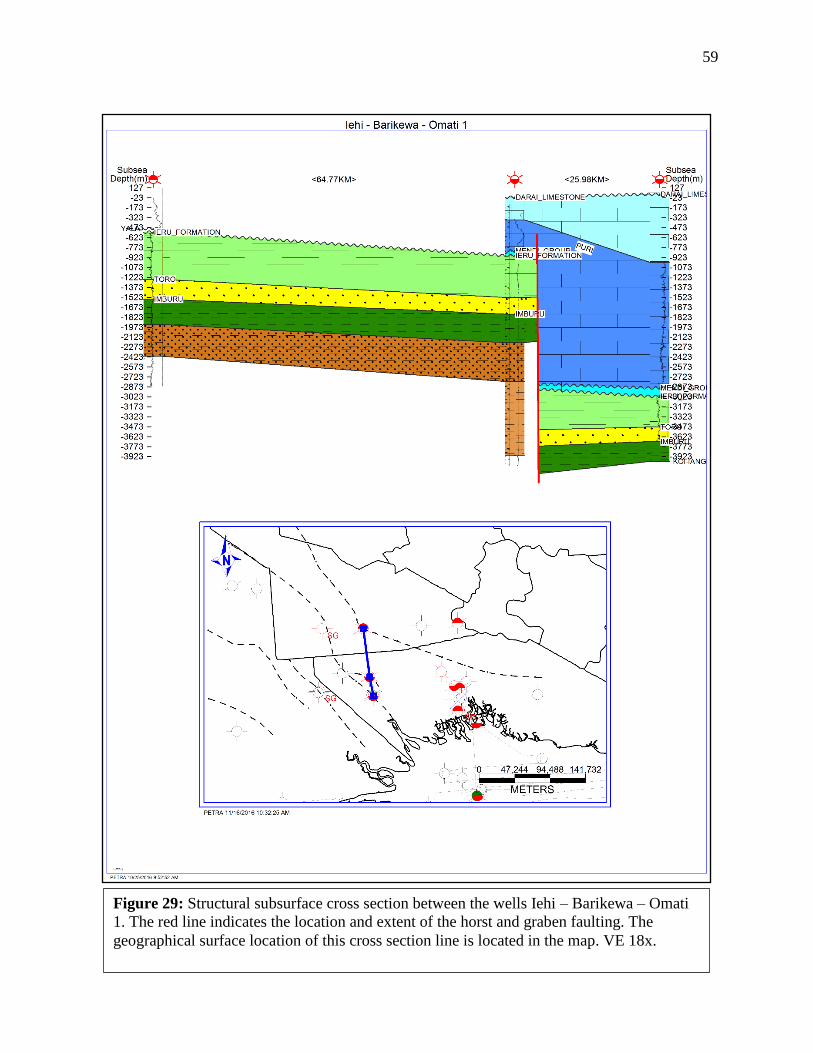
Structural Cross Sections
Horst and graben structures can be seen clearly in cross sections across the Papuan Basin.
Producing Jurassic units are located on the flanks of grabens, where faulting has displaced source
units. A cross section line from the Iehi, Barikewa, and Omati 1 wells shows a graben structure
(Figure 29) with roughly 1,900 meters of downward displacement. The Barikewa well is present
on the flank of the graben, and contains significant oil/condensate and gas production. Drilling
logs from the Hunt Database record production amounts for each well within the Papuan Basin.
Commercially viable gas was present in this well with flow rates of 2.5 million cubic meters per
day. Omati 1 is present in one of the deepest parts of the basin in a graben. Toro Sandstone
reservoirs are present in this well at depths of 3,433 meters. Initial gas shows in this well are
present at 3,532 meters with a gas brine located at a depth of 3,678 meters. Extractable oil was
also noted between 3,900 and 4,200 meters in the Imburu and Koi-Iange Mudstones. The Iehi
well, located on the horst, is producing gas at a rate of 32.6 million cubic feet per day
(MMCFD). Drill logs show that Iehi is structurally affected by a reverse fault at a depth of 3,900
meters.
59
Figure 29: Structural subsurface cross section between the wells Iehi – Barikewa – Omati
1. The red line indicates the location and extent of the horst and graben faulting. The
geographical surface location of this cross section line is located in the map. VE 18x.
60
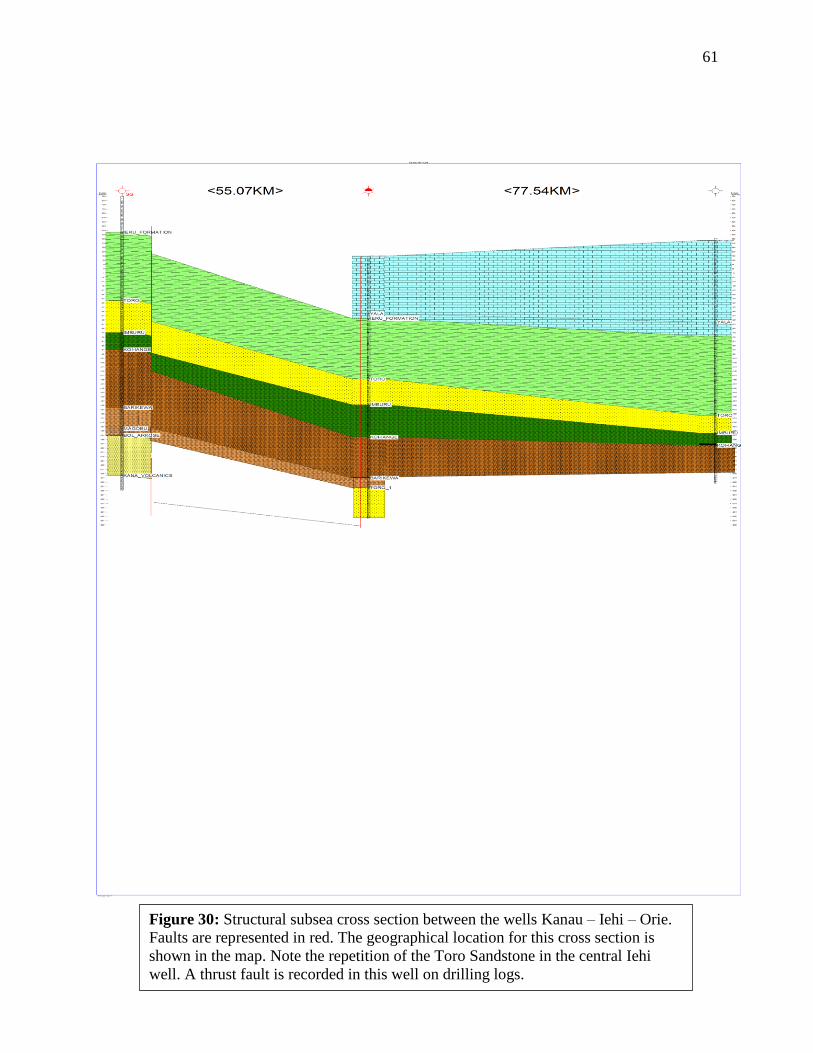
A subsurface structural cross section between Kanau – Iehi – and Orie was constructed in
Petra (Fig. 30). Extensional tectonics are observed in the cross section East of the Kanau well. A
thrust fault is identified in the Iehi well by the presence of repeated Jurassic units. This thrust
fault was reactivated from compressional flexing of the Papuan Basin. Inclination of the Iehi
fault is unknown, and is represented by a vertical fault line in cross sectional view. The repeated
Formation tops in the Iehi well are the Toro and Imburu at a depth of 2,715 meters. Precise age
dating of these repeated units is currently unknown. Dry gas was produced in the Iehi well
between depths of 1,439 and 1,473 meters at a rate of 132.6 MMCFD. The Orie well was drilled
to a depth of 2,411 meters, and had no hydrocarbon shows in the Jurassic units. Kanau has some
gas shows; however, this well sits on a structural basement high. The Toro and Imburu
Formations are present at depths shallower than 2,000 meters, with the exception of the repeated
Jurassic section in the Iehi well. The Iehi well terminates before intersecting the Imburu
Formation.
61
Figure 30: Structural subsea cross section between the wells Kanau – Iehi – Orie.
Faults are represented in red. The geographical location for this cross section is
shown in the map. Note the repetition of the Toro Sandstone in the central Iehi
well. A thrust fault is recorded in this well on drilling logs.
62
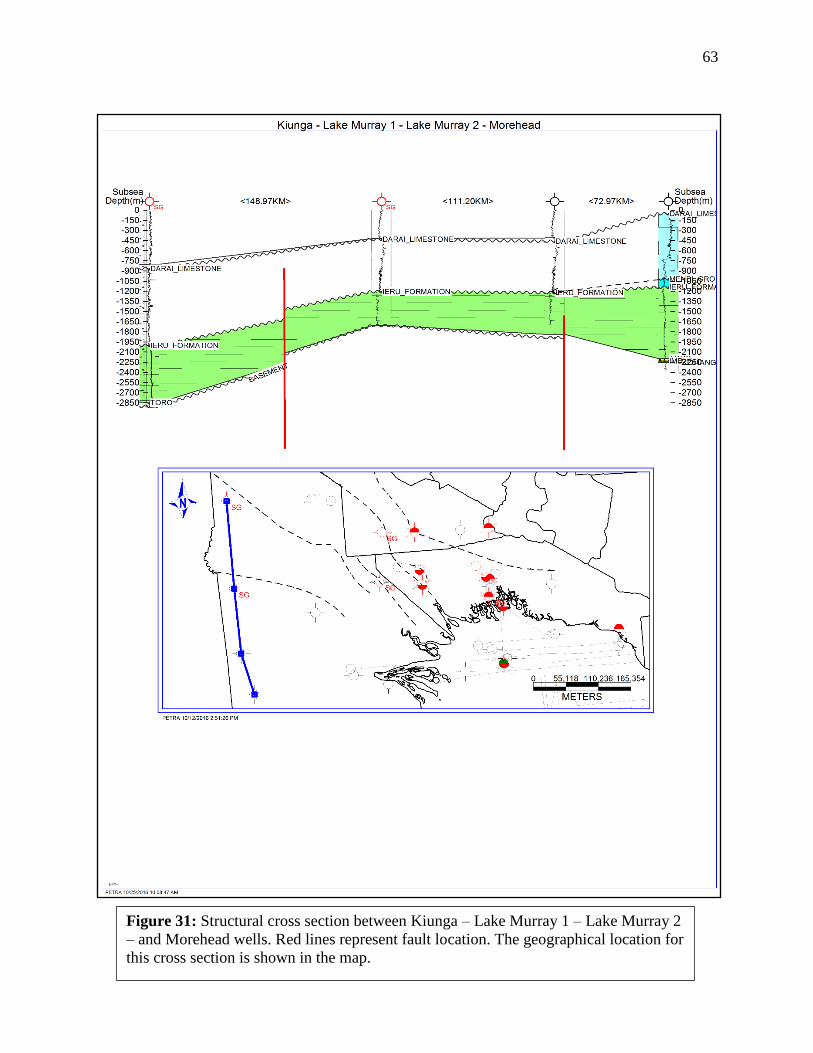
Located towards the Western portion of The Papuan Basin are the Kiunga, Lake Murray
1, Lake Murray 2, and Morehead wells. These wells are dry holes with no observed hydrocarbon
production. The cross section between each of these wells is depicted in Figure 31. Two major
basement involved faults are represented between these four wells based on surface mapping
conducted by the Commonwealth of Australia (Barndollar, 1993). The Jurassic units are
intersected only in the Morehead well and the Kiunga well. The Toro and Imburu units are less
than 50 meters thick in these two wells. Thick Eocene and Miocene carbonates overlay the
Cretaceous Ieru Formation. The Kiunga well was drilled on a seismically detected faulted
basement high. Drill tests of the Toro Sandstone in the Kiunga well detected salt water with
minor gas shows. Mesozoic sands in the Lake Murray 1 well had low permeability with minor
gas shows. Lake Murray 2 was drilled down flank of a basement high from Lake Murray 1. Fifty
meters of the Toro Sandstone was intersected at a depth of 1,875 meters yielding no hydrocarbon
production.
63
Figure 31: Structural cross section between Kiunga – Lake Murray 1 – Lake Murray 2
– and Morehead wells. Red lines represent fault location. The geographical location for
this cross section is shown in the map.

64
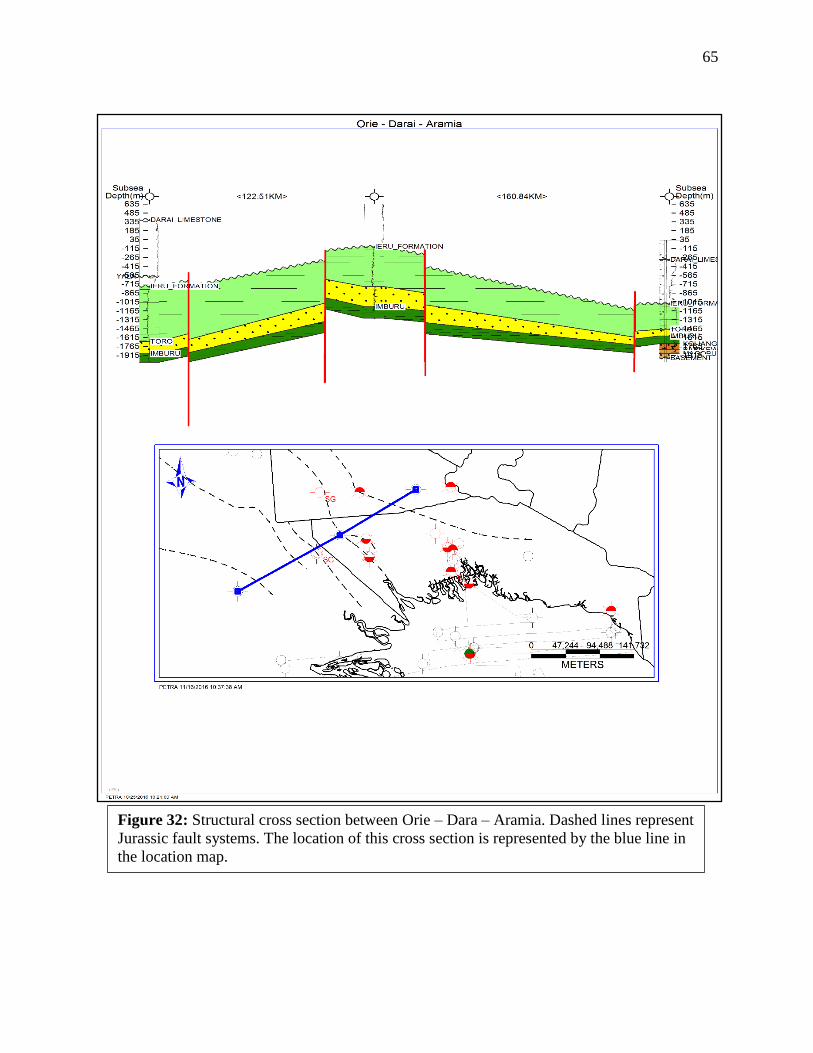
The cross section between the Orie, Darai, and Aramia wells depicts the subsurface
structure and stratigraphy (Fig. 32). This cross section ranges from SW to NE, and is 283.35
kilometers in length. Several major fault systems are intersected across Figure 32. The Toro and
Imburu Formations are present in each well at various depths less than 2,000 meters. No
significant hydrocarbon discoveries were made in any of these wells. The Orie well was drilled
to test a surface mapped anticline. Poorly developed Toro Sandstone reservoirs were encountered
in the Orie well. The Darai well encountered good Toro Sandstone reservoirs; however, the
reservoirs were partially flushed according to drilling logs. In Figure 32, the overlying Darai
Limestone unit is present in all three wells. The Eocene Yala Limestone is located only in the
Orie well.
65
Figure 32: Structural cross section between Orie – Dara – Aramia. Dashed lines represent
Jurassic fault systems. The location of this cross section is represented by the blue line in
the location map.

66
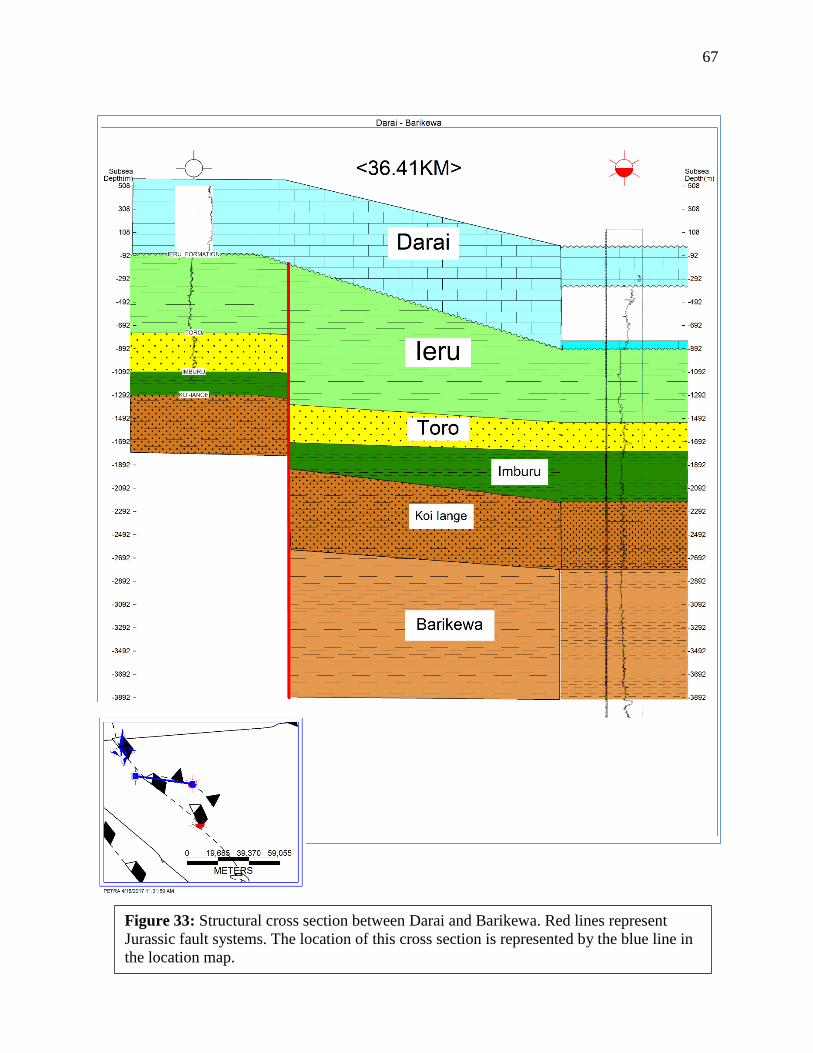
Figure 33 shows a structural cross section constructed between the Darai and Barikewa
wells. This cross-section crosses over an identified normal fault. The Barikewa well lies on the
downthrown block with a reverse fault located slightly east of the well location. Jurassic source
rocks, like the Imburu and Barikewa, are present in each of the wells. A displacement of ~700
meters is observed across the normal fault (Figure 33). The Imburu Formation is present at a
depth range of 1,700 to 2,100 meters, and the Barikewa Formation is at a depth of 2,700 to 3,900
meters. The Barikewa Formation was not intersected in the Darai well.
67
Figure 33: Structural cross section between Darai and Barikewa. Red lines represent
Jurassic fault systems. The location of this cross section is represented by the blue line in
the location map.

68
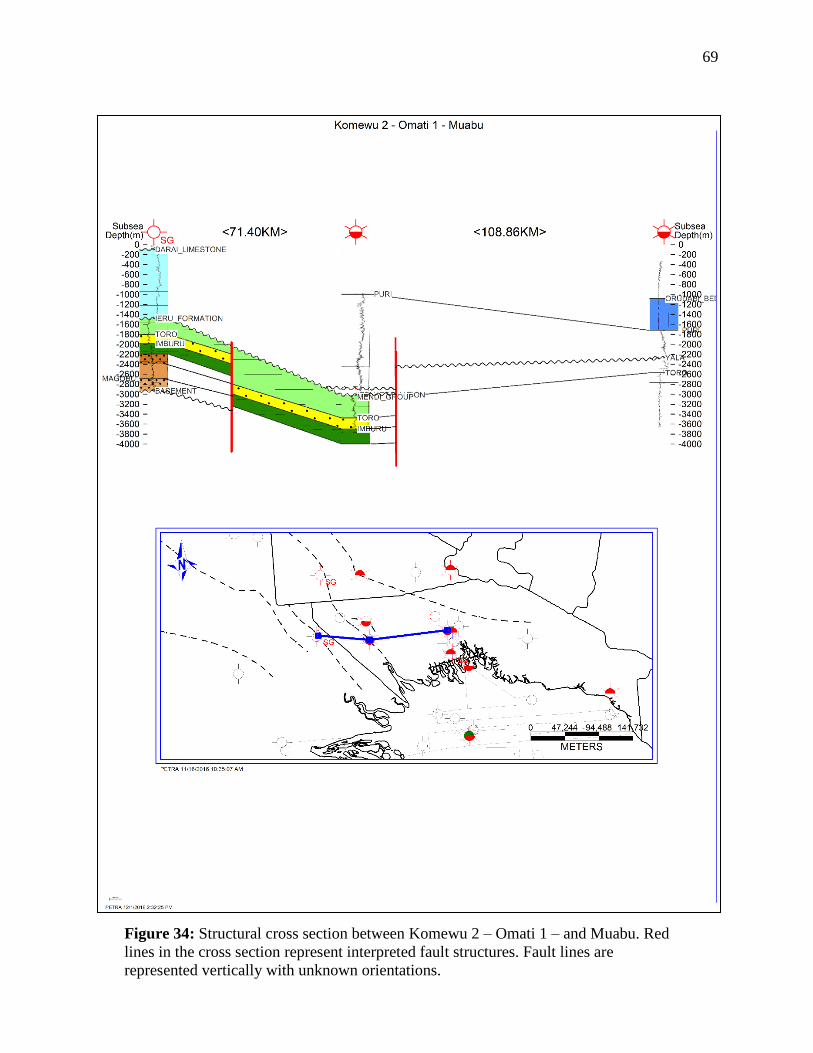
A cross section between Komewu 2, Omati 1, and Muabu is shown below in Figure 34.
Faults in this cross section are represented as vertical red lines due to the unknown orientation of
the faults. Figure 34 is orientated West to East along the Southern portion of the onshore Papuan
Basin. This cross section is situated across two structurally identified basement involved normal
faults.
The well Komewu 2 is drilled on the upthrown portion of one of the normal faults.
Komewu 2 contains minor gas shows. Omati 1 is situated in the deeper portion of the Papuan
Basin. Omati 1 has gas and condensate production that has been generated from the Jurassic and
Cretaceous Toro Sandstone at 3,670 meters. Omati 1 was drilled to a total depth of 4,734.5
meters.
Carbonate units in Omati 1 contain varying lithological characteristics. The Darai
Limestone is a fossiliferous, porous, calcareous limestone with partially dolomitized zones. The
Puri Limestone in this well is calcareous and dense with partially dolomitized zones with some
cherty beds. The only hydrocarbon production observed in any of the carbonate units in Figure
34 is located within the Muabu well. The Muabu well was drilled to a total depth of 3,666.3
meters.
69
Figure 34: Structural cross section between Komewu 2 – Omati 1 – and Muabu. Red
lines in the cross section represent interpreted fault structures. Fault lines are
represented vertically with unknown orientations.
70
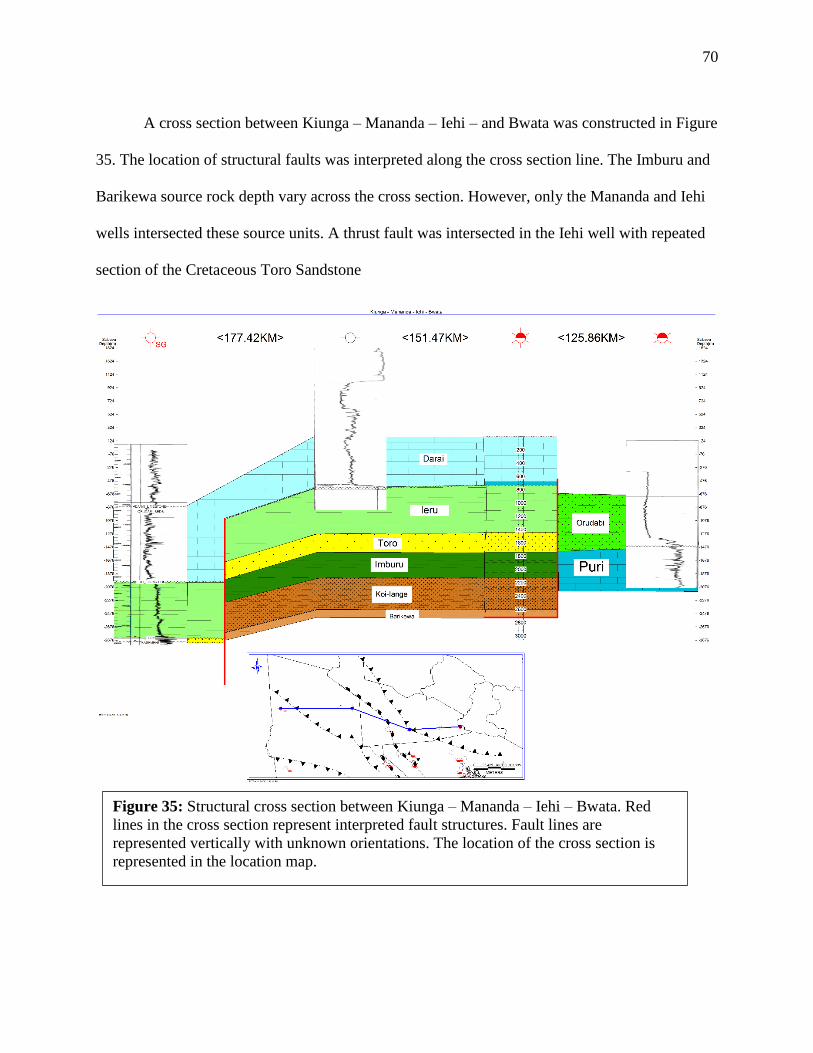
A cross section between Kiunga – Mananda – Iehi – and Bwata was constructed in Figure
35. The location of structural faults was interpreted along the cross section line. The Imburu and
Barikewa source rock depth vary across the cross section. However, only the Mananda and Iehi
wells intersected these source units. A thrust fault was intersected in the Iehi well with repeated
section of the Cretaceous Toro Sandstone
Figure 35: Structural cross section between Kiunga – Mananda – Iehi – Bwata. Red
lines in the cross section represent interpreted fault structures. Fault lines are
represented vertically with unknown orientations. The location of the cross section is
represented in the location map.
71
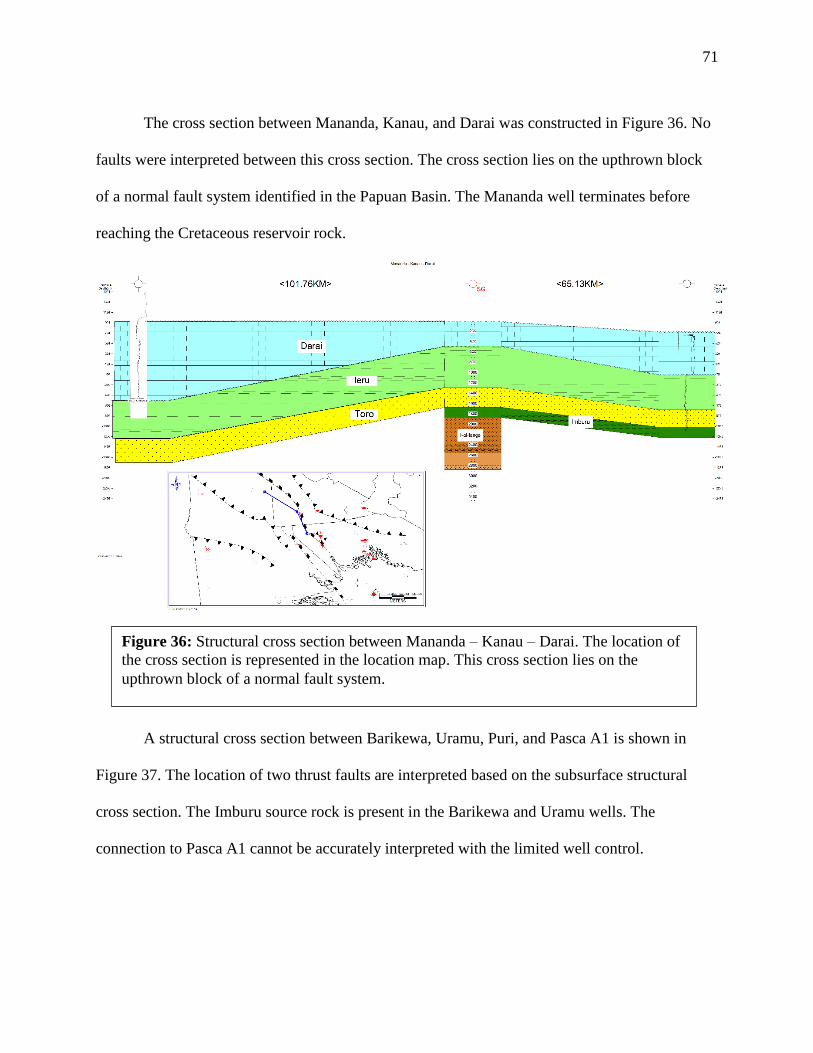
The cross section between Mananda, Kanau, and Darai was constructed in Figure 36. No
faults were interpreted between this cross section. The cross section lies on the upthrown block
of a normal fault system identified in the Papuan Basin. The Mananda well terminates before
reaching the Cretaceous reservoir rock.
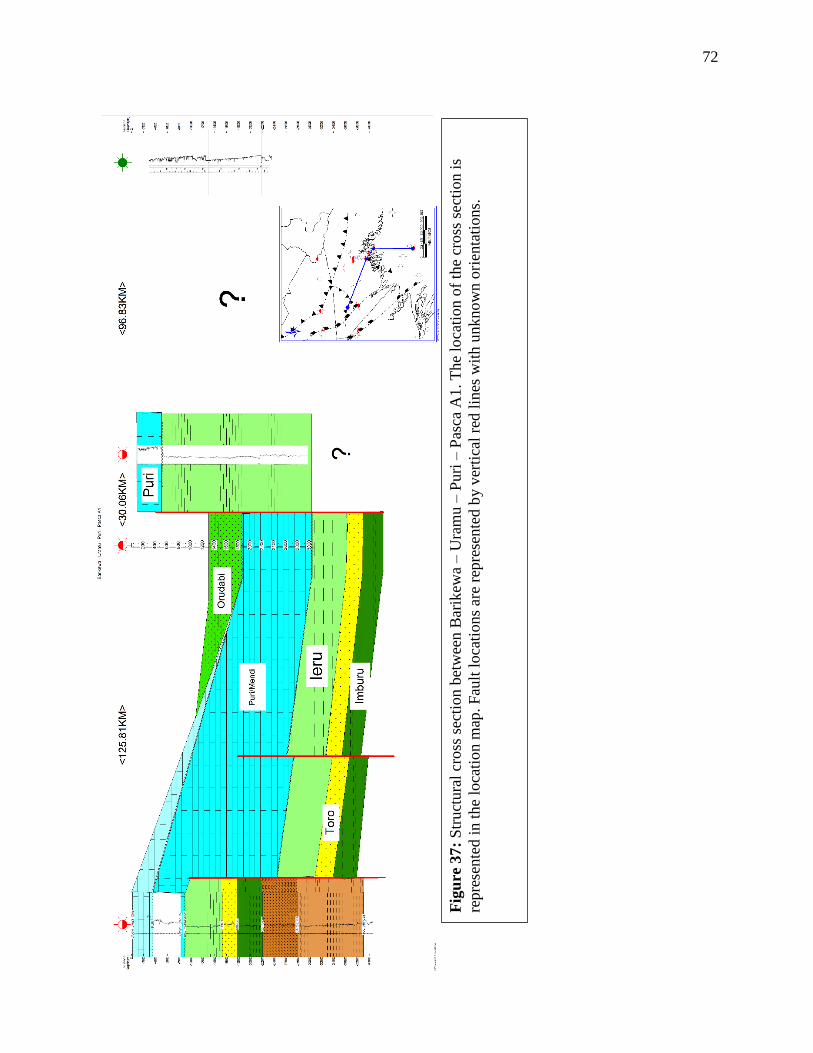
A structural cross section between Barikewa, Uramu, Puri, and Pasca A1 is shown in
Figure 37. The location of two thrust faults are interpreted based on the subsurface structural
cross section. The Imburu source rock is present in the Barikewa and Uramu wells. The
connection to Pasca A1 cannot be accurately interpreted with the limited well control.
Figure 36: Structural cross section between Mananda – Kanau – Darai. The location of
the cross section is represented in the location map. This cross section lies on the
upthrown block of a normal fault system.
72
Fig
ure
37
: S
truct
ura
l cr
oss
sec
tion b
etw
een B
arik
ewa
– U
ram
u –
Puri
– P
asca
A1. T
he
loca
tion o
f th
e cr
oss
sec
tion i
s
repre
sente
d i
n t
he
loca
tio
n m
ap. F
ault
loca
tions
are
repre
sente
d b
y v
erti
cal
red l
ines
wit
h u
nk
now
n o
rien
tati
ons.
73
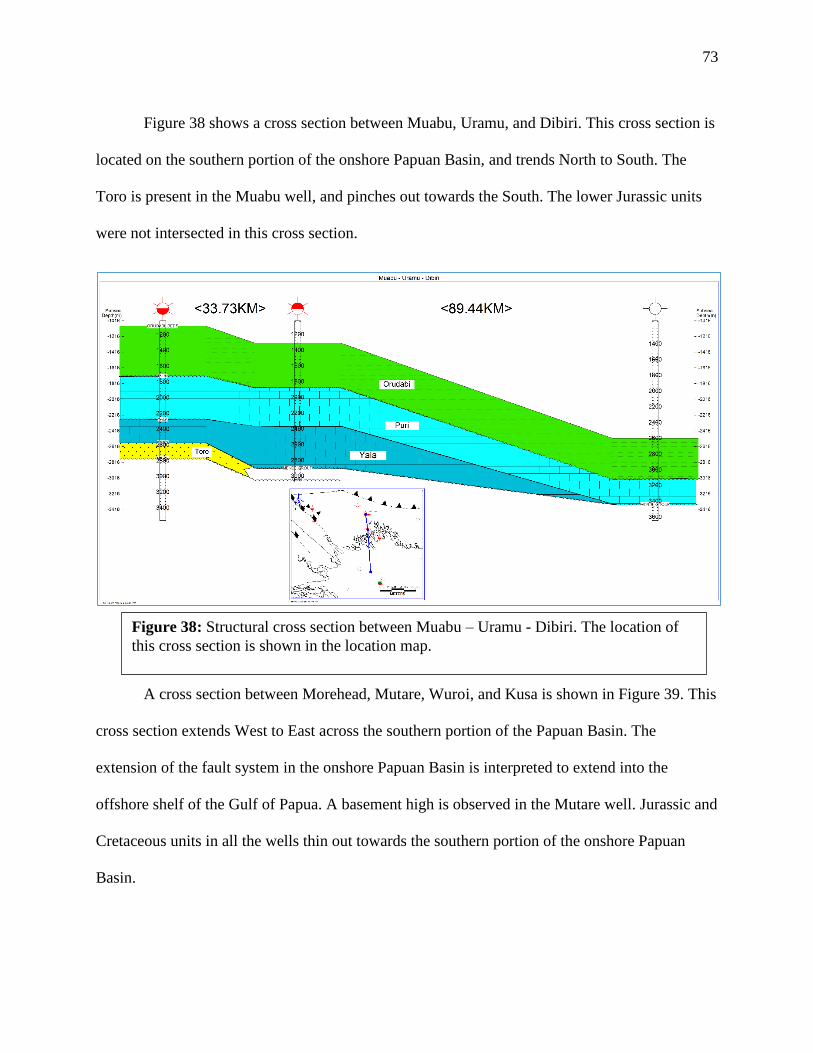
Figure 38 shows a cross section between Muabu, Uramu, and Dibiri. This cross section is
located on the southern portion of the onshore Papuan Basin, and trends North to South. The
Toro is present in the Muabu well, and pinches out towards the South. The lower Jurassic units
were not intersected in this cross section.
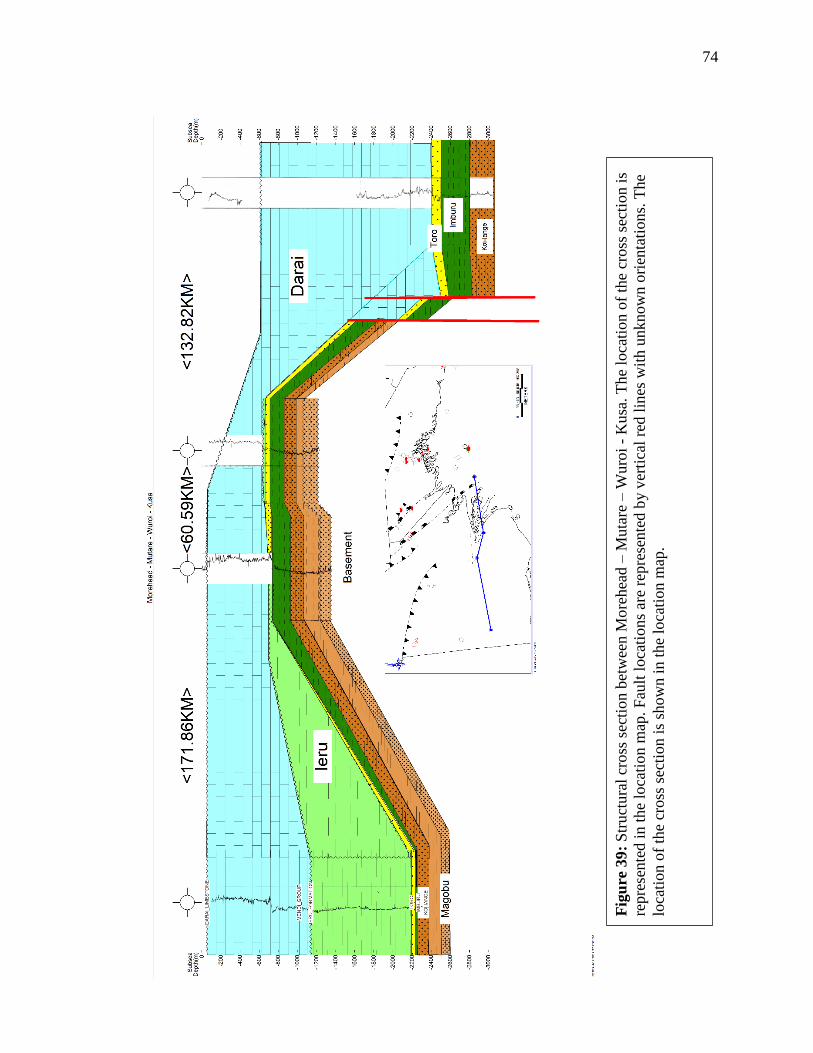
A cross section between Morehead, Mutare, Wuroi, and Kusa is shown in Figure 39. This
cross section extends West to East across the southern portion of the Papuan Basin. The
extension of the fault system in the onshore Papuan Basin is interpreted to extend into the
offshore shelf of the Gulf of Papua. A basement high is observed in the Mutare well. Jurassic and
Cretaceous units in all the wells thin out towards the southern portion of the onshore Papuan
Basin.
Figure 38: Structural cross section between Muabu – Uramu - Dibiri. The location of
this cross section is shown in the location map.
74
Fig
ure
39
: S
truct
ura
l cr
oss
sec
tion b
etw
een M
ore
hea
d –
Muta
re –
Wuro
i -
Kusa
. T
he
loca
tion o
f th
e cr
oss
sec
tion i
s
rep
rese
nte
d i
n t
he
loca
tio
n m
ap.
Fau
lt l
oca
tions
are
repre
sente
d b
y v
erti
cal
red l
ines
wit
h u
nk
now
n o
rien
tati
on
s. T
he
loca
tion o
f th
e cr
oss
sec
tion i
s sh
ow
n i
n t
he
loca
tion m
ap.
75
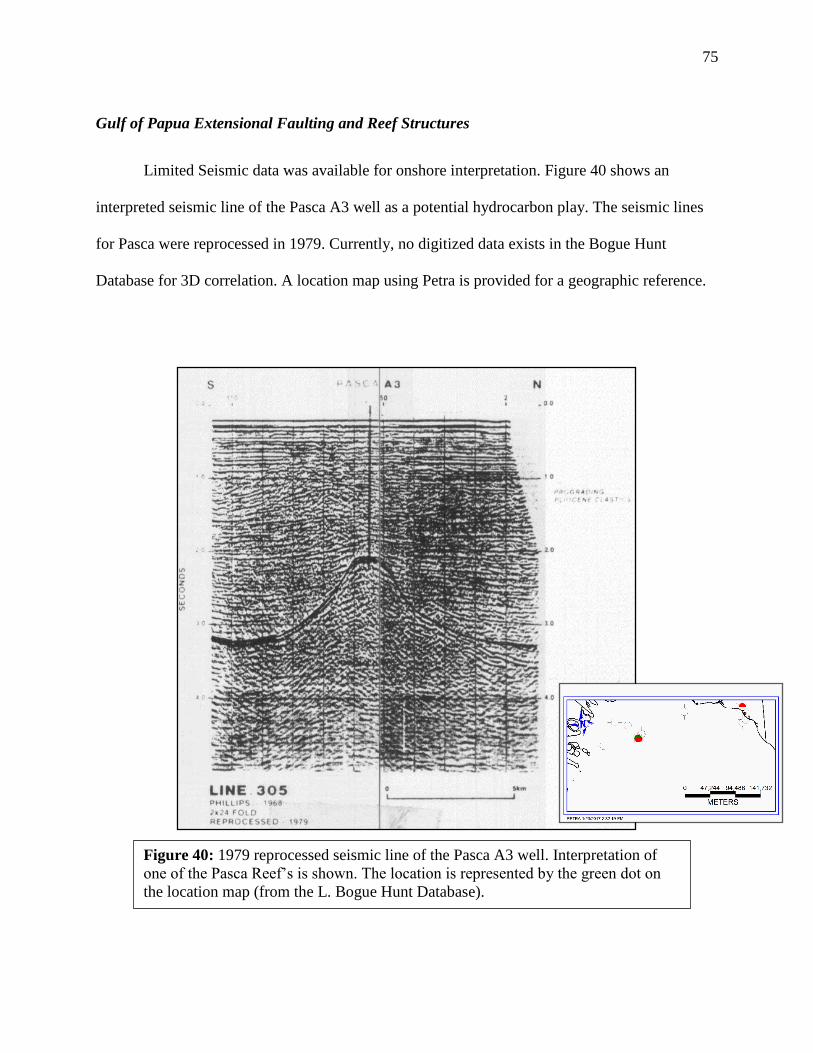
Gulf of Papua Extensional Faulting and Reef Structures
Limited Seismic data was available for onshore interpretation. Figure 40 shows an
interpreted seismic line of the Pasca A3 well as a potential hydrocarbon play. The seismic lines
for Pasca were reprocessed in 1979. Currently, no digitized data exists in the Bogue Hunt
Database for 3D correlation. A location map using Petra is provided for a geographic reference.
Figure 40: 1979 reprocessed seismic line of the Pasca A3 well. Interpretation of
one of the Pasca Reef’s is shown. The location is represented by the green dot on
the location map (from the L. Bogue Hunt Database).
76
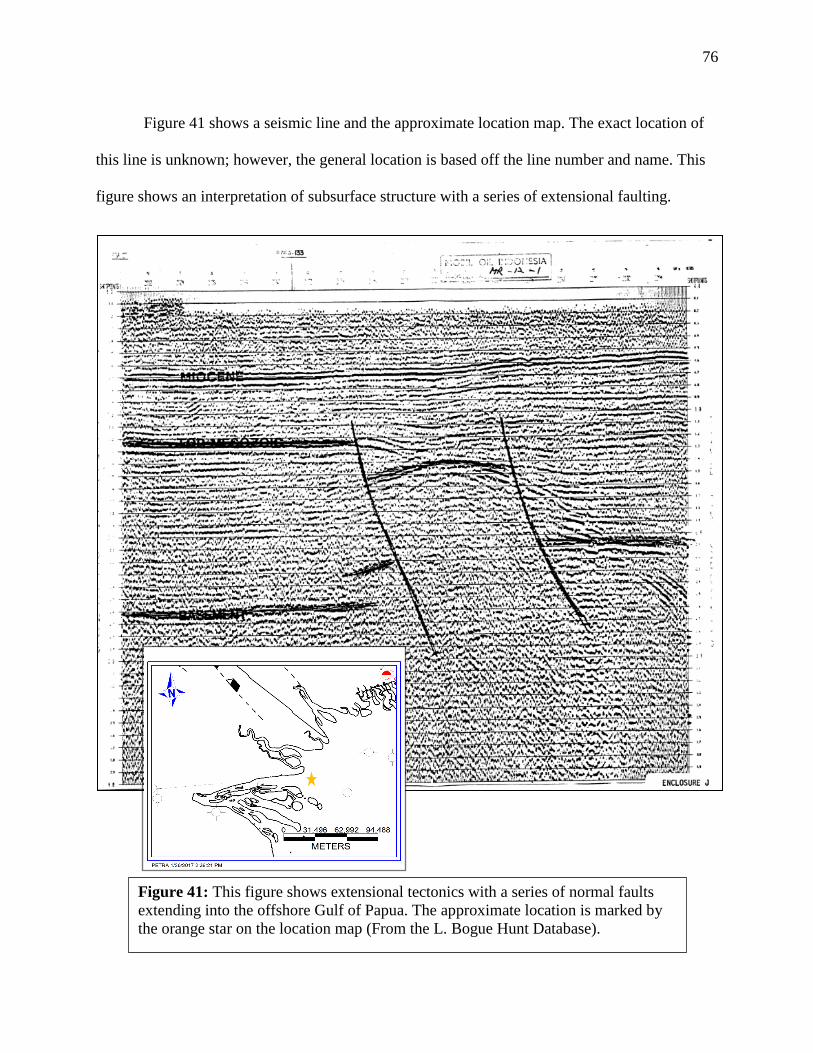
Figure 41 shows a seismic line and the approximate location map. The exact location of
this line is unknown; however, the general location is based off the line number and name. This
figure shows an interpretation of subsurface structure with a series of extensional faulting.
Figure 41: This figure shows extensional tectonics with a series of normal faults
extending into the offshore Gulf of Papua. The approximate location is marked by
the orange star on the location map (From the L. Bogue Hunt Database).

77
DISCUSSION
A limited understanding of the structural and stratigraphic controls on the basin has
hindered current exploration progress. A constructed depth to basement map (Fig. 11) indicates
that the majority of producing wells are located within the deeper parts of the basin. Drilling logs
suggest that the Jurassic-Cretaceous units in the Papuan Basin have a limited production
potential at depths shallower than 2,000 meters due to the lack of production in these wells. This
depth is calculated using limited data; however, this depth may provide one plausible explanation
for the numerous dry holes in the Papuan Basin. Graben structures in the basin have been able to
reach the necessary depth for hydrocarbon generation (Fig. 24, 26, 29, 34). However, migration
of oil and gas, particularly in zones affected by complex compressional tectonics, may have
migrated hydrocarbons to shallower depths. Evidence of this can be seen in the Iehi Well (Fig.
30), by the lack of production in the repeated Jurassic units at the base of the well. Limited core
data throughout the basin places a reliance on wireline log data. In most cases, this data is almost
used exclusively to infer depositional, lithological, and structural characteristics. Well-log data
and previous literature in the basin (Barndollar 1993; Buchanan and Warburton 1996; Gordon et
al. 2000; McConachie and Lanzilli, 2000), suggests that the Lower Jurassic Imburu Formation is
one of the major hydrocarbon source units for the basin (Figure 21). The Imburu Formation
consists of a grey to dark grey, fine grained mudstone. Bioturbated argillaceous laminae and
glauconitic peloids are also common within the Imburu (Boult, 1993). Drill logs from the Hunt
Database suggest that deeper Jurassic mudstones, like the Barikewa (Fig. 16), may also be a
potential source unit in deeper parts of the basin. However, very few wells in the basin intersect
this Formation.
78
Above the Jurassic Mudstones lies a Late Jurassic to Early Cretaceous Sandstone
reservoir named the Toro Sandstone. Currently, the Toro Sandstone is a major target Formation
for oil and gas exploration in the Eastern Papuan Fold Belt (Gordon, Huizinga and Sublette,
2000). Wells located in the Papuan Basin show the Toro Formation as a promising reservoir.
However, lateral differences in argillaceous content may impact reservoir quality and production
potential from location to location (Hirst and Price, 1996). Detailed well and lithological testing
must be completed to evaluate the reservoir potential of this unit at various locations.
Above the Toro reservoir lies a potential seal rock for hydrocarbon systems in the Papuan
Basin. The Ieru Formation is a late Berriasian glauconitic siltstone, with interbedded mudstones,
and argillaceous sandstones. This unit represents an overall transgression after deposition of the
Toro Sandstone. The Ieru is inferred to have deposited in a shelf environment (Phelps and
Denison, 1993). The extent of the Ieru is modeled in Figure 26. This study identified the top of
the Ieru in constructed cross sections as an unconformity. The time gap between the Ieru and the
overlying carbonates are represented in Figure 7. The 3D model of the Ieru (Fig. 25) shows a
continuous abundant unit across the basin. Barndollar (1993) has shown that the Ieru seal
integrity was well maintained in the Iamara-1 well after undergoing erosion and folding. This
suggests that the Ieru seal is capable of trapping hydrocarbons while undergoing intense
deformation due to regional tectonic forces. Drill logs throughout the basin show thick
correlative sequences of the Ieru. Evidence for oil and gas migration during regional tectonic
pulses is well documented through previous literature throughout the Papuan basin (Home et al.
1990; Barndollar 1993; Waples and Wulff, 1996). As a result of deformation and folding,
hydrocarbon accumulation in heavily folded regions is highly plausible. However, dry test wells

79
indicate that not every structurally closed trap contains hydrocarbon accumulations. Thus, it is
important to fully understand the timing of fluid migration within the basin.
Hydrocarbon Trap Modeling: Structural Cross Sections and PETRA Modeling
Various cross sections were modeled across the Papuan Basin during this study. With the
absence of abundant well log data, interpretations between wells have proven difficult. Figure 34
shows a constructed cross section across the Jurassic sourced rift play (Fig. 3). Thick skinned
deformation is identified within this rift complex, and is a common structural feature across the
Papuan Basin. The Omati 1 well lies within an identified rift zone where siliciclastic deposition
took place during the Early Jurassic. Graben features and basement lows provided the necessary
depth for hydrocarbon generation. Future identification of Horst and Graben structures within the
Papuan Basin may be potential target locations for future commercial development. Another
constructed cross section, with a large normal fault between the Barikewa and Omati 1 faults, is
represented in Figure 29. This figure displays a North to South trending cross section. The
normal fault between the Barikewa and Omati wells has a downward displacement of
approximately 1,875 meters. Drill logs from both wells in this cross section (Fig. 29), show
extractable gas and brine from the Toro and Imburu Formations. Another modeled cross section
that trends from Northeast to Southwest in the Papuan Basin is shown in Figure 32. Various
compressional and extensional faults are interpreted between the Orie, Darai, and Aramia wells.
However, without detailed well control, the orientation of each of these faults is unknown in the
subsurface. Overall, these 3 wells are identified as dry hole wells with no hydrocarbon
production. In each of these wells, the Jurassic and Cretaceous source units are at a relatively
80
shallow depth with no structural trap. No graben or basement low at a depth greater than 2,000
meters is present around these locations. As a result, these wells remain dry due to a lack of a
generative source. A comprehensive dry hole analysis was constructed for each of the wells in
the Papuan Basin in Appendix A.
Jurassic Sourced Rift Play
Basinal rifting has led to development of a series of Horst and Graben structures in the
Southwest portion of the basin (Fig. 3). The Jurassic rift play strikes NW to SE, and extends into
the offshore Gulf of Papua. This study has shown evidence of this rift systems extension into the
offshore (Fig. 41). The modeled depth to basement top indicates that the South Central portion of
the onshore basin contains the thickest sedimentary sequences (Fig. 9). John, (1970), noted that
at least 7,000 meters of Mesozoic sediments were deposited between the Aure Trough and West
Irian. Maximum development of sedimentation took place in the Southern Highlands area (John,
1970). In this study, a strong correlation has been observed in the Papuan Basin between
sediment thickness and hydrocarbon productivity for various wells (Fig. 11). The constructed
structural contour map of the depth to basement rock shows the majority of productive wells are
located in the deepest portion of the basin. This boundary shows the deepening trend of
overlying siliciclastic material throughout the Papuan basin. As a result, we would expect greater
source potential in this location (Fig. 11). The illustrated well symbols (Table 1) on Figure 11,
shows seven producing wells at depths greater than 2,000 meters. Each of these wells are located
in close proximity to an identified graben. Due to an over-mature marine sourcing for
hydrocarbons, the basin tends to generate more gas than oil (Gordon, Huizinga and Sublette,
2000). As a comparison, the Papuan Fold Belt to the East can mature organic kerogen’s
81
deposited post Jurassic, due to thicker sedimentary sequences than those found in the Papuan
Basin.
Rift structures in the Papuan Basin are identified zones in this study where hydrocarbon
generation is possible within Jurassic units. Cross sections modeled across the basin illustrate
these rift structures (Fig. 29, 30, 34). However, due to limited data, various trap models cannot
be accurately identified. Downward displacement of Jurassic and Cretaceous source rocks during
rifting resulted in the generation and accumulation of hydrocarbons following structural closure
(Gordon, Huizinga and Sublette, 2000). Graben structures (Fig. 29) may represent important
locations for hydrocarbon generation. Current exploration of major rift zones has primarily taken
place in the Fly River Area in Western Papua (Fig. 6). The Magobu Island No. 1 well is located
on the Southwestern flank of the Papuan Basin. This location sits on an identified basement high
(Fig. 6), where Tertiary and Mesozoic units pinch out towards the South. Only minor traces of
hydrocarbons have been encountered in this area. According to drilling reports, large anticlinal
structures, identified from seismic, were the primary target of Magobu Island No. 1 well.
Conybeare and Jessop (1972), postulated that the anticlinal trend coincided with an intra-
Mesozoic strand line developing into large lenticular sand units (Conybeare and Jessop, 1972).
The Lower Cretaceous Toro Sandstone in Magobu Island No. 1 is present at a depth of 1,300
meters (Fig. 24). While structural closure of this system may have taken place, the system did
not enter the oil/gas window due to the shallow depth of the Imburu source rock. However,
stratigraphically this system has all the necessary requirements for hydrocarbon accumulation.
This study averaged production depths in wells across the Papuan Basin, and found an average
production depth of 2,054 meters. Ahmed et al. (2012) recorded oil samples from 12 wells in the
Papuan Basin. Using data gathered by Ahmed et al. (2012), an average depth of 2,200 meters
82
was calculated (Volk et al. 2005; Ahmed et al. 2012). These findings coincide with depth
observations observed in this study, and provide a plausible explanation for the productive well
trend in the deeper parts of the basin.
Triassic basement involved grabens, like those observed in Figure 29, offer the best
hydrocarbon production potential in the marine and slope facies of Jurassic sediments
(Barndollar, 1993). Large graben complexes can be found in the southwestern onshore Papuan
Basin that developed during periods of rifting (Fig. 29). The cross section (Fig. 32) shows the
structural change across the basin as a result of regional rifting. A basement involved normal
fault is interpreted to lie between the wells Komewu 2 and Omati 1. This normal fault is an
extension of the Aramia Graben Complex (Fig. 6), which extends into the offshore Gulf of Papua
(Fig. 41). This study indicates through drilling logs that roughly 500 meters of downward
displacement is recorded in this normal fault system. The Jurassic Imburu Formation reaches a
maximum depth of approximately 3,500 meters at the base of this graben (Fig. 22). Drilling logs
indicate shows of extractable oil; however, exact values are unknown. Hydrocarbons generated
within this graben will have migrated up the fault plane into overlying traps (Fig. 42). The
presence of extractable oil within this graben (Fig. 22), suggests incomplete fluid migration. A
poor understanding of oil migration throughout the Papuan Basin may explain why this region is
still a frontier basin.
Jurassic Sourced Thrust Play
In addition to rifting, two main phases of uplift and erosion have been documented in the
Papuan Basin (Earnshaw et al. 1993). These two compressional phases have trapped
hydrocarbons that accumulated deep within the Papuan Basin. Jurassic sourced thrust plays are
83
found along the Northwestern portion of the onshore basin (Fig. 3). This thrust play strikes NW-
SE, and intersects several drilled test wells in the basin. The first phase of uplift took place
during the Late Cretaceous as a response to rifting of the Coral Sea (Davies and Smith, 1971;
Earnshaw et al. 1993). The second rifting phase took place during the Pliocene from collisional
tectonics (Earnshaw et al. 1993). Hill et al. (1991) suggested that oil generation and migration
took place during the Late Cretaceous within thick Mesozoic sequences (Earnshaw et al. 1993).
Gordon et al. (2000) suggested that oil generation took place during two distinct phases; the Late
Cretaceous, and Late Cenozoic. The first phase would have taken place immediately following
the structural closure of the Jurassic/Cretaceous hydrocarbon systems.
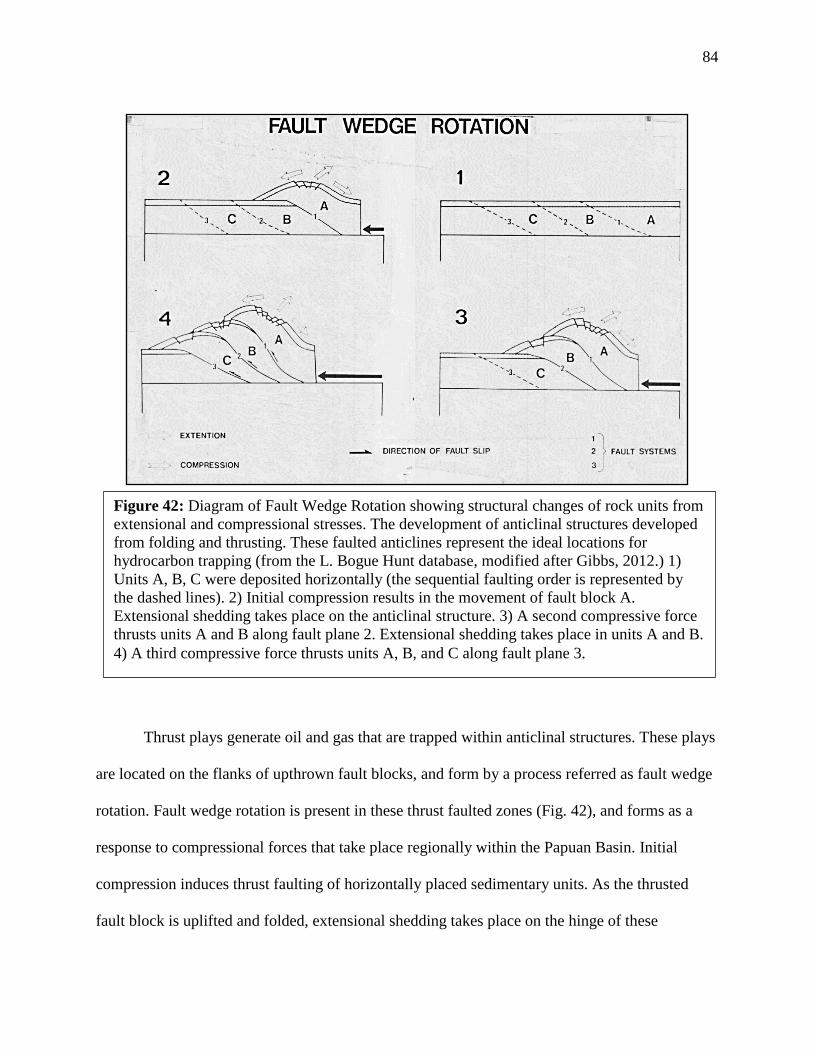
84
Thrust plays generate oil and gas that are trapped within anticlinal structures. These plays
are located on the flanks of upthrown fault blocks, and form by a process referred as fault wedge
rotation. Fault wedge rotation is present in these thrust faulted zones (Fig. 42), and forms as a
response to compressional forces that take place regionally within the Papuan Basin. Initial
compression induces thrust faulting of horizontally placed sedimentary units. As the thrusted
fault block is uplifted and folded, extensional shedding takes place on the hinge of these
Figure 42: Diagram of Fault Wedge Rotation showing structural changes of rock units from
extensional and compressional stresses. The development of anticlinal structures developed
from folding and thrusting. These faulted anticlines represent the ideal locations for
hydrocarbon trapping (from the L. Bogue Hunt database, modified after Gibbs, 2012.) 1)
Units A, B, C were deposited horizontally (the sequential faulting order is represented by
the dashed lines). 2) Initial compression results in the movement of fault block A.
Extensional shedding takes place on the anticlinal structure. 3) A second compressive force
thrusts units A and B along fault plane 2. Extensional shedding takes place in units A and B.
4) A third compressive force thrusts units A, B, and C along fault plane 3.

85
anticlinal structures. Anticlines within the basin have been seismically mapped by various
petroleum companies as potential prospects. Commercially drilled wells along this zone have
shown promising results for reservoir development.
A major thrust fault has been identified in the Iehi Well (Fig. 30). Repeated Cretaceous
and Jurassic sections were observed in this well from drilling logs. Dry gas was produced in the
Iehi well between the depths of 1,439 and 1,473 meters. Faulting may have allowed for gas
migration in this well. The repeated Toro Sandstone is measured at a depth of 2,650 meters (Fig.
30). The Cretaceous Ieru seal unit was not repeated in this well, and the thrust fault in the Iehi
well is believed to be a reactivated normal fault due to compressional tectonics. Oil and gas
accumulation within trap zones develop because of migration pathways generated by these fault
planes. Reverse and thrust faulting within the Papuan Basin would have taken place after initial
hydrocarbon generation within grabens. This scenario implies a deeper generation and
maturation of oil in this part of the basin (>2,000 meters). Graben structures would have dropped
down the Jurassic units to a deep enough depth to become thermally mature. Barikewa 1 (Fig.
29), a neighboring well drilled to a total depth of 4,233.7 meters, intersects the Lower Jurassic
Bol Arkose Sandstone at a depth of 4,050 meters. However, no hydrocarbons were observed at
this depth during drilling. The Barikewa 1 well is one of the deepest drilled wells in the Papuan
Basin, and sits within an identified graben (Fig. 29). The Barikewa 1 well terminates before
reaching basement rock. Oil and gas migration from this depth may have been possible from
pulses of compressional tectonics impacting this region. As a result, oil and gas would have
migrated upwards towards structural anticlines, and productivity of this well may be limited by
this migration event.

86
A modeled cross section trending north to south on the western portion of the foreland
basin is represented in Figure 31. A structural basement high is located along the Kiunga 1, Lake
Murray 1, and Lake Murray 2 wells. The Kiunga 1 well is located within the Jurassic Thrust Play
(Fig. 3); however, only minor gas shows are recorded in Miocene carbonates. The Jurassic and
Cretaceous units in this cross section thin out, and are present at a depth shallower than 2,000
meters. This depth is too shallow for any hydrocarbon maturation, and the Toro reservoir is not
thick enough to support production. A modeled isopach map of the Toro demonstrating this trend
is shown in Figure 21.
Tertiary Gas-Condensate Play
The final hydrocarbon play, shown in Figure 3, is a Tertiary gas – condensate play. This
play is located in the central Gulf of Papua. Eocene and Miocene carbonates, such as the Darai
limestones (Fig. 28), are target Formations for current hydrocarbon exploration. Miocene reef
limestones in the Gulf of Papua were first discovered by seismic surveys conducted in the region
by Phillips Petroleum (Durkee, 1990). Currently, the Pasca well is the only commercially
producing offshore well. The Pasca Reef is intersected in this well at a depth of 2,200 meters.
Over 1,000 barrels per day (BPD) are currently producing from the Miocene reef zone. Between
the depths of 2,467- 2,502 meters is a commercially viable zone for gas production. An
interpreted seismic line of the Pasca Reef complex is shown in Figure 40. Similar reef structures
discovered in the Gulf of Papua have yet to be developed.
Similar drill tests in the Gulf of Papua have proven that large Miocene barrier reef trends
exist. The Pasca Wells were drilled on an uplifted pre-Tertiary block, and represent a reef
pinnacle located on a basement high (Durkee, 1990). Other drilled wells such as Borabi 1,
87
Uramu 1, are all drilled on identified reef trends. The entire Pasca Reef trend in the Gulf of
Papua is seismically shown in Figure 40. This reef system is recognized worldwide as a major
Northeast trending reef system (Durkee, 1990). The Borabi 1 well was the first drilled offshore
well in 1967 (Jablonski et al. 2006). Borabi 1 initially tested this Miocene barrier reef; however,
it was drilled off structure and lost drilling circulation (Jablonski et al. 2006). As a result, no
production was recorded in this well. Enhancements in seismic imaging may allow for a
productive Borabi 1 well if re-drilled. The second well drilled in this region was Uramu 1 in
1968. Uramu 1 encountered gas shows in the Uramu Reef Complex. The following test well,
Uramu 1a, was abandoned during the drilling processes from high gas pressure within the
Formation.
Identification of reef structures, like those seen in the Pasca wells, are difficult to identify
without the use of updated seismic data. Several Pasca test wells were drilled since the initial
seismic discovery. The Pasca ‘A’ reef is the current producing gas condensate reservoir with a
bioherm of 381 meters (Jablonski et al. 2006). Little is known about the reservoir potential of
this system due to a lack of core samples and porosity data. Studies into the Geophysical
properties of the Pasca wells were conducted by Jablonski et al. (2006). Climactic conditions
during the Early Miocene were conducive for reef growth in shallow marine waters. Outside of
the Pasca reef, the Pandora reef in the southern Gulf of Papua has been identified in seismic as
another potential play. The Pandora Reef is located approximately 200km offshore from Papua
New Guinea (Carroll and Webb, 1996). This reef is primarily a gas producing reef with a gas
reserve estimate of 1-2 Trillion Cubic Feet (TCF) (Carroll and Webb, 1996). However, the
remote location of the Pandora Reef in the Southern Gulf of Papua means there are no effective
hydrocarbon transportation methods currently in place. As a result, commercial development of a

88
pipeline in this area would require an average market price of US $2.50 – 3.00 per MCF (Carroll
and Webb, 1996). Offshore wells in the Gulf of Papua to this day remain highly lucrative.

89
CONCLUSION
1. The source rocks for hydrocarbon traps are Lower Jurassic Mudstones (Barikewa and
Imburu). Reservoir rocks for these systems were identified as sandstone reservoirs within the
Cretaceous Toro Sandstone. The final component to the system is the seal rock, which is the
Cretaceous Ieru Siltstone/Mudstone.
2. This study suggests that the original zone for hydrocarbon production in the Papuan
Basin took place within deep Graben structures or basement lows. Generated hydrocarbons
within these structures migrated up fault planes into trap zones.
3. A depth of 2,000 meters is required for kerogens in the Papuan Basin to enter into the
oil and gas window. Grabens and basement lows are the only places in the Papuan Basin where
this depth can occur. The presence of gas suggests the hydrocarbon system is over-mature.
4. The Papuan Basin is considered a frontier basin with various unexplored areas.
Tectonic pulses in this basin have led to oil and gas migration into complex structural traps that
are yet to be discovered and tested.
5. Migration and maturity issues within the basin remain leading explanations for why the
Papuan Basin is still considered a frontier basin with limited development.

90
FUTURE WORK
The use of computer modeling has greatly advanced our understanding of complex
regions using limited data. However, computer modeling tends to make large assumptions over
areas of missing data. With limited data in the Papuan Basin, more detailed observations must be
conducted while exploring for hydrocarbons. For future work, I suggest gathering more core data
and seismic data within the basin. With the aid of onshore seismic data, Geologists will be able
to identify rift structures throughout the basin. The critical depth for hydrocarbon generation in
this study should be used as a regional guideline for exploration. Throughout the offshore, I
suggest conducting detailed studies of paleo-reefs. Specifically, I would look at the trap potential
and look for similarities to the PASCA and Pandora reefs. Ultimately, with the addition of new
data, existing computer modeling programs can be updated continuously to provide more
detailed information.

91
References
Ahmed, M., Volk, H., Allan, T., and Holland, D., 2012, Origin of oils in the Eastern Papuan
Basin, Papua New Guinea: Organic Geochemistry, v. 53, p. 137-152.
Barndollar, P., 1993, Hydrocarbon Prospectivity of the Papuan Foreland, in Carman, G.J., and
Z., eds., Petroleum Exploration and Development in Papua New Guinea: Proceedings of
the Second PNG Petroleum Convention, Port Moresby, p. 517-526.
Bennett, D.J., Brand, R.P., Mills, C.R., and Morris, B.D., 2000, Exploration Potential of the
West Bosavi Area, Papuan Foreland Basin, Papua New Guinea, in Buchanan, P.G.,
Grainge, A.M., and Thornton, R.C.N., eds., Papua New Guinea’s Petroleum Industry in
the 21st Century: Proceedings of the Fourth PNG Petroleum Convention, Port Moresby,
p. 139-154.
Bird, K.J., and Seggie, R., 1990, Barikewa and Iehi Gas Fields Revisited, in Carman, G.J., and
Z., eds., Petroleum Exploration in Papua New Guinea: Proceedings of the First PNG
Petroleum Convention, Port Moresby, p. 551-565.
Boult, P.J., 1997, A review of the petroleum potential of Papua New Guinea with a focus on the
eastern Papuan Basin and the Pale Sandstone as a potential reservoir fairway: Geological
Society Special Publication, v. 126, p. 281-291. doi: 10.1144/GSL.SP.1997.126.01.17
Boult, P., 1993, The Reservoir Potential of the Imburu, Toro and Ieru Formations in the Ok
Menga area, PNG, in Carman, G.J., and Z., Petroleum Exploration and Development in
Papua New Guinea: Proceedings of the Second PNG Petroleum Convention, Port
Moresby, p. 191-200.
Brown, C.M., Pigram, C.J., and Skwarko, S.K., 1978 Mesozoic Stratigraphy and Geological
History of Papua New Guinea: Palaeogeography, Palaeoclimatology, Palaeoecology, v.
29, p. 301-322.
Buchanan, P.G., and Warburton, J., 1996, The Influence of Pre-existing Basin Architecture in the
Development of the Papuan Fold and Thrust Belt: Implications for Petroleum
Prospectivity, in Buchanan, P.G., Petroleum Exploration, Development and Production in
Papua New Guinea: Proceedings of the Third PNG Petroleum Convention, Port Moresby,
p. 89-109.
Burns, B.J., and Bein, J., 1980, Regional Geology and Hydrocarbon Potential of the Mesozoic of
the Western Papuan Basin, Papua New Guinea: The APEA Journal, v. 20, p. 1-15.
Carman, G.J., 1987, The Stratigraphy of the Aure Scarp, Papua New Guinea: PESA Journal, v.
11, p. 26-35.
92
Carroll, A.R., and Webb, E., 1996, Pandora Gas Development, in Buchanan, P.G., eds.,
Petroleum Exploration, Development and Production in Papua New Guinea: Proceedings
of the Thirds PNG Petroleum Convention, Port Moresby, p. 685-689.
Conybeare, C.E.B., and Jessop, R.G.C., 1972, Exploration for Oil-Bearing Sand Trends in the
Fly River Area, Western Papua: The APEA Journal, p. 69-73.
Davies, H.L., 2012, The geology of New Guinea- the cordilleran margin of the Australian
continent: Episodes, v. 35, p. 87-102.
Davies, H.L., and Smith, I.E., 1971, Geology of Eastern Papua: Geological Society of America
Bulletin, v. 82, p. 3299-3312.
Davies, H.L., Winn, R.D., and KenGemar, P., 1996, Evolution of the Papuan Basin- A view
from the Orogen, in Buchanan, P.G., ed., Petroleum Exploration, Development and
Production in Papua New Guinea: Proceedings of the Third PNG Petroleum Convention,
Port Moresby, p. 53-62.
Durkee, E.F., 1990, Pasca-Pandora Reef Exploration in the Gulf of Papua, in Carman, G.J., and
Z., eds., Petroleum Exploration in Papua New Guinea: Proceedings of the First PNG
Petroleum Convention, Port Moresby, p. 567-579.
Earnshaw, J.P., Hogg, A.J.C., Oxtoby, N.H., and Cawley, S.J., 1993, Petrographic and fluid
inclusion evidence for the timing of diagenesis and petroleum entrapment in the Papuan
Basin, in Carman, G.J., and Z., eds., Petroleum Exploration and Development in Papua
New Guinea: Proceedings of the Second PNG Petroleum Convention, Port Moresby, p.
459-475.
Gibbs, A,D., 2012, Structural Evolution of extension basin margins: Journal of the Geological
Society 198, v.141. p. 609-620. Doi:10.144/gsjgs.141.40609.
Gordon, S.A., Huizinga, B.J., and Sublette, V., 2000, Petroleum Potential of the Southern Gulf of
Papua, in Buchanan, P.G., Grainge, A.M., and Thornton, R.C.N., eds., Papua New
Guinea’s Petroleum Industry in the 21st century: Proceedings of the Fourth PNG
Petroleum Convention, Port Moresby, p. 205-218.
Harris, P.T., Pattiaratchi, C.B., Keene, J.B., Dalrymple, R.W., Gardner, J.V., Baker, E.K., Cole,
A.R., Mitchell, D., Gibbs, P., and Schroeder, W.W., 1996, Late Quaternary Deltaic and
Carbonate Sedimentation In The Gulf of Papua Foreland Basin: Response to Sea-Level
Change: Journal of Sedimentary Research, v. 66, p. 801-819. doi: 1073-130X/96/066-
801/S03.00.
Harrison, J., 1969, A Review of the Sedimentary History of the Island of New Guinea: The
APEA Journal, p. 41-48.
Hill, D (ed)., 1961, Journal of the Geological Society of Australia: Adelaide, South Australia, v.
8, p. 1-133.
93
Hill, K. C., Simpson, R.J., Kendrick, R.D., Crowhurst, P.V., Sullivan, P.B., and Saefudin, I.,
1996, Hydrocarbons in New Guinea, Controlled by Basement Fabric, Mesozoic
Extension and Tertiary Convergent Margin Tectonics, in Buchanan, P.G., ed., Petroleum
Exploration, Development and Production in Papua New Guinea: Proceedings of the
Third PNG Petroleum Convention, Port Moresby, p. 63-76.
Hirst, J.P., and Price, C.A., 1996, Sequence Stratigraphy and Sandstone Geometry of the Toro
and Imburu Formations, within the Papuan Fold Belt and Foreland, in Buchanan, P.G.,
ed., Petroleum Exploration, Development and Production in Papua New Guinea:
Proceedings of the Third PNG Petroleum Convention, Port Moresby, p. 279-299.
Holm, R.J., and Richards, S.W., 2013, A re-evaluation of arc-continent collision and along-arc
variation in the Bismarck Sea region, Papua New Guinea: Australian Journal of Earth
Sciences, v. 60, p. 605-619. doi: 10.1080/08120099.2013.824505
Home, P.C., Dalton, D.G., and Brannan, J., 1990, Geological Evolution of the Western Papuan
Basin, in Carman, G.J., and Z., eds., Petroleum Exploration in Papua New Guinea:
Proceedings of the First PNG Petroleum Convention, Port Moresby, p. 107-117.
Jablonski, D., Pono, S., and Larsen, O.A., 2006, Prospectivity of the deepwater Gulf of Papua
and surrounds in Papua New Guinea (PNG)- A new look at a frontier region, in APPEA
Journal, eds., Australian Petroleum Production & Exploration Association: 2006 APPEA
conference, v. 46, p. 179-200.
John, V.P., 1970, The Gravity Field and Structure of Papua and New Guinea: The APEA
Journal, v. 20, p. 41-55.
Johnson, T.L., 1979, Alternative model for emplacement of the Papuan ophiolite, Papua New
Guinea: Geology, v. 7, p. 495-498.
Kawagle, S.A., and Meyers, J.B., 1996, Structural and Sequence Geometry of the Kiunga Area,
Papuan Foreland Basin, Papua New Guinea, in Buchanan, P.G., ed., Petroleum
Exploration, Development and Production in Papua New Guinea: Proceedings of the
Third PNG Petroleum Convention, Port Moresby, p. 175-192.
Madu, S., 1996, Correlation Section of the Late Jurassic to Early Cretaceous Succession in the
Papuan Fold Belt, Papuan Basin: Sequence Stratigraphic Framework, Concepts and
Implications for Exploration and Exploitation, in Buchanan, P.G., ed., Petroleum
Exploration, Development and Production in Papua New Guinea: Proceedings of the
Third PNG Petroleum Convention, Port Moresby, p. 259-277.
McConachie, B.A., and Lanzilli, E., 2000, Stanley Gas Condensate Field Discovery and the Oil
Potential of the Western Papuan Basin, in Buchanan, P.G., Grainge, A.M., Thornton,
R.C.N., and Eds., Proceedings of the fourth PNG Petroleum Convention, Port Moresby,
p. 427-442.
94
Mollan, R.G., and Blackburn, G.J., 1990, Petroleum potential of the Fly-Bamu Deltas Region, in
Carman, G.J., and Z., eds., Petroleum Exploration in Papua New Guinea: Proceedings of
the First PNG Petroleum Convention, Port Moresby, p. 215-226.
Morton, A.C., Humphreys, B., Manggal, G., and Fanning, C.M., 1996, Provenance and
Correlation of Upper Jurassic and Lower Cretaceous Reservoir Sandstones in Papua New
Guinea Using Heavy Mineral Analysis, in Buchanan, P.G., Proceedings of the Fourth
PNG Petroleum Convention, Port Moresby, p. 187-203.
Oppel, T.W., 1970, Exploration of the Southwest Flank of the Papuan Basin: The APEA Journal,
p. 62-69.
Palinkas, C.M., Nittrouer, C.A., and Walsh, J.P., 2006, Inner-Shelf Sedimentation in the Gulf of
Papua, New Guinea: A Mud-Rich Shallow Shelf Setting: Journal of Coastal Research, v.
22, p. 760-772. doi: 10.2112/03-0086.1.
Phelps, J.C., and Denison, C,N., 1993, Stratigraphic thickness variations and depositional
systems of the Ieru Formation, Southern Highlands and Western Provinces, Papua New
Guinea, in Carman, G.J., and Z., eds., Petroleum Exploration and Development in Papua
New Guinea: Proceedings of the Second PNG Petroleum Convention, Port Moresby, p.
169-190.
Pigram, C.J., Davies, P.J., Feary, D.A., Symonds, P.A., and Chaproniere, G.C.H., 1990, Controls
on Tertiary Carbonate Platform Evolution in the Papuan Basin: New Play Concepts, in
Carman, G.J., and Z., eds., Petroleum Exploration in Papua New Guinea: Proceedings of
the First PNG Petroleum Convention, Port Moresby, p. 185-195.
Rickwood, F.K., 1990, Towards Development- The Long History of Petroleum Exploration in
Papua New Guinea, in Carman, G.J., Z., and eds., Petroleum Exploration in Papua New
Guinea: Proceedings of the First PNG Petroleum Convention, Port Moresby, p. 1-13.
Rickwood, F.K., 1968, The Geology of Western Papua: The APEA Journal, p. 51-61.
Sari, J., 1990, Revised Stratigraphic Definition of the Toro Formation, A Proposal, in Carman,
G.J., Z., and eds., Petroleum Exploration in Papua New Guinea: Proceedings of the First
PNG Petroleum Convention, Port Moresby, p. 159-167.
Smith, R.I., 1990, Tertiary Plate Tectonic Setting and Evolution of Papua New Guinea, in
Carman, G.J., and Z., eds., Petroleum Exploration in Papua New Guinea: Proceedings of
the First PNG Petroleum Convention, Port Moresby, p. 229-244.
Steinshouer, D.W., Qiang, J., McCabe, P.J., Ryder, R.T., 1997, Maps Showing Geology, Oil and
Gas Fields, And Geologic Provinces of the Asia Pacific Region: U.S. Geological Survey
Open-File Report 97-470F.
Surka, E., 1993, The Southeast Oilfield; technical aspects of a significant discovery in Papua
New Guinea, in Carman, G.J., and Z., eds., Petroleum Exploration and Development in
95
Papua New Guinea: Proceedings of the Second PNG Petroleum Convention, Port
Moresby, p. 431-444.
Tcherepanov, E.N., Droxler, A.W., Lapointe, P., and Mohn, K., 2008, Carbonate seismic
stratigraphy of the Gulf of Papua mixed depositional system: Neogene stratigraphic
signature and eustatic control: Journal of Basin Research, v. 20, p. 185-209. doi:
10.1111/j.1365-2117.2008.00364.x.
Thompson, J.E., 1965, Sedimentary Basins of the Territory of Papua and New Guinea and the
Stratigraphic Occurrence of Hydrocarbons, in Proceedings, Symposium on the
Development of Petroleum Resources of Asia and the far East, 3rd, Tokyo, Japan,
Department of National Development. Bureau of Mineral Resources Geology and
Geophysics, p. 1-14.
Valenti, G.L., and Francis, G., 1996, Darai Limestone Formation of the Western Papuan Basin,
Papua New Guinea, in Buchanan, P.G., ed., Petroleum Exploration, Development and
Production in Papua New Guinea: Proceedings of the Third PNG Petroleum Convention,
Port Moresby, p. 357-368.
Volk, H., George, S., Middleton, H., and Schofield, S., 2005, Geochemical comparison of fluid
inclusion and present-day oil accumulations in the Papuan Foreland- evidence for
previously unrecognized petroleum source rocks: Journal of Organic Geochemistry, v.
36, p. 29-51.
Waples, D.W., and Wulff, K.J., 1996, Genetic Classification and Exploration Significance of
Oils and Seeps of the Papuan Basin, in Buchanan, P.G., ed., Petroleum Exploration,
Development and Production in Papua New Guinea: Proceedings of the Third PNG
Petroleum Convention, Port Moresby, p. 417-430.
Wilson, E.J., Lewis, D., Yogi, O., Holland, D., Hombo, L., and Goldberg, A., 2013,
Development of a Papua New Guinean onshore carbonate reservoir: A comparative
borehole image (FMI) and petrographic evaluation: Journal of Marine and Petroleum
Geology, v. 44, p. 164-195.
Winn, R.D., and Pousai, P., 2010, Synorogenic alluvial-fan-fan-delta deposition in the Papuan
foreland basin: Plio-Pleistocene Era Formation, Papua New Guinea: Australian Journal of
Earth Sciences, v. 57, p. 507-523. doi: 10.1080/08120099.2010.492909.
Wise, R.A., 1976. The Papuan Basin-Off-Shore (Gulf Basin), in Leslie, R.B., Evans, H.J., and
Knight, C.L., eds., Economic geology of Australia and Papua New Guinea. 3. Petroleum.
Australas. Inst. Min. Metall., Monogr. v. 7, p. 494-499.

96
APPENDIX
Appendix A
Dry Hole Analysis
Borabi 1:
Drill logs show a loss of circulation at a depth of 1512 meters. Excellent reservoirs were
recorded in the Borabi reef trend.
Cecilia 1:
This well was drilled to test a surface mapped thrust faulted anticline. This well was
drilled to a depth of 3765.8 meters and failed to reach Cretaceous and Jurassic Sandstone
reservoirs.
Darai 1:
This well was drilled to a depth of 2068.3 meters to test for a structural closure with a
potential hydrocarbon trap. Partially flushed Toro Sandstone units were discovered with no
structural closure. The lower Jurassic units were not encountered.
Iamara 1:
This well was drilled to a total depth of 1813.6 meters. Good Toro Sandstone reservoirs
were encountered; however, no structural trap was identified.
Ini 1:
This well was drilled as part of the Uramu Reef Complex at a depth of 2734.1 meters.
Intersection of the reef top resulted in salt water intrusion.

97
Iokea 1:
This well was drilled to test a diapiric anticlinal structure. Iokea 1 was drilled to a depth
of 1475.2 meters, and only reached Pliocene units.
Ipigo 1:
This well was drilled to test a seismically postulated reef. The resulting well revealed a
fault was responsible for the seismic anomaly.
Iviri 1:
This well was drilled to a depth of 3662.2 meters. Iviri was drilled to test the seismically
defined Uramu Reef Complex. No hydrocarbons were encountered in this test well.
Kanau 1:
Kanau 1 was drilled to test a surface mapped structural anticline. The structural closure at
depth was not proven.
Kapuri 1:
Drilled on an interpreted Biothermal Reef to a depth of 1698.3 meters. Salt water was
encountered in reef carbonates.
Kiunga 1:
This well was drilled to test a faulted basement high for Jurassic and Cretaceous source
rocks. Tests of the Toro Sandstone showed salt water with minor gas. This well was drilled to a
depth of 3026 meters.
Komewu 1:

98
Komewu 1 was drilled on the upthrown fault block of the Komewu Fault. No
stratigraphic or structural closure was present in this well. The Ieru seal was also missing from
this well.
Kusa 1:
This well was drilled to a depth of 3433.6 meters to test a seismically identified anticline
structure. Seismic indicates this well was drilled off structure.
Magobu Island 1:
This well was drilled on a basement high. Good Mesozoic Sandstone reservoirs were
encountered with no structural closure.
Maiva 1:
Maiva 1 was drilled on a seismically identified anticline. No reservoir rocks were
encountered in this well.
Morehead 1:
This well was drilled off of gravity and seismic reflection data. No closure over the
faulted anticlinal structure was detected which resulted in no hydrocarbon accumulation.
Mutare 1:
Mutare 1 was drilled to a depth of 1419 meters. Toro reservoir sands were not
encountered and were possibly eroded away.
Omati 2:
Abandoned well at a depth of 3316 meters.

99
Orie 1:
Poor development of the Toro Sandstone was found in this well.
Orokolo 1:
This well was drilled to a depth of 3657.3 meters. No Jurassic sand units were found in
this well.
Wuroi 1:
No structural closure was observed in this well. Sandstone reservoirs were encountered.
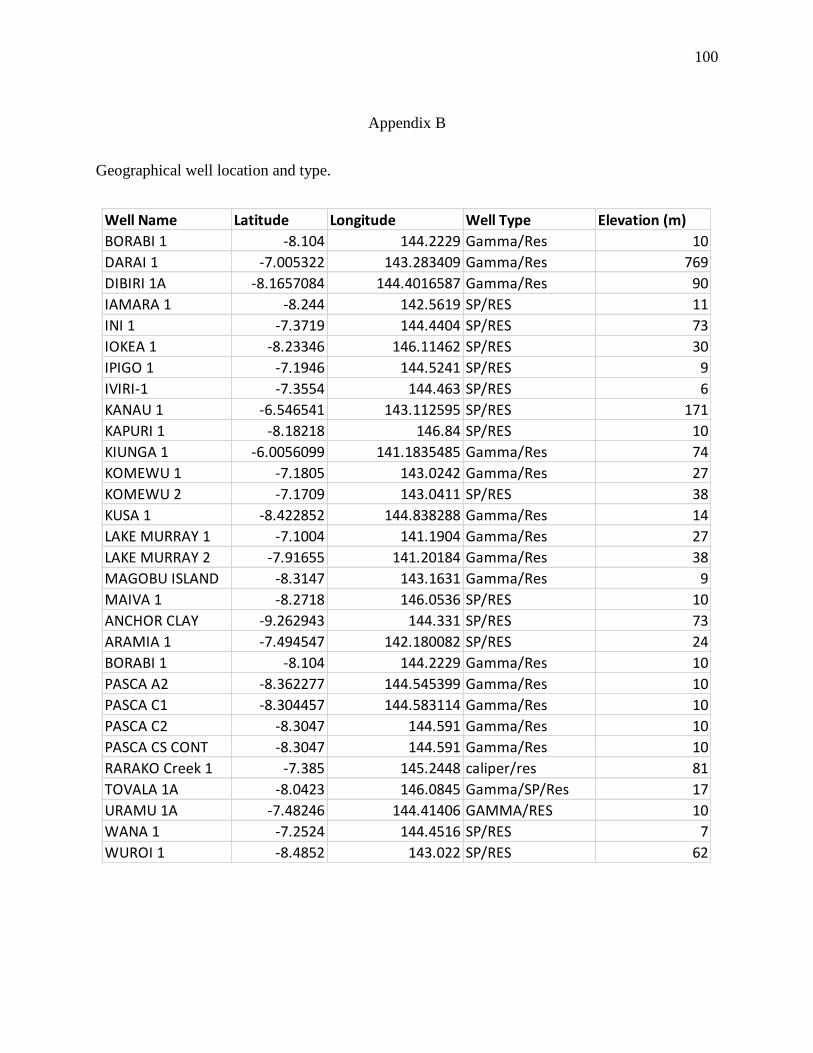
100
Appendix B
Geographical well location and type.
Well Name Latitude Longitude Well Type Elevation (m)
BORABI 1 -8.104 144.2229 Gamma/Res 10
DARAI 1 -7.005322 143.283409 Gamma/Res 769
DIBIRI 1A -8.1657084 144.4016587 Gamma/Res 90
IAMARA 1 -8.244 142.5619 SP/RES 11
INI 1 -7.3719 144.4404 SP/RES 73
IOKEA 1 -8.23346 146.11462 SP/RES 30
IPIGO 1 -7.1946 144.5241 SP/RES 9
IVIRI-1 -7.3554 144.463 SP/RES 6
KANAU 1 -6.546541 143.112595 SP/RES 171
KAPURI 1 -8.18218 146.84 SP/RES 10
KIUNGA 1 -6.0056099 141.1835485 Gamma/Res 74
KOMEWU 1 -7.1805 143.0242 Gamma/Res 27
KOMEWU 2 -7.1709 143.0411 SP/RES 38
KUSA 1 -8.422852 144.838288 Gamma/Res 14
LAKE MURRAY 1 -7.1004 141.1904 Gamma/Res 27
LAKE MURRAY 2 -7.91655 141.20184 Gamma/Res 38
MAGOBU ISLAND -8.3147 143.1631 Gamma/Res 9
MAIVA 1 -8.2718 146.0536 SP/RES 10
ANCHOR CLAY -9.262943 144.331 SP/RES 73
ARAMIA 1 -7.494547 142.180082 SP/RES 24
BORABI 1 -8.104 144.2229 Gamma/Res 10
PASCA A2 -8.362277 144.545399 Gamma/Res 10
PASCA C1 -8.304457 144.583114 Gamma/Res 10
PASCA C2 -8.3047 144.591 Gamma/Res 10
PASCA CS CONT -8.3047 144.591 Gamma/Res 10
RARAKO Creek 1 -7.385 145.2448 caliper/res 81
TOVALA 1A -8.0423 146.0845 Gamma/SP/Res 17
URAMU 1A -7.48246 144.41406 GAMMA/RES 10
WANA 1 -7.2524 144.4516 SP/RES 7
WUROI 1 -8.4852 143.022 SP/RES 62
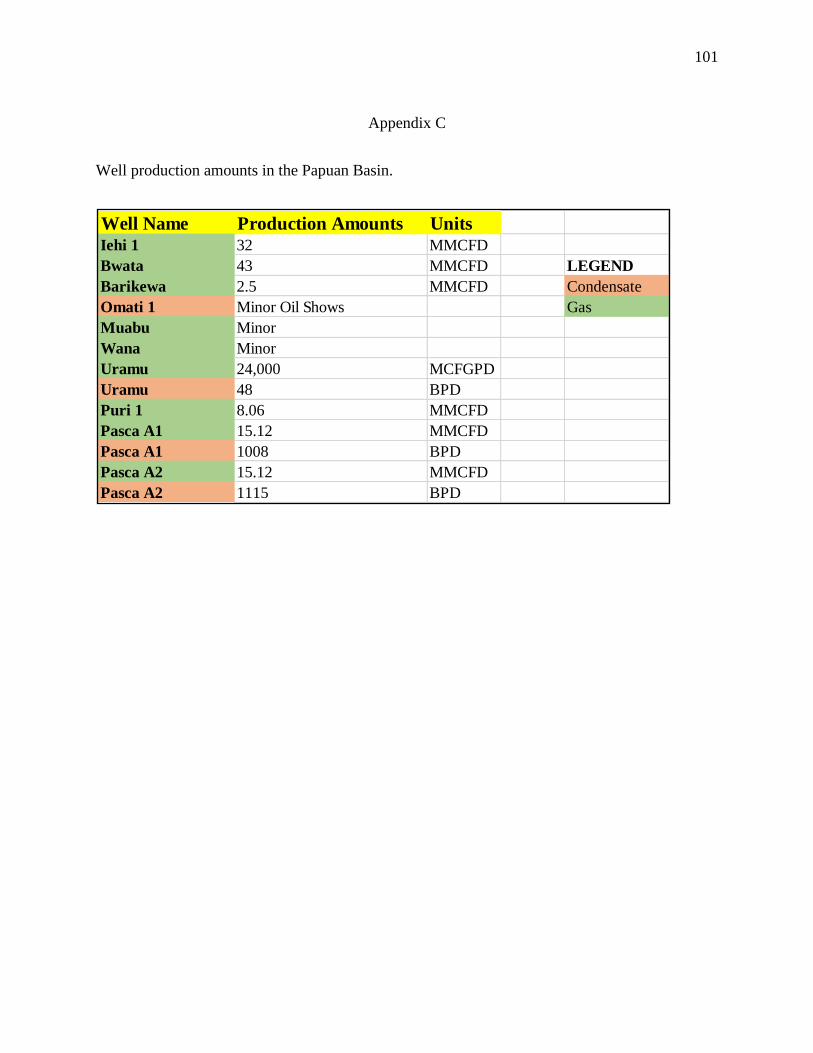
101
Appendix C
Well production amounts in the Papuan Basin.
Well Name Production Amounts UnitsIehi 1 32 MMCFD
Bwata 43 MMCFD LEGEND
Barikewa 2.5 MMCFD Condensate
Omati 1 Minor Oil Shows Gas
Muabu Minor
Wana Minor
Uramu 24,000 MCFGPD
Uramu 48 BPD
Puri 1 8.06 MMCFD
Pasca A1 15.12 MMCFD
Pasca A1 1008 BPD
Pasca A2 15.12 MMCFD
Pasca A2 1115 BPD
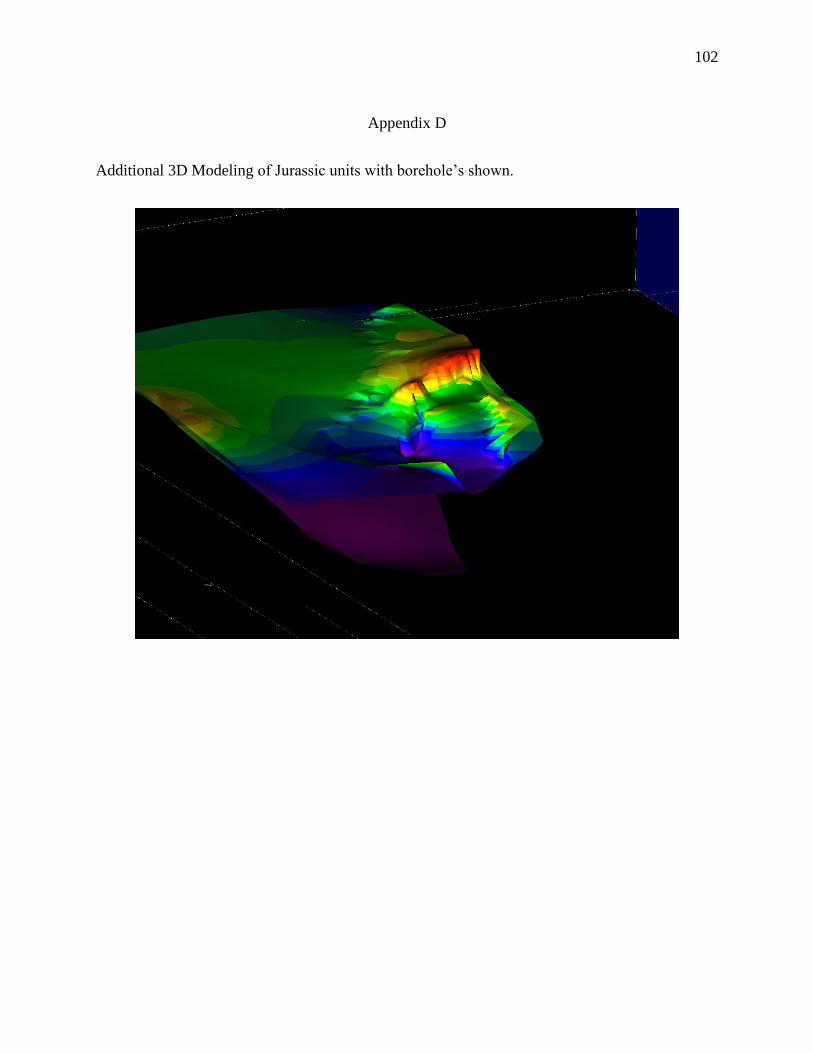
102
Appendix D
Additional 3D Modeling of Jurassic units with borehole’s shown.
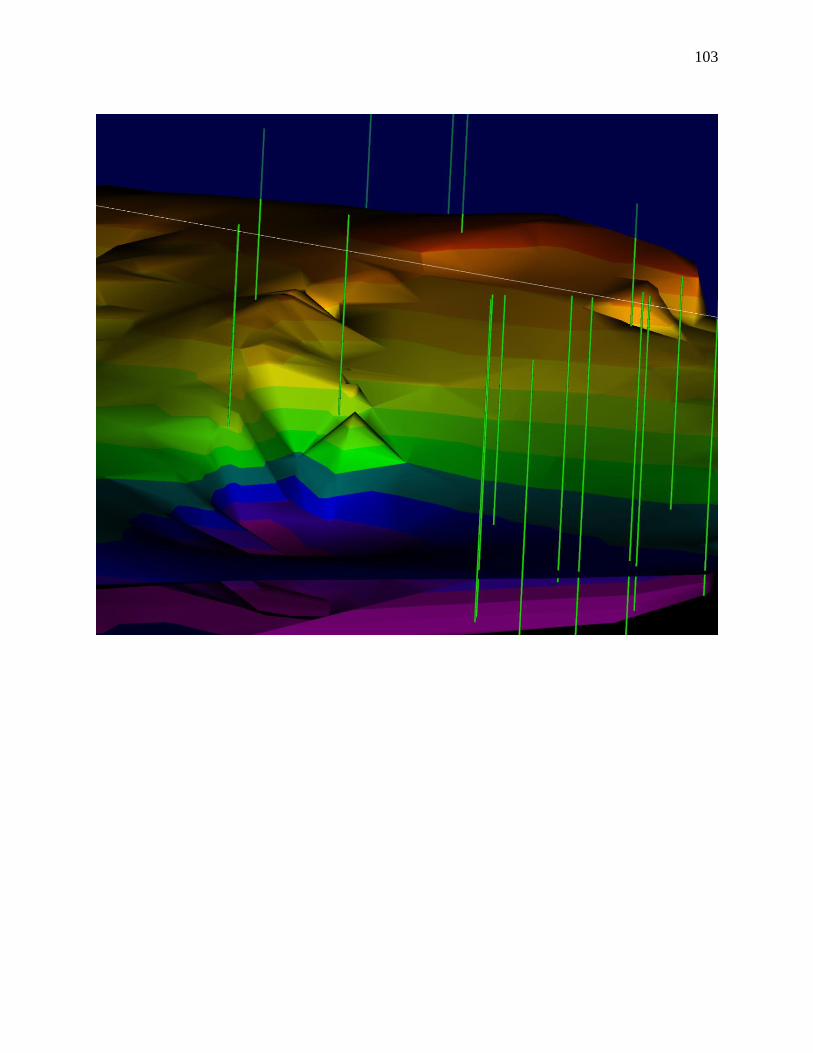
103
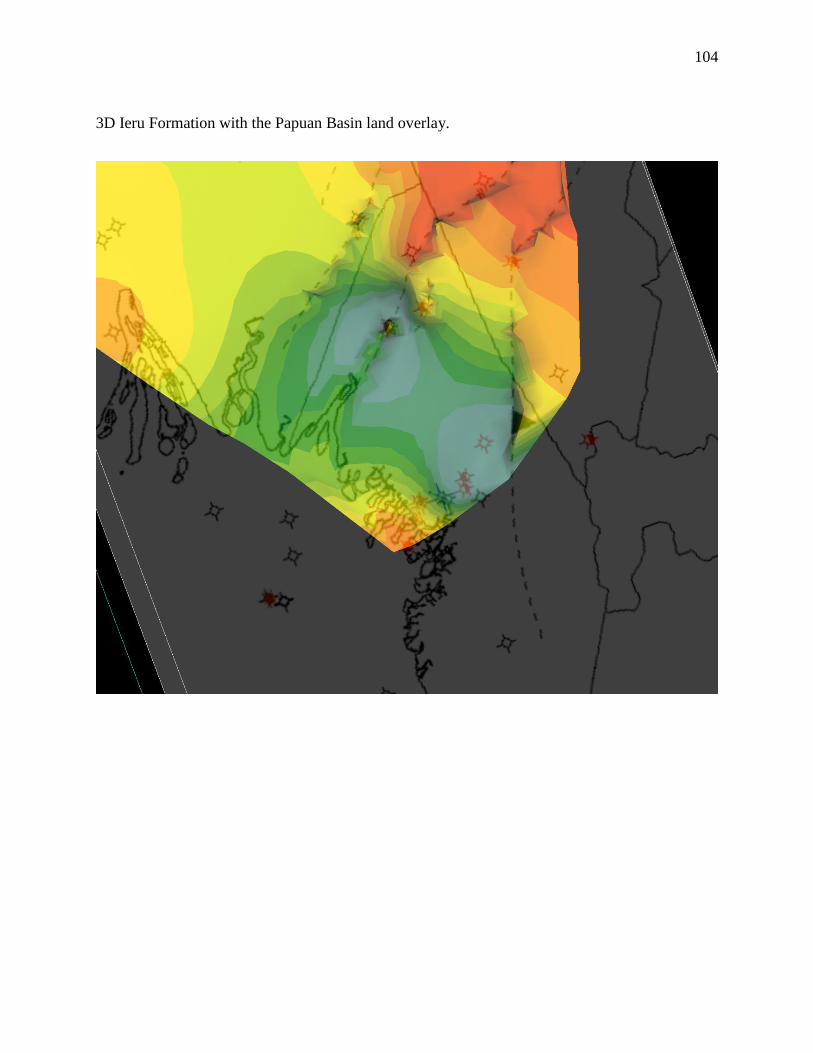
104
3D Ieru Formation with the Papuan Basin land overlay.
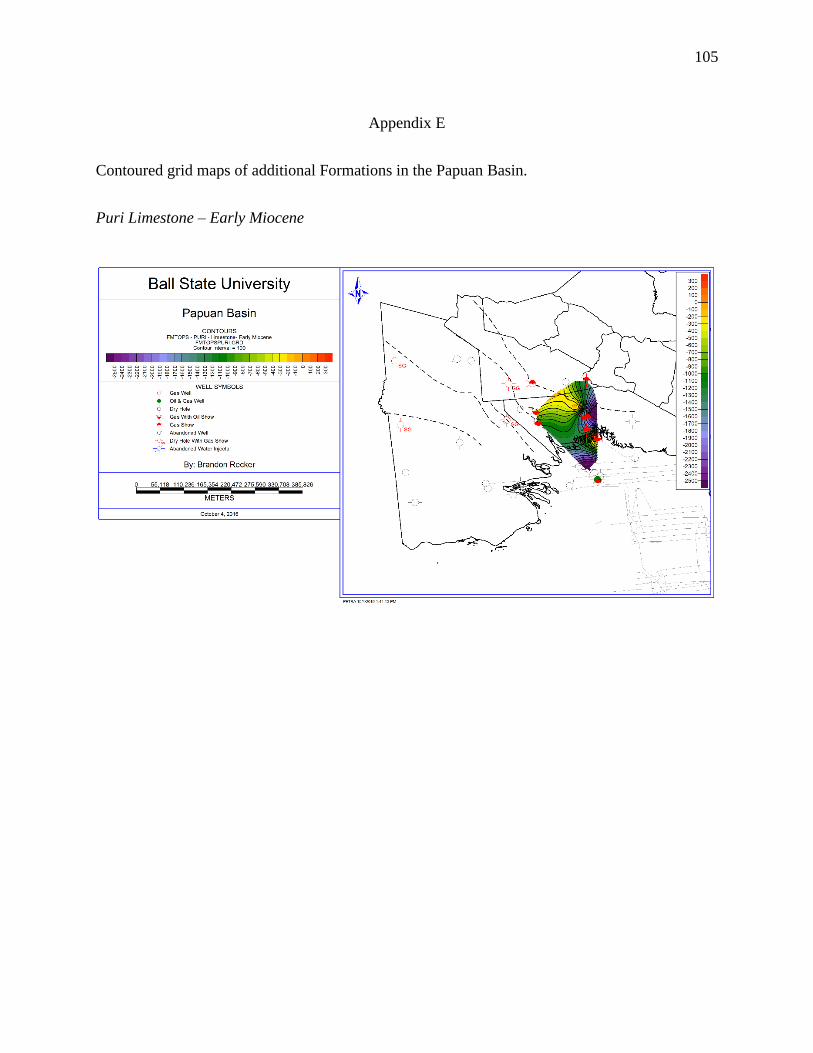
105
Appendix E
Contoured grid maps of additional Formations in the Papuan Basin.
Puri Limestone – Early Miocene
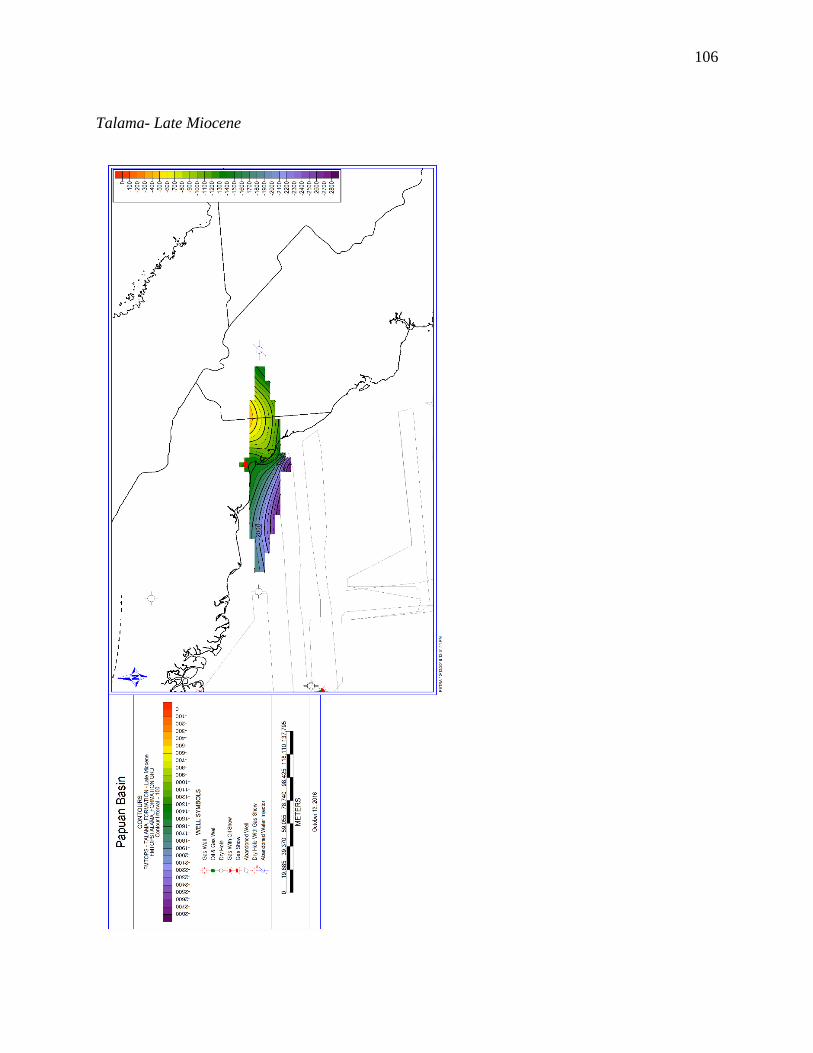
106
Talama- Late Miocene
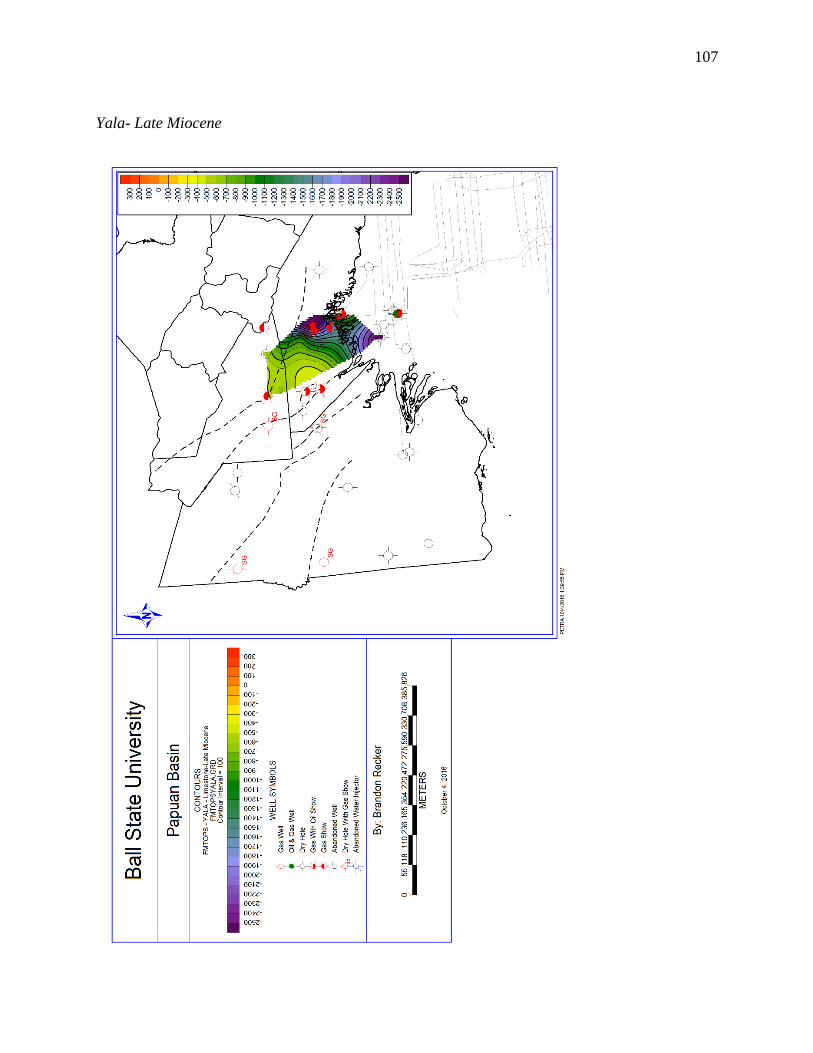
107
Yala- Late Miocene
Recommended