1
Air Quality Regulation in California
Critical Issues in Greenhouse Gases, Stationary Sources & Mobil Source Emissions
January 12, 2007
Jim Flanagan
2
Two views of marine transport
> Dirtiest mode of transport
> Uses high sulfur fuel
> Engines not designed to minimize emissions
> Cleanest mode of transport
> Efficient use of energy resources
> Lowest drag on movement

3
How should we measure and track environmental performance?
> Reduction from baseline
> High baseline reductions appear less meaningful
> Per container (TEU) shipped per mile
> To track performance and for comparisons
> Consider entire environmental footprint
Good business planning reduces emissions

4
Air Emissions in Marine Transportation
Consider the full transportation chain footprint
> Ocean going vessels
> Main engine emissions
> Dockside auxiliary engine emissions
> Harbor craft: tugs, pilot vessels, etc.
> Container loading and unloading
> Movement off-site
Energy Use Air Emissions
5
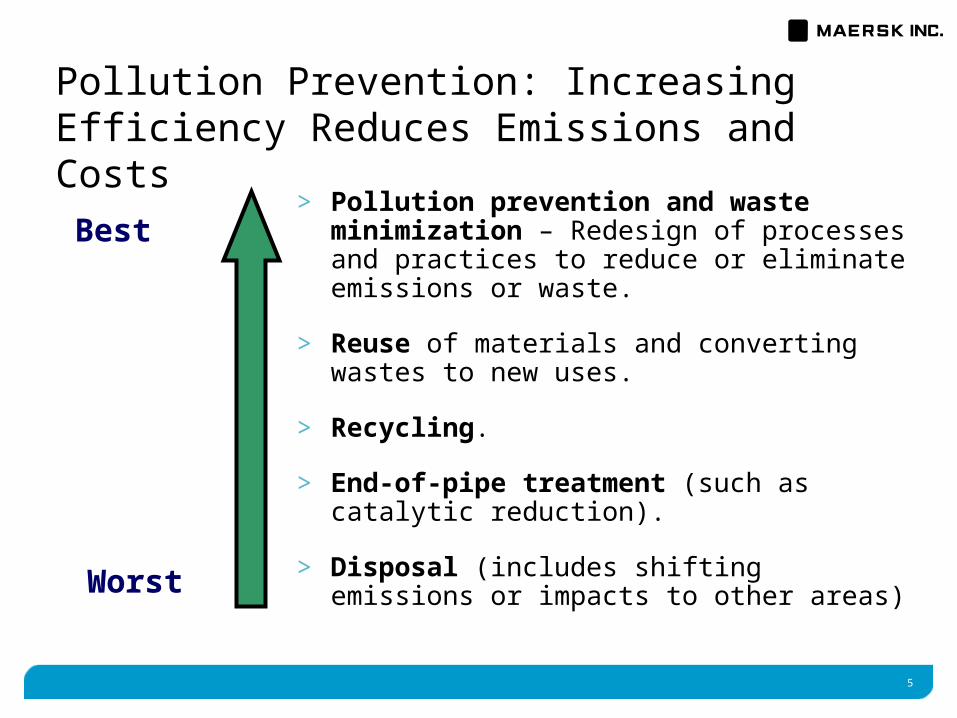
Pollution Prevention: Increasing Efficiency Reduces Emissions and Costs
> Pollution prevention and waste minimization – Redesign of processes and practices to reduce or eliminate emissions or waste.
> Reuse of materials and converting wastes to new uses.
> Recycling.
> End-of-pipe treatment (such as catalytic reduction).
> Disposal (includes shifting emissions or impacts to other areas)
Best
Worst

6
Energy efficiency for container vessels compared with other modes of transport
S-Type container vessel
Rail – Electric*
Rail –Diesel*
Heavy Truck*
Boeing 747-400*
Energy Use
kWh/tkm 0.018 0.043 0.067 0.18 2.00
Emissions (g/tkm)
CO2 8.36 44.096 17 50 552
PM 0.009 n/a 0.008 0.005 n/a
SOx 0.162 0.21768 0.00005 0.00006 0.17
NOx 0.21 0.13 0.35 0.31 5.69
*Source: Network for Transport and the Environment (NTM)
7
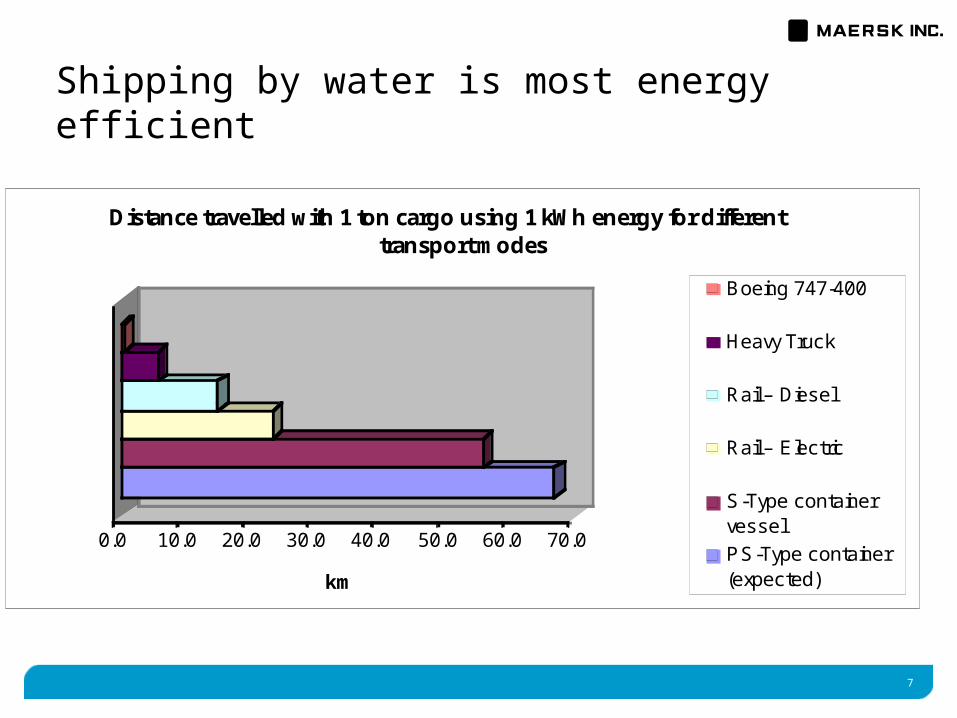
0.0 10.0 20.0 30.0 40.0 50.0 60.0 70.0
km
Distance travelled with 1 ton cargo using 1 kWh energy for different transport modes
Boeing 747-400
Heavy Truck
Rail – Diesel
Rail – Electric
S-Type containervessel
PS-Type container(expected)
Shipping by water is most energy efficient

8
Bigger ships are more efficient

9
Large Container Vessels - > 5000 TEU- Average service speed 21 knots
76.3
2.03 1.250.0
20.0
40.0
60.0
80.0
100.0
CO2 NOx SOx
g CO2 / TEU.km
Medium-Large Container Vessels - 3500-5000 TEU - Average service speed 20 knots
85.8
2.57 1.410.0
20.0
40.0
60.0
80.0
100.0
CO2 NOx SOx
g CO2 / TEU.km
Medium Container Vessels 2000-3500 TEU - Average service speed 19 knots
121.6
3.17 1.990.0
20.0
40.0
60.0
80.0
100.0
120.0
140.0
CO2 NOx SOx
g CO2 / TEU.km
Small Container Vessels < 2000 TEU - Average service speed 16 knots
121.3
3.19 1.990.0
20.0
40.0
60.0
80.0
100.0
120.0
140.0
CO2 NOx SOx
g CO2 / TEU.km
g CO2/TEU.km = grams carbon dioxide emitted per twenty-foot container unit transported one kilometre.
Larger vessels are more efficient

10
Shipping efficiencies through technologyMaersk Line energy optimization initiatives include:
> Waste heat recovery systems reduce fuel use 10%.
> Slide valves
> Computer systems improve cargo, route & speed efficiency
> Waste oil clarification decanters separate burnable liquids from waste oil, water, and sludge mixtures
> New cylinder lubrication systems use less oil
> Efficient hull and propeller maintenance
> Hull coatings

11
Shipping Gets More Efficient
Average CO2 emissions from A.P. Moller - Maersk
owned container vessels 2002-2006*
89.1
85.684.6 84.8
84.1
81828384858687888990
2002 2003 2004 2005 2006*
g CO
2 / TEU.km
•*First half of 2006
ResultsOur efforts to reduce CO2 emissions have led to a significant 5.6 per cent decrease in fuel consumption and reduction in emissions per tonne of cargo. This corresponds to a total reduction in CO2 emissions of 1.81 million tonnes during the period 2002 to 2006*.
12
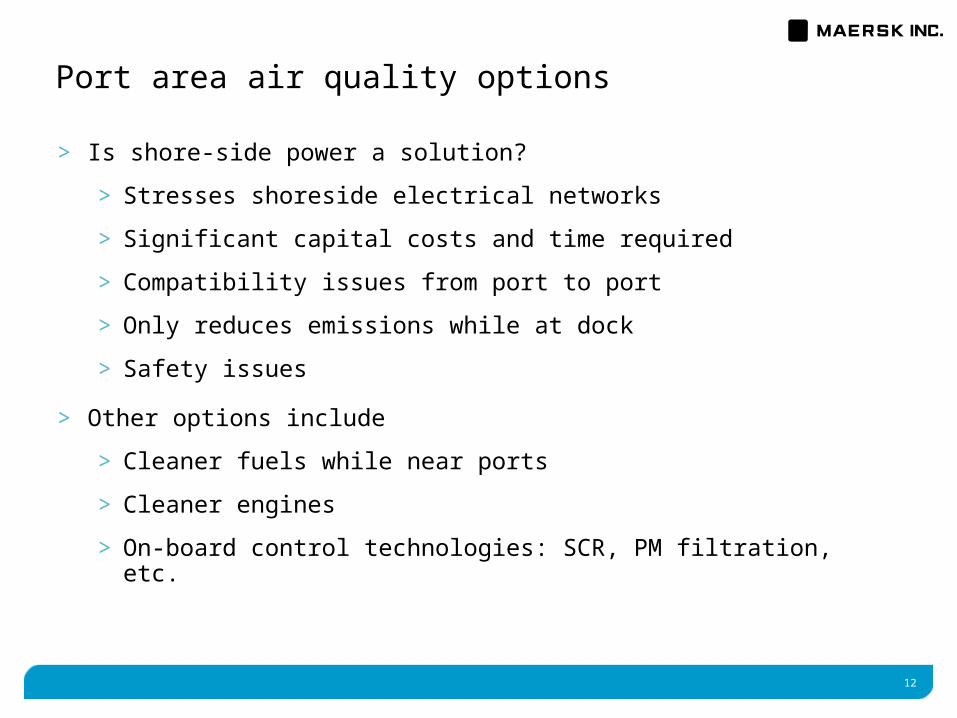
Port area air quality options
> Is shore-side power a solution?
> Stresses shoreside electrical networks
> Significant capital costs and time required
> Compatibility issues from port to port
> Only reduces emissions while at dock
> Safety issues
> Other options include
> Cleaner fuels while near ports
> Cleaner engines
> On-board control technologies: SCR, PM filtration, etc.

13
Reduces emissions: Total: over 400 tons/yrSOx: 92% PM: 73% NOx: at least 10%
14
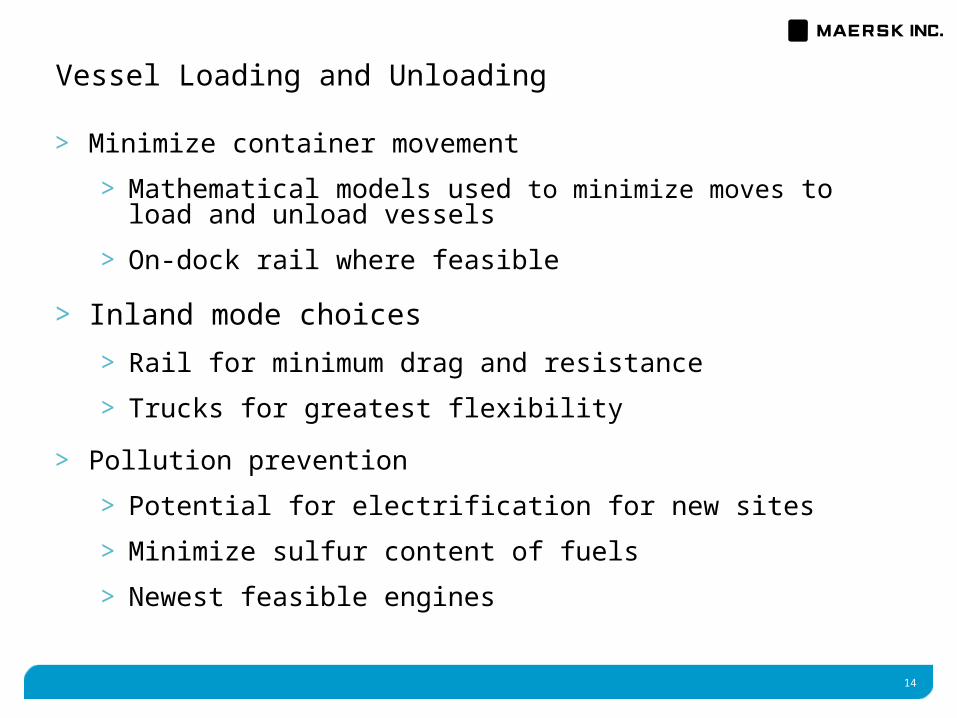
Vessel Loading and Unloading
> Minimize container movement
> Mathematical models used to minimize moves to load and unload vessels
> On-dock rail where feasible
> Inland mode choices
> Rail for minimum drag and resistance
> Trucks for greatest flexibility
> Pollution prevention
> Potential for electrification for new sites
> Minimize sulfur content of fuels
> Newest feasible engines
15
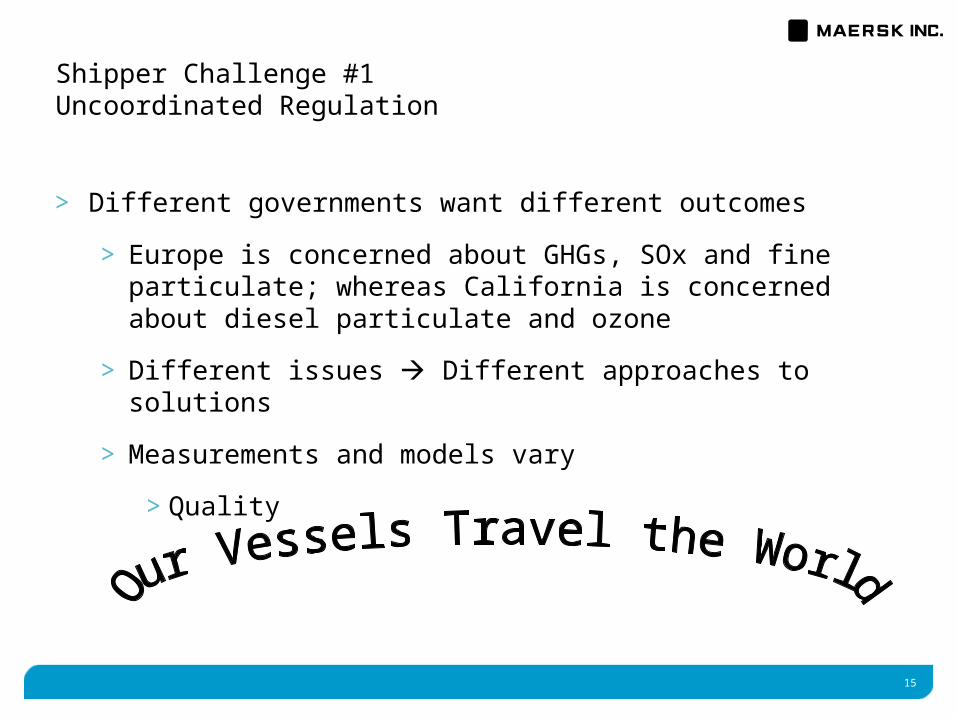
Shipper Challenge #1Uncoordinated Regulation
> Different governments want different outcomes
> Europe is concerned about GHGs, SOx and fine particulate; whereas California is concerned about diesel particulate and ozone
> Different issues Different approaches to solutions
> Measurements and models vary
> Quality
16
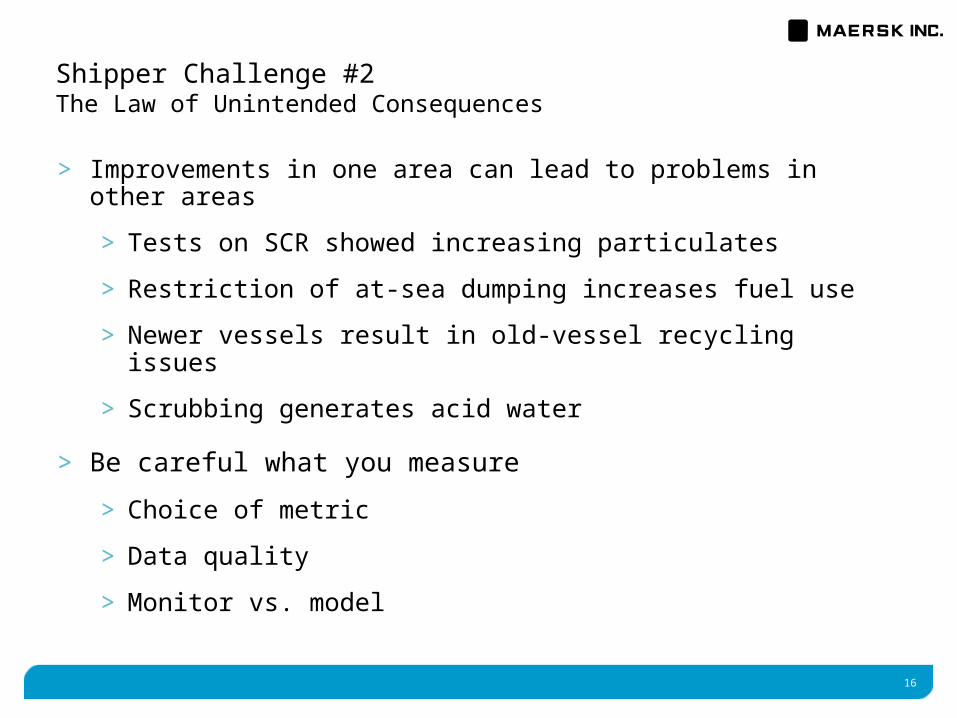
Shipper Challenge #2The Law of Unintended Consequences
> Improvements in one area can lead to problems in other areas
> Tests on SCR showed increasing particulates
> Restriction of at-sea dumping increases fuel use
> Newer vessels result in old-vessel recycling issues
> Scrubbing generates acid water
> Be careful what you measure
> Choice of metric
> Data quality
> Monitor vs. model

17
The Maersk Challenge
> Being a good world-wide corporate citizen
> Reducing our GHG footprint reducing overall energy use
> Consider world-wide operational impacts
> Harmonizing world-wide concerns
> Getting cargo where it needs to be on time and at competitive cost
18
Environmental Trends: Air Quality
> Increasing focus on health impacts of diesel emissions
> SOx, NOx and PM (particles)
> Ships, CHE, trucks, rail
> Air quality in many ports exceeds standards.
> Governments and customers are concerned about “Greenhouse Gases” (CO2)
> Regulatory actions will include
> Tighter fuel standards world-wide (cost factor)
> Need for new technologies: AMP, SCR, PM filters
19
Maersk’s Air Quality Program
> Reduce sulfur in fuel where it impacts shoreside air quality
> Develop mobile solutions for mobile sources
> Replace not retrofit port cargo handling equipment
> Implement management systems to ensure consistent evaluation of issues
> Use good science and metrics
> Test thoroughly before committing
> Data-based decisions
> Work with shippers, other carriers and governments on metrics, reductions and technologies
> Clean Cargo Working Group

20
Thank you
Recommended