1
3G Mobile Services in Japan
Hideki Yagi
Communications and Information network Association of Japan
10th ATIE

2
Changes in the Number of Cellular Phone Subscribers
Source: MIC
0
10
20
30
40
50
60
70
80
90
1996 1997 1998 1999 2000 2001 2002 2003 Feb.2005
Feb.2005(FY)
3G(33%)
Number of mobile phone
subscribers(86 mil.)2000
First mobile phones with
cameras
2001Start of 3G
service
Million subscribers
1999Start of mobile internet access
service
Mobile phone with camera
(75%)
Can connect with Internet
(86%)
3
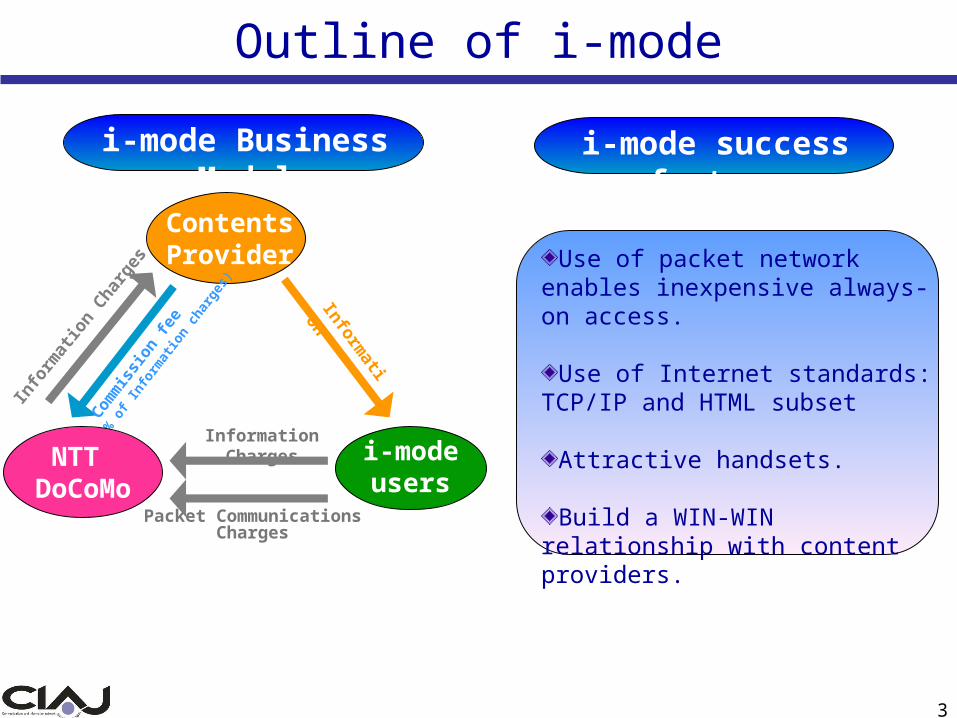
ContentsProvider
Information Charges
Info
rmat
ion
Charg
es
Com
mis
sion
fee
(9%
of I
nfor
mat
ion
char
ges) Inform
ation
Outline of i-mode
i-mode success factorsi-mode Business Model
Use of packet network enables inexpensive always-on access.
Use of Internet standards: TCP/IP and HTML subset
Attractive handsets.
Build a WIN-WIN relationship with content providers.
i-mode users
NTT DoCoMo
Packet Communications Charges
4
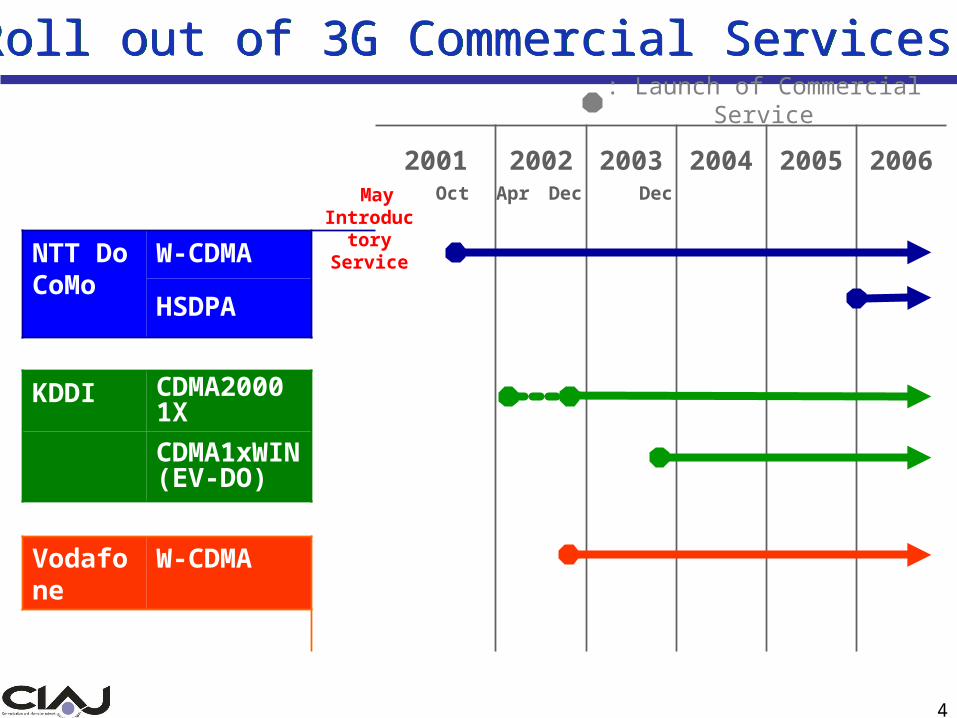
Roll out of 3G Commercial Services Roll out of 3G Commercial Services
2001 2002 2003 2004 2005 2006
NTT DoCoMo
W-CDMA
HSDPA
KDDI CDMA2000 1XCDMA1xWIN(EV-DO)
Vodafone W-CDMA
Dec DecOctMayIntroductory
Service
: Launch of Commercial Service
Apr

5
Classified Subscribers of Cellular Phone
Carriers2.5G
3GTotal
W-CDMA CDMA2000
NTT DoCoMo 38.8(-1.3)
10.2(+1.8)
48.3(+0.5)
KDDI au 5.3(-0.3)
17.4(+0.6)
22.7(+0.3)
Vodafone 14.4(-0.4)
0.7(+0.3)
15.1(-0.1)
Total 57.8(-2.0)
10.9(+2.1)
17.4(+0.6)
86.1(+0.7)
as of Feb 2005 (Millions)
( ): Compared with End of Dec. 2004
6
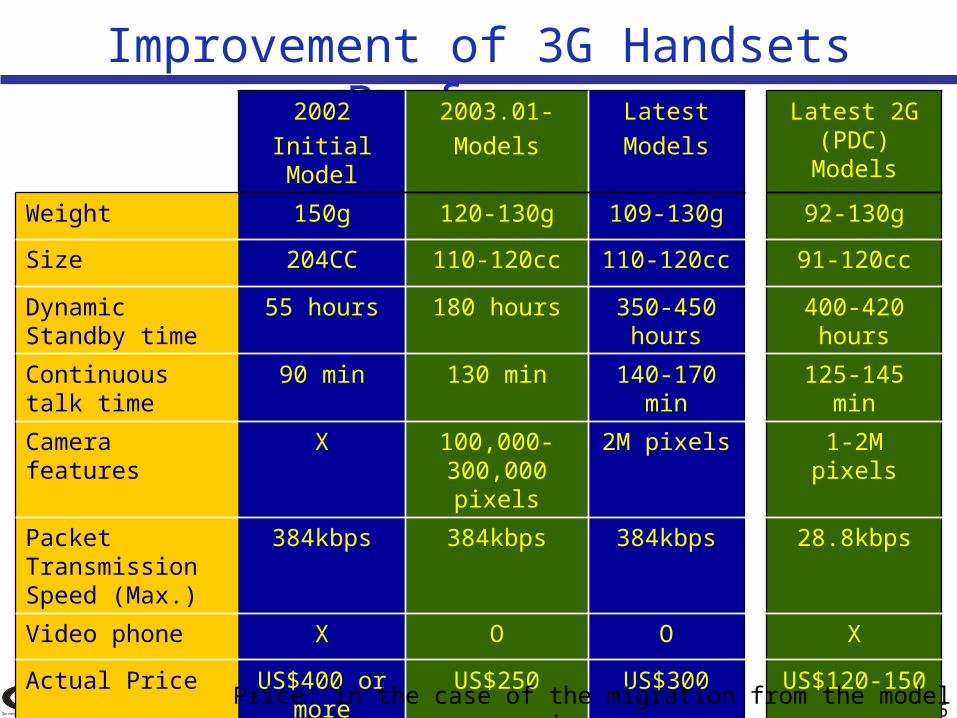
Improvement of 3G Handsets Performance 2002
Initial Model
2003.01-
Models
Latest
Models
Latest 2G (PDC) Models
Weight 150g 120-130g 109-130g 92-130g
Size 204CC 110-120cc 110-120cc 91-120cc
Dynamic Standby time
55 hours 180 hours 350-450 hours
400-420 hours
Continuous talk time
90 min 130 min 140-170 min 125-145 min
Camera features X 100,000-300,000 pixels
2M pixels 1-2M pixels
Packet Transmission Speed (Max.)
384kbps 384kbps 384kbps 28.8kbps
Video phone X O O X
Actual Price US$400 or more
US$250 US$300 US$120-150
Price: in the case of the migration from the model in use

7
Enriched Handset Lineup (1): FOMA 901i Series
The Basic
features of
FOMA 901i
handsets have
been upgraded!
Realistic audio-visual effects when using i-appli
3D sound X 3D graphics
Larger file size to store ring tones, “check-motion” video clips and i-mode mail attachment files
Expanded files size
Enhanced multimedia capabilityNotifies incoming mail with “chaku-motion” video clips, upgraded FlashTM functionality
Enhanced securitySecurity scan (anti-virus function), FeliCa remote lock
Convenient features
Menu screen (customized icons), Mail (chat mail), Installed music player in all models
SH901iC
F901iC
N901iC
D901i
P901i

8
Enriched Handset Lineup: Dual-mode FOMA+W-LAN handset
Allows businesses to create a complete IP-based corporate communication network.
Provides seamless voice and data access from both inside and outside office.
9
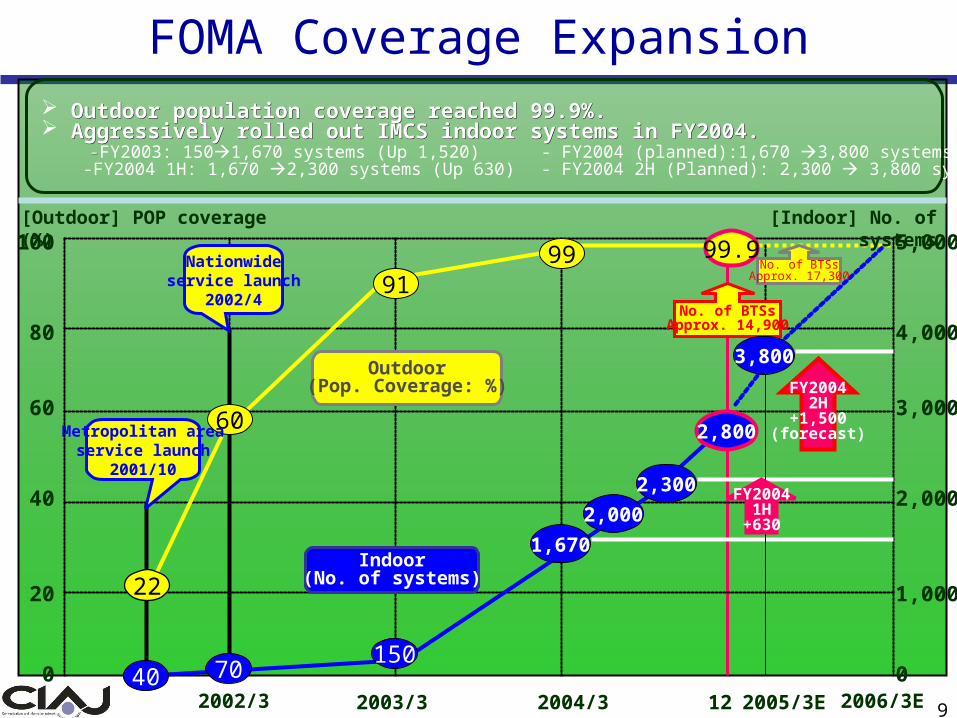
22
60
9199 99.9
Outdoor(Pop. Coverage: %)
Indoor(No. of systems)
[Outdoor] POP coverage (%)
FY20042H
+1,500(forecast)
FY20041H
+630
Nationwideservice launch
2002/4
Metropolitan areaservice launch
2001/10
[Indoor] No. of systems
No. of BTSsApprox. 14,900
40 70150
1,670
2,000
2,300
2,800
3,800
No. of BTSsApprox. 17,300
FOMA Coverage Expansion
0
20
40
60
80
100
0
1,000
2,000
3,000
4,000
5,000
2002/3 2003/3 2004/3 2005/3E 2006/3E12
Outdoor population coverage reached 99.9%.Outdoor population coverage reached 99.9%. Aggressively rolled out IMCS indoor systems in FY2004.Aggressively rolled out IMCS indoor systems in FY2004. --FY2003: 1501,670 systems (Up 1,520) - FY2004 (planned):1,670 3,800 systems (Up 2,130) -FY2004 1H: 1,670 2,300 systems (Up 630) - FY2004 2H (Planned): 2,300 3,800 systems (Up 1,500)
10
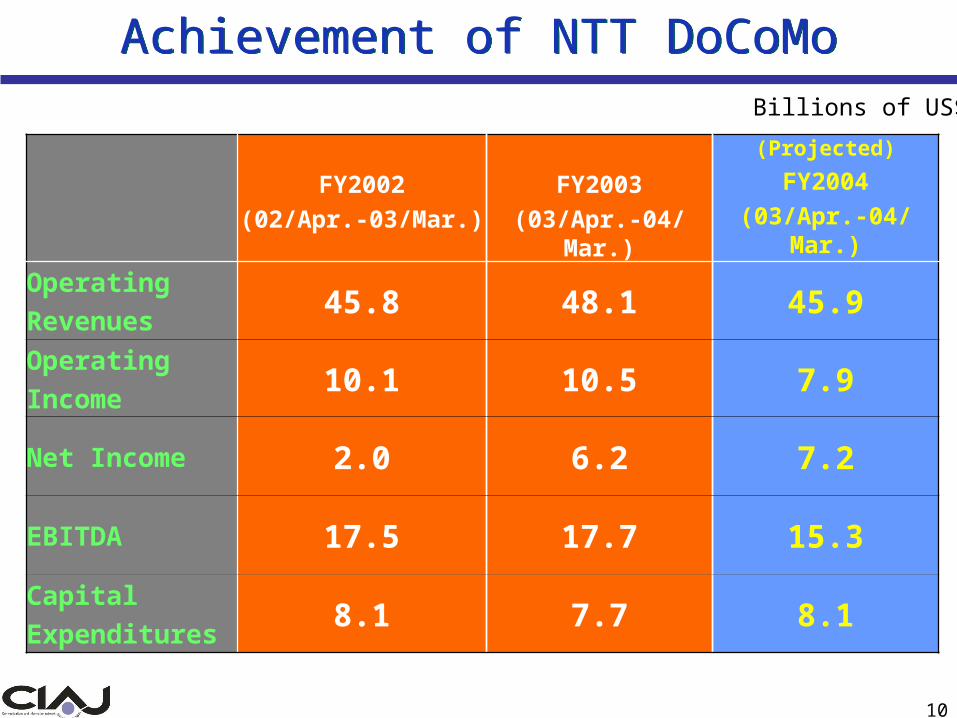
FY2002
(02/Apr.-03/Mar.)
FY2003
(03/Apr.-04/Mar.)
(Projected)
FY2004
(03/Apr.-04/Mar.)
Operating
Revenues45.8 48.1 45.9
Operating
Income10.1 10.5 7.9
Net Income 2.0 6.2 7.2
EBITDA 17.5 17.7 15.3
Capital
Expenditures8.1 7.7 8.1
Billions of US$
Achievement of NTT DoCoMoAchievement of NTT DoCoMo
11
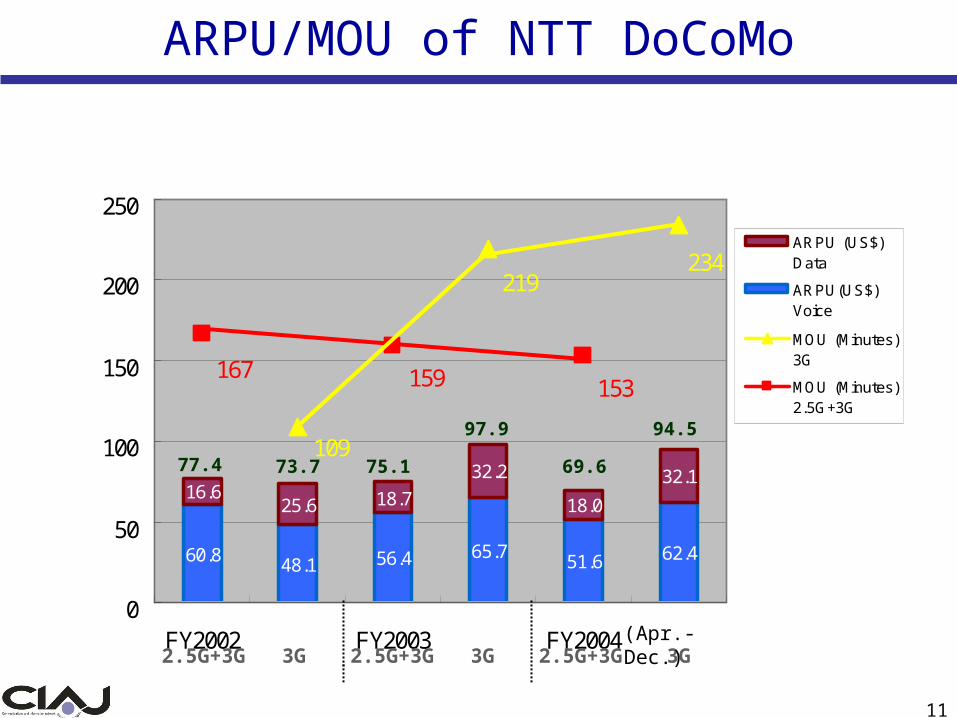
ARPU/MOU of NTT DoCoMo
60.8 48.1 56.4 65.7 51.6 62.4
16.625.6 18.7
32.2
18.0
32.1
153159167
109
234219
0
50
100
150
200
250
FY2002 FY2003 FY2004
ARPU (US$)Data
ARPU(US$)Voice
MOU (Minutes)3G
MOU (Minutes)2.5G+3G
2.5G+3G2.5G+3G 2.5G+3G 2.5G+3G3G 3G 3G
77.4 73.7 75.1
97.9
69.6
94.5
(Apr.-Dec)
60.8 48.1 56.4 65.7 51.6 62.4
16.625.6 18.7
32.2
18.0
32.1
153159167
109
234219
0
50
100
150
200
250
FY2002 FY2003 FY2004
ARPU (US$)Data
ARPU(US$)Voice
MOU (Minutes)3G
MOU (Minutes)2.5G+3G
2.5G+3G2.5G+3G 2.5G+3G 2.5G+3G3G 3G 3G
77.4 73.7 75.1
97.9
69.6
94.5
(Apr.-Dec.)

12
Linkage with Brick-and-Motor Businesses: Mobile Wallet Service
Released
mova model
Released
FOMA model
Released
new FOMA
models
Recommended