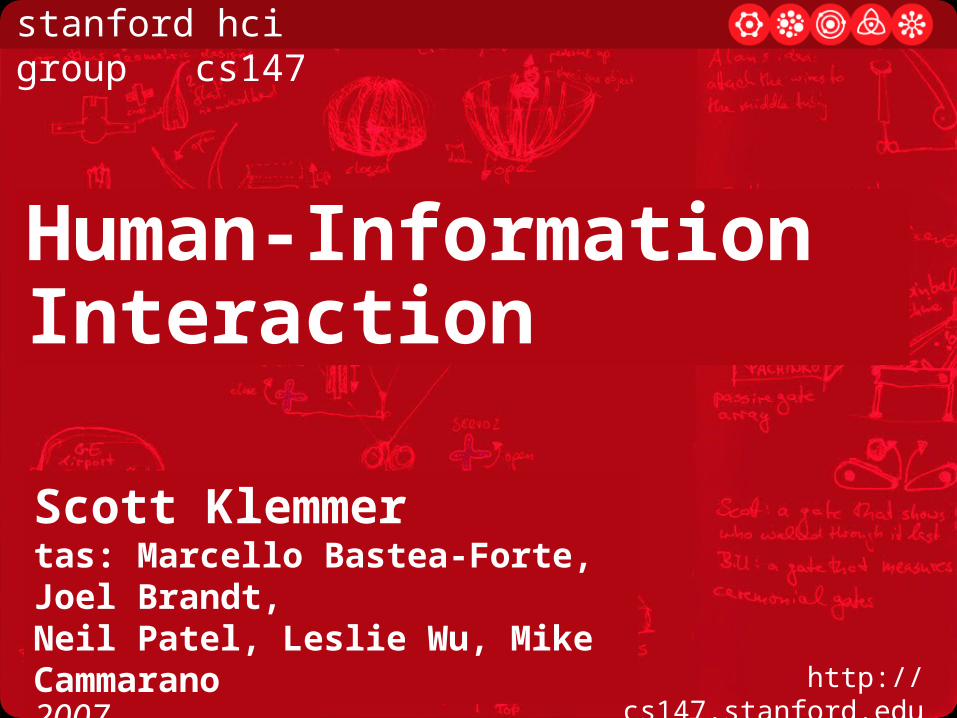
stanford hci group / cs147
http://cs147.stanford.edu06 November 2007
Human-Information Interaction
Scott Klemmertas: Marcello Bastea-Forte, Joel Brandt,Neil Patel, Leslie Wu, Mike Cammarano

Questions about the Project
Engelbart Video

Form Me to You

ADAPTIVE BEHAVIOR107 (months) SOCIAL Social Behavior
106 (weeks)
105 (days)
104 (hours) RATIONAL Adaptive Behavior
103
102 (minutes)
101 COGNITIVE Immediate Behavior
100 (seconds)
10-1 10-2 BIOLOGICAL 10-3 (msec)10-4
Meg Stewart

HUMAN INFORMATION INTERACTION
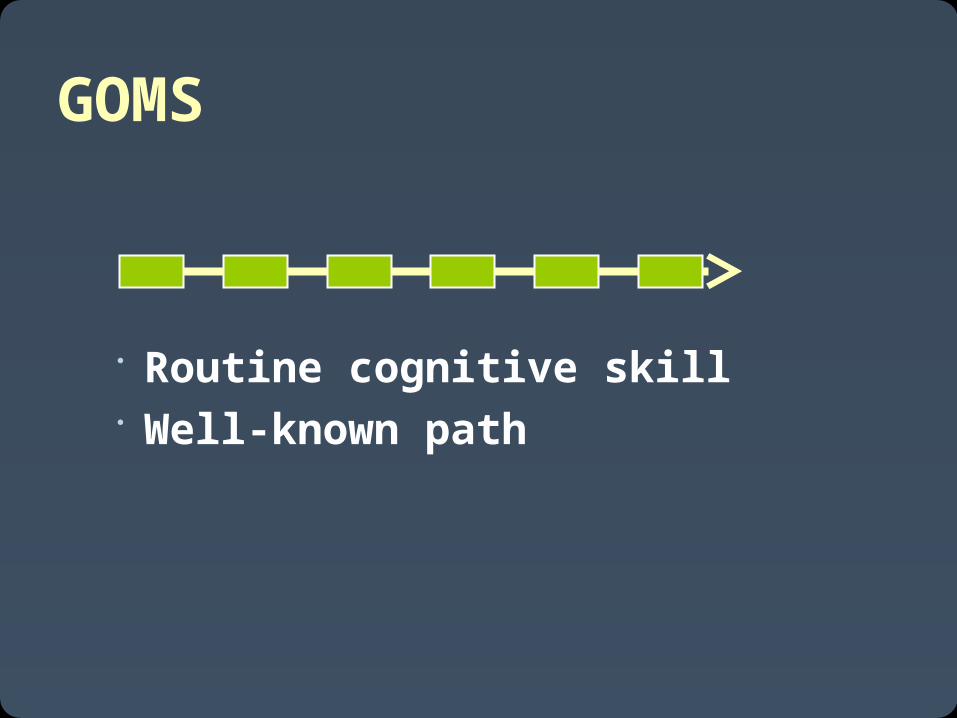
GOMS
Routine cognitive skill Well-known path
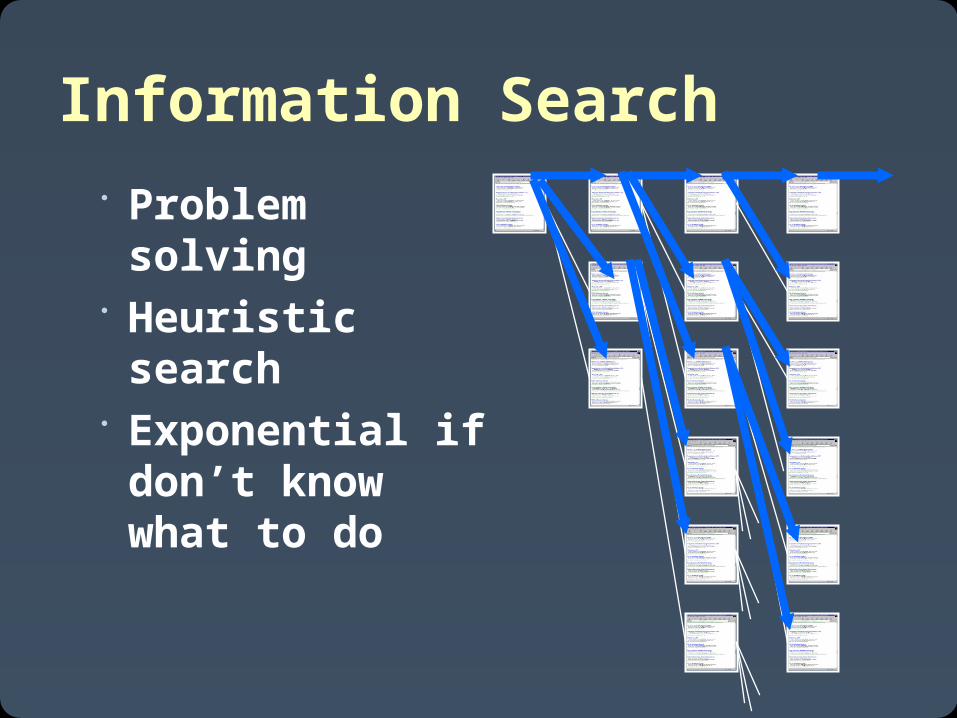
Information Search
Problem solving
Heuristic search
Exponential if don’t know what to do
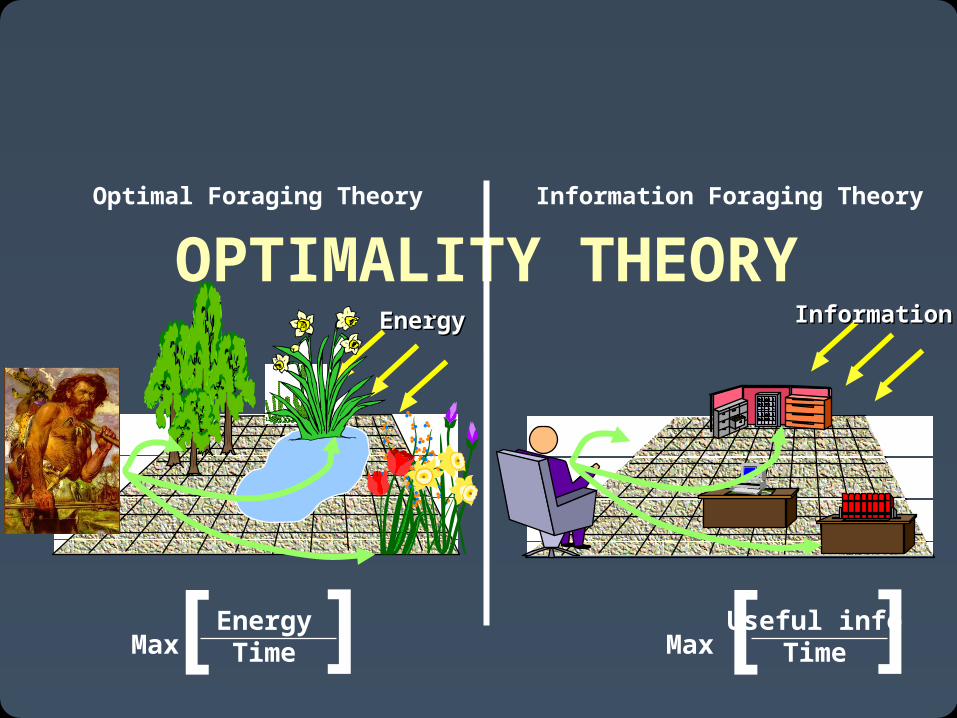
OPTIMALITY THEORYInformationInformationEnergyEnergy
MaxUseful info
TimeMaxEnergyTime [ ][ ]
Optimal Foraging Theory Information Foraging Theory
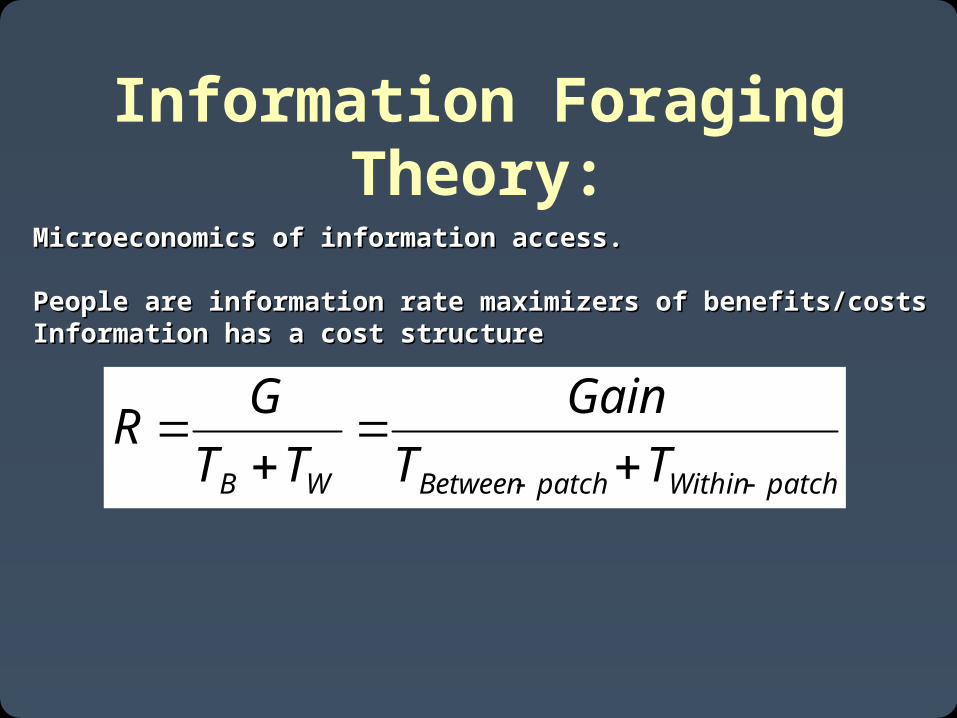
Information Foraging Theory:
patchWithinpatchBetweenWB TT
Gain
TT
GR
Microeconomics of information access.Microeconomics of information access.
People are information rate maximizers of benefits/costsPeople are information rate maximizers of benefits/costsInformation has a cost structureInformation has a cost structure
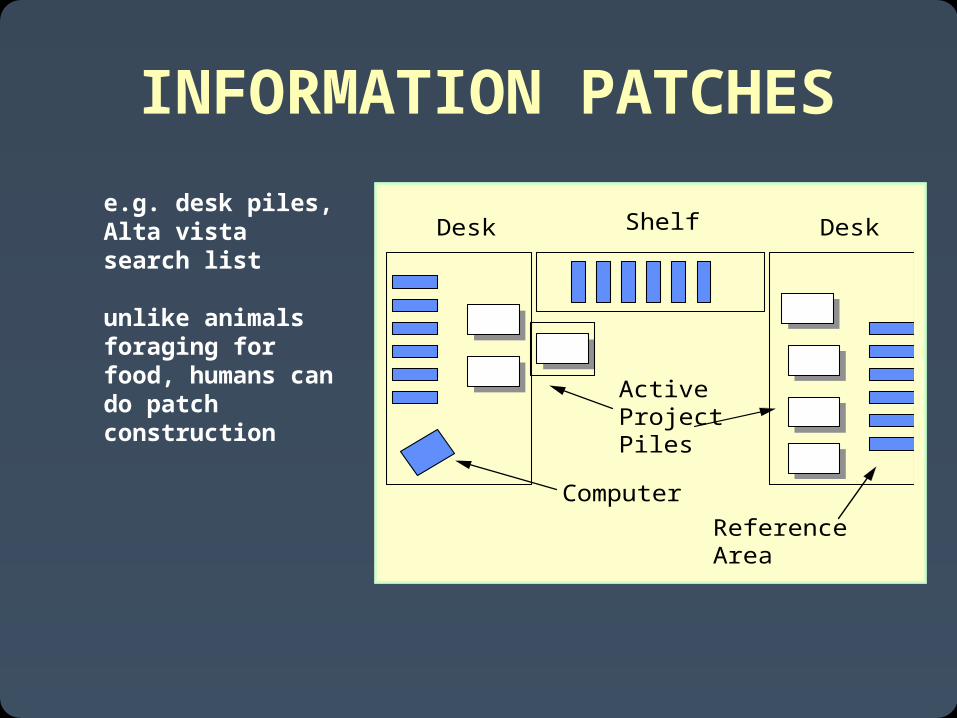
Desk DeskShelf
Computer
ActiveProjectPiles
ReferenceArea
INFORMATION PATCHES
e.g. desk piles,Alta vista search list
unlike animalsforaging for food, humans can do patch construction
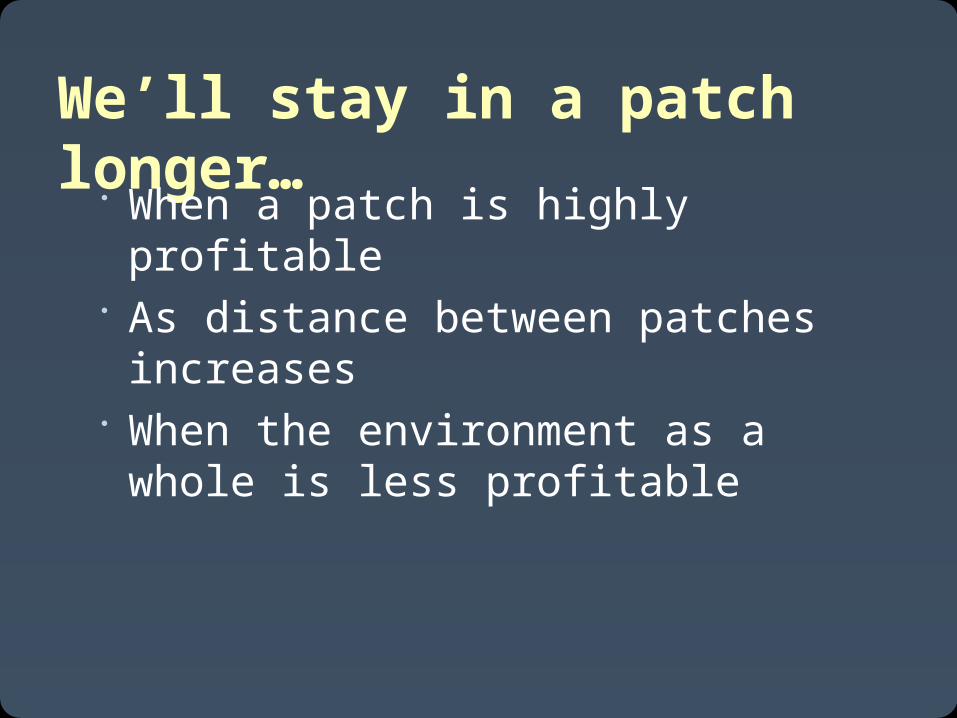
We’ll stay in a patch longer… When a patch is highly profitable
As distance between patches increases
When the environment as a whole is less profitable
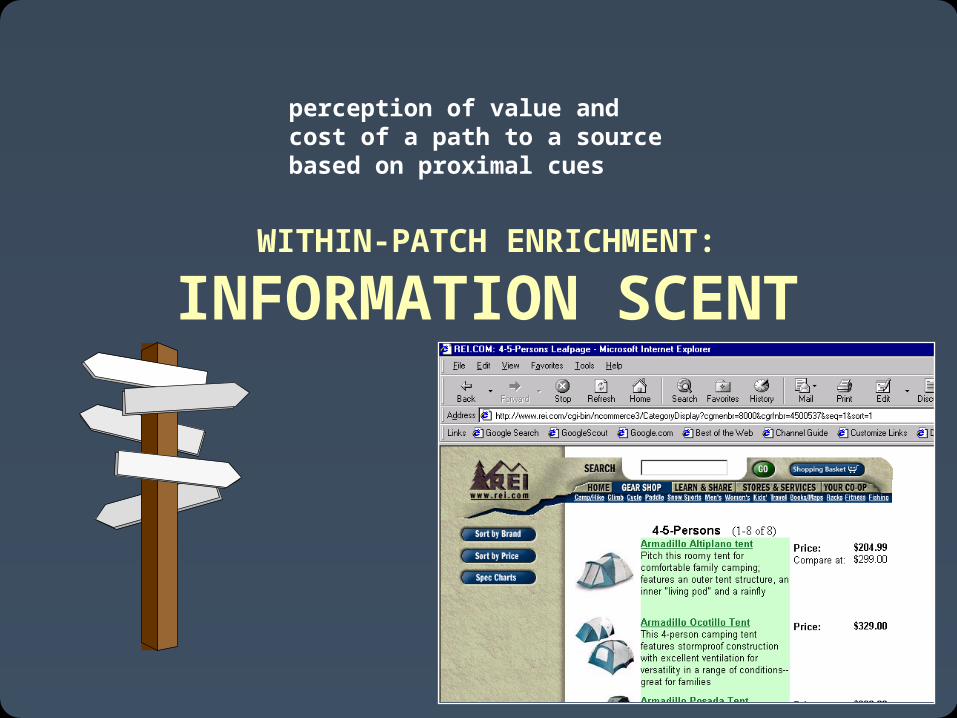
WITHIN-PATCH ENRICHMENT:
INFORMATION SCENT
perception of value and cost of a path to a source based on proximal cues
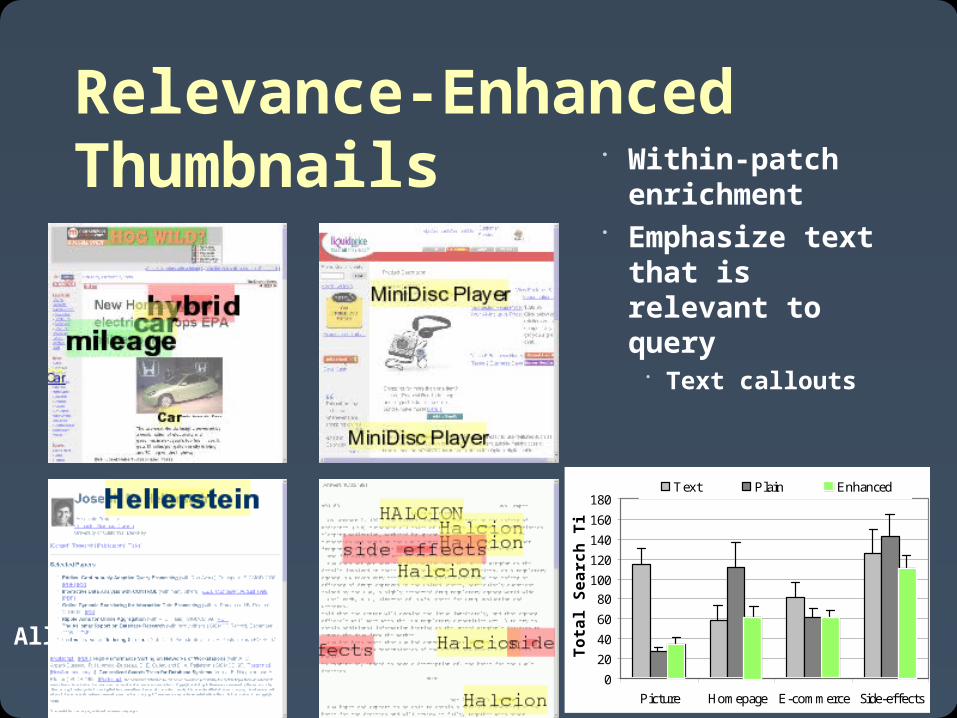
Relevance-Enhanced Thumbnails Within-patch
enrichment Emphasize text
that is relevant to query Text callouts
0
20
40
60
80
100
120
140
160
180
Picture Homepage E-commerce Side-effects
Tota
l Sea
rch
Tim
e (s
)
Text Plain Enhanced
Allison Woodruff
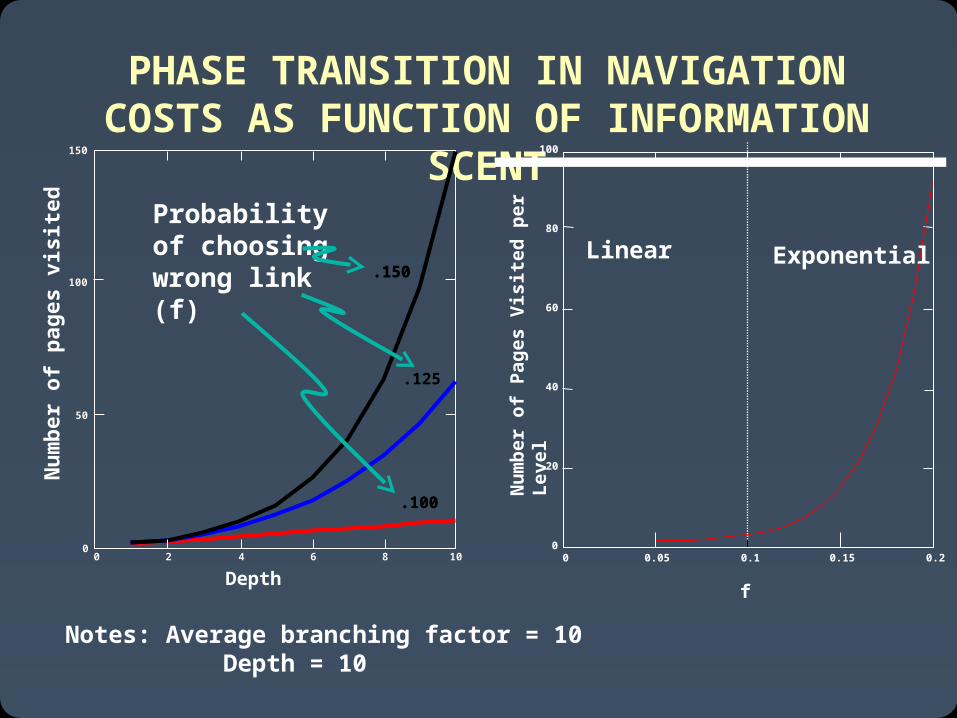
PHASE TRANSITION IN NAVIGATION COSTS AS FUNCTION OF
INFORMATION SCENT
Notes: Average branching factor = 10 Depth = 10
0 2 4 6 8 100
50
100
150
Depth
Nu
mb
er o
f p
ages
vis
ited
.100
.125
.150
0 2 4 6 8 100
50
100
150
.100
.150
Probability of choosing wrong link (f)
0 0.05 0.1 0.15 0.20
20
40
60
80
100
f
Nu
mb
er o
f P
ages
Vis
ited
per
Lev
el
Linear Exponential

IMPORTANCE FOR WEB DESIGN
Jarad Spool, UIE
Peter Pirolli
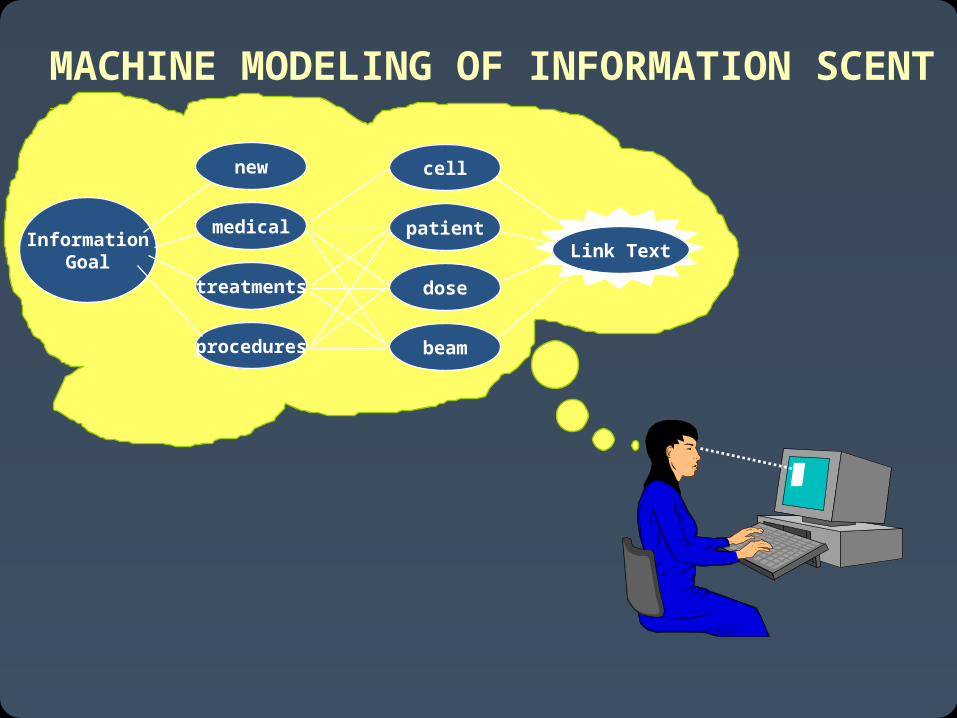
MACHINE MODELING OF INFORMATION SCENT
cell
patient
dose
beam
new
medical
treatments
procedures
InformationGoal
Link Text
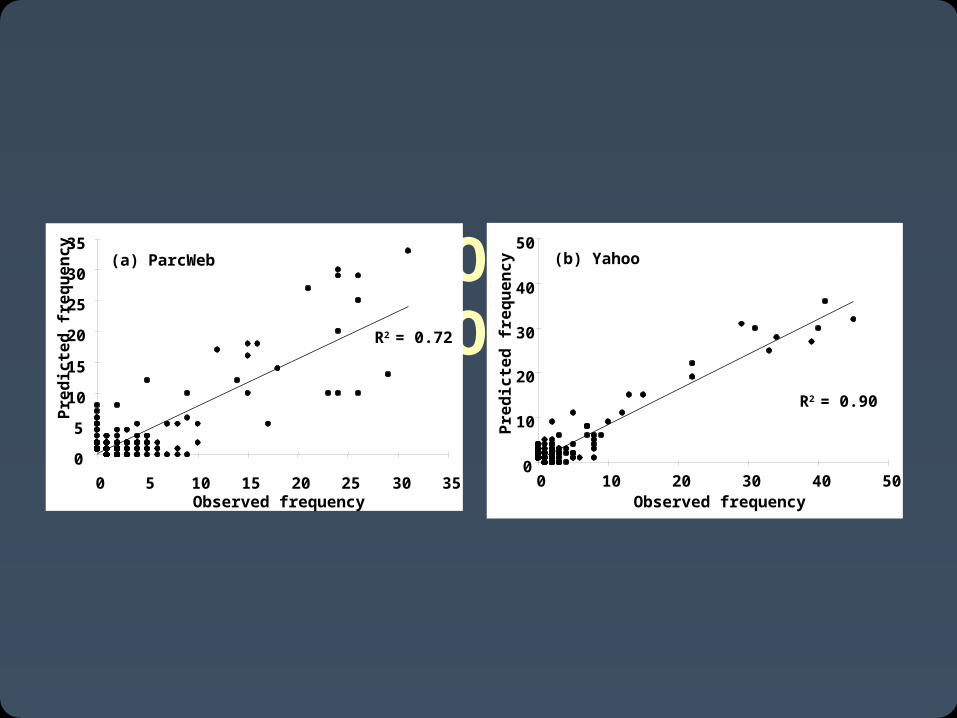
PREDICTION OF LINK CHOICER2
= 0.72
0
5
10
15
20
25
30
35
0 5 10 15 20 25 30 35Observed frequency
Pre
dic
ted
fre
qu
en
cy
R2 = 0.90
0
10
20
30
40
50
0 10 20 30 40 50Observed frequency
Pre
dic
ted
fre
qu
en
cy
(a) ParcWeb (b) Yahoo
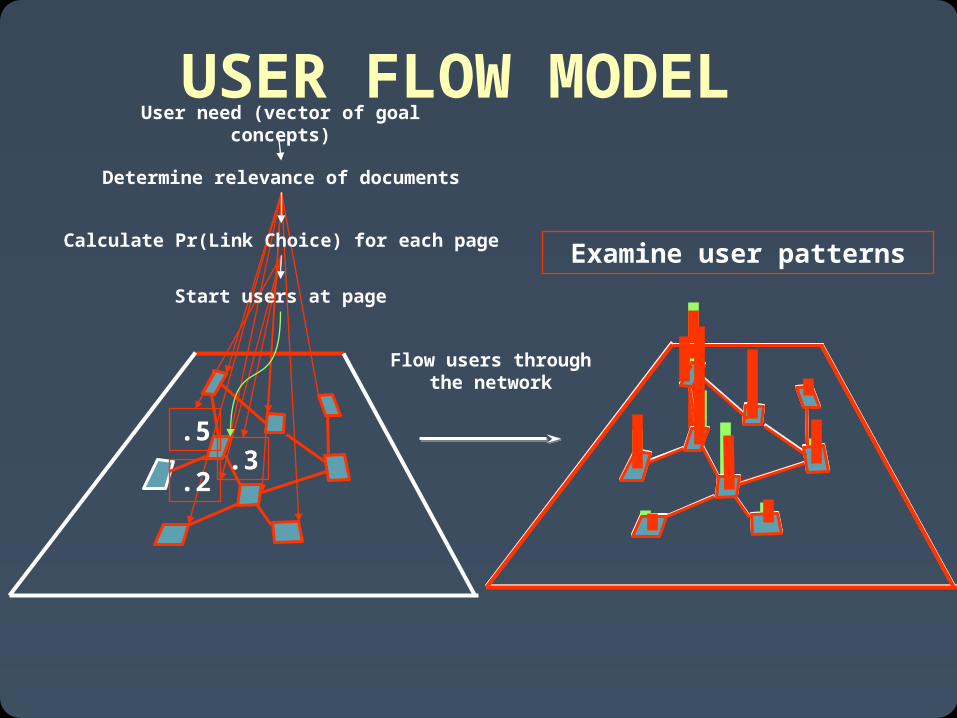
USER FLOW MODEL
Flow users through the network
User need (vector of goal concepts)
Determine relevance of documents
.5.3
.2
Calculate Pr(Link Choice) for each pageExamine user patterns
Start users at page
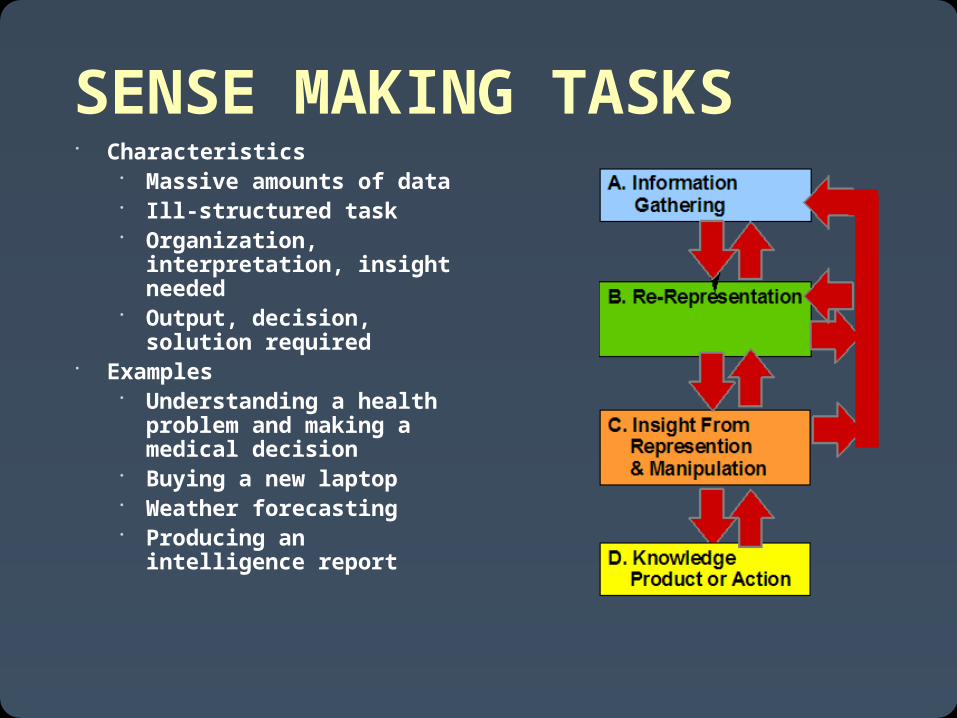
SENSE MAKING TASKS Characteristics
Massive amounts of data
Ill-structured task Organization,
interpretation, insight needed
Output, decision, solution required
Examples Understanding a health
problem and making a medical decision
Buying a new laptop Weather forecasting Producing an
intelligence report

Importance of Sensemaking 75% of “significant tasks” on the Web
are more than simple “finding” of information (Morrison et al., 2001) Understanding a topic (e.g., about health) Comparing/choosing products
Information retrieval does not support these tasks (Bhavnani et al., 2002) E.g., Estimated that one must visit 25
Web pages in order to read about 12 basic concepts about skin cancer
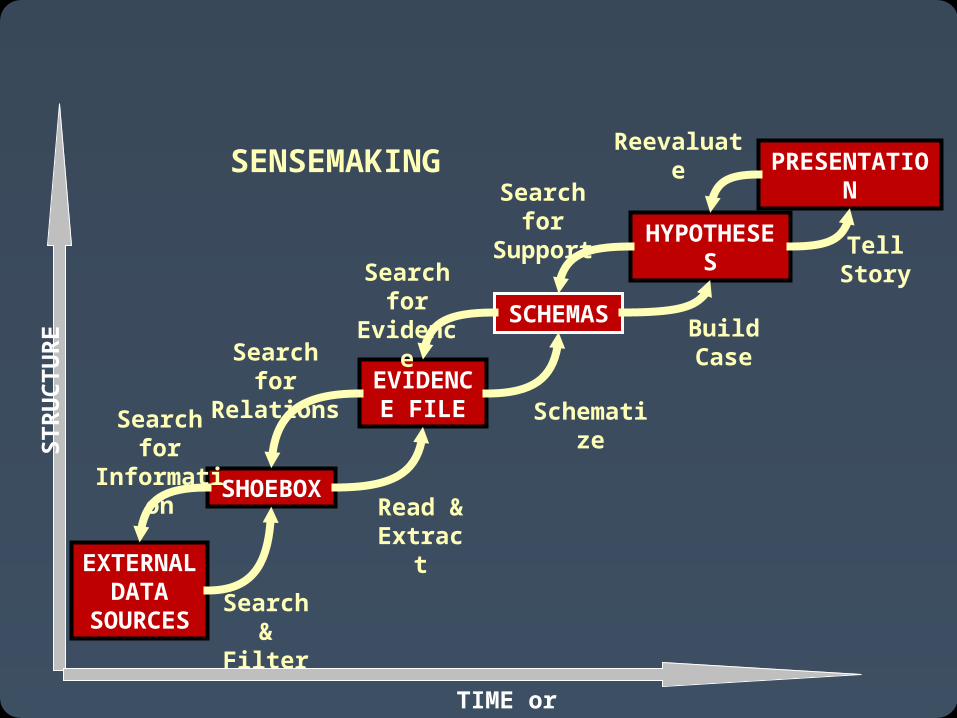
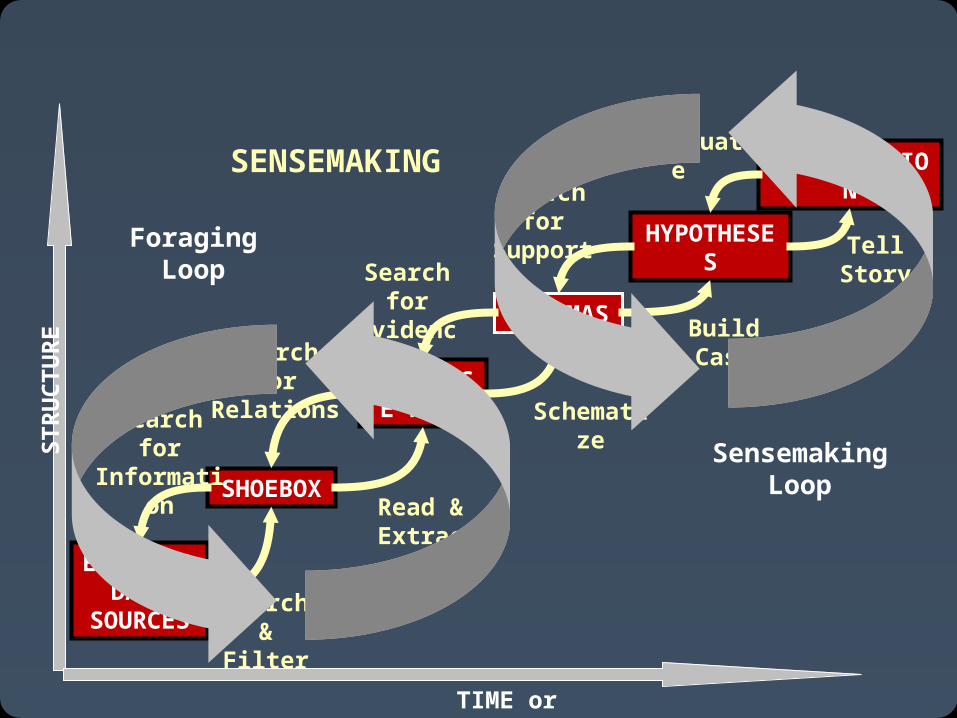
SENSEMAKING
SHOEBOX
EVIDENCE FILE
Search & Filter
Read & Extract
Schematize
Build Case
Tell Story
Search for Information
Search for Relations
Search for Evidence
Search for Support
Reevaluate
TIME or EFFORT
STR
UC
TUR
E
SCHEMAS
HYPOTHESES
PRESENTATION
EXTERNAL DATA
SOURCES
SENSEMAKING
SHOEBOX
EVIDENCE FILE
Search & Filter
Read & Extract
Schematize
Build Case
Tell Story
Search for Information
Search for Relations
Search for Evidence
Search for Support
Reevaluate
TIME or EFFORT
STR
UC
TUR
E
SCHEMAS
HYPOTHESES
PRESENTATION
EXTERNAL DATA
SOURCES
Sensemaking Loop
Foraging Loop

Credits & Further Reading This lecture draws heavily on Stu
Card’s slides on HII Peter Pirolli, Information Foraging
Recommended