HABs State of the Science
1
webinar series:HABs Data & ModellingHABs Data & Modelling
Speakers:Doug Kane – Defiance CollegeDoug Kane Defiance College
Brian Roe – Ohio State UniversityVal Klump – University of Wisconsin Milwaukee
I b ll B t i U i it f Mi hiIsabella Bertani – University of MichiganJohn Bratton – LimnoTechEd Verhamme ‐ LimnoTech
In partnership with:
June 2, 2016

G T W bi H k i It
2
GoToWebinar Housekeeping Items
S b it t t ti• Submit your text questions and comments using the Q ti P lQuestions Panel
• Note: This webinar is being recorded and will be posted on the HABs Collaboratory website
June 2, 2016
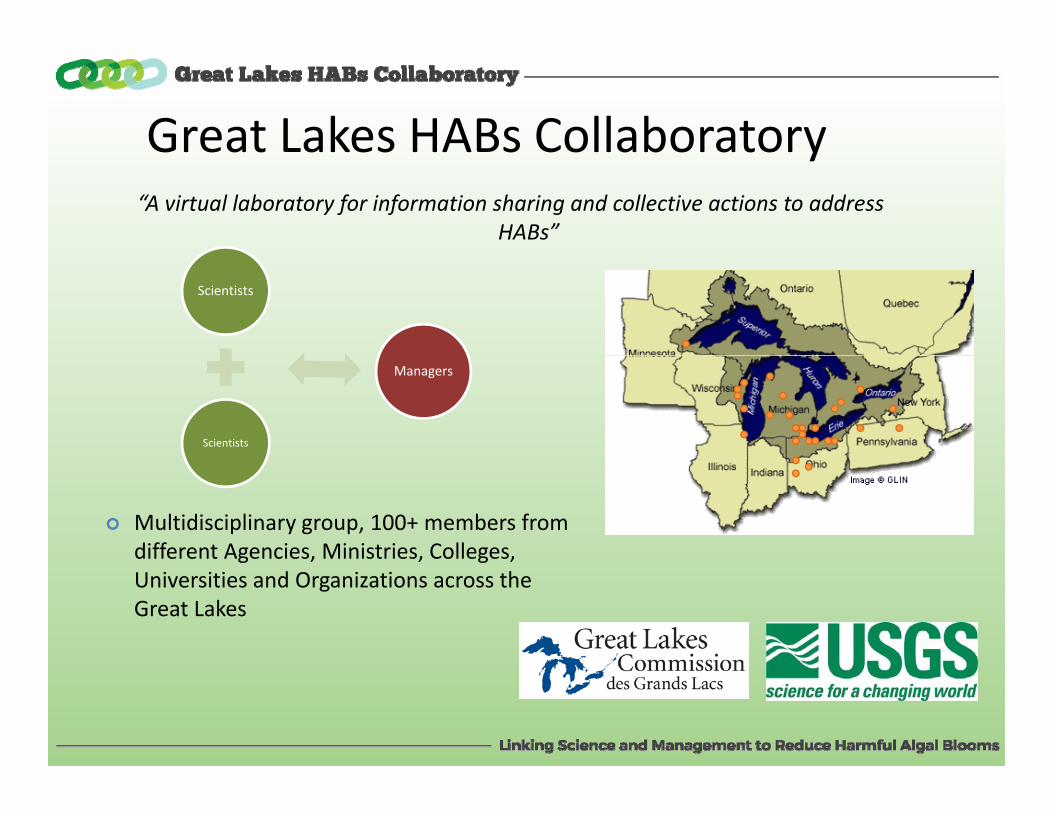
Great Lakes HABs CollaboratoryGreat Lakes HABs Collaboratory“A virtual laboratory for information sharing and collective actions to address
HABs”
Scientists
Scientists
Managers
Multidisciplinary group, 100+ members from different Agencies, Ministries, Colleges, g , , g ,Universities and Organizations across the Great Lakes

HABs State of the Science
4
webinar series• Result of the inaugural meeting of the HABs• Result of the inaugural meeting of the HABs Collaboratory– Identified need for communication betweenIdentified need for communication between researchers, and between researchers and managers
• Present on‐going research projects related to HABs in the Great Lakes region
• Goals:– Improve communication– Knowledge transferO t iti f ll b ti– Opportunities for collaboration
June 2, 2016

Ohio Sea Grant / OSU Stone LabOhio Sea Grant / OSU Stone Lab• Managing 55 HABS related projects (~$7,000,000)
– 18 funded by Ohio Sea Grant18 funded by Ohio Sea Grant– 5 funded by OSU’s Field 2 Faucet initiative– 32 funded under the Ohio Department of Higher Education
(OSU/UT; 18 vs. 14)(OSU/UT; 18 vs. 14)• Stone Lab Guest and Research Lecture Series
– June 16th, 23rd, 30th, July 7th, 14th, 28th, and August 4th7pm 9pm– 7pm ‐9pm
– https://ohioseagrant.osu.edu/news/calendar• 9/15/16 “State of Science” meeting in Toledo
S h h– Stranahan Theater– Modeling, BMPs, and Public Health‐Water treatment

6
LET'S HEAR IT FOR THE BUOYS?LET'S HEAR IT FOR THE BUOYS?‐‐ACCURACY OF DATA BUOYS FOR MONITORING ACCURACY OF DATA BUOYS FOR MONITORING
Doug Kane – Defiance College
CYANOBACTERIALCYANOBACTERIAL BLOOMS IN LAKE ERIEBLOOMS IN LAKE ERIE
June 2, 2016

Letʹs Hear it for the BuoysLetʹs Hear it for the Buoys??‐‐Accuracy Accuracy of Data Buoys for Monitoring of Data Buoys for Monitoring yy y gy gCyanobacterial Blooms in Lake ErieCyanobacterial Blooms in Lake Erie
Douglas D. Kane1,2 ([email protected]) g ( )Justin D. Chaffin1 (chaffin.46@ osu.edu)
1Franz Theodore Stone Laboratory 2Defiance College

MicrocystisMicrocystis PlanktothrixPlanktothrixW t B i • Sandusky Bay• Western Basin
• Surface scums• Produces microcystin
• Sandusky Bay• Does not form surface
scumsy• Produce microcystin
0 meter
1 meter
2 meter
3 meter
4 meter
5 meterIntake
Lake bottom
5 meterpipe
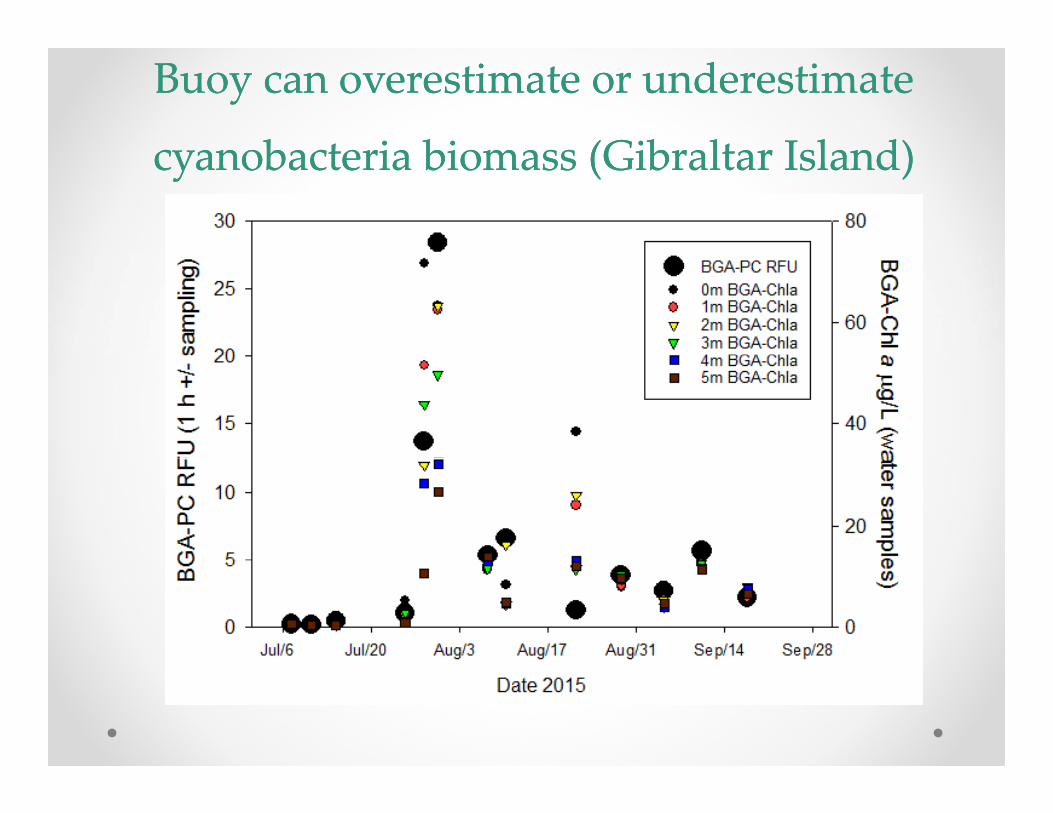
Buoy can overestimate or underestimate Buoy can overestimate or underestimate
cyanobacteria biomass (Gibraltar Island)cyanobacteria biomass (Gibraltar Island)cyanobacteria biomass (Gibraltar Island)cyanobacteria biomass (Gibraltar Island)

HABHAB C ll b tC ll b tHABs HABs CollaboratoryCollaboratory• Has anyone done similar studies in different systems y y
(i.e. Green Bay, Saginaw Bay)?• Does anyone have an in situ vertical profiler/ glider?
11
OHIO OHIO RESIDENTS’ WILLINGNESS TO RESIDENTS’ WILLINGNESS TO ( )( )
Brian Roe – Ohio State University
PAY (WTP) TO REDUCE LAKE ERIE PAY (WTP) TO REDUCE LAKE ERIE HABSHABS
June 2, 2016
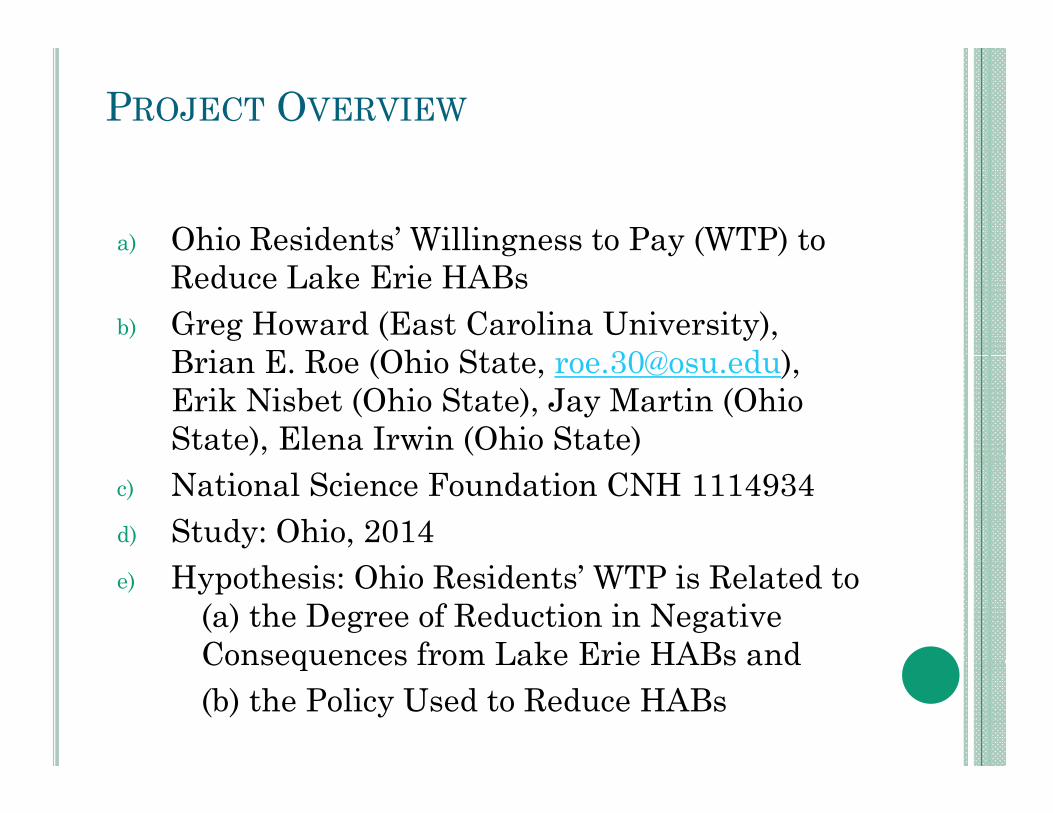
PROJECT OVERVIEW
a) Ohio Residents’ Willingness to Pay (WTP) to ) g y ( )Reduce Lake Erie HABs
b) Greg Howard (East Carolina University), B i E R (Ohi St t 30@ d ) Brian E. Roe (Ohio State, [email protected]), Erik Nisbet (Ohio State), Jay Martin (Ohio State), Elena Irwin (Ohio State)
c) National Science Foundation CNH 1114934d) Study: Ohio, 2014e) Hypothesis: Ohio Residents’ WTP is Related to
(a) the Degree of Reduction in Negative Consequences from Lake Erie HABs and Consequences from Lake Erie HABs and (b) the Policy Used to Reduce HABs

APPROACH
a) Statewide online survey (n = 1210) ) y ( )includes a hypothetical choice experiment that requires respondents to choose between competing policies with randomly assigned policies with randomly assigned
a) implementation mechanisms a) Fertilizer Tax leading to higher food pricesb) Income tax with voluntary programs for farmersb) Income tax with voluntary programs for farmersc) Income tax with increased farmer regulationsd) Sales tax with voluntary programs for farmerse) Sales tax with increased farmer regulationse) Sales tax with increased farmer regulations
b) reductions in the extent of Lake Erie HABs and its negative consequences in terms of fish kills and beach closures.

SUMMARY OF FINDINGS
a) What did you learn from your work?A O f i. Aggregate annual WTP in Ohio for a 10% reduction in the negative consequences of Lake Erie HABs (baseline is 2011 HABs and consequences) is about $150 million.
i. PRELIMINARY: Please don’t cite without permissioni. PRELIMINARY: Please don t cite without permissionii. WTP is linear in the size of the reduction of the
consequences, e.g., a 20% reduction is valued at $300 million
b) What happened that you didn’t expect? There was no change in WTP among a smaller panel of
respondents who answered the survey both before and after the August 2014 Toledo water quality crisisafter the August 2014 Toledo water quality crisis.
c) Relevant conclusions for water quality managers? Ohio residents place considerable monetary value on
reducing the impacts of HABs reducing the impacts of HABs

HABS COLLABORATORY
a) What questions still need to be answered about ) qHABs?
Are the differences we observe in WTP robust to different descriptions of the reductions in the different descriptions of the reductions in the consequences of HABs and sensitive to the way program implementation details are described?
How much do residents outside of Ohio value How much do residents outside of Ohio value reductions in Lake Erie HABs?
b) How can collaboration help your research? Replication in other states Linking to biophysical models that predict
consequences of HABs valued by residentsconsequences of HABs valued by residents
16
GREEN GREEN BAY HYPOXIA: BIOGEOCHEMICAL BAY HYPOXIA: BIOGEOCHEMICAL DYNAMICS, WATERSHED INPUTS AND DYNAMICS, WATERSHED INPUTS AND
Val Klump – University of Wisconsin‐Milwaukee
CLIMATE CHANGE (NOAA CSCORCLIMATE CHANGE (NOAA CSCOR))
June 2, 2016

PROJECT OVERVIEW
G B H i Bi h i l D i Green Bay Hypoxia: Biogeochemical Dynamics, Watershed Inputs and Climate Change (NOAA CSCOR)
Restoring the health of the Green Bay ecosystem under a changing climate: Modeling land use, management, and future outcomes (Michigan
C )Water Center)
Transitioning Science to Management: Ecological and Socio-economic Tradeoffs of Ecological and Socio economic Tradeoffs of Hypoxia and Hypereutrophication in the Green Bay, Lake Michigan Ecosystem (pending – NOAA CSCOR)
Project Team: J. Val Klump, UW-Milwaukee, Kevin Fermanich, Paul Baumgart, Mike Zorn, UW-Green Bay, Hector Bravo, James Waples, Sajad Hamidi, Shelby LaBuhn, UW-Milwaukee, Joe Depinto, Ed Verhamme, Dan Rucinski, LimnoTech LLC, David Lorenz, Center for Climatic Research, UW-MadisonClimatic Research, UW Madison
Bill Hafs, Erin Wilcox, NEW Water, Keith Marquardt, WDNR, Chad Cook, Ken Genskow, UW-Extension, Michael Finney, Oneida Nation, Julia Nordyk, WI Sea Grant
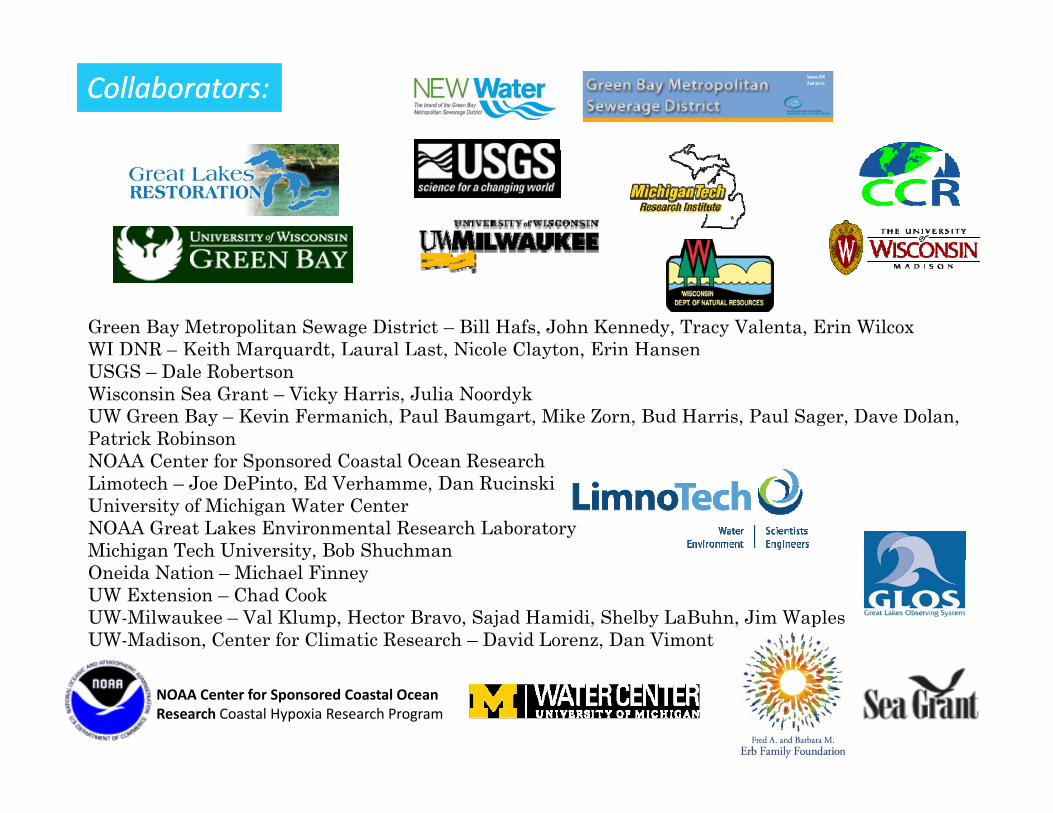
Collaborators:Collaborators:Collaborators:Collaborators:
Green Bay Metropolitan Sewage District – Bill Hafs, John Kennedy, Tracy Valenta, Erin WilcoxWI DNR – Keith Marquardt, Laural Last, Nicole Clayton, Erin HansenW R e t a qua dt, au a ast, co e C ayto , a seUSGS – Dale RobertsonWisconsin Sea Grant – Vicky Harris, Julia NoordykUW Green Bay – Kevin Fermanich, Paul Baumgart, Mike Zorn, Bud Harris, Paul Sager, Dave Dolan, Patrick RobinsonNOAA C t f S d C t l O R hNOAA Center for Sponsored Coastal Ocean ResearchLimotech – Joe DePinto, Ed Verhamme, Dan RucinskiUniversity of Michigan Water CenterNOAA Great Lakes Environmental Research LaboratoryMichigan Tech University, Bob ShuchmanOneida Nation – Michael FinneyUW Extension – Chad CookUW-Milwaukee – Val Klump, Hector Bravo, Sajad Hamidi, Shelby LaBuhn, Jim WaplesUW-Madison, Center for Climatic Research – David Lorenz, Dan Vimont
NOAA Center for Sponsored Coastal Ocean Research Coastal Hypoxia Research Program
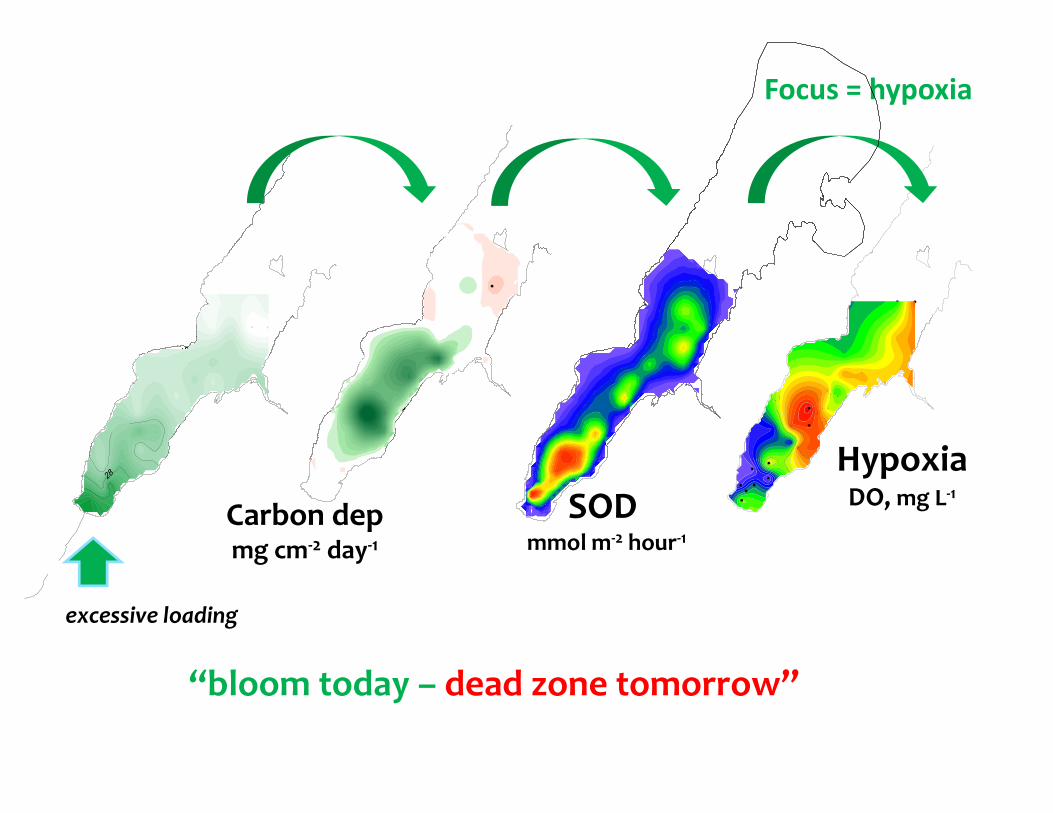
Focus = hypoxia
Chl
50
50
50
50
50
50Chl
HypoxiaCarbon depmg cm‐2 day‐1
SOD mmol m‐2 hour‐1
HypoxiaDO, mg L‐1
g y
excessive loading
“bloom today – dead zone tomorrow”

Approach: develop linked models → be er informed managementApproach: develop linked models → be er informed management
Linked Green Bay Model
Ad d A ti E t M d l Advanced Aquatic Ecosystem Model (A2EM)

Develop metrics/end points –
ChlChl fluorfluor ugug/L/L MicrocystinMicrocystin 00--17 ppb17 ppb
areal extent of hypoxia
150
200
400000-1 1-2 mg/L2-3 dead zone
area
, km2
50
100
5
acres
20000
30000
2010 2011 2012 2013 2014 2015 2016 0
50
0
10000
Li k d t h d bi h i l h d d i
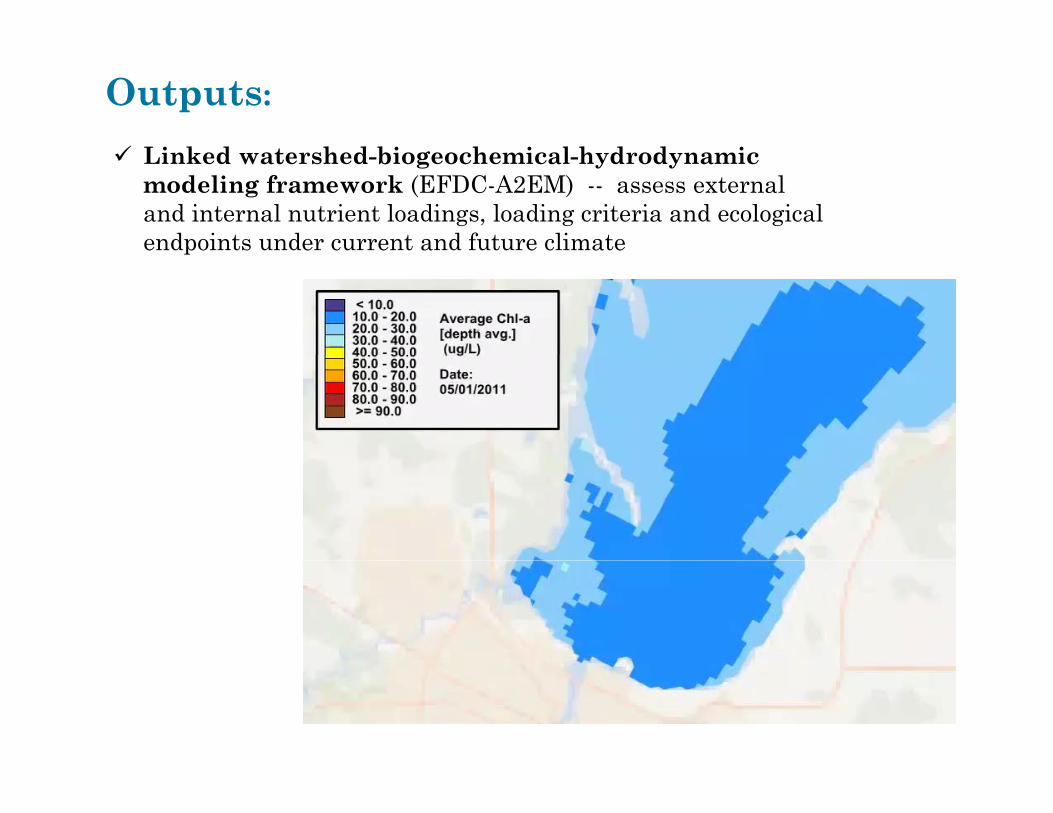
Outputs:
Linked watershed-biogeochemical-hydrodynamic modeling framework (EFDC-A2EM) -- assess external and internal nutrient loadings, loading criteria and ecological endpoints under current and future climatep
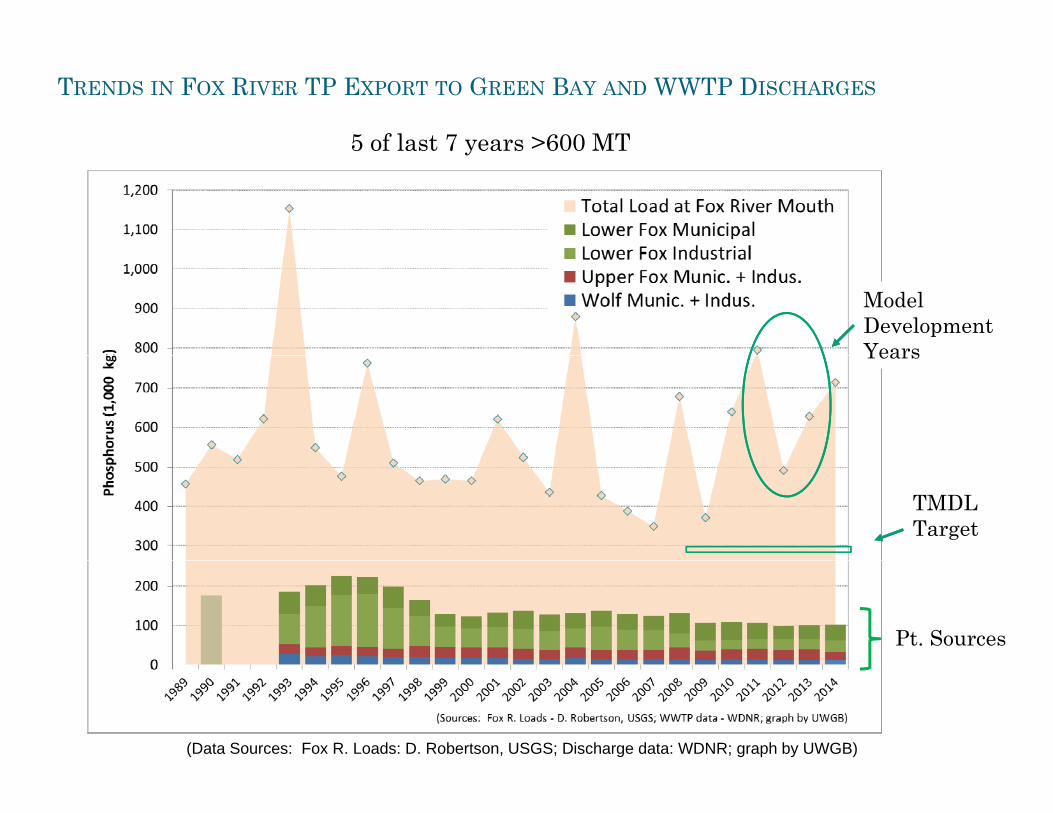
TRENDS IN FOX RIVER TP EXPORT TO GREEN BAY AND WWTP DISCHARGES
5 of last 7 years >600 MT 5 of last 7 years 600 MT
Model Development YearsYears
TMDL Target
Pt. Sources
(Data Sources: Fox R. Loads: D. Robertson, USGS; Discharge data: WDNR; graph by UWGB)

D EDan EganMilwaukee JS Sept. 12-13, 2014

End User BMPs are modeled at the local watershed scale to inform
Outputs: End User BMPs are modeled at the local watershed scale to inform
selection of basin wide scenarios to meet bay load response targets
Ag Management Scenarios Many CombinationsBaseline 90% full inversion tillage (CT), 43 ppm STPCash rotation BMP 45% MT, 40% NTDairy fields NRCS Standards ( d d il P) R d S il P 25 (50%)(reduced soil P) Reduce Soil P to 25 ppm (50%)Reduced Till ‐ Dairy 15 ‐ 65% CT and 10 ‐ 40% NTCover Cropping after Corn Silage forage and non‐forage CC, up to 75%Managed Grazing 10‐50% of Dairy croplandReduced Till + Cover Crop combinationsReduced Till + Cover Crop combinationsReduced Till + Graze combinationsCover Crop + Graze combinationsReduced Till + Cover Crop + Graze, With andWithout reduced STP CashWith and Without reduced STP, Cash Crop BMPs Extensive BMP implementation 31 modeled sub-basins

Bottom line =40-50%
reduction
Chl a
reduction needed
baseline
50% reduction
Dissolved Oxygen

Driven by land useDriven by land use
Next steps:Next steps:
yy
Next steps:Next steps:
•• Management practices: Management practices: •• Management practices: Management practices: •• What is possible?What is possible?
H ill h b d?H ill h b d?•• How will the bay respond?How will the bay respond?•• What impact will changing What impact will changing
climate impart?climate impart?

28
QUANTITATIVE QUANTITATIVE SYNTHESIS OF DIFFERENT SYNTHESIS OF DIFFERENT LONGLONG‐‐TERM CHAB MONITORING TERM CHAB MONITORING
Isabella Bertani – University of Michigan
PRODUCTS IN WESTERN LAKE PRODUCTS IN WESTERN LAKE ERIEERIE
June 2, 2016

PROJECT OVERVIEWQ i i h i f diff l CHAB Quantitative synthesis of different long-term CHAB monitoring products in western Lake Erie
Isabella Bertani1, Cara E. Steger1,2, Daniel R. Obenour3, Gary L. , g , , yFahnenstiel1,4, Thomas B. Bridgeman5, Thomas H. Johengen6, Michael J. Sayers7, Robert A. Shuchman7, Donald Scavia1
1 Water Center, Graham Sustainability Institute, University of Michigan2 Graduate Degree Program in Ecology, Natural Resource Ecology Lab, Colorado State University3 Department of Civil, Construction, & Environmental Engineering, North Carolina State University,4 Great Lakes Research Center, Michigan Technological University5 Department of Environmental Sciences and Lake Erie Center, University of Toledo6 C i i f i l d h i i f i hi6 Cooperative Institute for Limnology and Ecosystems Research, University of Michigan7 Michigan Tech Research Institute, Michigan Technological University
Funding SourceUM W CUM Water Center Project Location & Study yearsWestern Lake Erie, 2002-2013 Research question Research questionWhat is the degree of coherence of different CHAB monitoring approaches when modeling relationships with environmental drivers?
APPROACH
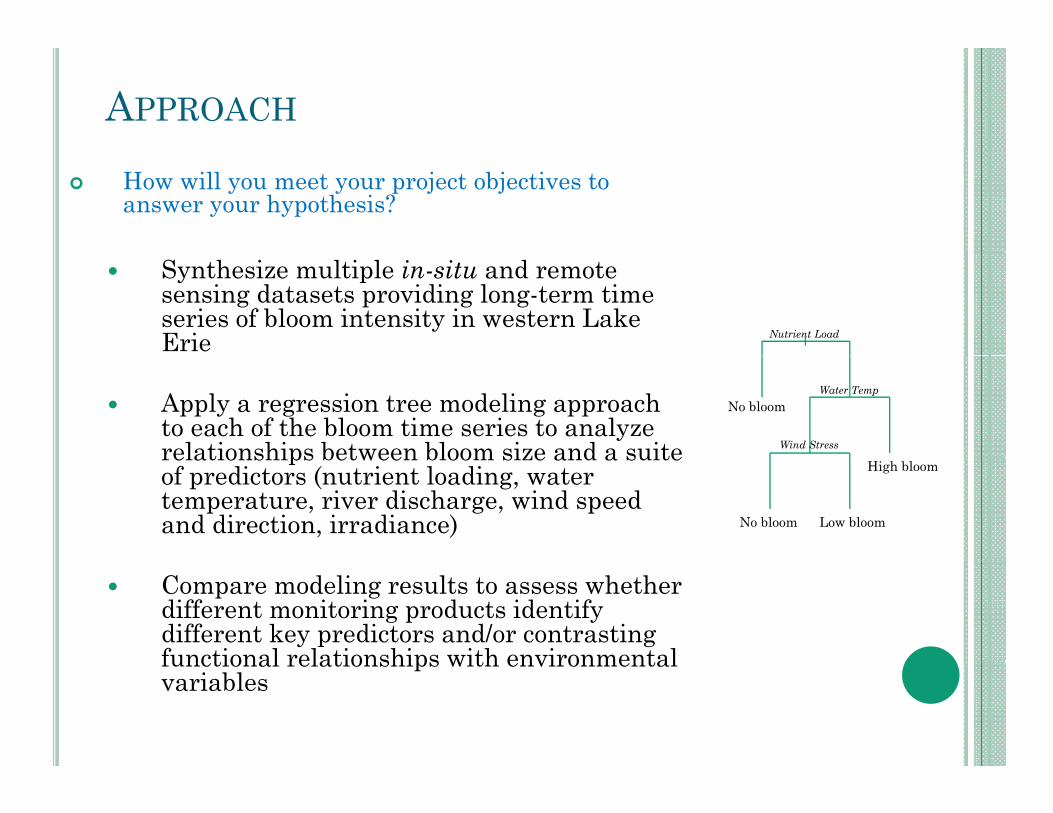
How will you meet your project objectives to answer your hypothesis?
Synthesize multiple in-situ and remote sensing datasets providing long-term time series of bloom intensity in western Lake Erie Nutrient Load
Apply a regression tree modeling approach to each of the bloom time series to analyze relationships between bloom size and a suite
No bloomWater Temp
Wind Stressrelationships between bloom size and a suite of predictors (nutrient loading, water temperature, river discharge, wind speed and direction, irradiance) No bloom Low bloom
High bloom
Compare modeling results to assess whether different monitoring products identify different key predictors and/or contrasting functional relationships with environmental functional relationships with environmental variables

SUMMARY OF FINDINGS
Remarkable consistency of modeling results with known gecological requirements of cyanobacteria for some variables (e.g., nutrient loading, water temperature, tributary discharge) p , y g )
Inconsistencies across monitoring products in the relative importance, h d i f th d l d shape, and sign of the modeled
relationships with variables characterized by high short-term variability, such as wind forcing
→ Importance of integrating multiple types of bloom measurements in CHAB modeling measurements in CHAB modeling approaches
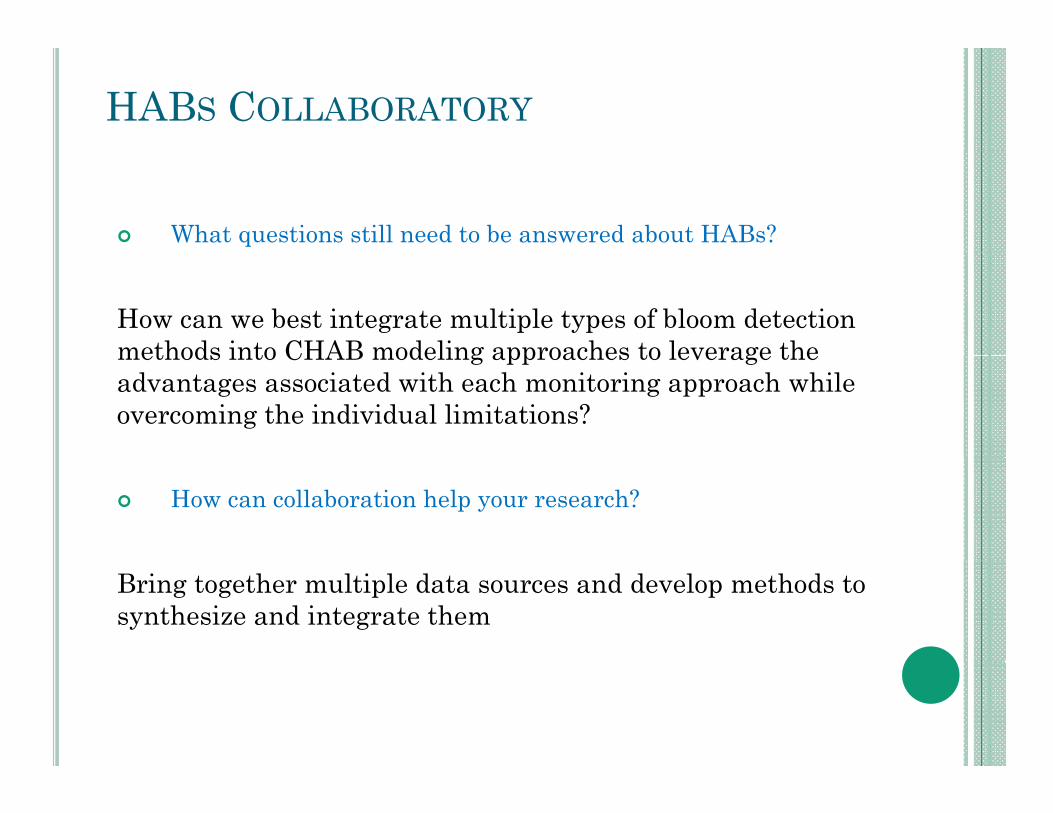
HABS COLLABORATORY
What questions still need to be answered about HABs?
How can we best integrate multiple types of bloom detection methods into CHAB modeling approaches to leverage the methods into CHAB modeling approaches to leverage the advantages associated with each monitoring approach while overcoming the individual limitations?
How can collaboration help your research?
Bring together multiple data sources and develop methods to synthesize and integrate them

33
USING USING MODELS TO LINK HABS TO MODELS TO LINK HABS TO NUTRIENTNUTRIENT LOADSLOADSJohn Bratton – LimnoTech
NUTRIENT NUTRIENT LOADSLOADS
June 2, 2016

PROJECT OVERVIEW
a) Using Models to Link HABs to Nutrient Loads) gb) John Bratton, LimnoTechc) Funding: USEPA, USACE, Univ. of Toledod) Western Lake Erie, 2014-2016e) Hypothesis: Numerical models can be used
ff ti l t d t d i l t d effectively to understand, simulate, and forecast HABs

APPROACH) Link watershed lake and ecological modelsa) Link watershed, lake, and ecological models
b) Use data on nutrient loads, weather, lake conditions, and biology to calibrate and drive , gymodels
c) Use calibrated models to simulate scenarios d f t bland forecast blooms
EFDC & SEDTRAN
SWANHydrodynamic
Sub-Model
SWAN
Wind-WaveSub-Model
Shear Stress
Hydrodynamics•Water level•Current velocity
Wind-Waves•Significant height•Direction•Frequency
•Current velocity
Sediment Transport Sub-Model
N t i t & Water Quality Linkage
•Frequency
A2EMNutrient &
EutrophicationSub-Model
Water Quality Linkage•Flows•Suspended solids•Settling/resuspension rates

LOAD-RESPONSE: EMPIRICAL
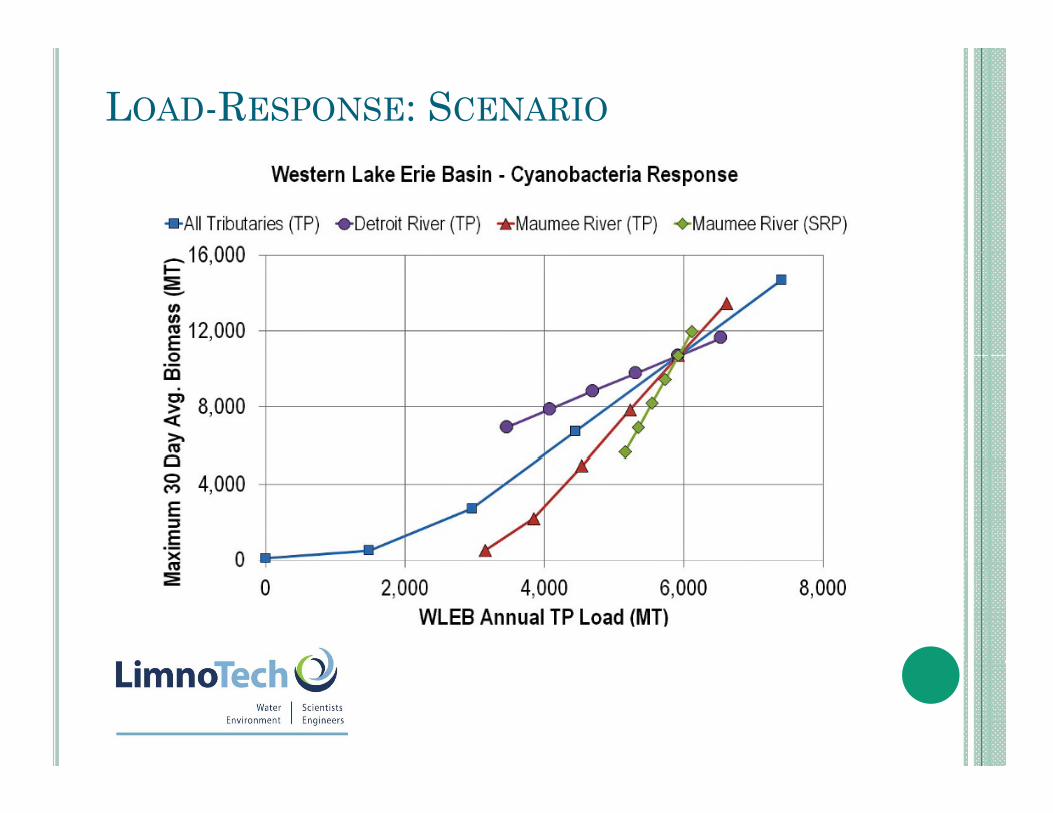
LOAD-RESPONSE: SCENARIO

BLOOM SEASON HINDCAST SCENARIOS
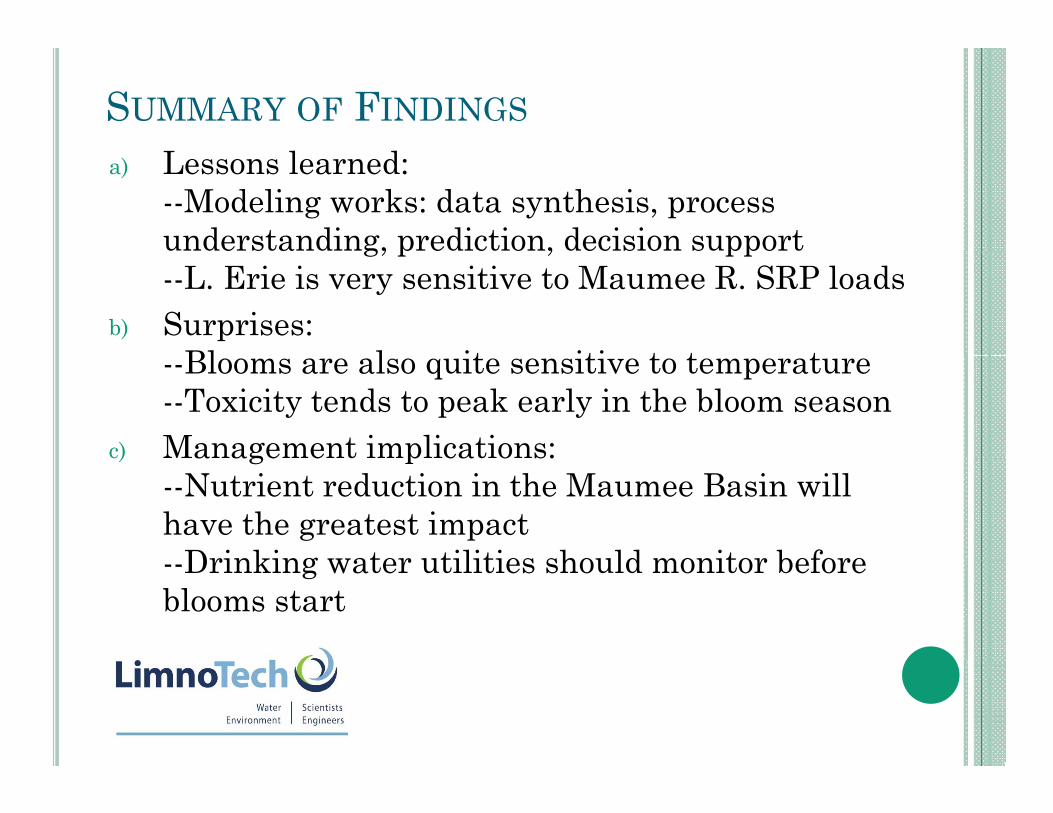
SUMMARY OF FINDINGS a) Lessons learned:
--Modeling works: data synthesis, process understanding, prediction, decision supportg, p , pp--L. Erie is very sensitive to Maumee R. SRP loads
b) Surprises: Bl l it iti t t t --Blooms are also quite sensitive to temperature
--Toxicity tends to peak early in the bloom seasonc) Management implications: c) a age e t p cat o s:
--Nutrient reduction in the Maumee Basin will have the greatest impact
Drinking water utilities should monitor before --Drinking water utilities should monitor before blooms start

HABS COLLABORATORY
a) Remaining questions:) g q--environmental controls on toxin production--roles of non-dominant HAB species
3D HAB behavior--3D HAB behavior--most effective management and operational modeling approaches
b) How can collaboration help?--divide-and-conquer efficiency--refining of research agendarefining of research agenda

41
HARMFUL HARMFUL ALGAL BLOOM ALGAL BLOOM MONITORINGMONITORING NETWORKNETWORKEd Verhamme– LimnoTech
MONITORING MONITORING NETWORKNETWORK
June 2, 2016
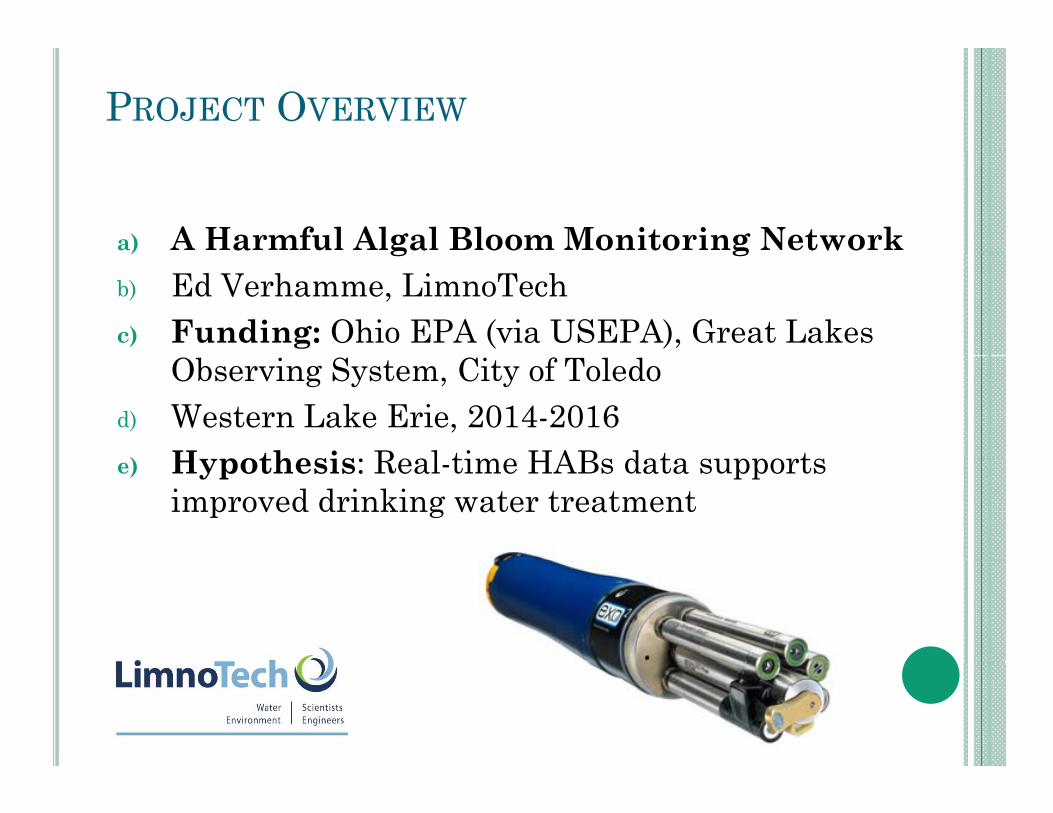
PROJECT OVERVIEW
a) A Harmful Algal Bloom Monitoring Network) g gb) Ed Verhamme, LimnoTechc) Funding: Ohio EPA (via USEPA), Great Lakes
Observing System, City of Toledod) Western Lake Erie, 2014-2016
) H th i R l ti HAB d t t e) Hypothesis: Real-time HABs data supports improved drinking water treatment

2015 HABS REAL-TIME MONITORING
• Temperature• pH & ORP• Conductivity
Ashtabula
• Conductivity• Turbidity• Dissolved Oxygen• Chlorophyll
Avon M bl h dOregonToledo Mentor
• Phycocyanin
Lake
Elyria
MarbleheadPort Clinton
g

2014 CITY OF TOLEDO LAKE MONITORING

2014 CITY OF TOLEDO LAKE MONITORING

2015 CITY OF TOLEDO LAKE MONITORING

GLOS HABS DATA VIEWER
http://habs.glos.us

TOLEDO & PORT CLINTON - AUG 2015 BGABGA

SNEAK PEAK - UNIVERSITY OF TOLEDO HABS DATASET
14 yrs of HABs/nutrient ydata from 7 primary stations
Tom Bridgeman @

SUMMARY OF FINDINGSa) Lessons learned:
--Sharing “research” data with decision makers is extremely valuable, BUT need to educate audience--Sonde data trends track microcystin well
b) Surprises: --Once data management was in place getting Once data management was in place getting participation from other partners was easy(er).--Maintaining QA/QC (and centralizing) is difficult
) M g t i li ti c) Management implications: --New “real-time” on the ground tools to assess HABs presence w/strong correlation to toxin trends--Decreased operational costs

HABS COLLABORATORY
a) Remaining questions:--What does a sustainable funding model for th d ti l il t j t l k lik ?the pseudo-operational pilot project look like?--Can we better understand the phycocyanin/microcystin relationships to have a better proxy for toxin trends?
b) How can collaboration help?Use data from the sonde network in your --Use data from the sonde network in your
research!!!--Work with us to share additional (research) data with decision makers.

52
HABs Data & Modelling
Questions?
In partnership with:
June 2, 2016
Coming up next:HABs Blooms Sources & Movements
Thursday June 23, 2016 1:00 p.m. (EDT)y , p ( )HABs & Safe Drinking Water – July 7, 2016
HABs Blooms Detection, Composition & Effects – TBDlHABs Blooms Sources & Toxicity ‐ TBD
HABs & Public Health – TBDHABs Blooms Monitoring & Forecasting – TBD
HABs: Educate and Engage ‐ TBD
To learn more about the HABs Collaboratory and the HABs State of the S i W bi S i i iScience Webinar Series, visit us at:
http://glc.org/projects/water‐quality/habs/
Recommended