Interpreting Instrument Data
1
David Rees Gillette, PE, PhD
Evaluation of Instrumentation Data
Reasons for Installing Instruments
• Design– Gather information used for design work
• Construction– Verify design assumptions– Safety of construction workers (e.g. potential slope instability)– Control construction (e.g. monitor concrete temperatures)
• First Reservoir Filling• Long-term Performance
– Specific issues (potential failure modes)– General health monitoring– General understanding of dam and damsite
• Dealing With Unexpected Performance• Research• Legal
What are we looking for in the data?Evidence that the dam is performing adequately, or that it is not.
• Are the data consistent with expected behavior from theory and engineering analysis?
• Are they consistent with previous months and years?
• If not, why?
• Whether or not the data are as expected, is there a dam-safety deficiency we must act upon?

Interpreting Instrument Data
2
For an existing dam:
• Understand the geology and design!
• Monitor for changes in:– Locations of visible seepage
– Amount of seepage
– Water pressures (piezometric levels)
– Sediment that could be from internal erosion
– Deformation or movement of embankment or concrete structures
4
Can you conclude that all Potential Failure Modes are very unlikely?
• Internal Erosion
• Embankment slope instability
• Concrete dam sliding or deformation
• Concrete deterioration
• After extreme loadings (earthquake or flood)
For a new dam:• Understand the geology before you design it!
• Determine expected behavior of instruments
• Closely monitor (instruments and visual) embankment, foundation, abutments, and reservoir during first filling– Visible seepage
– Measured seepage quantities
– Rising piezometers
– Settlement and deflection
– Landslides
Do observations agree with what the designers expected? 6

Interpreting Instrument Data
3
Causey Dam Initial Reservoir Filling
Not by instruments alone…
• Instrument data
• Visual observation
• Theory and analysis
We are ENGINEERS, not ROBOTS.
Bright Green Vegetation on Dam Abutment in the Desert

Interpreting Instrument Data
4
This inspector found water where we never saw it before, and there is NOT thick green vegetation.
When We Need Data Review
• Immediate Review of Data (as it is received)• Somewhat cursory – much data to handle
• Timely detection of significant anomalies
• Computers can be a big help
• Periodic In-Depth Review• Looking at the bigger picture, seeking deeper
understanding
• Compare data obtained by different instrument types
• Allows immediate reviews to be more effective
• Unusual Loading or Unexpected Behavior – Is a PFM developing?
Limitations on Instruments(Not Just Instrument Failure)• "False positive" – Because of instrument
data, you see a developing failure when there really isn't one.– Increased weir flow due to rain or melting snow
– Windblown soil in weir box, not internal erosion
– Clogged drains / cleaned drains
• "False negative" – Monitoring fails to detect a failure that is actually developing. – The instruments are simply not in the right place –
they can't be everywhere.
– Not exactly sure what to look for

Interpreting Instrument Data
5
Immediate Data Review
?
Data Review Process• Data check as readings are entered in the
instrumentation computer database

Interpreting Instrument Data
6
Is this normal performance?Observation Wells and Piezometers
Expected Performance (R = Reservoir Elevation)
Instrument
MinimumExpected
Piezometric Water Surface Elevation
(in feet)
Maximum Expected
Piezometric Water Surface Elevation
(in feet)
Minimum Expected Depth to Water*(in feet)
MaximumExpected Depth to Water**(in feet)
PTP-1.5-2B (0.15 x R) + 3467.1 (0.15 x R) + 3472.4 51.2 22.1
PTP-3-3-A (0.39 x R) + 2477.6 (0.39 x R) + 2487.0 44.0 65.4
PTP-3-3-B (0.26 x R) + 3005.5 (0.26 x R) + 3012.0 48.7 71.2
PTP-4.5-1A (0.46 x R) + 2191.0 (0.46 x R) + 2198.0 43.5 64.7
PTP-4.5-1B (0.22 x R) + 3170.0 (0.22 x R) + 3175.5 58.6 70.9
PTP-6.5-1A 4112.4 4113.4 30.6 31.6
PTP-6.5-1B 4073.0 4076.0 68.0 71.0
PTP-8-2A 4123.0 4124.0 20.6 21.6
PTP-8-2B (0.60 x R) + 1625.6 (0.60 x R) + 1636.4 27.6 57.0
TITP-1 (0.11 x R) + 3617.7 (0.11 x R) + 3621.8 10.5 17.9
TOW-1 (0.13 x R) + 3534.3 (0.13 x R) + 3538.5 11.8 19.9
TOW-2 (0.12 x R) + 3575.6 (0.12 x R) + 3579.8 15.9 23.8
TOW-3 (0.13 x R) + 3534.5 (0.13 x R) + 3539.0 13.4 21.8
TOW-4 (0.13 x R) + 3535.7 (0.13 x R) + 3539.5 11.3 19.0
* The values are associated with a “high” reservoir elevation of 4136.0 feet. ** The values are associated with a “low reservoir elevation” of 4105.0 feet.# Vibrating-wire frequency readings are obtained for these instruments, rather than depths.
Table of expected piezometer ranges for quick check, based on data thus far and understanding of seepage
Periodic In-Depth Review• Comprehensive Review (CR) - Once each 8
years• Inspection
• Review of design and previous analyses
• Review of all performance data
• Updated flood and earthquake hazard
• Probabilistic risk analysis
• Update requirements for future performance monitoring
• Recommendations for maintenance and dam-safety actions

Interpreting Instrument Data
7
• Technical Response Team (TRT) Meeting and Periodic Facility Review (PFR) - Once each 8 years, midway between CRs.• Inspection
• Review of performance data
• Requirements for future monitoring
• Update requirements for future performance monitoring
• Recommendations for maintenance and dam-safety actions
Periodic In-Depth Review
Periodic In-Depth Review• Plots of data throughout the existence of the
dam – look for changes with time.
• Check that ranges of expected readings make sense with respect to design, foundation conditions, and previous data.
• Verify that the instruments work properly
• Decide which instruments should continue to be used, and whether any new ones or replacements are needed.
Portraying Data for Review and Analysis – Time and Space

Interpreting Instrument Data
8
Piezometers Plotted With Time
What's happening here?
Data Plotted Against Reservoir Level
Rapid piezometer response incoarse soil or fractured bedrock
Slow piezometer response in material with low permeability.
Slow Response
1
1
3
2
2
3

Interpreting Instrument Data
9
Rapid Filling of Reservoir, Sustained Full Reservoir, Then Rapid Lowering
When the reservoir reaches approximately elevation 4325, more pervious seepage paths are apparently available
Rapid Piezometer Response, Not Linear

Interpreting Instrument Data
10
Different Seepage Paths for Different Reservoir Elevations?
Relatively Impervious
Relatively Pervious
El. 4325
Slope Stability and Embankment Deformation
Monitoring
• Visual monitoring
• Surveyed monuments
• Water pressures
• Inclinometer
• Shear strip
Inclinometeror Shear Strip
Slope StabilityLongitudinal Cracking at the Crest

Interpreting Instrument Data
11
Potential for Transverse Cracking of an Embankment Dam
“Mechanically” Induced Transverse Cracks (due to differential settlement of the foundation)
Low compressibility Foundation material
High compressibilityFoundation material
Transverse Cracking(may not be visible at crest if surface is gravel)
Embankment Dam Settlement Points
~2.5 m

Interpreting Instrument Data
12
Individual settlement points plotted with time
Settlement profiles for different dates
Is there influence from the reservoir?

Interpreting Instrument Data
13
Deflection• Inclinometers
45 cm movement on shear plane in shale bedrock before inclinometer became unusable
Piezometers and Inclinometers Shown on Section View of Embankment and Abutment
Inclinometer Casing Broken Here
Piezometer Readings
45 cm movement on shear plane in shale bedrock before inclinometer became unusable
Inclinometer -Profile of Movements with Depth

Interpreting Instrument Data
14
Replacement Inclinometer Plotted with Depth and Specific Depths with Time
Or, as Vectors in Plan View
Need picture of a concrete dam
Concrete Dams
Stresses to compare to model resultsMeasure strains compute stressesTemperatures important input

Interpreting Instrument Data
15
Visual Evidenceof Structural Distress
Evidence of Structural Distress
Evidence of Structural Distress
Plumbline Data

Interpreting Instrument Data
16
Concrete Gravity Dams
Collimation System for Deflection
Concrete Gravity DamDeflection with Time and Reservoir Load
Uplift Pressure Data With Time
AB C D E

Interpreting Instrument Data
17
Uplift Pressure Data With Location
Pressure Diagram Showing That Grout and Drains Are Effective
AB C D E
100%
0%
Percentage of Full Reservoir Pressure
Grout Curtain
Drilled Foundation
Drains
Formed Drainsin Body of Dam
AB C D E
AB C D E
Reservoir Level
Drain FlowGallons/Minute
Unusual Loading or Unexpected Behavior
• Earthquake (typically, 0.05 g or more)
• Extreme Flood
• A New Seep
• Observed Crack, Void, or Depression
Interpreting Instrument Data
18
Upstream Face of Rudramata Dam2001 Bhuj Earthquake, IndiaRepublic Day, 2001
Post-Earthquake Inspection
Post-Earthquake Inspection
• Visible / Measurable Deformation
• Cracking
• Changes in Seepage - Quantity, Location, Turbidity!!!
• Changes in Piezometric Levels
• Damaged Appurtenant Structures
• Failed Instruments
• Landslides
Downstream of Rudramata Dam
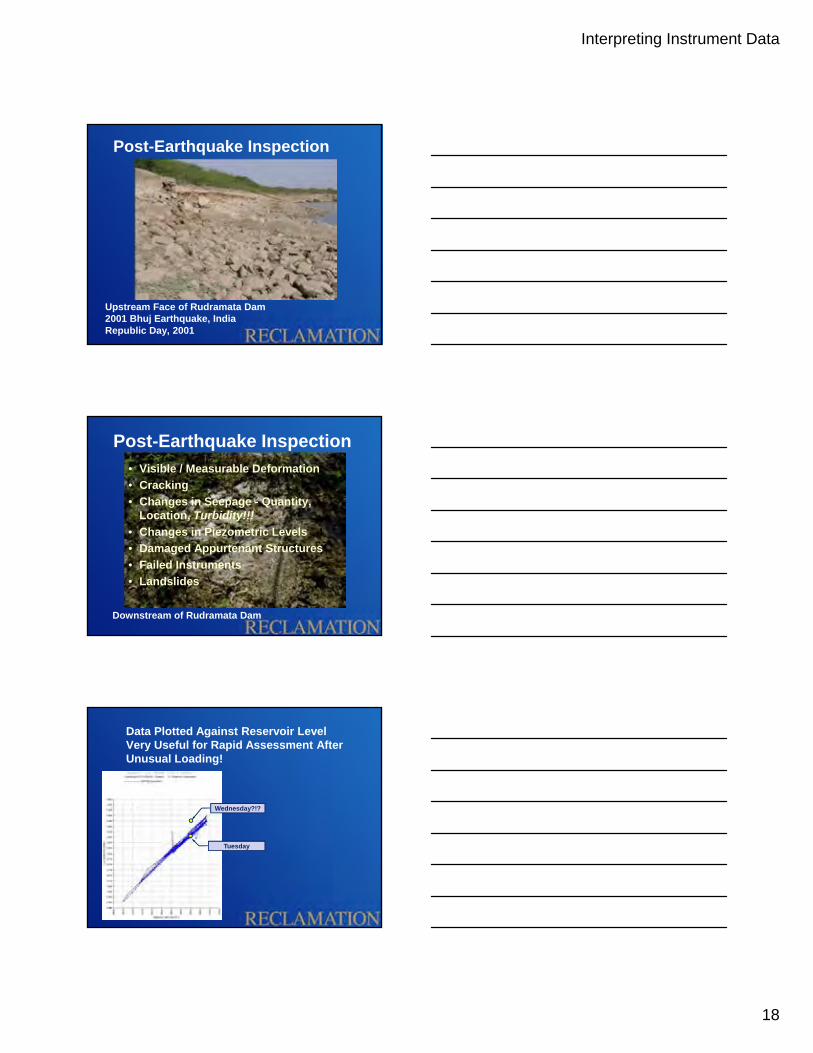
Data Plotted Against Reservoir LevelVery Useful for Rapid Assessment After Unusual Loading!
Wednesday?!?
Tuesday

Interpreting Instrument Data
19
During/After Flood• During flood
– Visible new or changed seepage
– Piezometers
– Weirs – read and check for sediment
– Spillway performance with large flow
• After flood– Condition of spillway
– Return of seepage and piezometers to normal
– Problematic erosion
During/After Extreme Flood
Previously "Untested" Embankment Contact
Normal Pool
Flood Pool
Toe Drains
A New Sinkhole?
Piezometers
The inspector found water where we never saw it before, and there is NOT thick green vegetation.
• Piezometers• Drain flows• Construction records• Geology drawings• Older inspection reports• Weather!

Interpreting Instrument Data
20
58
Where is all this water from? Is there a PFM in progress?
The wet area is very large, but the rate of seepage is small. Why?
Because the ground surface is flat, and the water does not drain.
Analyze the Right ProblemFuse Plug Embankment and Base Slab
60
Grout Curtain
*

Interpreting Instrument Data
21
Flow Net of Seepage Through Thin Core
61
• Indicates Q = 0.05 m3/day per meter of dam
Transformed Section(Dimensions in ft.)
Very little water from seepage collector on base slab
62
Is there a PFM in progress?
No. The water is because of a leaky grout curtain. This seepage in bedrock is benign because core is protected by concrete.
Geology and Material Properties
Analysis
Observations and Instrument Data
Understanding!
Sometimes, the process does not go in a straight line from Step A to Step B to Step C!
63

Interpreting Instrument Data
22
Failure Due to Embankment Cracking?Rogers Dam, Nevada, 1952
Discussion?
Recommended