February 2018
PAGE 1
DISCLAIMER
Forward‐Looking Statements:This presentation contains certain “forward‐looking statements” within the meaning of the Private Securities Litigation ReformAct of 1995. Forward‐looking statements may be identified by words such as “expects,” “intends,” “anticipates,” “plans,”“believes,” “seeks,” “estimates,” “will,” or words of similar meaning and include, but are not limited to, statements regarding theoutlook for FLY’s future business, operations and financial performance, including the expected benefits of the transaction;whether and when the transactions described herein (the “Transactions”) will be consummated; the amount of cash and stockconsideration to be paid by FLY; the type, amount and terms of the acquisition financing to be obtained by FLY; and, the amountof any fees and expenses incurred in connection with the Transactions. Forward‐looking statements are based on management’scurrent expectations and assumptions, which are subject to inherent uncertainties, risks and changes in circumstances that aredifficult to predict. Actual outcomes and results may differ materially due to global political, economic, business, competitive,market, regulatory and other factors and risks, including risks relating to the satisfaction of conditions to the closing of theTransactions; risks relating to satisfaction of conditions to the financing of the Transactions; risks relating to FLY’s ability to obtainadditional required financing for the Transactions on favorable terms, or at all; the risk that expected benefits of the Transactionsmay not be fully realized or may take longer to realize than expected; the risk that business disruption resulting from theTransactions may be greater than expected; and the risk that FLY may be unable to achieve its portfolio growth expectations, or toreap the benefits of such growth. Further information on the factors and risks that may affect FLY’s business is included in filingsFLY makes with the Securities and Exchange Commission (the “SEC”) from time to time, including its Annual Report on Form 20‐Fand its Reports on Form 6‐K. FLY expressly disclaims any obligation to update or revise any of these forward‐looking statements,whether because of future events, new information, a change in its views or expectations, or otherwise.Note:1. Share repurchase data and fleet statistics as of December 31, 2017.
PAGE 2
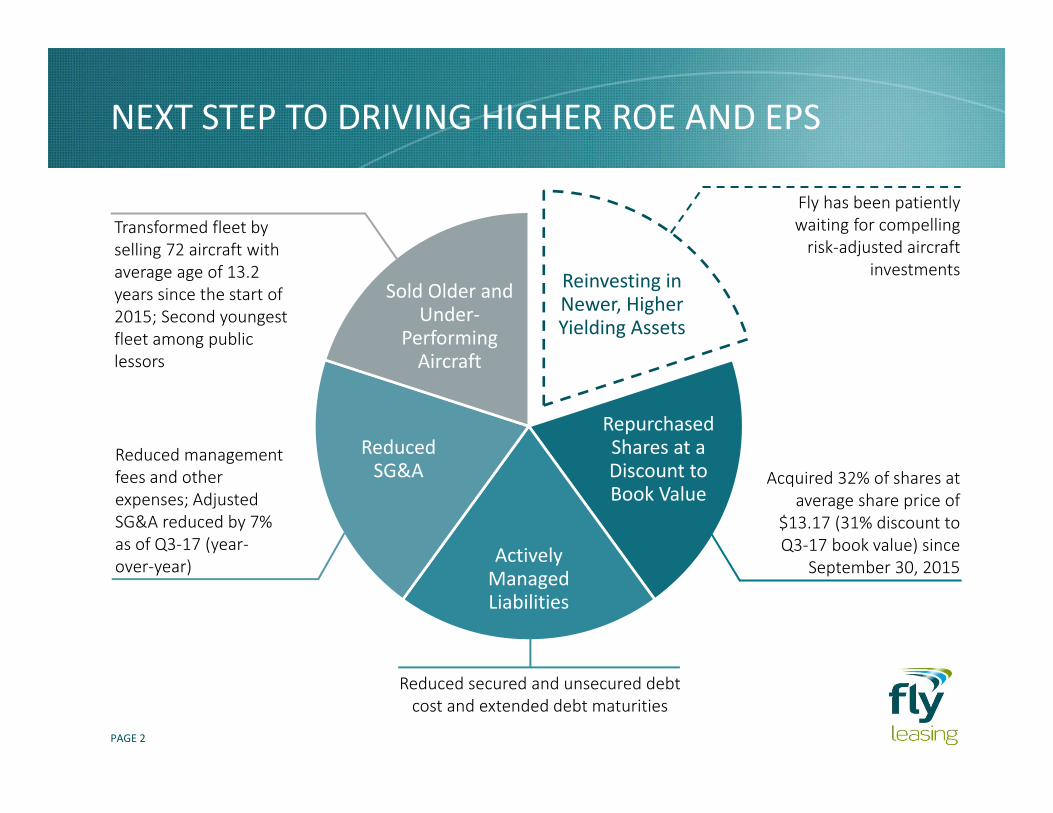
Reinvesting in Newer, Higher Yielding Assets
Repurchased Shares at a Discount to Book Value
Actively Managed Liabilities
Reduced SG&A
Sold Older and Under‐
Performing Aircraft
Fly has been patiently waiting for compelling risk‐adjusted aircraft
investments
Acquired 32% of shares at average share price of
$13.17 (31% discount to Q3‐17 book value) since
September 30, 2015
Transformed fleet by selling 72 aircraft with average age of 13.2 years since the start of 2015; Second youngest fleet among public lessors
Reduced secured and unsecured debt cost and extended debt maturities
Reduced management fees and other expenses; Adjusted SG&A reduced by 7% as of Q3‐17 (year‐over‐year)
NEXT STEP TO DRIVING HIGHER ROE AND EPS
PAGE 3
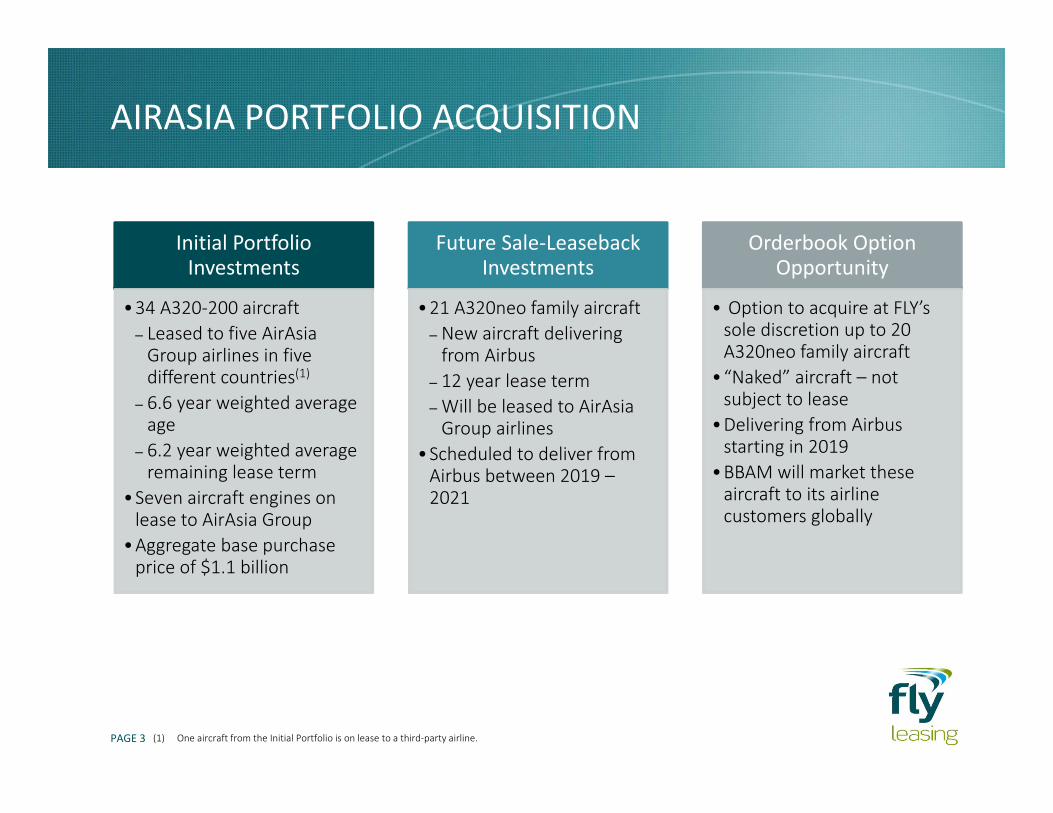
AIRASIA PORTFOLIO ACQUISITION
Initial Portfolio Investments
•34 A320‐200 aircraft‒ Leased to five AirAsia Group airlines in five different countries(1)
‒ 6.6 year weighted average age
‒ 6.2 year weighted average remaining lease term
•Seven aircraft engines on lease to AirAsia Group
•Aggregate base purchase price of $1.1 billion
Future Sale‐Leaseback Investments
•21 A320neo family aircraft‒ New aircraft delivering from Airbus
‒ 12 year lease term ‒Will be leased to AirAsia Group airlines
•Scheduled to deliver from Airbus between 2019 –2021
Orderbook Option Opportunity
• Option to acquire at FLY’s sole discretion up to 20 A320neo family aircraft
•“Naked” aircraft – not subject to lease
•Delivering from Airbus starting in 2019
•BBAM will market these aircraft to its airline customers globally
(1) One aircraft from the Initial Portfolio is on lease to a third‐party airline.
PAGE 4
TRANSACTION DETAILS
(1) Current share price as of February 28, 2018.
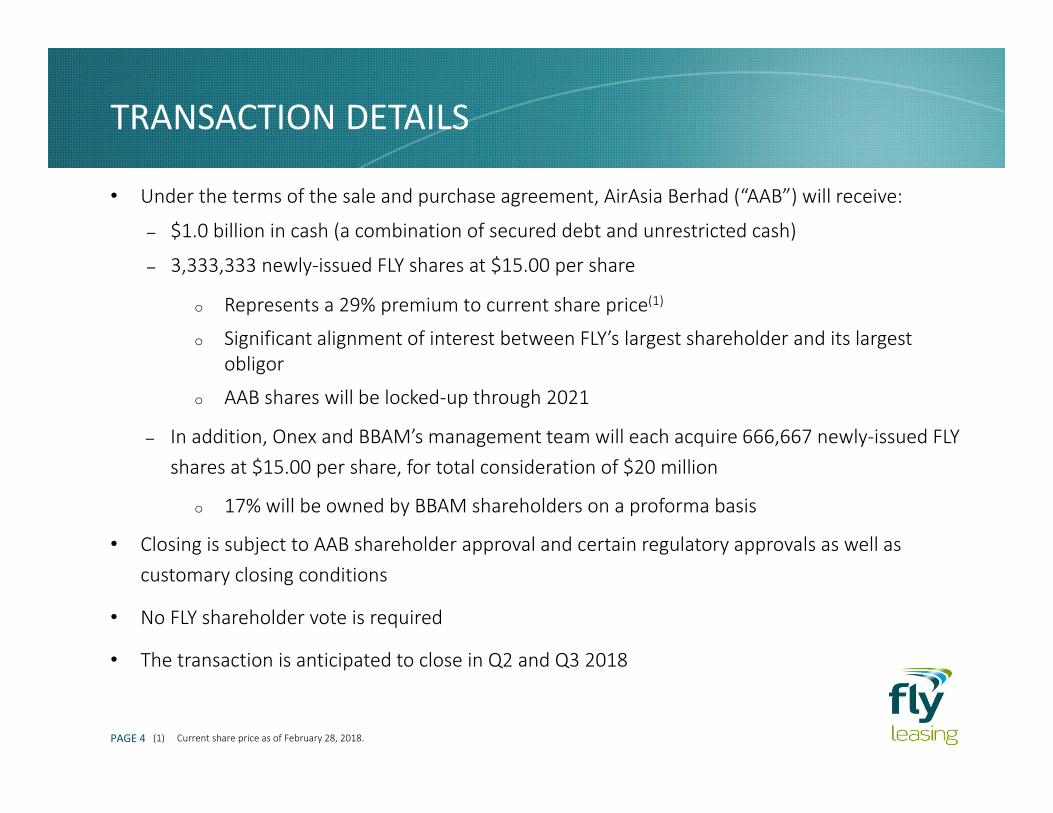
• Under the terms of the sale and purchase agreement, AirAsia Berhad (“AAB”) will receive:
‒ $1.0 billion in cash (a combination of secured debt and unrestricted cash)
‒ 3,333,333 newly‐issued FLY shares at $15.00 per share
o Represents a 29% premium to current share price(1)
o Significant alignment of interest between FLY’s largest shareholder and its largest obligor
o AAB shares will be locked‐up through 2021
‒ In addition, Onex and BBAM’s management team will each acquire 666,667 newly‐issued FLY shares at $15.00 per share, for total consideration of $20 million
o 17% will be owned by BBAM shareholders on a proforma basis
• Closing is subject to AAB shareholder approval and certain regulatory approvals as well as customary closing conditions
• No FLY shareholder vote is required
• The transaction is anticipated to close in Q2 and Q3 2018
PAGE 5
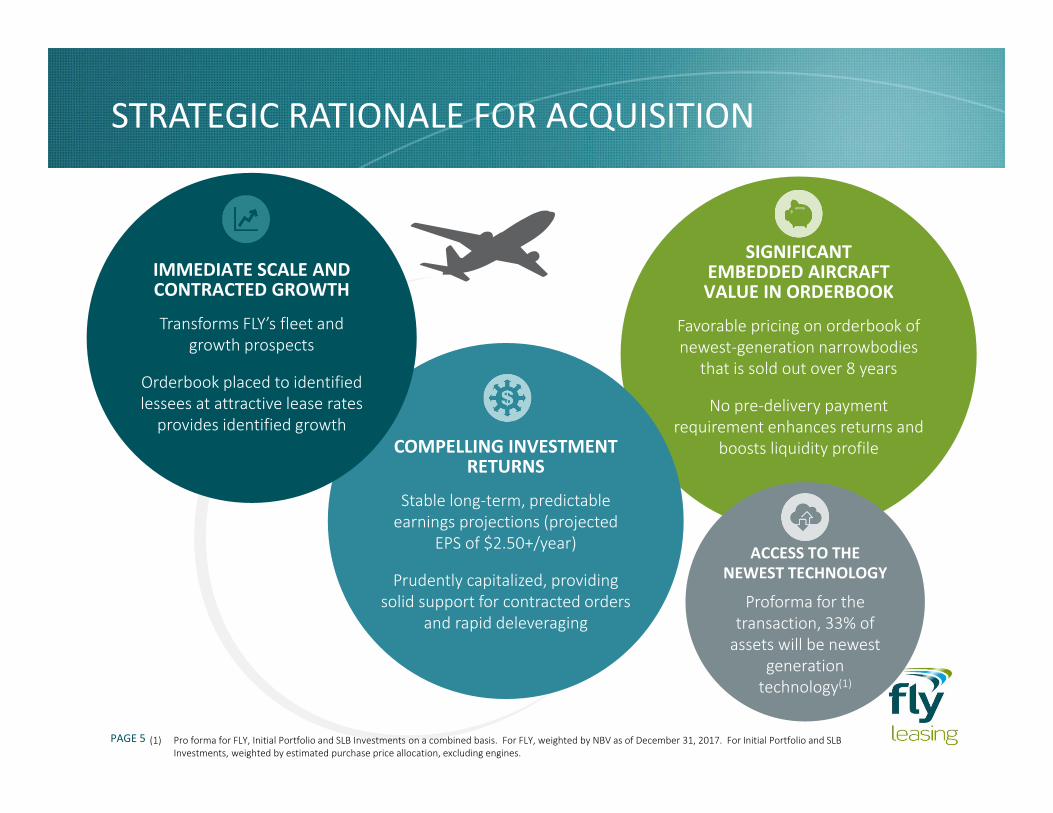
SIGNIFICANT EMBEDDED AIRCRAFT VALUE IN ORDERBOOK
Favorable pricing on orderbook of newest‐generation narrowbodies
that is sold out over 8 years
No pre‐delivery payment requirement enhances returns and
boosts liquidity profile
ACCESS TO THE NEWEST TECHNOLOGY
Proforma for the transaction, 33% of assets will be newest
generationtechnology(1)
COMPELLING INVESTMENT RETURNS
Stable long‐term, predictable earnings projections (projected
EPS of $2.50+/year)
Prudently capitalized, providing solid support for contracted orders
and rapid deleveraging
STRATEGIC RATIONALE FOR ACQUISITION
IMMEDIATE SCALE AND CONTRACTED GROWTH
Transforms FLY’s fleet and growth prospects
Orderbook placed to identified lessees at attractive lease rates provides identified growth
(1) Pro forma for FLY, Initial Portfolio and SLB Investments on a combined basis. For FLY, weighted by NBV as of December 31, 2017. For Initial Portfolio and SLB Investments, weighted by estimated purchase price allocation, excluding engines.
PAGE 6
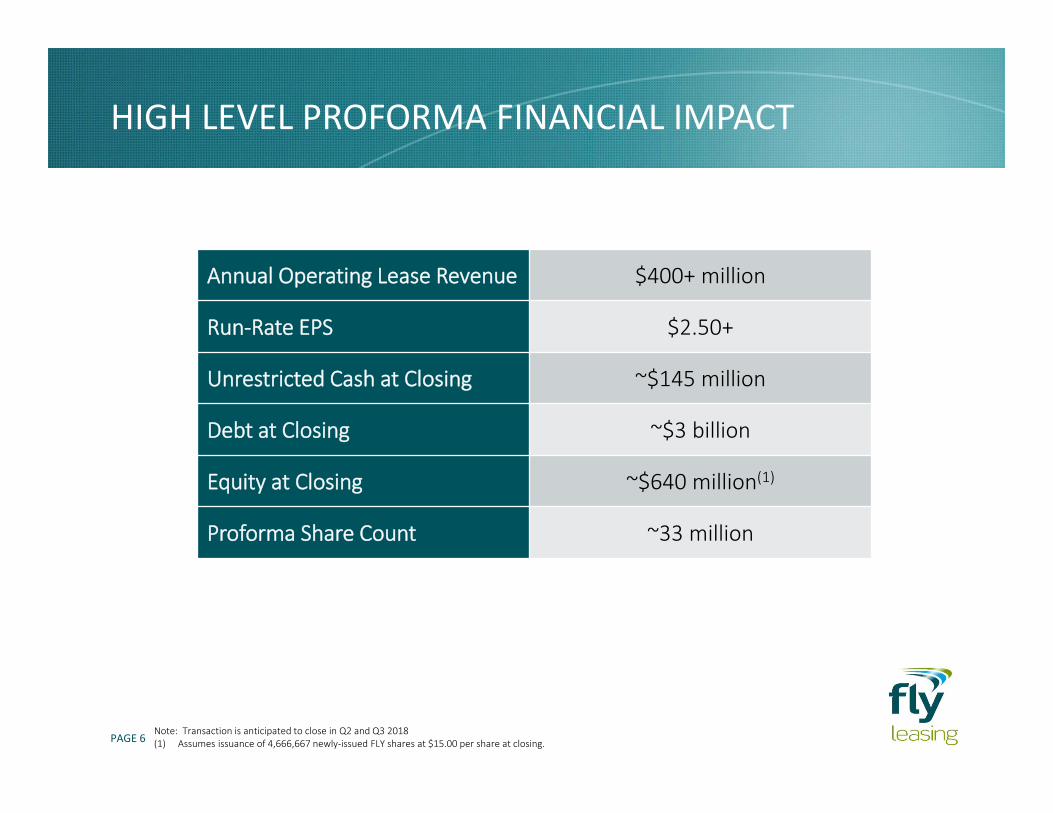
HIGH LEVEL PROFORMA FINANCIAL IMPACT
Annual Operating Lease Revenue $400+ million
Run‐Rate EPS $2.50+
Unrestricted Cash at Closing ~$145 million
Debt at Closing ~$3 billion
Equity at Closing ~$640 million(1)
Proforma Share Count ~33 million
Note: Transaction is anticipated to close in Q2 and Q3 2018(1) Assumes issuance of 4,666,667 newly‐issued FLY shares at $15.00 per share at closing.
PAGE 7
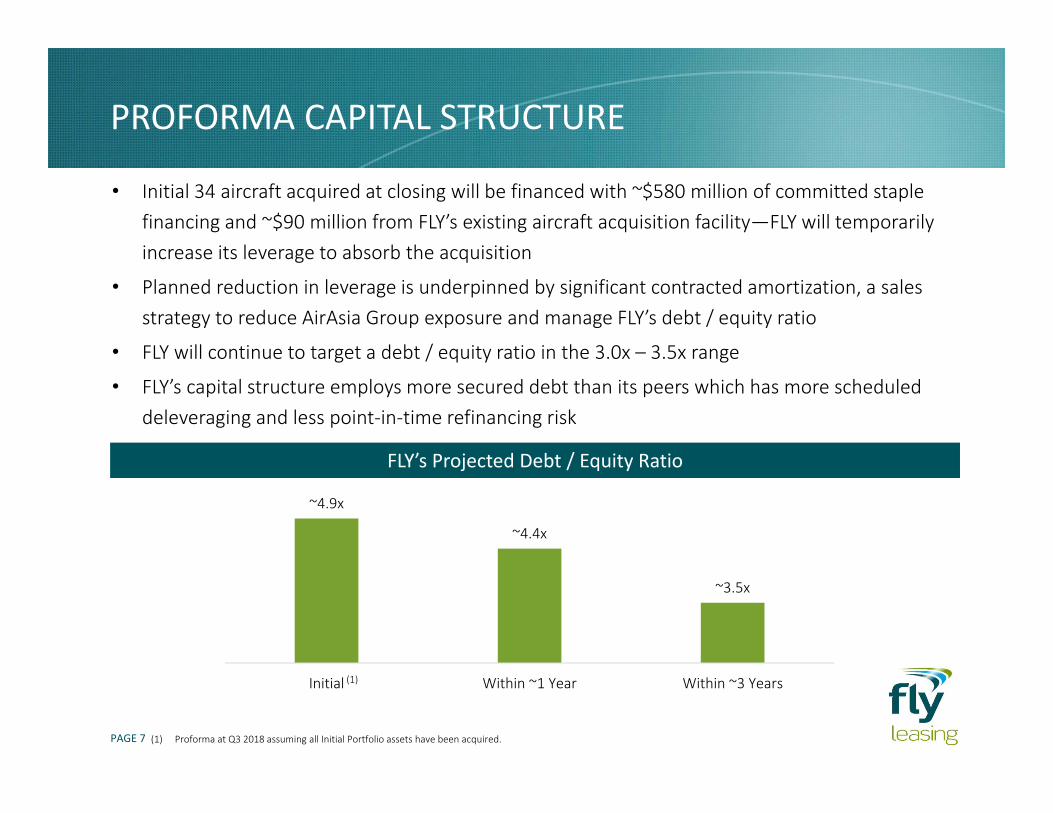
PROFORMA CAPITAL STRUCTURE
~4.9x
~4.4x
~3.5x
Initial Within ~1 Year Within ~3 Years
FLY’s Projected Debt / Equity Ratio
• Initial 34 aircraft acquired at closing will be financed with ~$580 million of committed staple financing and ~$90 million from FLY’s existing aircraft acquisition facility—FLY will temporarily increase its leverage to absorb the acquisition
• Planned reduction in leverage is underpinned by significant contracted amortization, a sales strategy to reduce AirAsia Group exposure and manage FLY’s debt / equity ratio
• FLY will continue to target a debt / equity ratio in the 3.0x – 3.5x range
• FLY’s capital structure employs more secured debt than its peers which has more scheduled deleveraging and less point‐in‐time refinancing risk
(1) Proforma at Q3 2018 assuming all Initial Portfolio assets have been acquired.
(1)
PAGE 8
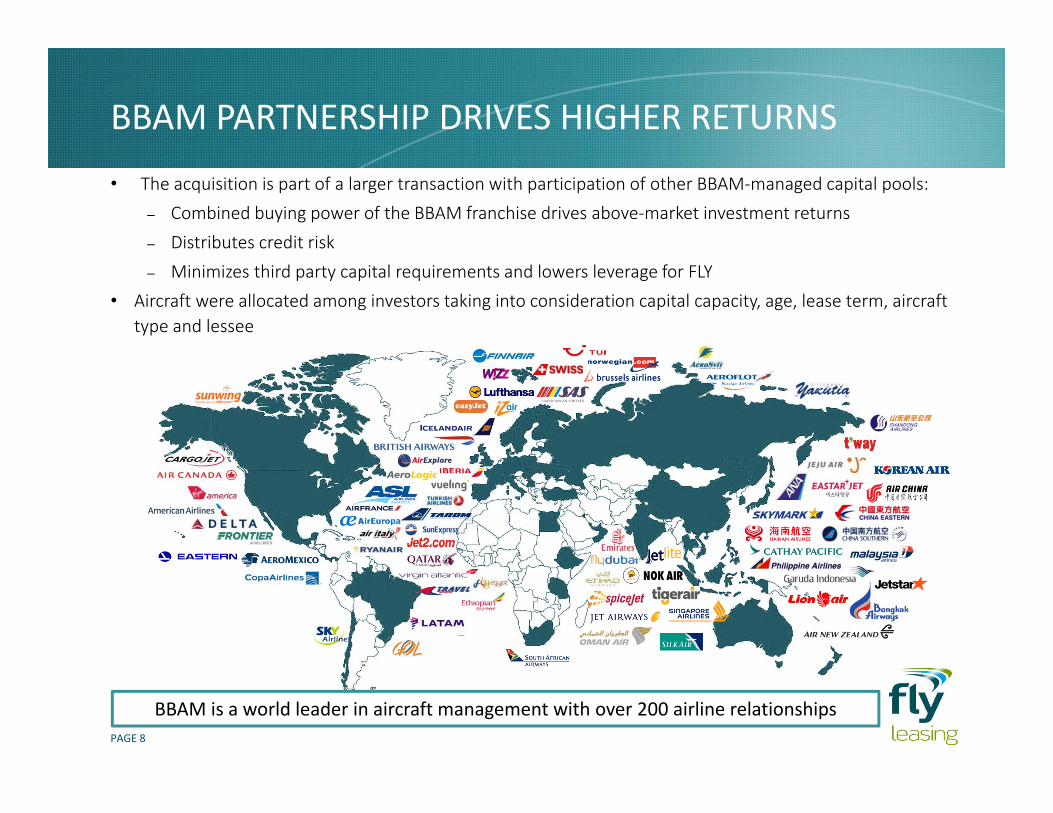
BBAM is a world leader in aircraft management with over 200 airline relationships
BBAM PARTNERSHIP DRIVES HIGHER RETURNS
• The acquisition is part of a larger transaction with participation of other BBAM‐managed capital pools:‒ Combined buying power of the BBAM franchise drives above‐market investment returns‒ Distributes credit risk‒ Minimizes third party capital requirements and lowers leverage for FLY
• Aircraft were allocated among investors taking into consideration capital capacity, age, lease term, aircraft type and lessee
PAGE 9
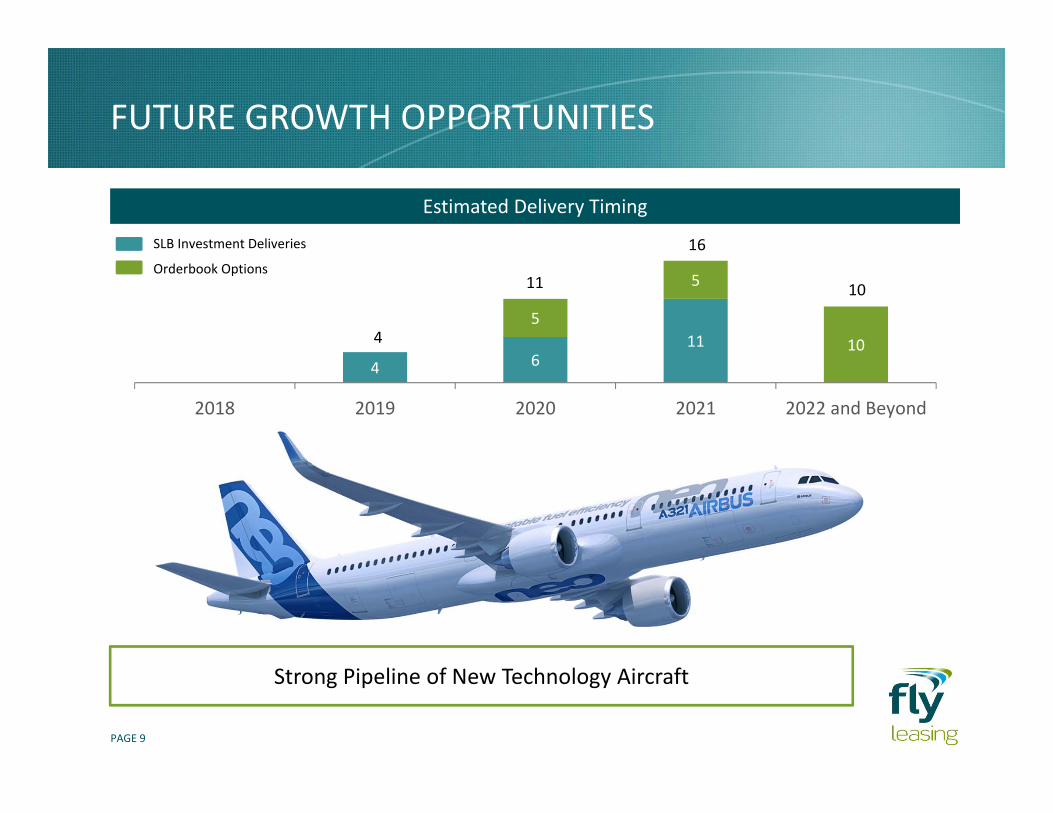
FUTURE GROWTH OPPORTUNITIES
Estimated Delivery Timing
4 611
5
5
10
2018 2019 2020 2021 2022 and Beyond
SLB Investment Deliveries
Orderbook Options
4
11
16
10
Strong Pipeline of New Technology Aircraft
PAGE 10
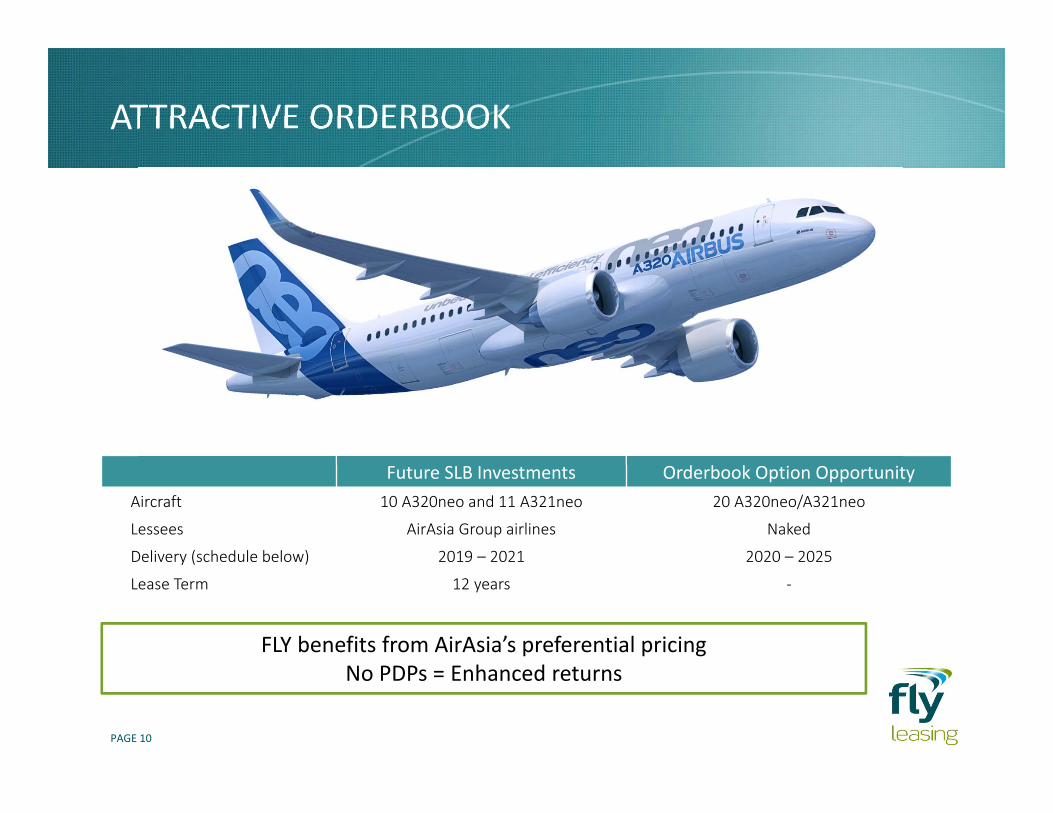
Future SLB Investments Orderbook Option OpportunityAircraft 10 A320neo and 11 A321neo 20 A320neo/A321neo
Lessees AirAsia Group airlines Naked
Delivery (schedule below) 2019 – 2021 2020 – 2025
Lease Term 12 years ‐
ATTRACTIVE ORDERBOOK
FLY benefits from AirAsia’s preferential pricing No PDPs = Enhanced returns
PAGE 11
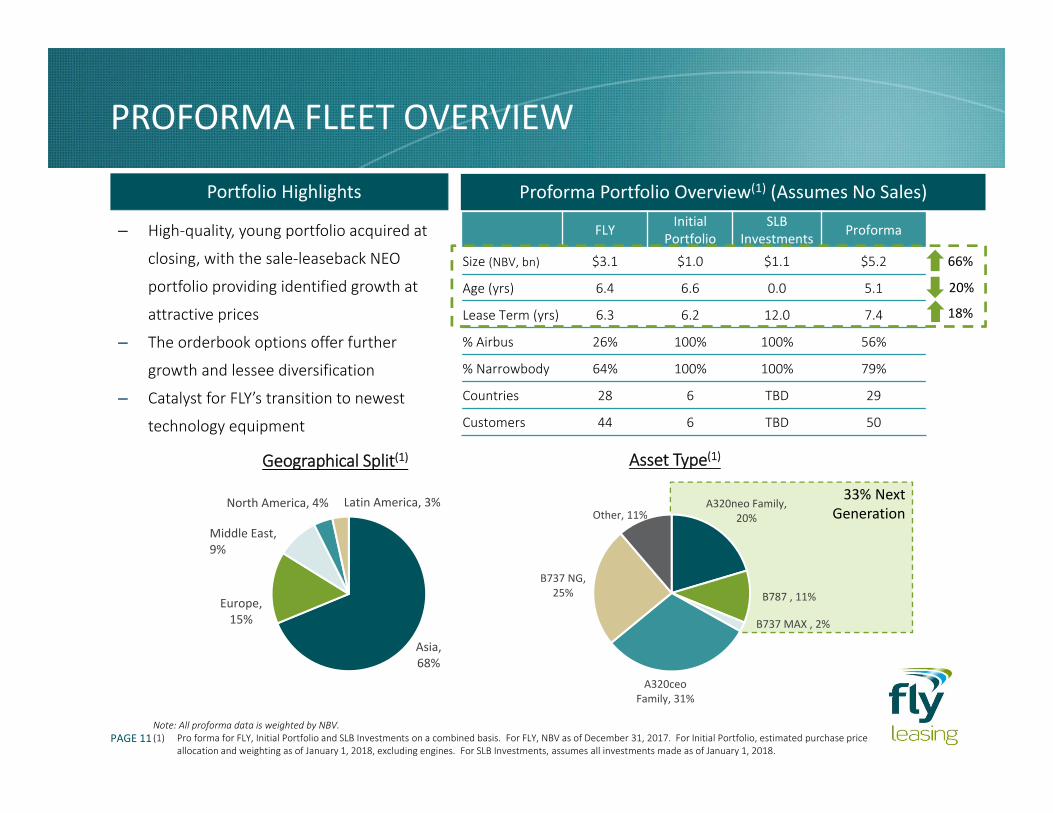
PROFORMA FLEET OVERVIEW
Proforma Portfolio Overview(1) (Assumes No Sales)
Note: All proforma data is weighted by NBV. (1) Pro forma for FLY, Initial Portfolio and SLB Investments on a combined basis. For FLY, NBV as of December 31, 2017. For Initial Portfolio, estimated purchase price
allocation and weighting as of January 1, 2018, excluding engines. For SLB Investments, assumes all investments made as of January 1, 2018.
‒ High‐quality, young portfolio acquired at
closing, with the sale‐leaseback NEO
portfolio providing identified growth at
attractive prices
‒ The orderbook options offer further
growth and lessee diversification
‒ Catalyst for FLY’s transition to newest
technology equipment
Portfolio Highlights
Geographical Split(1) Asset Type(1)
FLY Initial Portfolio
SLB Investments Proforma
Size (NBV, bn) $3.1 $1.0 $1.1 $5.2
Age (yrs) 6.4 6.6 0.0 5.1
Lease Term (yrs) 6.3 6.2 12.0 7.4
% Airbus 26% 100% 100% 56%
% Narrowbody 64% 100% 100% 79%
Countries 28 6 TBD 29
Customers 44 6 TBD 50
Asia, 68%
Europe, 15%
Middle East, 9%
North America, 4% Latin America, 3% A320neo Family, 20%
B787 , 11%
B737 MAX , 2%
A320ceo Family, 31%
B737 NG, 25%
Other, 11%
66%
20%
18%
33% Next Generation
PAGE 12
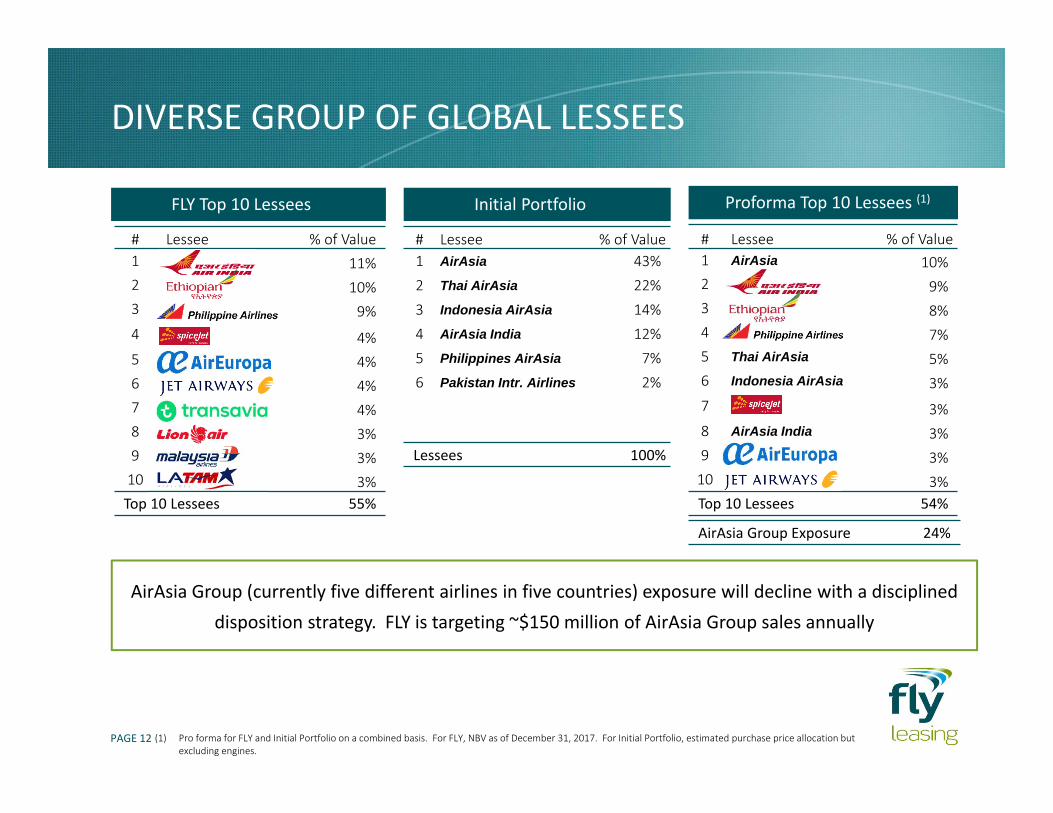
DIVERSE GROUP OF GLOBAL LESSEES
FLY Top 10 Lessees
# Lessee % of Value1 11%2 10%3 9%4 4%5 4%6 4%7 4%8 3%9 3%10 3%Top 10 Lessees 55%
Initial Portfolio
# Lessee % of Value1 AirAsia 43%2 Thai AirAsia 22%3 Indonesia AirAsia 14%4 AirAsia India 12%5 Philippines AirAsia 7%6 Pakistan Intr. Airlines 2%
Lessees 100%
Proforma Top 10 Lessees (1)
# Lessee % of Value1 AirAsia 10%2 9%3 8%4 7%5 Thai AirAsia 5%6 Indonesia AirAsia 3%7 3%8 AirAsia India 3%9 3%10 3%Top 10 Lessees 54%
AirAsia Group Exposure 24%
AirAsia Group (currently five different airlines in five countries) exposure will decline with a disciplined disposition strategy. FLY is targeting ~$150 million of AirAsia Group sales annually
(1) Pro forma for FLY and Initial Portfolio on a combined basis. For FLY, NBV as of December 31, 2017. For Initial Portfolio, estimated purchase price allocation but excluding engines.
PAGE 13
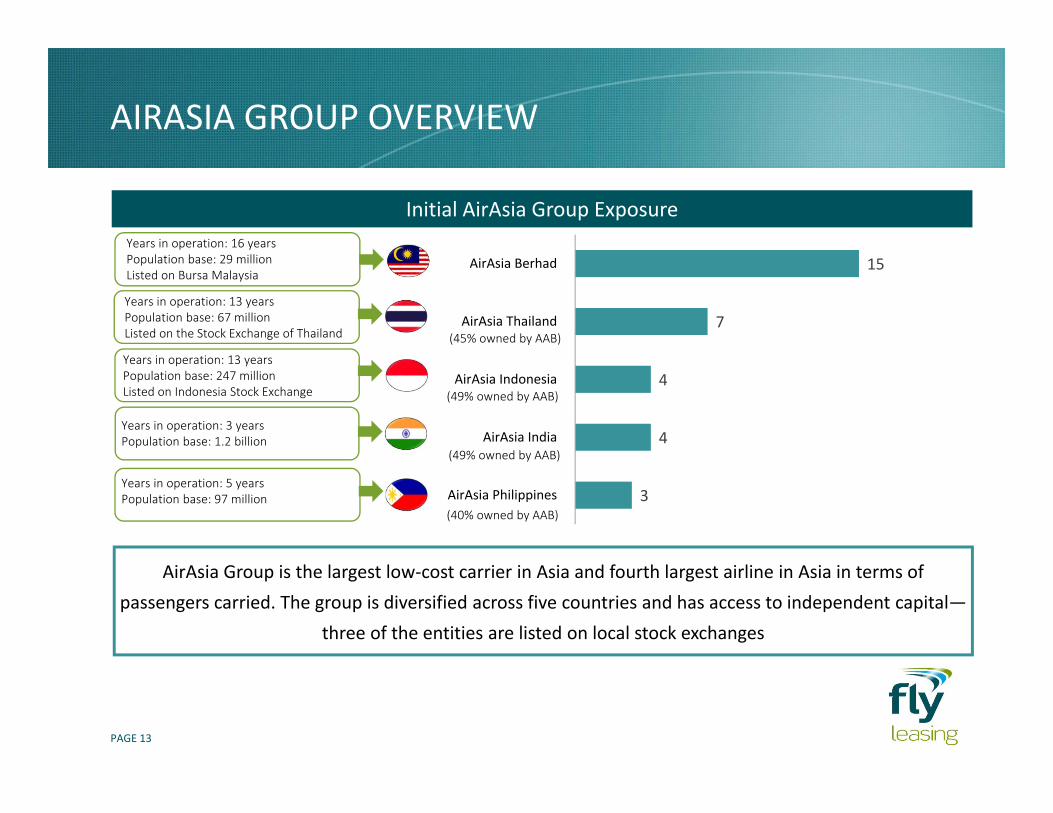
AIRASIA GROUP OVERVIEW
Initial AirAsia Group Exposure
3
4
4
7
15
AirAsia Philippines
AirAsia India
AirAsia Indonesia
AirAsia Thailand
AirAsia Berhad
AirAsia Group is the largest low‐cost carrier in Asia and fourth largest airline in Asia in terms of passengers carried. The group is diversified across five countries and has access to independent capital—
three of the entities are listed on local stock exchanges
Years in operation: 16 yearsPopulation base: 29 millionListed on Bursa Malaysia
Years in operation: 13 years Population base: 67 millionListed on the Stock Exchange of Thailand
Years in operation: 13 yearsPopulation base: 247 millionListed on Indonesia Stock Exchange
Years in operation: 3 years Population base: 1.2 billion
Years in operation: 5 years Population base: 97 million
(45% owned by AAB)
(49% owned by AAB)
(49% owned by AAB)
(40% owned by AAB)
Q&A
APPENDIX
PAGE 16
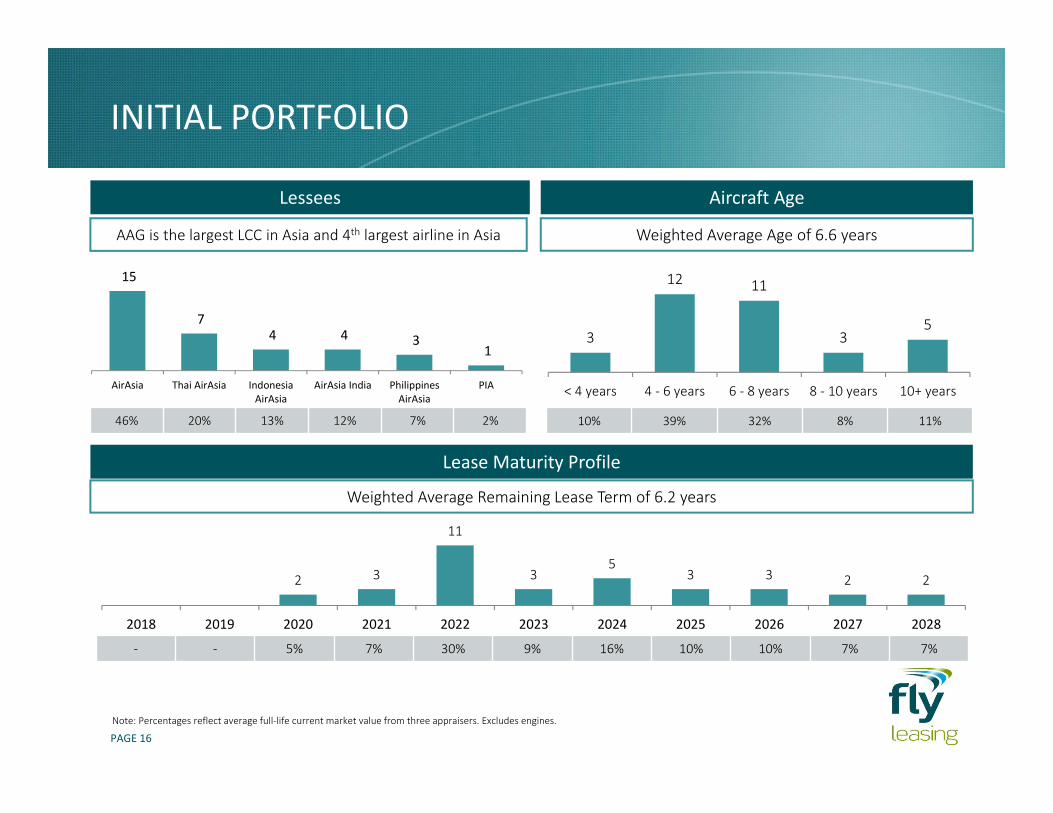
INITIAL PORTFOLIO
Aircraft Age
3
12 11
35
< 4 years 4 ‐ 6 years 6 ‐ 8 years 8 ‐ 10 years 10+ years
Lease Maturity Profile
2 3
11
35
3 3 2 2
2018 2019 2020 2021 2022 2023 2024 2025 2026 2027 2028
Weighted Average Age of 6.6 years
Weighted Average Remaining Lease Term of 6.2 years
Lessees
10% 39% 32% 8% 11%
‐ ‐ 5% 7% 30% 9% 16% 10% 10% 7% 7%
AAG is the largest LCC in Asia and 4th largest airline in Asia
15
7 4 4 3
1
AirAsia Thai AirAsia IndonesiaAirAsia
AirAsia India PhilippinesAirAsia
PIA
46% 20% 13% 12% 7% 2%
Note: Percentages reflect average full‐life current market value from three appraisers. Excludes engines.
PAGE 17
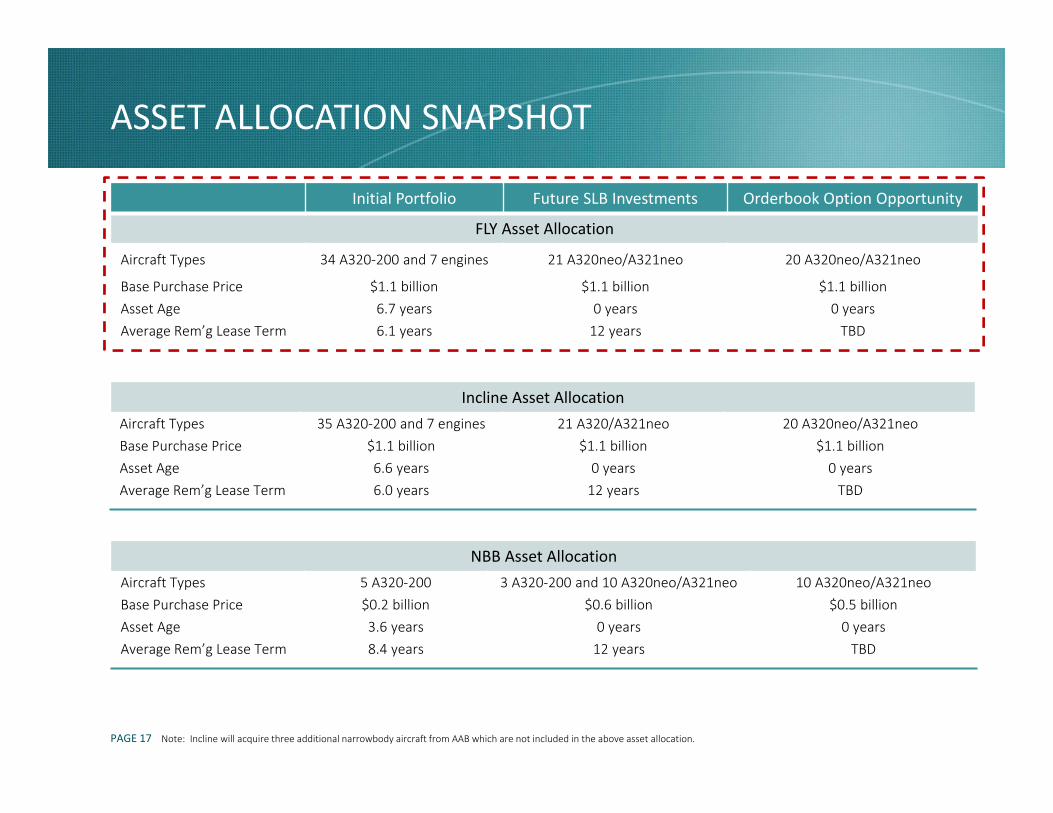
ASSET ALLOCATION SNAPSHOT
Initial Portfolio Future SLB Investments Orderbook Option Opportunity
FLY Asset Allocation
Aircraft Types 34 A320‐200 and 7 engines 21 A320neo/A321neo 20 A320neo/A321neo
Base Purchase Price $1.1 billion $1.1 billion $1.1 billionAsset Age 6.7 years 0 years 0 yearsAverage Rem’g Lease Term 6.1 years 12 years TBD
Incline Asset AllocationAircraft Types 35 A320‐200 and 7 engines 21 A320/A321neo 20 A320neo/A321neoBase Purchase Price $1.1 billion $1.1 billion $1.1 billionAsset Age 6.6 years 0 years 0 yearsAverage Rem’g Lease Term 6.0 years 12 years TBD
NBB Asset AllocationAircraft Types 5 A320‐200 3 A320‐200 and 10 A320neo/A321neo 10 A320neo/A321neoBase Purchase Price $0.2 billion $0.6 billion $0.5 billionAsset Age 3.6 years 0 years 0 yearsAverage Rem’g Lease Term 8.4 years 12 years TBD
Note: Incline will acquire three additional narrowbody aircraft from AAB which are not included in the above asset allocation.
PAGE 18
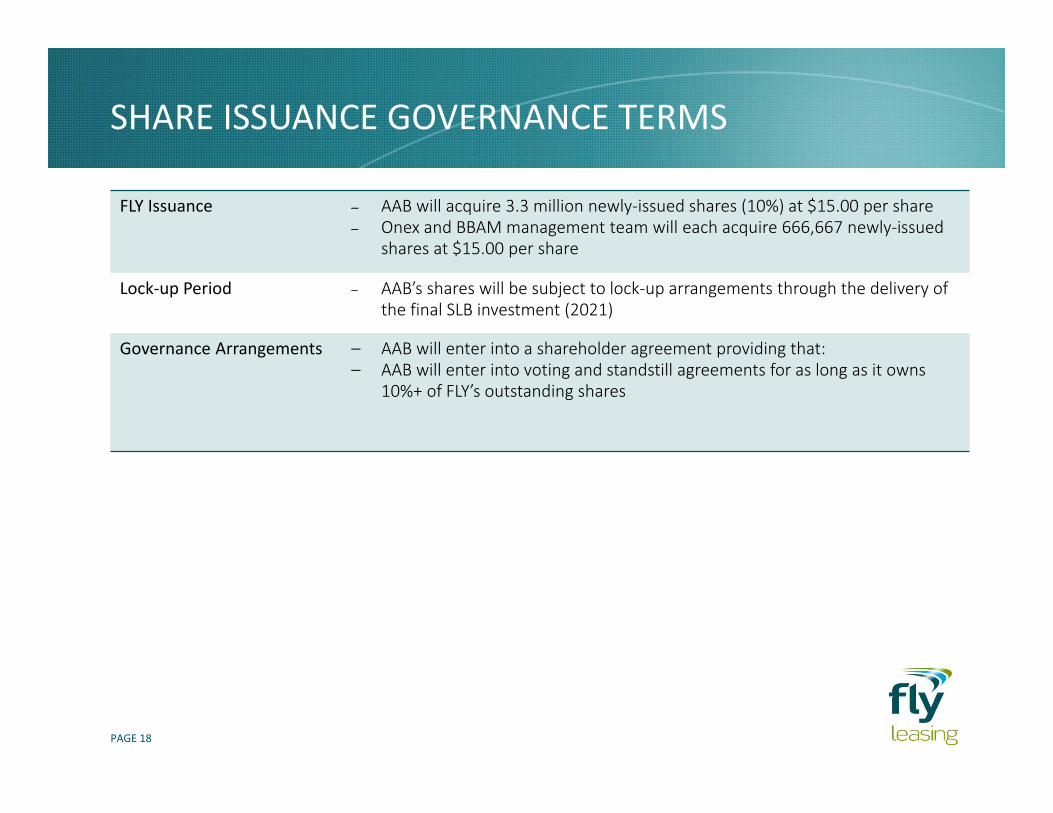
SHARE ISSUANCE GOVERNANCE TERMS
FLY Issuance ‒ AAB will acquire 3.3 million newly‐issued shares (10%) at $15.00 per share‒ Onex and BBAM management team will each acquire 666,667 newly‐issued
shares at $15.00 per share
Lock‐up Period ‒ AAB’s shares will be subject to lock‐up arrangements through the delivery of the final SLB investment (2021)
Governance Arrangements ‒ AAB will enter into a shareholder agreement providing that:‒ AAB will enter into voting and standstill agreements for as long as it owns
10%+ of FLY’s outstanding shares
Recommended


![PERFORMANCE REVIEW - ir.airasia.com · 1 AirAsia Berhad refers to AirAsia Malaysia, AirAsia Indonesia and AirAsia Philippines [ ]74 AirAsia Group Berhad PERFORMANCE REVIEW PERFORMANCE](https://img.pdfslide.us/doc/110x75/5e70c7c4c269c907066397d4/performance-review-ir-1-airasia-berhad-refers-to-airasia-malaysia-airasia-indonesia.jpg)