1
GIS Applications for Origin-Destination Surveys
Greg Spitz and John LobbResource Systems Group
[email protected]@rsginc.com
Daniel JacobsMTA Bridges & Tunnels
Wayne BennionWasatch Front Regional Council
2
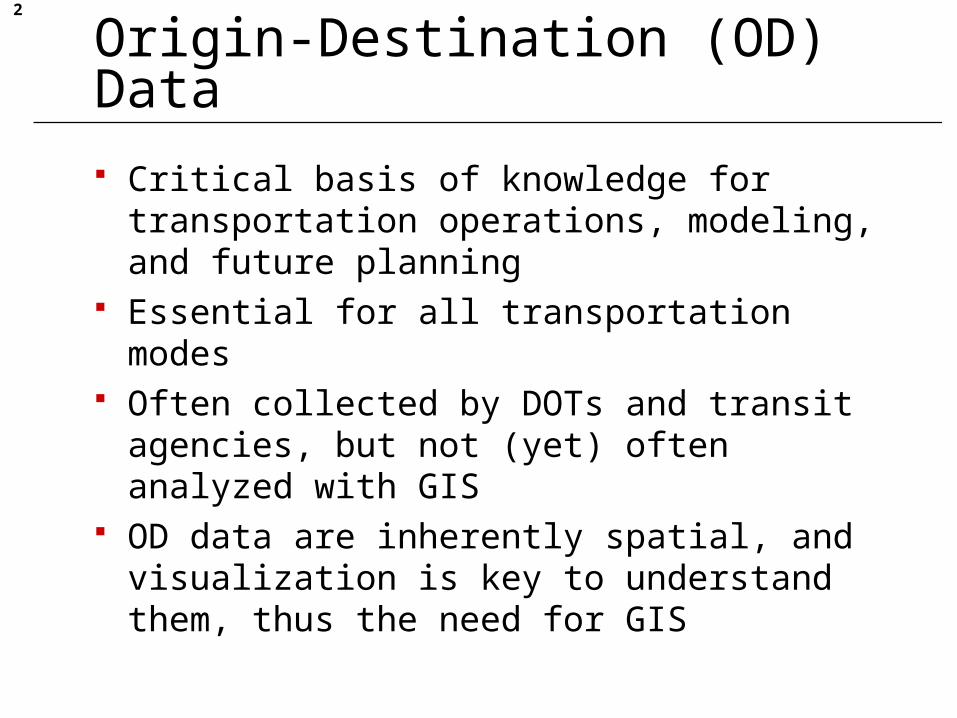
Origin-Destination (OD) Data
Critical basis of knowledge for transportation operations, modeling, and future planning
Essential for all transportation modes Often collected by DOTs and transit agencies,
but not (yet) often analyzed with GIS OD data are inherently spatial, and
visualization is key to understand them, thus the need for GIS

3
Provide insights to: Who the customers are Why customers are traveling How long they are traveling, and Where they are traveling, etc.
Labor intensive data collection efforts Used to understand current demand and
plan for future demand Critical data for calibrating travel models
Origin & Destination Surveys

4
GIS Tools in action
MTA Bridges and Tunnels— largest toll agency in US
Wasatch Front Regional Council &Utah Transit Authority— transit on-board survey
Two different agencies, modes, and application purposes
GIS the common denominator to solve issues for these different purposes
5
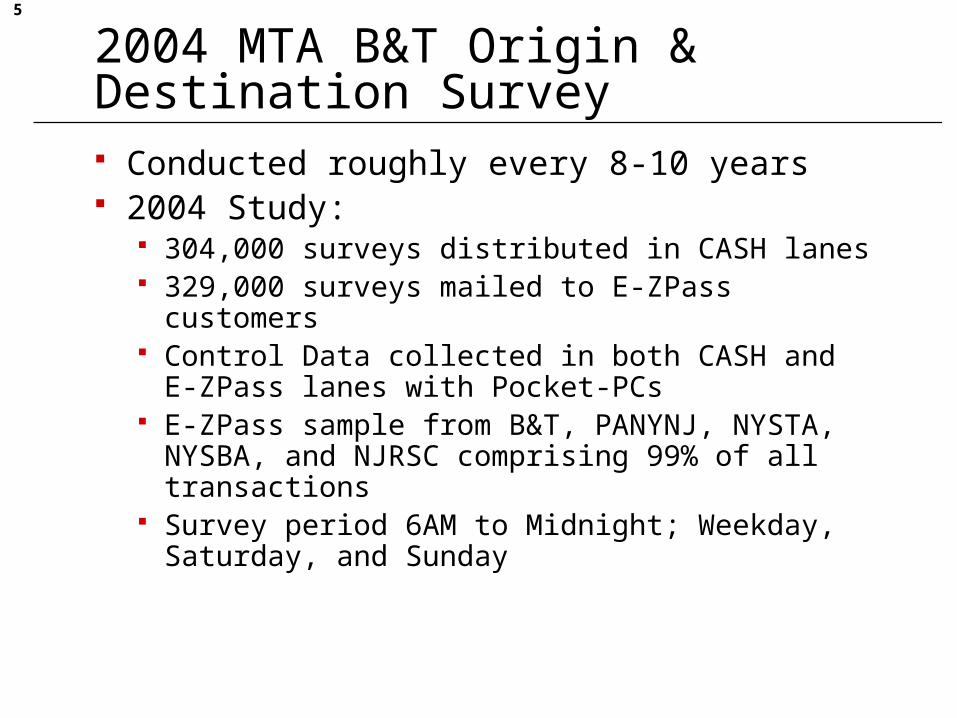
2004 MTA B&T Origin & Destination Survey Conducted roughly every 8-10 years 2004 Study:
304,000 surveys distributed in CASH lanes 329,000 surveys mailed to E-ZPass customers Control Data collected in both CASH and E-
ZPass lanes with Pocket-PCs E-ZPass sample from B&T, PANYNJ, NYSTA,
NYSBA, and NJRSC comprising 99% of all transactions
Survey period 6AM to Midnight; Weekday, Saturday, and Sunday
6
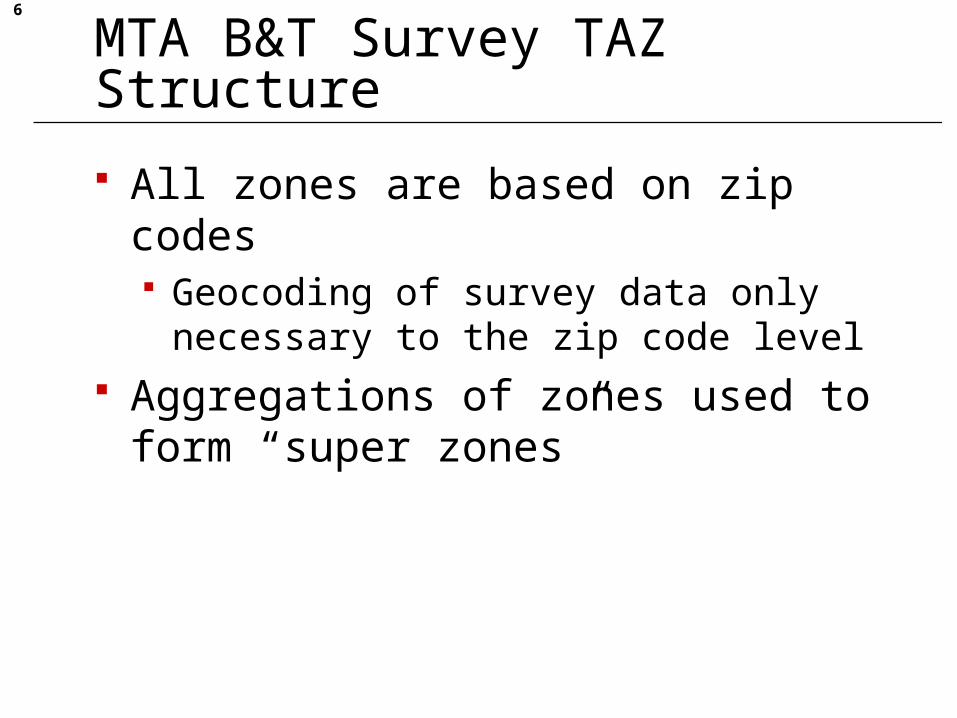
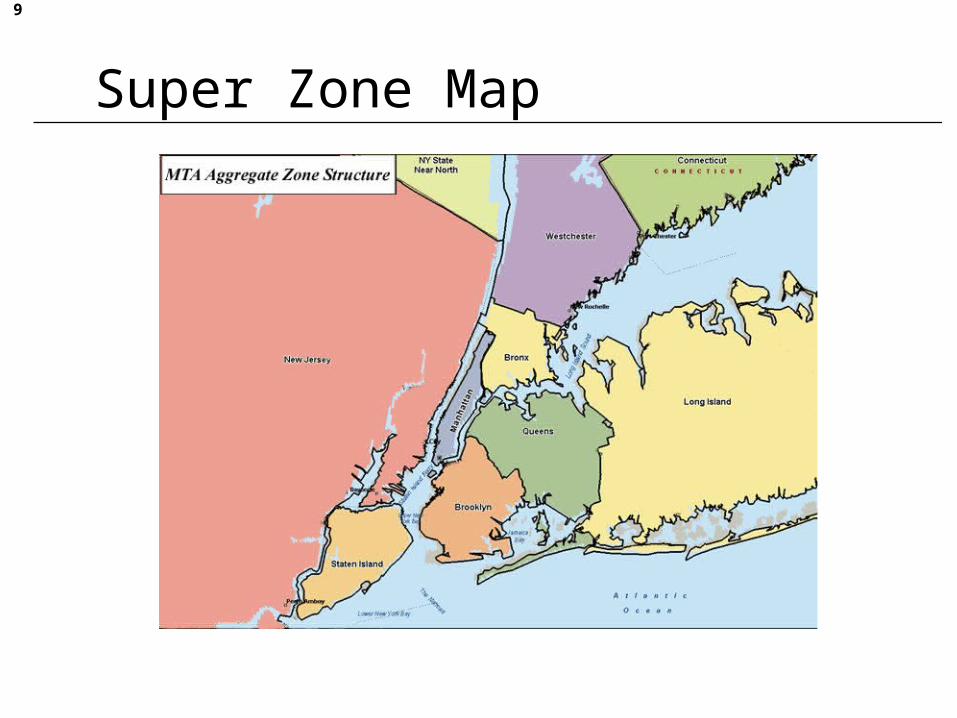
MTA B&T Survey TAZ Structure
All zones are based on zip codes Geocoding of survey data only necessary
to the zip code level Aggregations of zones used to form
“super zones”
7
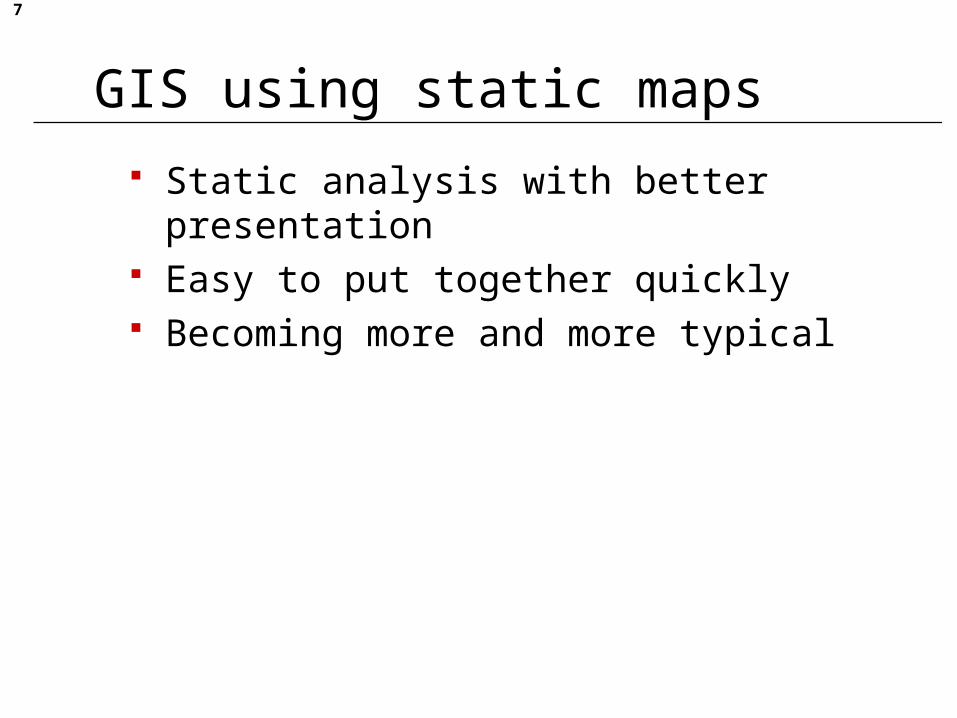
GIS using static maps
Static analysis with better presentation Easy to put together quickly Becoming more and more typical
8
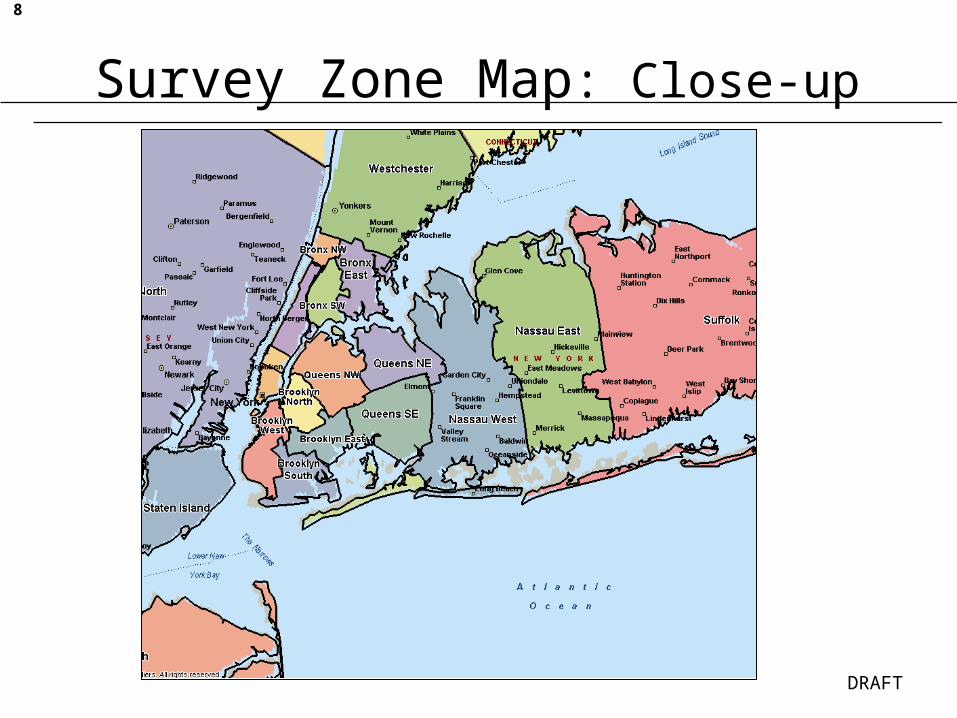
Survey Zone Map: Close-up
DRAFT
9
Super Zone Map

10
Example of Static Map using super zones:Bronx-Whitestone Bridge – Bronx Bound
OrderOrigin Super
ZoneDestination Super Zone Adjusted Volume
% of Total Traffic
1 Queens Bronx 9,520 20.2%2 Queens Westchester 8,989 19.1%3 LI Westchester 4,817 10.2%4 Queens Connecticut 4,816 10.2%5 LI Bronx 2,096 4.5%6 Queens NJ 1,914 4.1%
•All O-D pairs with greater than 4% of traffic
•All payment types
•Weekday
•Truck/taxi trips excluded
•6am to Midnight
•Total Auto Traffic (6AM to Midnight) is 47,030
•95% Confidence interval for these OD pairs is plus or minus 2.0%
20.2%
19.1%
4.1%
4.5%
10.2%
10.2%
11
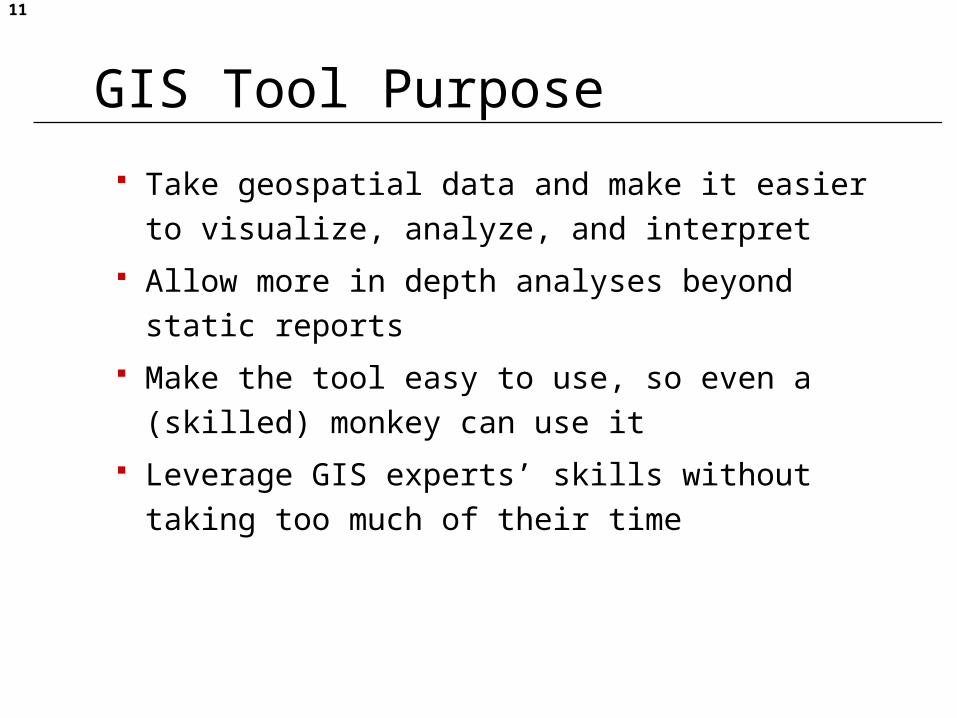
GIS Tool Purpose
Take geospatial data and make it easier to
visualize, analyze, and interpret
Allow more in depth analyses beyond static reports
Make the tool easy to use, so even a (skilled)
monkey can use it
Leverage GIS experts’ skills without taking too
much of their time
12
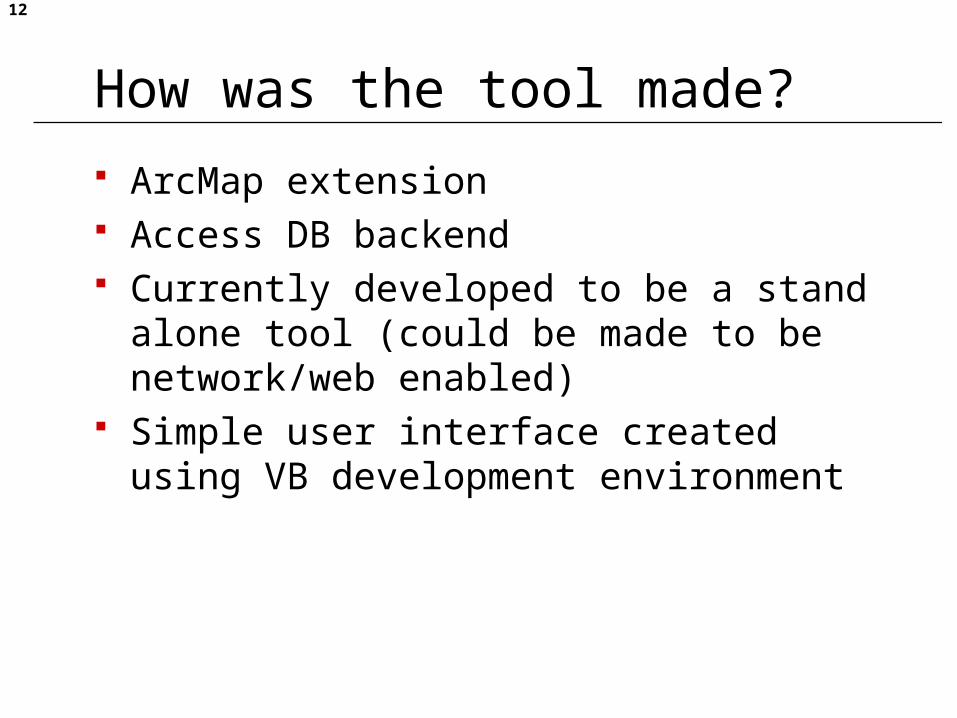
How was the tool made?
ArcMap extension Access DB backend Currently developed to be a stand alone tool
(could be made to be network/web enabled) Simple user interface created using VB
development environment
13
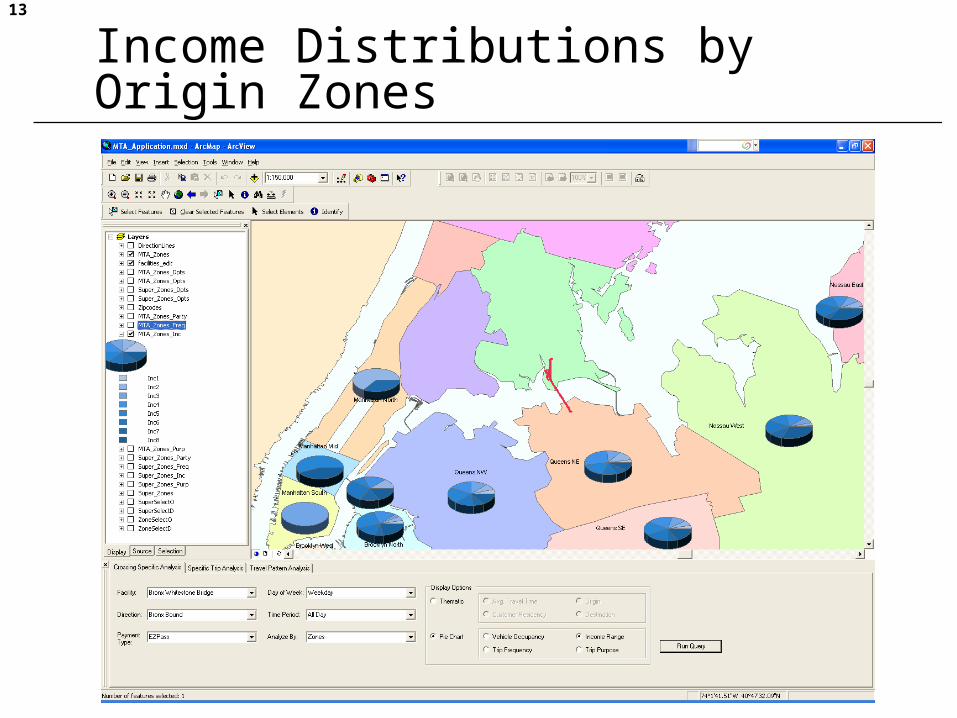
Income Distributions by Origin Zones

14
Vehicle Occupancy by Origin Zone
15
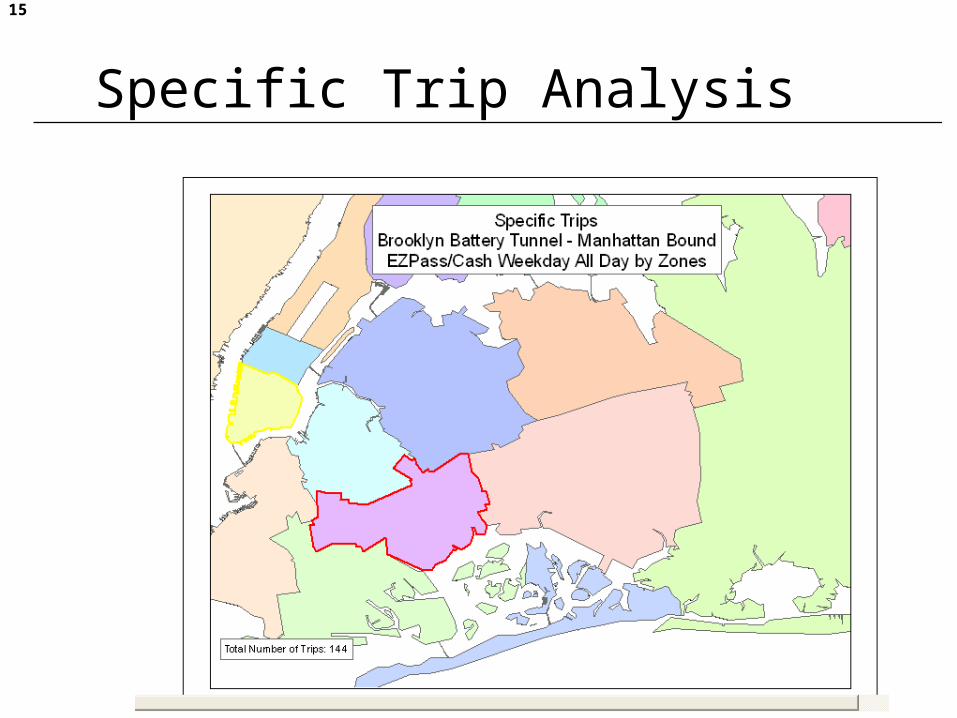
Specific Trip Analysis
16
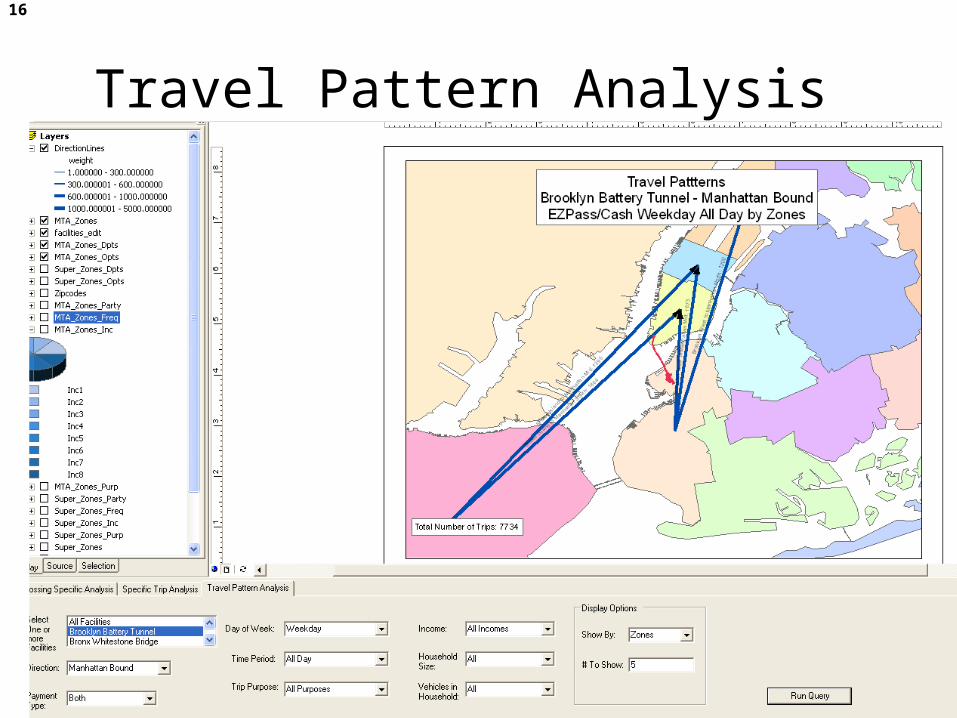
Travel Pattern Analysis
17
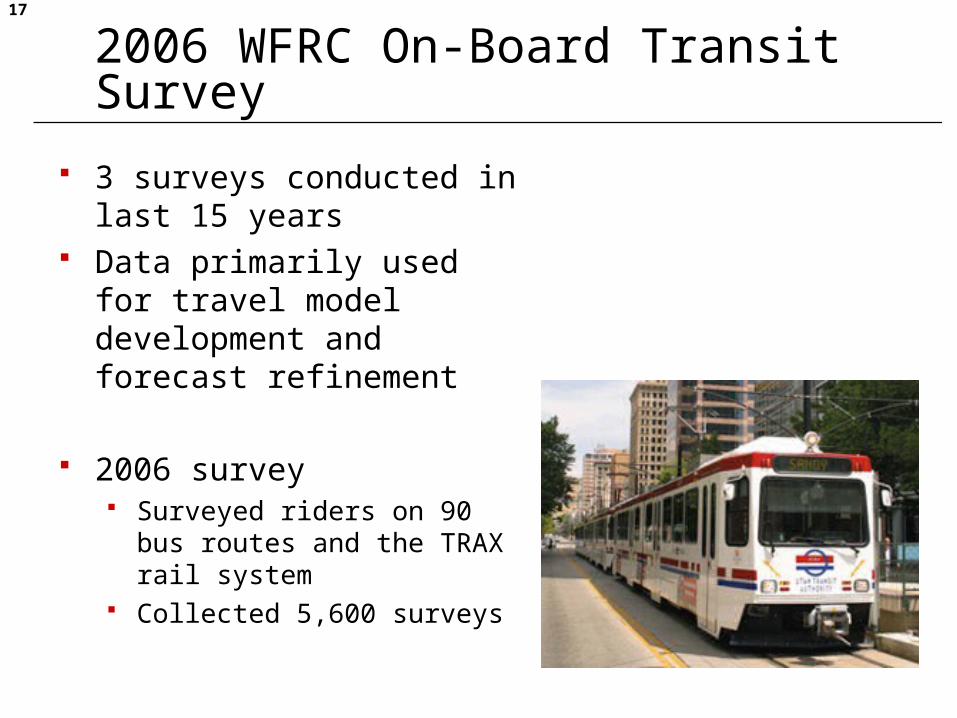
2006 WFRC On-Board Transit Survey
3 surveys conducted in last 15 years
Data primarily used for travel model development and forecast refinement
2006 survey Surveyed riders on 90 bus routes
and the TRAX rail system Collected 5,600 surveys

18
OD Data Mining is Cumbersome
Survey database has over 100 columns and 5600 rows (difficult to view all relevant variables at once)
TAZ number and/or address text may not be immediately recognizable (data is spatial)

19
GIS Tool Purpose (WFRC)
Preliminary review of the data suggested that the 2006 survey transfer rates were unreasonable
Interest in examining individual survey records efficiently
Frequency Distribution of Transit Transfers (unweighted sample)
0
10
20
30
40
50
60
70
0 1 2 3 4 5
Transfers
% o
f T
rip
s
2006 2002
20
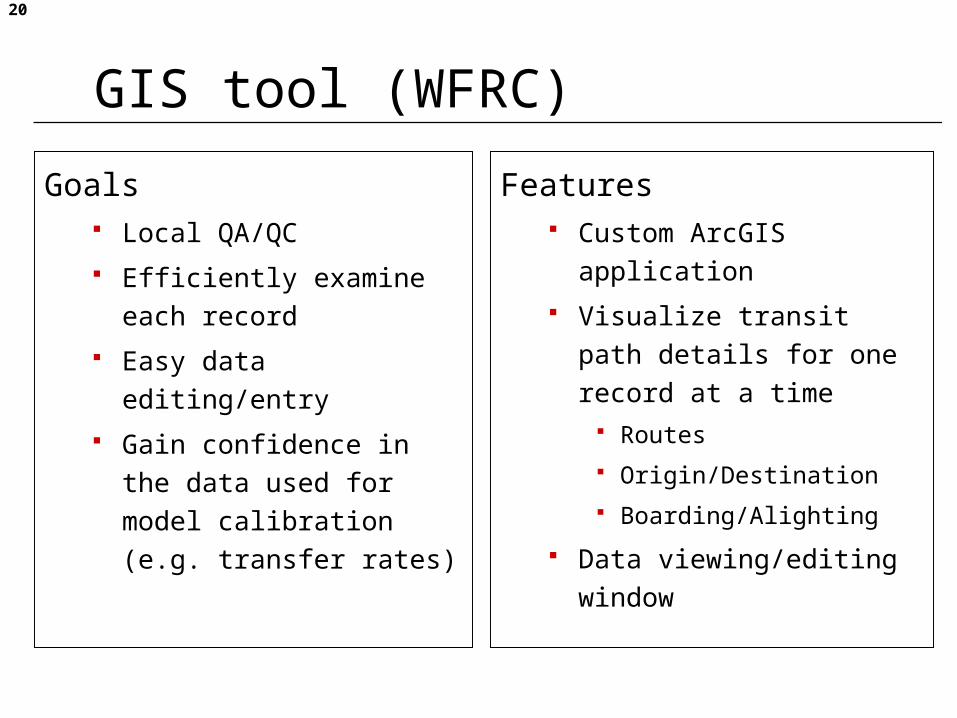
GIS tool (WFRC)
Goals Local QA/QC
Efficiently examine each
record
Easy data editing/entry
Gain confidence in the data
used for model calibration
(e.g. transfer rates)
Features Custom ArcGIS application
Visualize transit path details
for one record at a time Routes
Origin/Destination
Boarding/Alighting
Data viewing/editing window

21
Screen capture of GIS Tool
Reported data
22
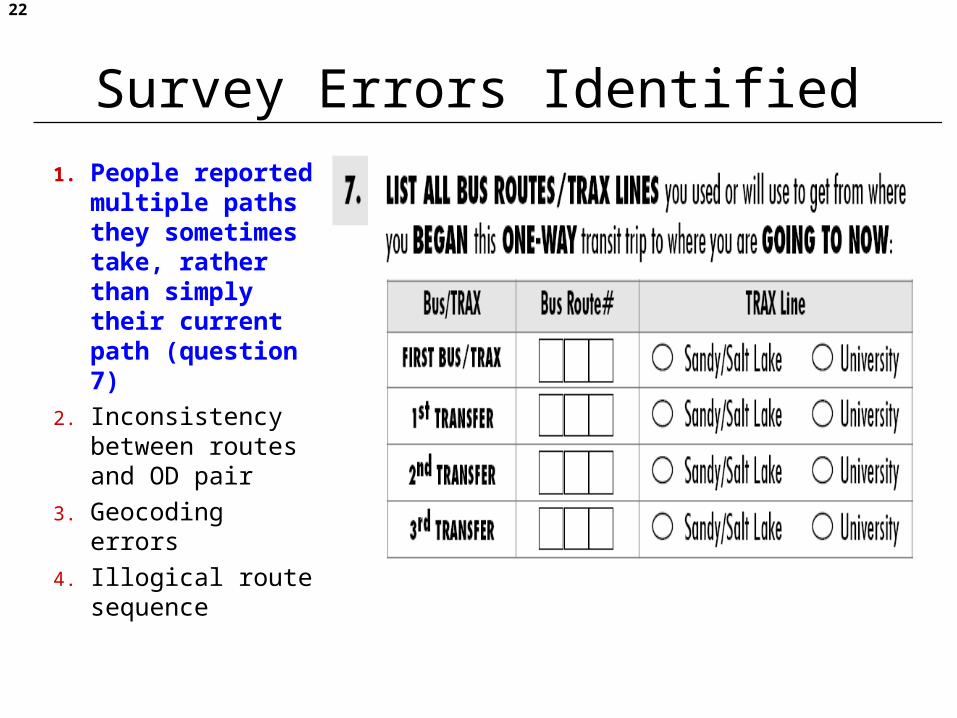
Survey Errors Identified
1. People reported multiple paths they sometimes take, rather than simply their current path (question 7)
2. Inconsistency between routes and OD pair
3. Geocoding errors
4. Illogical route sequence

23
Example of Multiple Paths between same OD Pair

24
Another example of multiple paths between same OD pair

25
Summary
Application clearly identified obvious inconsistencies and errors, resulting in a more reliable database.
Visualization of these records would also be extremely helpful in assessing survey design and reducing respondent error.
Frequency Distribution of Transit Transfers (unweighted sample)
0
10
20
30
40
50
60
70
0 1 2 3 4 5
Transfers
% o
f T
rip
s
2006 Before2006 After2002
26
User-friendly GIS tools developed for planners and analysts
GIS tools allow planners and others to drill down on the data
Tool interface confines the problem (both a good and bad thing)
Interface makes analysis much easier and doesn’t require in-depth software/data knowledge
Tools allow analysts to get more out of their data collection investment
27
Questions ?
Please use the Microphone.
Recommended