http
://www.b
ps.g
o.id
http
://www.b
ps.g
o.id
Statistik Tanaman Buah-buahan danSayuran TahunanStatistics of Annual Fruit and Vegetable PlantsIndonesia2015
ISSN: 2088-8406 No. Publikasi/Publication Number: 05120.1605Katalog/Catalog: 5205010Ukuran Buku/Book Size: 17,6 x 25 cmJumlah Halaman/Number of Pages: viii + 99 Halaman/Pages
Naskah/Manuscript:Subdirektorat Statistik HortikulturaSub-directorate of Horticulture Statistics
Gambar Kulit/Cover Design:Subdirektorat Publikasi dan Kompilasi StatistikSub-directorate of Statistical Compilation and Publication
Diterbitkan oleh/Published by:© Badan Pusat Statistik/BPS-Statistics Indonesia
Dicetak oleh/Printed by:
Dilarang mengumumkan, mendistribusikan, mengomunikasikan, dan/atau menggandakan sebagian atau seluruh isi buku ini untuk tujuan komersial tanpa izin tertulis dari Badan Pusat Statistik
Prohibited to announce, distribute, communicate, and/or copy part or all of this book for commercial purpose without permission from BPS-Statistics Indonesia
http
://www.b
ps.g
o.id
Statistik Tanaman Buah-Buahan dan Sayuran Tahunan Indonesia 2015 iii
KATA PENGANTAR
Statistik Tanaman Buah-buahan dan Sayuran Tahunan 2015 merupakan seri publikasi tahunan BPS yang berisi data jumlah tanaman yang menghasilkan dan produksi untuk 22 jenis tanaman buah-buahan tahunan dan 3 jenis tanaman sayuran tahunan pada setiap provinsi di Indonesia. Untuk mengetahui ekspor sejumlah komoditas, dalam buku ini disajikan pula kuantitas dan nilai ekspor ke beberapa negara tujuan.
Data yang disajikan merupakan Angka Tetap (ATAP) Tahun 2015 dan hasil kerja sama Badan Pusat Statistik dengan Direktorat Jenderal Hortikultura, Kementerian Pertanian. Pengumpulan data di lapangan dilakukan oleh aparat Dinas Pertanian di kabupaten/kota. Pengolahan data dilakukan oleh BPS Kabupaten/Kota atau BPS Provinsi berdasarkan laporan Kepala Cabang Dinas (KCD) seluruh kecamatan di Indonesia.
Kami sampaikan ucapan terima kasih kepada semua pihak yang telah membantu dalam pengumpulan, pengolahan, dan penyajian data sampai dapat diterbitkannya publikasi ini. Saran dari para pengguna publikasi ini yang bersifat membangun untuk perbaikan edisi di masa yang akan datang sangat diharapkan.
Jakarta, Oktober 2016Kepala Badan Pusat Statistik
Republik Indonesia
Dr. Suhariyanto
http
://www.b
ps.g
o.id
Statistics of Annual Fruit and Vegetable Plants Indonesia 2015iv
P R E F A C E
The Statistics of Annual Fruit and Vegetable Plants 2015 is an annual publication of BPS-Statistics Indonesia which provides data of harvested plant and production for 22 types of annual fruit and 3 types of annual vegetable at provincial level in Indonesia. Export of several commodities figures are presented in this publication such as quantities and values of export by country of destination.
The data is 2015 final figures as results of cooperating BPS-Statistics Indonesia with the Directorate General of Horticulture, Ministry of Agriculture. The field data collections were conducted by Agricultural Extension Services while data processing was managed by BPS Regional Office in each regency/municipality or province level based on the report submitted by the Agricultural Extension Services from all subdistrict in Indonesia.
We express our gratitude for all stakeholders who have contributed in collecting, processing, and reporting data for finishing this publication. Suggestions from the users to improve the next publication are welcome.
Jakarta, October 2016 BPS – Statistics Indonesia
Dr. Suhariyanto Chief Statistician
http
://www.b
ps.g
o.id
Statistik Tanaman Buah-Buahan dan Sayuran Tahunan Indonesia 2015 v
DAFTAR ISI/CONTENTS
KATA PENGANTAR ............................................................................................................................................. iii
PREFACE ............................................................................................................................................................. iv
DAFTAR ISI/CONTENTS ..................................................................................................................................... v
PENJELASAN/EXPLANATORY NOTES ............................................................................................................ 1
RINGKASAN/SUMMARY 2015 ......................................................................................................................... 11
TABEL-TABEL/TABLES ........................................................................................................................................ 28
1.1 Produksi dan Banyaknya Tanaman Alpukat yang Menghasilkan Menurut Provinsi 2015Production and Number of Harvested Plant of Avocado by Province 2015 . . . . . . . . . . . . . 28
1.2 Produksi dan Banyaknya Tanaman Anggur yang Menghasilkan Menurut Provinsi 2015Production and Number of Harvested Plant of Grape by Province 2015 . . . . . . . . . . . . . . . . . 30
1.3 Produksi dan Banyaknya Tanaman Apel yang Menghasilkan Menurut Provinsi 2015Production and Number of Harvested Plant of Apple by Province 2015 . . . . . . . . . . . . . . . . . . 32
1.4 Produksi dan Banyaknya Tanaman Belimbing yang Menghasilkan Menurut Provinsi 2015Production and Number of Harvested Plant of Star fruit by Province 2015 . . . . . . . . . . . . . 34
1.5 Produksi dan Banyaknya Tanaman Duku/Langsat/Kokosan yang Menghasilkan Menurut Provinsi 2015Production and Number of Harvested Plant of Duku by Province 2015 . . . . . . . . . . . . . . . . . . 36
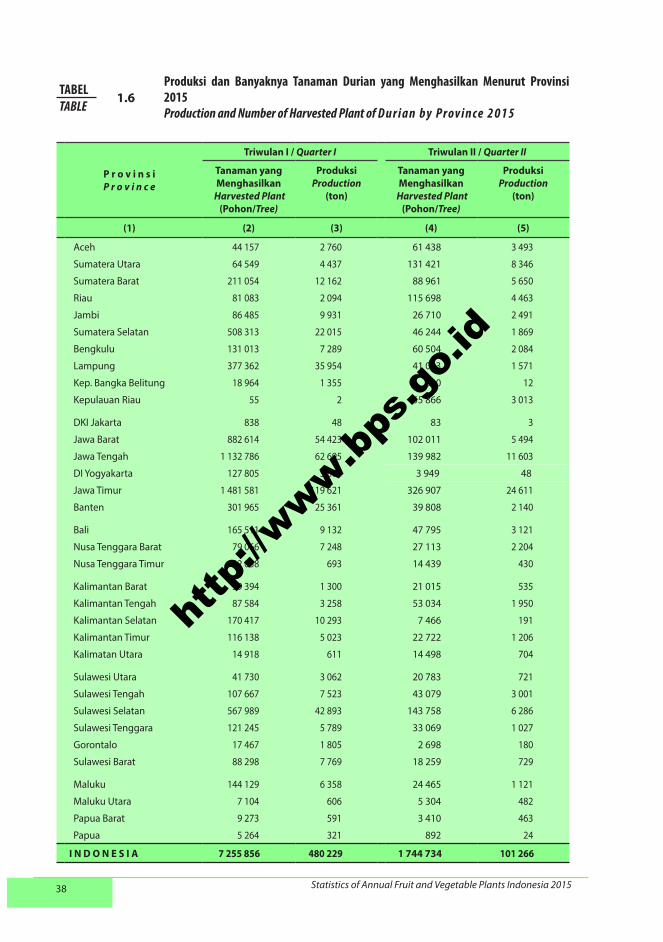
1.6 Produksi dan Banyaknya Tanaman Durian yang Menghasilkan Menurut Provinsi 2015Production and Number of Harvested Plant of Durian by Province 2015 . . . . . . . . . . . . . . . . 38
1.7 Produksi dan Banyaknya Tanaman Jambu Biji yang Menghasilkan Menurut Provinsi 2015Production and Number of Harvested Plant of Guava by Province 2015 . . . . . . . . . . . . . . . . 40
1.8 Produksi dan Banyaknya Tanaman Jambu Air yang Menghasilkan Menurut Provinsi 2015Production and Number of Harvested Plant of Rose Apple by Province 2015 . . . . . . . . . 42
1.9 Produksi dan Banyaknya Tanaman Jeruk Siam/Keprok yang Menghasilkan Menurut Provinsi 2015Production and Number of Harvested Plant of Orange/Tangerine by Province 2015 44
1.10 Produksi dan Banyaknya Tanaman Jeruk Besar yang Menghasilkan Menurut Provinsi 2015Production and Number of Harvested Plant of Pomelo by Province 2015 . . . . . . . . . . . . . . 46
1.11 Produksi dan Banyaknya Tanaman Mangga yang Menghasilkan Menurut Provinsi 2015Production and Number of Harvested Plant of Mango by Province 2015 . . . . . . . . . . . . . . . . 48
1.12 Produksi dan Banyaknya Tanaman Manggis yang Menghasilkan Menurut Provinsi 2015Production and Number of Harvested Plant of Mangosteen by Province 2015 . . . . . . . 50
DAFTAR ISI/CONTENTS
http
://www.b
ps.g
o.id
Statistics of Annual Fruit and Vegetable Plants Indonesia 2015vi
1.13 Produksi dan Banyaknya Tanaman Markisa yang Menghasilkan Menurut Provinsi 2015Production and Number of Harvested Plant of Marquisa by Province 2015......................... 52
1.14 Produksi dan Banyaknya Tanaman Nangka/Cempedak yang Menghasilkan Menurut Provinsi 2015Production and Number of Harvested Plant of Jackfruit by Province 2015 . . . . . . . . . . . . 54
1.15 Produksi dan Banyaknya Tanaman Nenas yang Menghasilkan Menurut Provinsi 2015Production and Number of Harvested Plant of Pineapple by Province 2015.. . . . . . . . . . 56
1.16 Produksi dan Banyaknya Tanaman Pepaya yang Menghasilkan Menurut Provinsi 2015Production and Number of Harvested Plant of Papaya by Province 2015 . . . . . . . . . . . . . . . 58
1.17 Produksi dan Banyaknya Tanaman Pisang yang Menghasilkan Menurut Provinsi 2015Production and Number of Harvested Plant of Banana by Province 2015 . . . . . . . . . . . . . . 60
1.18 Produksi dan Banyaknya Tanaman Rambutan yang Menghasilkan Menurut Provinsi 2015Production and Number of Harvested Plant of Rambutan by Province 2015 . . . . . . . . . . 62
1.19 Produksi dan Banyaknya Tanaman Salak yang Menghasilkan Menurut Provinsi 2015Production and Number of Harvested Plant of Salacca by Province 2015............................ 64
1.20 Produksi dan Banyaknya Tanaman Sawo yang Menghasilkan Menurut Provinsi 2015Production and Number of Harvested Plant of Sapodilla / Star Apple by Province 2015 .. 66
1.21 Produksi dan Banyaknya Tanaman Sirsak yang Menghasilkan Menurut Provinsi 2015Production and Number of Harvested Plant of Soursop by Province 2015 ........................... 68
1.22 Produksi dan Banyaknya Tanaman Sukun yang Menghasilkan Menurut Provinsi 2015Production and Number of Harvested Plant of Breadfruit by Province 2015........................ 70
1.23 Produksi dan Banyaknya Tanaman Jengkol yang Menghasilkan Menurut Provinsi 2015Production and Number of Harvested Plant of Jengkol by Province 2015 ............................ 72
1.24 Produksi dan Banyaknya Tanaman Melinjo yang Menghasilkan Menurut Provinsi 2015Production and Number of Harvested Plant of Melinjo by Province 2015 ............................ 74
1.25 Produksi dan Banyaknya Tanaman Petai yang Menghasilkan Menurut Provinsi 2015Production and Number of Harvested Plant of Twisted Cluster Bean by Province 2015..... 76
2.1 Tanaman Menghasilkan Buah-Buahan dan Sayuran Tahunan Triwulan I Tahun 2006 - 2015Harvested Plants of Annual Fruit and Vegetable First Quarter in 2006 - 2015 ...................... 78
2.2 Tanaman Menghasilkan Buah-Buahan dan Sayuran Tahunan Triwulan II Tahun 2006 - 2015Harvested Plants of Annual Fruit and Vegetable Second Quarter in 2006 - 2015 ................ 80
2.3 Tanaman Menghasilkan Buah-Buahan dan Sayuran Tahunan Triwulan III Tahun 2006 - 2015Harvested Plants of Annual Fruit and Vegetable Third Quarter in 2006 - 2015 ..................... 82
http
://www.b
ps.g
o.id
Statistik Tanaman Buah-Buahan dan Sayuran Tahunan Indonesia 2015 vii
2.4 Tanaman Menghasilkan Buah-Buahan dan Sayuran Tahunan Triwulan IV Tahun 2006 - 2015Harvested Plants of Annual Fruit and Vegetable Fourth Quarter in 2006 - 2015 ... 84
3.1 Produksi Buah-Buahan dan Sayuran Tahunan Triwulan I Tahun 2006 - 2015Production of Annual Fruit and Vegetable First Quarter in 2006 - 2015 ................................. 86
3.2 Produksi Buah-Buahan dan Sayuran Tahunan Triwulan II Tahun 2006 - 2015Production of Annual Fruit and Vegetable Second Quarter in 2006 - 2015 . . . . . 88
3.3 Produksi Buah-Buahan dan Sayuran Tahunan Triwulan III Tahun 2006 - 2015Production of Annual Fruit and Vegetable Third Quarter in 2006 - 2015 ............................... 90
3.4 Produksi Buah-Buahan dan Sayuran Tahunan Triwulan IV Tahun 2006 - 2015Production of Annual Fruit and Vegetable Fourth Quarter in 2006 - 2015 ............................ 92
3.5 Produksi Buah-Buahan dan Sayuran Tahunan Tahun 2006 - 2015Production of Annual Fruit and Vegetable in 2006 - 2015 ........................................................... 94
LAMPIRAN / APPENDIX..................................................................................................................................... 98
http
://www.b
ps.g
o.id

Statistics of Annual Fruit and Vegetable Plants Indonesia 2015viii
http
://www.b
ps.g
o.id
Statistik Tanaman Buah-Buahan dan Sayuran Tahunan Indonesia 2015 1
P E N J E L A S A NP E N D A H U L U A N1 .
Pengumpulan data tanaman hortikultura diselenggarakan oleh Badan Pusat Statistik (BPS) bekerja sama dengan Direktorat Jenderal Hortikultura, Kementerian Pertanian. Landasan hukum dalam pengumpulan, pengolahan, dan penyajian data adalah sebagai berikut:
a. Undang-undang Nomor 16 tahun 1997 tentang statistik.
b. Peraturan Pemerintah Nomor 51 Tahun 1999 tentang penyelenggaraan statistik.
c. Keputusan Menteri Pertanian Nomor 527/Kpts/DP/1970 tanggal 9 November 1970.
d. Keputusan Menteri Pertanian Nomor 511/Kpts/PD.310/9/2006.
e. Instruksi Menteri Ekonomi, Keuangan dan Industri Nomor IN/05/MEKUIN/73 tanggal 23 Januari 1973.
f. Instruksi Menteri Dalam Negeri Nomor 3 tahun 1973.
g. Instruksi bersama Direktur Jendral Pertanian Tanaman Pangan dan Kepala Biro Pusat Statistik Nomor SK 47/DPP/XI/1972 tanggal 20 November 1972.
h. Instruksi bersama Direktur Jendral Pertanian Tanaman Pangan dan Kepala Biro Pusat Statistik Nomor
20/DJPTP/VI/1975 P.2/1/II/1975 Tanggal 23 Juni 1975.i. Instruksi bersama Direktur Jendral
Pertanian Tanaman Pangan dan Kepala Biro Pusat Statistik Nomor I.HK.050.84.86 , Tanggal 17 Desember 1984.
04110.0288j. Nota Kesepahaman Nomor 04/MOU/OT.030/M/2/2015 03/KS.M/27-II/2015
E X P L A N A T O R Y N O T E S
I N T R O D U C T I O N1 .
Data Collection for Horticulture is carried out by BPS Statistics Indonesia in cooperation with the Directorate General of Horticulture, Ministry of Agriculture. The data collection, processing, and dissemination are based on the following law foundation :
a. Statistics Law No. 16, 1997 about statistics.
b. Government Regulation No. 51, 1999 about implementation of statistics.
c. The Agricultural Minister Decree No. 527/Kpts/DP/1970, November 9, 1970.
d. The Agricultural Minister Decree No. 511/Kpts/PD.310/9/2006.
e. The Instruction of Minister of Economics, Finance and Industry No. IN/05/MEKUIN/73, January 23, 1973.
f. The Instruction of Minister of Home Affairs No. 3 of 1973.
g. The Instruction of General - Director of Food Crops and General - Director of the Central Bureau of Statistics No. SK. 47/DPP/XI/1972, November 20, 1972.
h. The Instruction of General - Director of Food Crops and General - Director of Central Bureau of Statistics
No. 20/DJPTP/VI/1975 , P.2/1/II/1975 June 23, 1975.i. The Instruction of General - Director of
Food Crops and General - Director of Central Bureau of Statistics.
No. I.HK.050.84.86 , December 17, 1984. 04110.0288j. Memorandum of Understanding No. 04/MOU/OT.030/M/2/2015 03/KS.M/27-II/2015
http
://www.b
ps.g
o.id
Statistics of Annual Fruit and Vegetable Plants Indonesia 20152
Sub sektor hortikultura telah berkontribusi secara nyata dalam mendukung perekonomian nasional, baik dalam penyediaan produk pangan, kesehatan dan kosmetika, perdagangan, penciptaan produk domestik bruto maupun penyerapan tenaga kerja.
Data statistik tanaman buah-buahan dan sayuran tahunan dibutuhkan oleh pemerintah dan pengusaha (dunia usaha) untuk perencanaan dan pengambilan kebijakan agar pengembangan dan perumusan perencanaan kebijakan, dan evaluasi pembangunan tanaman buah-buahan dan sayuran tahunan lebih tepat sasaran.
DATA YANG DIKUMPULKAN2 .
Dalam pengumpulan data Statistik Pertanian Hortikultura (SPH) dikumpulkan data tentang jumlah tanaman akhir triwulan yang lalu, tanaman yang dibongkar/ditebang, tanaman baru/penanaman baru, tanaman belum menghasilkan, tanaman produktif (yang menghasilkan dan yang sedang tidak menghasilkan), tanaman tua/rusak, jumlah tanaman akhir triwulan, produksi dan harga jual petani per kilogram.
Data Hortikultura Tanaman Buah-Buahan dan Sayuran Tahunan yang dikumpulkan mencakup 22 (dua puluh dua) jenis buah-buahan tahunan, yaitu : Alpukat, Belimbing, Duku/Langsat/Kokosan, Durian, Jambu Biji, Jambu Air, Jeruk Siam/Keprok, Jeruk Besar, Mangga, Manggis, Nangka/Cempedak, Nenas, Pepaya, Pisang, Rambutan, Salak, Sawo, Sirsak, Markisa, Sukun, Apel, Anggur dan dan 3 (tiga) jenis sayuran tahunan, yaitu Melinjo, Petai, dan Jengkol.
Horticulture sub-sector has contributed significantly in supporting national economy, availability of food products, health and cosmetics, trade, construction of gross domestic product, and absorption of worker.
Statistical data of annual fruit and vegetable plants are needed by government and businessman (business) for planning and policy making in order to the development and formulation of policy planning and development evaluation of annual fruit and vegetable plants more precise of the target.
INFORMATION COLLECTED2 .
Data collection in Agriculture Survey for Horticulture collects information on standing crops at the end of previous quarter, demolished plant, replanting plant, young plant, productive plant (harvested and non harvested), old/damage plant, standing crops at the end of reporting quarter, production, and price at farm market (Rp/Kg).
The data of annual fruit and vegetable plants which is collected from Agriculture for Horticulture in Annual Fruit Plants includes 22 type of plants are: Avocado, Star Fruit, Duku, Durian, Guava, Rose Apple, Orange/Tangerine, Pomelo, Mango, Mangosteen, Jackfruit, Pineapple, Papaya, Banana, Rambutan, Salacca, Sapodilla/Star Apple, Soursop, Marquisa, Breadfruit, Apple, Grape and 3 Annual Vegetable Plants are Melinjo, Twisted Cluster Bean, and Jengkol.
http
://www.b
ps.g
o.id
Statistik Tanaman Buah-Buahan dan Sayuran Tahunan Indonesia 2015 3
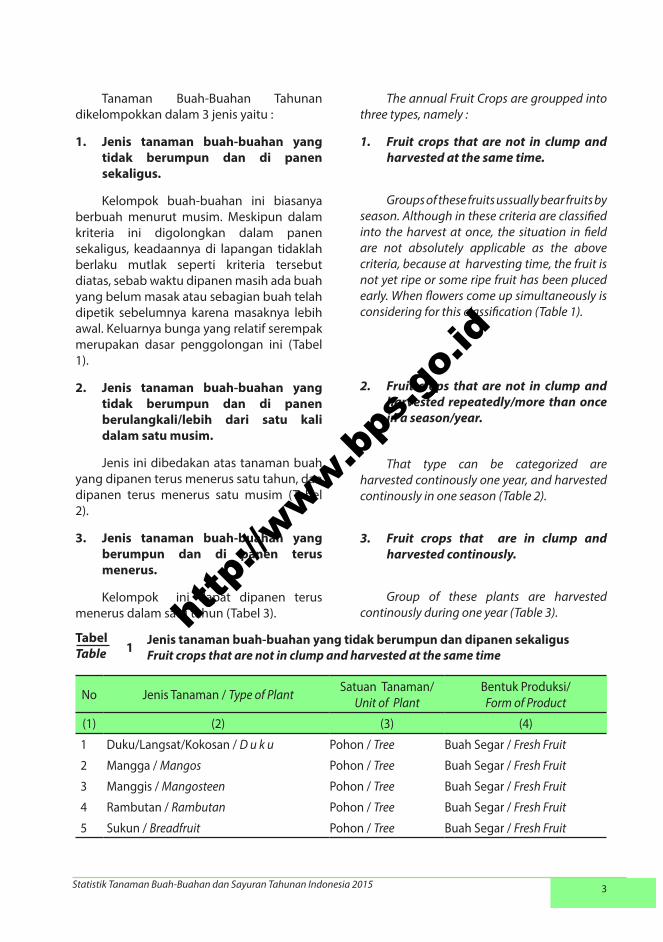
Tanaman Buah-Buahan Tahunan dikelompokkan dalam 3 jenis yaitu :
1. Jenis tanaman buah-buahan yang tidak berumpun dan di panen sekaligus.
Kelompok buah-buahan ini biasanya berbuah menurut musim. Meskipun dalam kriteria ini digolongkan dalam panen sekaligus, keadaannya di lapangan tidaklah berlaku mutlak seperti kriteria tersebut diatas, sebab waktu dipanen masih ada buah yang belum masak atau sebagian buah telah dipetik sebelumnya karena masaknya lebih awal. Keluarnya bunga yang relatif serempak merupakan dasar penggolongan ini (Tabel 1).
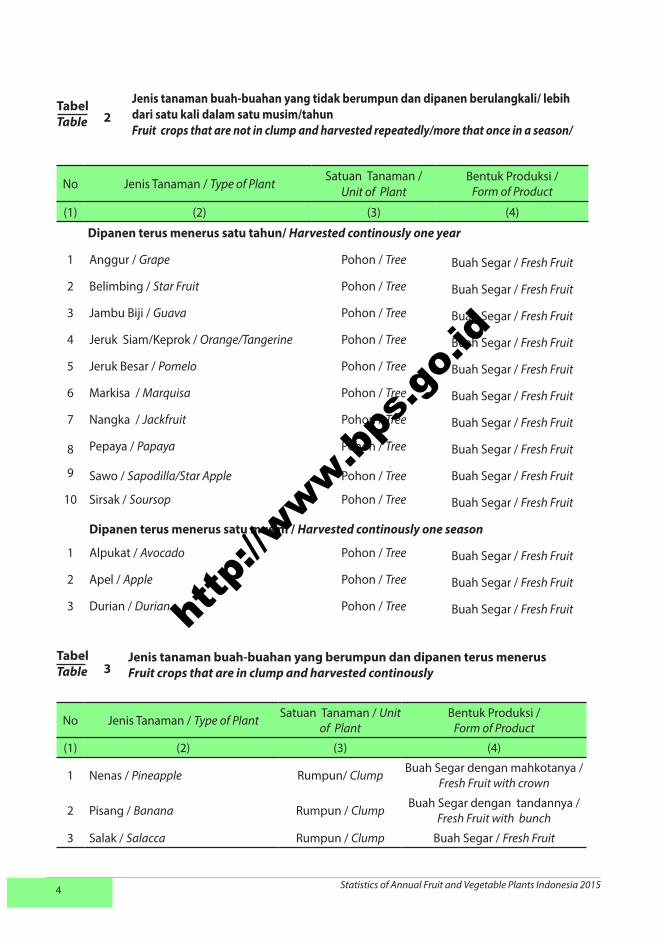
2. Jenis tanaman buah-buahan yang tidak berumpun dan di panen berulangkali/lebih dari satu kali dalam satu musim.
Jenis ini dibedakan atas tanaman buah yang dipanen terus menerus satu tahun, dan dipanen terus menerus satu musim (Tabel 2).
3. Jenis tanaman buah-buahan yang berumpun dan di panen terus menerus.
Kelompok ini dapat dipanen terus menerus dalam satu tahun (Tabel 3).
No Jenis Tanaman / Type of Plant Satuan Tanaman/ Unit of Plant
Bentuk Produksi/Form of Product
(1) (2) (3) (4)
1 Duku/Langsat/Kokosan / D u k u Pohon / Tree Buah Segar / Fresh Fruit
2 Mangga / Mangos Pohon / Tree Buah Segar / Fresh Fruit
3 Manggis / Mangosteen Pohon / Tree Buah Segar / Fresh Fruit
4 Rambutan / Rambutan Pohon / Tree Buah Segar / Fresh Fruit
5 Sukun / Breadfruit Pohon / Tree Buah Segar / Fresh Fruit
TabelTable 1 Jenis tanaman buah-buahan yang tidak berumpun dan dipanen sekaligus
Fruit crops that are not in clump and harvested at the same time
The annual Fruit Crops are groupped into three types, namely :
1. Fruit crops that are not in clump and harvested at the same time.
Groups of these fruits ussually bear fruits by season. Although in these criteria are classified into the harvest at once, the situation in field are not absolutely applicable as the above criteria, because at harvesting time, the fruit is not yet ripe or some ripe fruit has been pluced early. When flowers come up simultaneously is considering for this classification (Table 1).
2. Fruit crops that are not in clump and harvested repeatedly/more than once in a season/year.
That type can be categorized are harvested continously one year, and harvested continously in one season (Table 2).
3. Fruit crops that are in clump and harvested continously.
Group of these plants are harvested continously during one year (Table 3).ht
tp://w
ww.bps
.go.
id
Statistics of Annual Fruit and Vegetable Plants Indonesia 20154
No Jenis Tanaman / Type of Plant Satuan Tanaman / Unit of Plant
Bentuk Produksi / Form of Product
(1) (2) (3) (4)
Dipanen terus menerus satu tahun/ Harvested continously one year
1 Anggur / Grape Pohon / Tree Buah Segar / Fresh Fruit
2 Belimbing / Star Fruit Pohon / Tree Buah Segar / Fresh Fruit
3 Jambu Biji / Guava Pohon / Tree Buah Segar / Fresh Fruit
4 Jeruk Siam/Keprok / Orange/Tangerine Pohon / Tree Buah Segar / Fresh Fruit
5 Jeruk Besar / Pomelo Pohon / Tree Buah Segar / Fresh Fruit
6 Markisa / Marquisa Pohon / Tree Buah Segar / Fresh Fruit
7 Nangka / Jackfruit Pohon / Tree Buah Segar / Fresh Fruit
8 Pepaya / Papaya Pohon / Tree Buah Segar / Fresh Fruit
9 Sawo / Sapodilla/Star Apple Pohon / Tree Buah Segar / Fresh Fruit
10 Sirsak / Soursop Pohon / Tree Buah Segar / Fresh Fruit
Dipanen terus menerus satu musim / Harvested continously one season
1 Alpukat / Avocado Pohon / Tree Buah Segar / Fresh Fruit
2 Apel / Apple Pohon / Tree Buah Segar / Fresh Fruit
3 Durian / Durian Pohon / Tree Buah Segar / Fresh Fruit
Jenis tanaman buah-buahan yang tidak berumpun dan dipanen berulangkali/ lebih dari satu kali dalam satu musim/tahunFruit crops that are not in clump and harvested repeatedly/more that once in a season/
TabelTable 2
No Jenis Tanaman / Type of Plant Satuan Tanaman / Unit of Plant
Bentuk Produksi / Form of Product
(1) (2) (3) (4)
1 Nenas / Pineapple Rumpun/ Clump Buah Segar dengan mahkotanya / Fresh Fruit with crown
2 Pisang / Banana Rumpun / Clump Buah Segar dengan tandannya / Fresh Fruit with bunch
3 Salak / Salacca Rumpun / Clump Buah Segar / Fresh Fruit
TabelTable
Jenis tanaman buah-buahan yang berumpun dan dipanen terus menerusFruit crops that are in clump and harvested continously 3
http
://www.b
ps.g
o.id
Statistik Tanaman Buah-Buahan dan Sayuran Tahunan Indonesia 2015 5
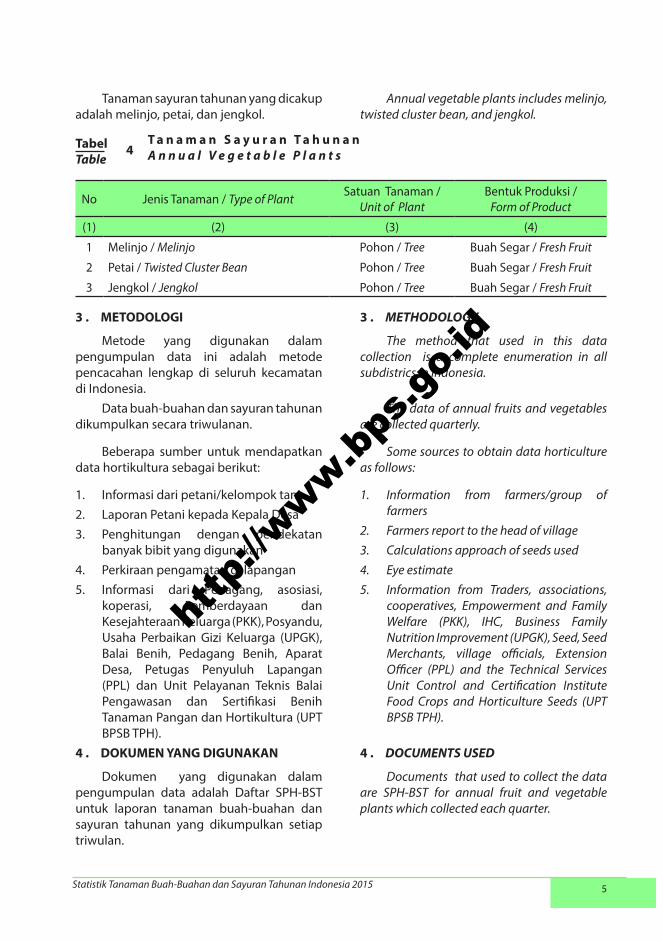
Tanaman sayuran tahunan yang dicakup adalah melinjo, petai, dan jengkol.
METODOLOGI3 .
Metode yang digunakan dalam pengumpulan data ini adalah metode pencacahan lengkap di seluruh kecamatan di Indonesia.
Data buah-buahan dan sayuran tahunan dikumpulkan secara triwulanan.
Beberapa sumber untuk mendapatkan data hortikultura sebagai berikut:
1. Informasi dari petani/kelompok tani2. Laporan Petani kepada Kepala Desa3. Penghitungan dengan pendekatan
banyak bibit yang digunakan4. Perkiraan pengamatan di lapangan5. Informasi dari Pedagang, asosiasi,
koperasi, Pemberdayaan dan Kesejahteraan Keluarga (PKK), Posyandu, Usaha Perbaikan Gizi Keluarga (UPGK), Balai Benih, Pedagang Benih, Aparat Desa, Petugas Penyuluh Lapangan (PPL) dan Unit Pelayanan Teknis Balai Pengawasan dan Sertifikasi Benih Tanaman Pangan dan Hortikultura (UPT BPSB TPH). DOKUMEN YANG DIGUNAKAN4 .
Dokumen yang digunakan dalam pengumpulan data adalah Daftar SPH-BST untuk laporan tanaman buah-buahan dan sayuran tahunan yang dikumpulkan setiap triwulan.
No Jenis Tanaman / Type of Plant Satuan Tanaman / Unit of Plant
Bentuk Produksi /Form of Product
(1) (2) (3) (4)
1 Melinjo / Melinjo Pohon / Tree Buah Segar / Fresh Fruit
2 Petai / Twisted Cluster Bean Pohon / Tree Buah Segar / Fresh Fruit
3 Jengkol / Jengkol Pohon / Tree Buah Segar / Fresh Fruit
TabelTable
T a n a m a n S a y u r a n T a h u n a nA n n u a l V e g e t a b l e P l a n t s 4
Annual vegetable plants includes melinjo, twisted cluster bean, and jengkol.
METHODOLOGY3 .
The method that used in this data collection is a complete enumeration in all subdistrics in Indonesia.
The data of annual fruits and vegetables are collected quarterly.
Some sources to obtain data horticulture as follows:
1. Information from farmers/group of farmers
2. Farmers report to the head of village3. Calculations approach of seeds used 4. Eye estimate5. Information from Traders, associations,
cooperatives, Empowerment and Family Welfare (PKK), IHC, Business Family Nutrition Improvement (UPGK), Seed, Seed Merchants, village officials, Extension Officer (PPL) and the Technical Services Unit Control and Certification Institute Food Crops and Horticulture Seeds (UPT BPSB TPH).
DOCUMENTS USED4 .
Documents that used to collect the data are SPH-BST for annual fruit and vegetable plants which collected each quarter.
http
://www.b
ps.g
o.id
Statistics of Annual Fruit and Vegetable Plants Indonesia 20156
ORGANISASI PENGUMPULAN DATA5 .
Laporan tanaman buah-buahan dan sayuran tahunan diisi secara triwulanan oleh Mantri Tani/Kepala Cabang Dinas (KCD) dan dibuat rangkap 4 (empat). Dokumen asli dikirimkan kepada BPS Provinsi, tembusannya dikirimkan ke BPS Kabupaten/Kota, Dinas Pertanian Kabupaten, dan satu sebagai arsip di KCD.
PENGOLAHAN6 .
Daftar SPH-BST hasil pencacahan dikumpulkan di BPS Kabupaten/Kota dari setiap kecamatan.
Pengolahan data dilakukan di BPS Kabupaten/Kota dengan menggunakan program aplikasi Statistik Pertanian Hortikultura Online (SPH Online). Pengolahan mulai dari entri data sampai dengan proses rekapitulasi di tingkat kabupaten/kota sampai dengan tingkat nasional.
KONSEP DAN DEFINISI7 .
Konsep dan definisi yang dijelaskan adalah konsep dan definisi yang digunakan dalam pengumpulan data dengan Daftar SPH-BST, yaitu :
a. Tanaman buah-buahan tahunan adalah tanaman sumber vitamin, garam mineral dan lain-lain yang dikonsumsi dari bagian tanaman yang berupa buah dan merupakan tanaman tahunan
b. Tanaman sayuran tahunan adalah tanaman sumber vitamin, garam, mineral dan lain-lain yang dikonsumsi dari bagian tanaman yang berupa daun, bunga, buah dan umbinya yang berumur lebih dari satu tahun serta berbentuk pohon.
c. Tanaman yang menghasilkan adalah tanaman yang pada triwulan yang bersangkutan dipetik hasilnya
ORGANIZATION OF DATA COLLECTION5 .
The report on annual fruit and vegetable plants are filled quarterly by the Agricultural Extention Service (KCD). Each questionaire is made in 4 (four) copies. The original copy is sent to BPS - Statistics in Provincial level, while the others are sent to BPS - Statistics in Regency/Municipality level, the Agriculture Office at Regency/Municipality, and the rest as an archive at the KCD.
PROCESSING6 .
SPH-BST enumeration are collected in BPS Regency/Municipality of each district.
Data processing was performed using application program ‘Statistik Pertanian Hortikultura Online’ (SPH Online). Statistical data of horticulture processed, starting from data entry up to recapitulation in district level to national level.
CONCEPTS AND DEFINITION7 .
Concepts and definitions that are described are concepts and definitions used in the data collection which are collected in SPH-BST (.annual fruit and vegetable plants report) documents, i.e. :
a. Annual Fruit plants are plants which are the source of vitamin, contained mineral salt, etc., consumed from part of plant in the form of fruits and more than one year of age.
b. Annual vegetable plants are plants which are the source of vitamin, contained mineral, salt,etc., consumed from part of the plants in the form of vegetables and more than one year of age.
c. Harvested plant are plant that are harvested at the reporting quarter.
http
://www.b
ps.g
o.id
Statistik Tanaman Buah-Buahan dan Sayuran Tahunan Indonesia 2015 7
d. Produksi adalah banyaknya hasil menurut bentuk hasil yang ditetapkan dan merupakan penjumlahan laporan per triwulan.
e. Bentuk produksi buah-buahan dinyatakan dalam buah segar. Khusus untuk pisang dihitung dengan tandan dan Nenas dengan mahkotanya.
d. Production is the product quantity in standard form and it is summation of quarterly report.
e. Form of production are expressed as fresh fruits, except for banana, which are reported in bunch and pineapple with crown.
http
://www.b
ps.g
o.id

http
://www.b
ps.g
o.id
Statistik Tanaman Buah-Buahan dan Sayuran Tahunan Indonesia 2015 9
http
://www.b
ps.g
o.id
Statistics of Annual Fruit and Vegetable Plants Indonesia 201510
http
://www.b
ps.g
o.id
Statistik Tanaman Buah-Buahan dan Sayuran Tahunan Indonesia 2015 11
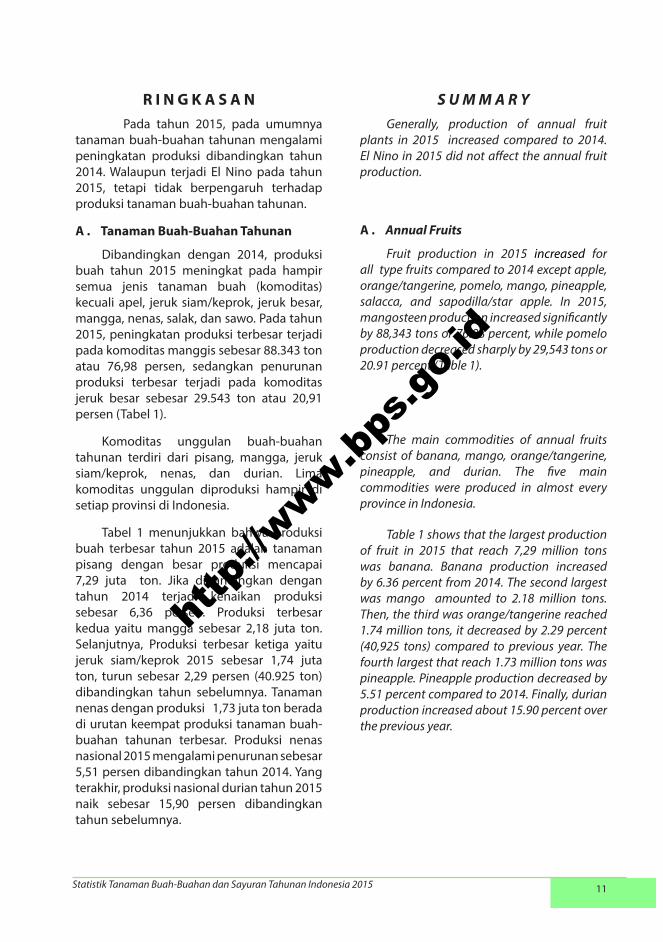
R I N G K A S A N Pada tahun 2015, pada umumnya
tanaman buah-buahan tahunan mengalami peningkatan produksi dibandingkan tahun 2014. Walaupun terjadi El Nino pada tahun 2015, tetapi tidak berpengaruh terhadap produksi tanaman buah-buahan tahunan.
Tanaman Buah-Buahan TahunanA .
Dibandingkan dengan 2014, produksi buah tahun 2015 meningkat pada hampir semua jenis tanaman buah (komoditas) kecuali apel, jeruk siam/keprok, jeruk besar, mangga, nenas, salak, dan sawo. Pada tahun 2015, peningkatan produksi terbesar terjadi pada komoditas manggis sebesar 88.343 ton atau 76,98 persen, sedangkan penurunan produksi terbesar terjadi pada komoditas jeruk besar sebesar 29.543 ton atau 20,91 persen (Tabel 1).
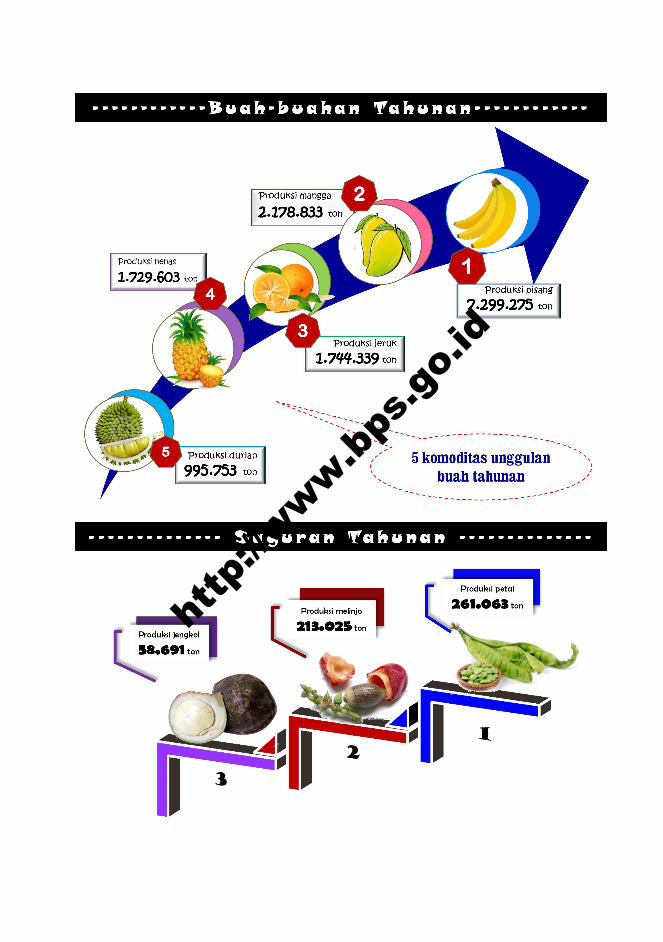
Komoditas unggulan buah-buahan tahunan terdiri dari pisang, mangga, jeruk siam/keprok, nenas, dan durian. Lima komoditas unggulan diproduksi hampir di setiap provinsi di Indonesia.
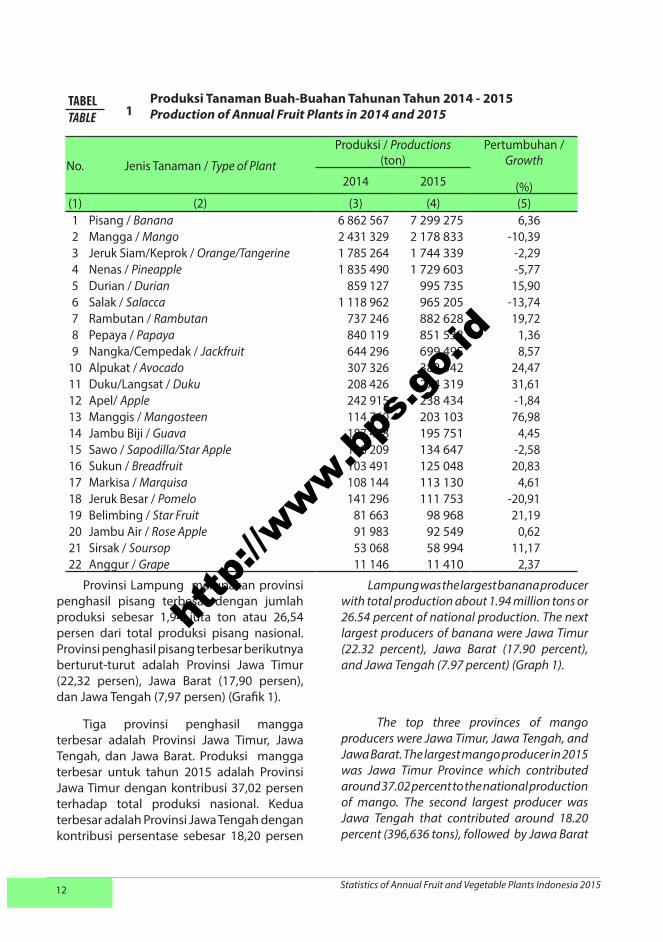
Tabel 1 menunjukkan bahwa produksi buah terbesar tahun 2015 adalah tanaman pisang dengan besar produksi mencapai 7,29 juta ton. Jika dibandingkan dengan tahun 2014 terjadi kenaikan produksi sebesar 6,36 persen. Produksi terbesar kedua yaitu mangga sebesar 2,18 juta ton. Selanjutnya, Produksi terbesar ketiga yaitu jeruk siam/keprok 2015 sebesar 1,74 juta ton, turun sebesar 2,29 persen (40.925 ton) dibandingkan tahun sebelumnya. Tanaman nenas dengan produksi 1,73 juta ton berada di urutan keempat produksi tanaman buah-buahan tahunan terbesar. Produksi nenas nasional 2015 mengalami penurunan sebesar 5,51 persen dibandingkan tahun 2014. Yang terakhir, produksi nasional durian tahun 2015 naik sebesar 15,90 persen dibandingkan tahun sebelumnya.
S U M M A R YGenerally, production of annual fruit
plants in 2015 increased compared to 2014. El Nino in 2015 did not affect the annual fruit production.
Annual FruitsA .
Fruit production in 2015 increased for all type fruits compared to 2014 except apple, orange/tangerine, pomelo, mango, pineapple, salacca, and sapodilla/star apple. In 2015, mangosteen production increased significantly by 88,343 tons or 76.98 percent, while pomelo production decreased sharply by 29,543 tons or 20.91 percent (Table 1).
The main commodities of annual fruits consist of banana, mango, orange/tangerine, pineapple, and durian. The five main commodities were produced in almost every province in Indonesia.
Table 1 shows that the largest production of fruit in 2015 that reach 7,29 million tons was banana. Banana production increased by 6.36 percent from 2014. The second largest was mango amounted to 2.18 million tons. Then, the third was orange/tangerine reached 1.74 million tons, it decreased by 2.29 percent (40,925 tons) compared to previous year. The fourth largest that reach 1.73 million tons was pineapple. Pineapple production decreased by 5.51 percent compared to 2014. Finally, durian production increased about 15.90 percent over the previous year.
http
://www.b
ps.g
o.id
Statistics of Annual Fruit and Vegetable Plants Indonesia 201512
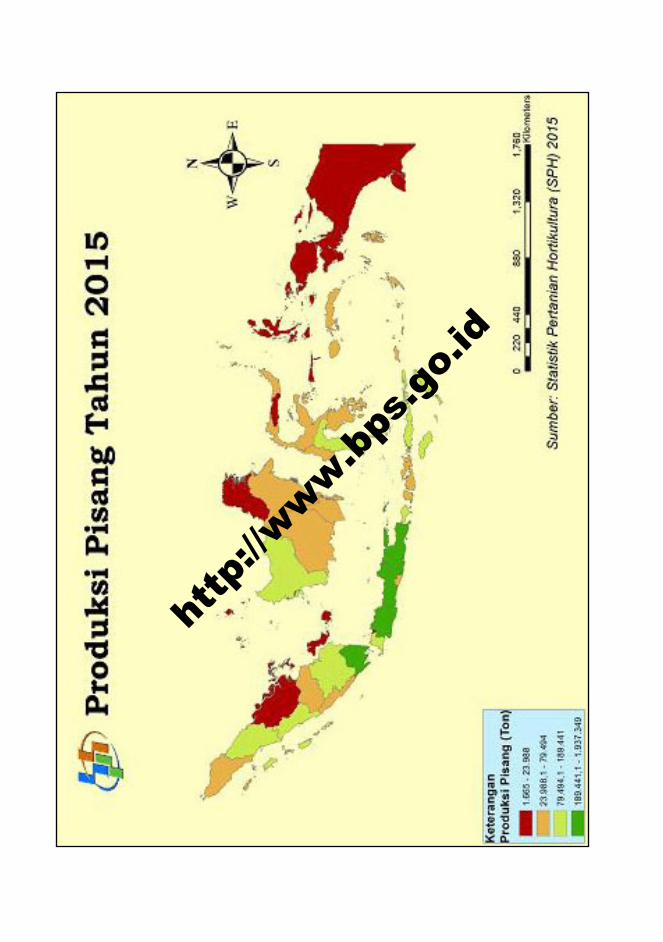
Provinsi Lampung merupakan provinsi penghasil pisang terbesar dengan jumlah produksi sebesar 1,94 juta ton atau 26,54 persen dari total produksi pisang nasional. Provinsi penghasil pisang terbesar berikutnya berturut-turut adalah Provinsi Jawa Timur (22,32 persen), Jawa Barat (17,90 persen), dan Jawa Tengah (7,97 persen) (Grafik 1).
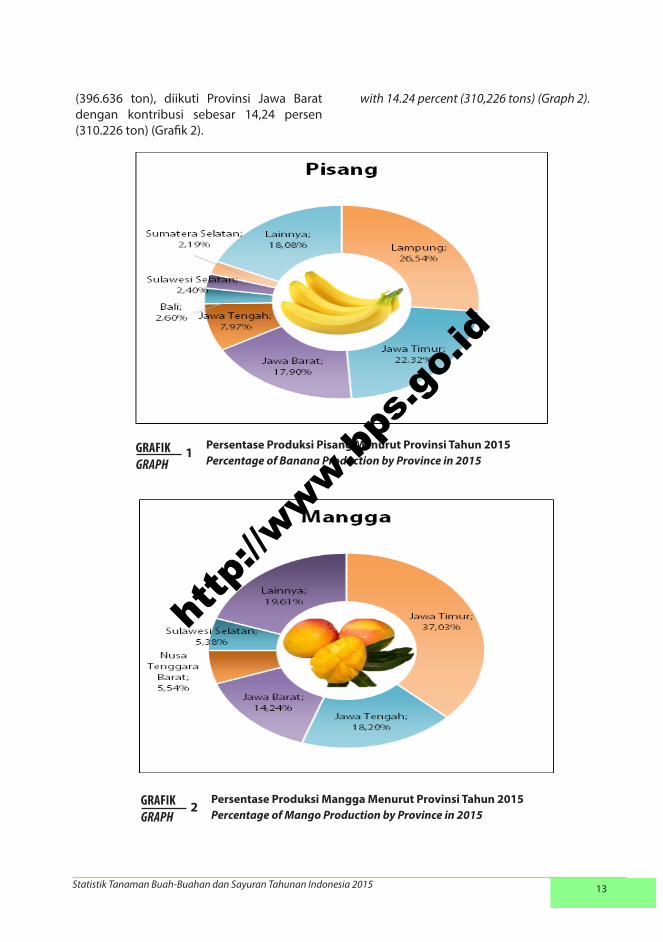
Tiga provinsi penghasil mangga terbesar adalah Provinsi Jawa Timur, Jawa Tengah, dan Jawa Barat. Produksi mangga terbesar untuk tahun 2015 adalah Provinsi Jawa Timur dengan kontribusi 37,02 persen terhadap total produksi nasional. Kedua terbesar adalah Provinsi Jawa Tengah dengan kontribusi persentase sebesar 18,20 persen
No. Jenis Tanaman / Type of Plant
Produksi / Productions (ton)
Pertumbuhan / Growth
(%)2014 2015
(1) (2) (3) (4) (5)1 Pisang / Banana 6 862 567 7 299 275 6,362 Mangga / Mango 2 431 329 2 178 833 -10,393 Jeruk Siam/Keprok / Orange/Tangerine 1 785 264 1 744 339 -2,294 Nenas / Pineapple 1 835 490 1 729 603 -5,775 Durian / Durian 859 127 995 735 15,906 Salak / Salacca 1 118 962 965 205 -13,747 Rambutan / Rambutan 737 246 882 628 19,728 Pepaya / Papaya 840 119 851 532 1,369 Nangka/Cempedak / Jackfruit 644 296 699 495 8,57
10 Alpukat / Avocado 307 326 382 542 24,4711 Duku/Langsat / Duku 208 426 274 319 31,6112 Apel/ Apple 242 915 238 434 -1,8413 Manggis / Mangosteen 114 760 203 103 76,9814 Jambu Biji / Guava 187 418 195 751 4,4515 Sawo / Sapodilla/Star Apple 138 209 134 647 -2,5816 Sukun / Breadfruit 103 491 125 048 20,8317 Markisa / Marquisa 108 144 113 130 4,6118 Jeruk Besar / Pomelo 141 296 111 753 -20,9119 Belimbing / Star Fruit 81 663 98 968 21,1920 Jambu Air / Rose Apple 91 983 92 549 0,6221 Sirsak / Soursop 53 068 58 994 11,1722 Anggur / Grape 11 146 11 410 2,37
Produksi Tanaman Buah-Buahan Tahunan Tahun 2014 - 2015Production of Annual Fruit Plants in 2014 and 2015
TABELTABLE 1
Lampung was the largest banana producer with total production about 1.94 million tons or 26.54 percent of national production. The next largest producers of banana were Jawa Timur (22.32 percent), Jawa Barat (17.90 percent), and Jawa Tengah (7.97 percent) (Graph 1).
The top three provinces of mango producers were Jawa Timur, Jawa Tengah, and Jawa Barat. The largest mango producer in 2015 was Jawa Timur Province which contributed around 37.02 percent to the national production of mango. The second largest producer was Jawa Tengah that contributed around 18.20 percent (396,636 tons), followed by Jawa Barat
http
://www.b
ps.g
o.id
Statistik Tanaman Buah-Buahan dan Sayuran Tahunan Indonesia 2015 13
(396.636 ton), diikuti Provinsi Jawa Barat dengan kontribusi sebesar 14,24 persen (310.226 ton) (Grafik 2).
with 14.24 percent (310,226 tons) (Graph 2).
Persentase Produksi Pisang Menurut Provinsi Tahun 2015Percentage of Banana Production by Province in 2015
GRAFIKGRAPH
1
Persentase Produksi Mangga Menurut Provinsi Tahun 2015Percentage of Mango Production by Province in 2015
GRAFIKGRAPH
2
http
://www.b
ps.g
o.id
Statistics of Annual Fruit and Vegetable Plants Indonesia 201514
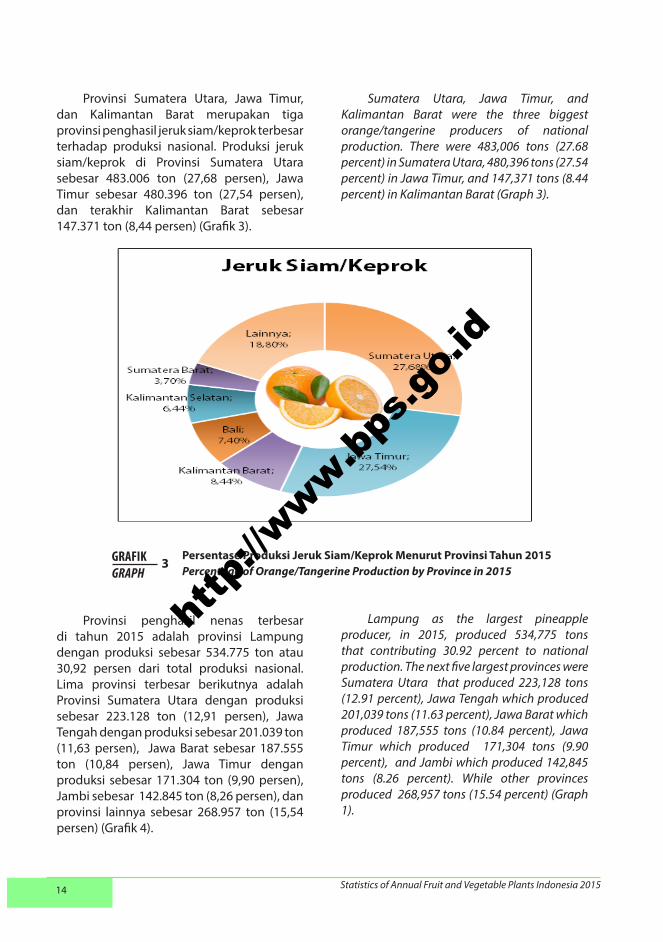
Provinsi Sumatera Utara, Jawa Timur, dan Kalimantan Barat merupakan tiga provinsi penghasil jeruk siam/keprok terbesar terhadap produksi nasional. Produksi jeruk siam/keprok di Provinsi Sumatera Utara sebesar 483.006 ton (27,68 persen), Jawa Timur sebesar 480.396 ton (27,54 persen), dan terakhir Kalimantan Barat sebesar 147.371 ton (8,44 persen) (Grafik 3).
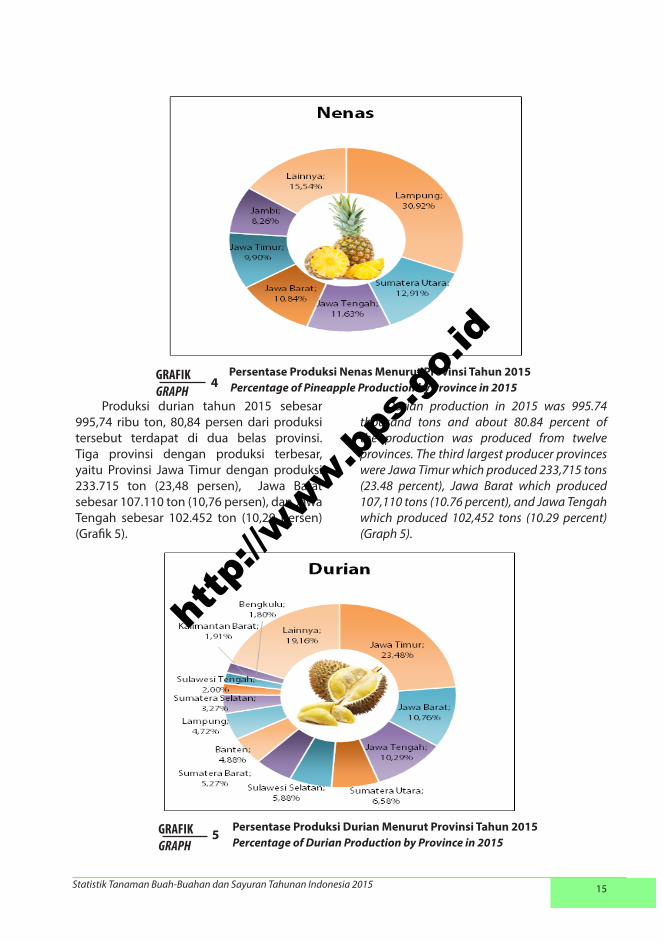
Provinsi penghasil nenas terbesar di tahun 2015 adalah provinsi Lampung dengan produksi sebesar 534.775 ton atau 30,92 persen dari total produksi nasional. Lima provinsi terbesar berikutnya adalah Provinsi Sumatera Utara dengan produksi sebesar 223.128 ton (12,91 persen), Jawa Tengah dengan produksi sebesar 201.039 ton (11,63 persen), Jawa Barat sebesar 187.555 ton (10,84 persen), Jawa Timur dengan produksi sebesar 171.304 ton (9,90 persen), Jambi sebesar 142.845 ton (8,26 persen), dan provinsi lainnya sebesar 268.957 ton (15,54 persen) (Grafik 4).
Sumatera Utara, Jawa Timur, and Kalimantan Barat were the three biggest orange/tangerine producers of national production. There were 483,006 tons (27.68 percent) in Sumatera Utara, 480,396 tons (27.54 percent) in Jawa Timur, and 147,371 tons (8.44 percent) in Kalimantan Barat (Graph 3).
Lampung as the largest pineapple producer, in 2015, produced 534,775 tons that contributing 30.92 percent to national production. The next five largest provinces were Sumatera Utara that produced 223,128 tons (12.91 percent), Jawa Tengah which produced 201,039 tons (11.63 percent), Jawa Barat which produced 187,555 tons (10.84 percent), Jawa Timur which produced 171,304 tons (9.90 percent), and Jambi which produced 142,845 tons (8.26 percent). While other provinces produced 268,957 tons (15.54 percent) (Graph 1).
Persentase Produksi Jeruk Siam/Keprok Menurut Provinsi Tahun 2015Percentage of Orange/Tangerine Production by Province in 2015
GRAFIKGRAPH
3
http
://www.b
ps.g
o.id
Statistik Tanaman Buah-Buahan dan Sayuran Tahunan Indonesia 2015 15
Produksi durian tahun 2015 sebesar 995,74 ribu ton, 80,84 persen dari produksi tersebut terdapat di dua belas provinsi. Tiga provinsi dengan produksi terbesar, yaitu Provinsi Jawa Timur dengan produksi 233.715 ton (23,48 persen), Jawa Barat sebesar 107.110 ton (10,76 persen), dan Jawa Tengah sebesar 102.452 ton (10,29 persen) (Grafik 5).
Durian production in 2015 was 995.74 thousand tons and about 80.84 percent of the production was produced from twelve provinces. The third largest producer provinces were Jawa Timur which produced 233,715 tons (23.48 percent), Jawa Barat which produced 107,110 tons (10.76 percent), and Jawa Tengah which produced 102,452 tons (10.29 percent) (Graph 5).
Persentase Produksi Nenas Menurut Provinsi Tahun 2015Percentage of Pineapple Production by Province in 2015
GRAFIKGRAPH
4
Persentase Produksi Durian Menurut Provinsi Tahun 2015Percentage of Durian Production by Province in 2015
GRAFIKGRAPH
5
http
://www.b
ps.g
o.id
Statistics of Annual Fruit and Vegetable Plants Indonesia 201516
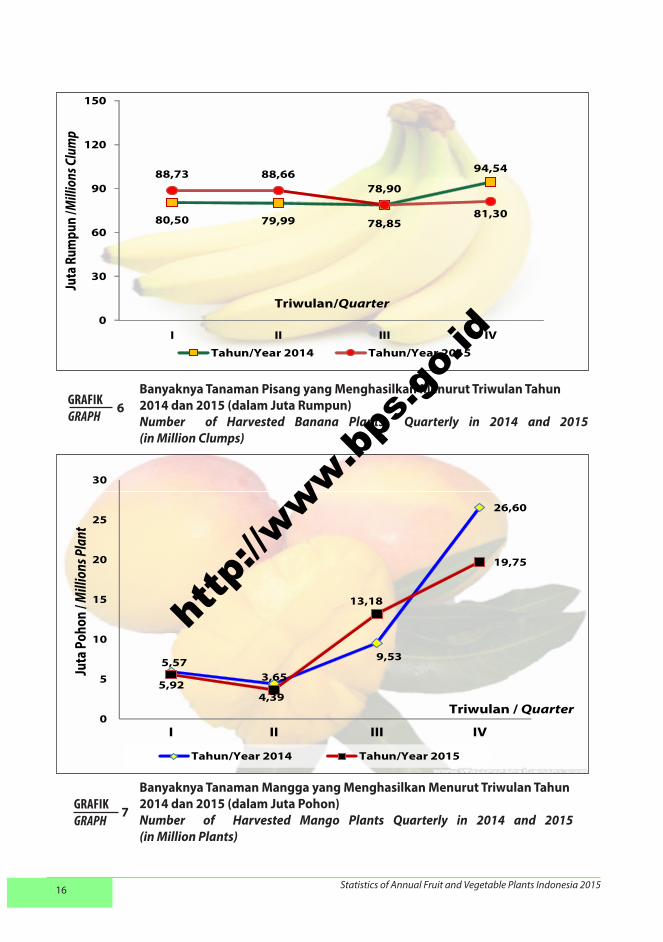
Banyaknya Tanaman Pisang yang Menghasilkan Menurut Triwulan Tahun 2014 dan 2015 (dalam Juta Rumpun)Number of Harvested Banana Plants Quarterly in 2014 and 2015 (in Million Clumps)
GRAFIKGRAPH
6
80,50 79,99
78,90
94,5488,73 88,66
78,8581,30
0
30
60
90
120
150
I II III IV
Juta
Rum
pun
/Mill
ions
Clu
mp
Triwulan/Quarter
Tahun/Year 2014 Tahun/Year 2015
5,924,39
9,53
26,60
5,573,65
13,18
19,75
0
5
10
15
20
25
30
I II III IV
Juta
Poh
on / M
illio
ns Pl
ant
Triwulan / Quarter
Tahun/Year 2014 Tahun/Year 2015
Banyaknya Tanaman Mangga yang Menghasilkan Menurut Triwulan Tahun 2014 dan 2015 (dalam Juta Pohon)Number of Harvested Mango Plants Quarterly in 2014 and 2015 (in Million Plants)
GRAFIKGRAPH
7
http
://www.b
ps.g
o.id
Statistik Tanaman Buah-Buahan dan Sayuran Tahunan Indonesia 2015 17
The growth of harvested banana quarterly in 2014 and 2015 was showed in Graph 6. Based on Graph 6, it can be seen that harvested banana in 2015 was higher than 2014 in first and second quarter. Otherwise, in third and fourth quarter, harvested banana was lower than 2014.
Graph 7 shows the mango plants pattern in 2015 was same as 2014. From the graph, it can be seen that mango plants begin to produce in third quarter and reach that peak in fourth quarter. In first quarter, number of harvested mango plants decreasead and continued until second quarter.
Perkembangan banyaknya tanaman pisang yang menghasilkan menurut triwulan tahun 2014 dan 2015 dapat dilihat pada Grafik 6. Berdasarkan grafik 6, dapat dilihat bahwa pada triwulan I dan II, jumlah tanaman pisang yang menghasilkan tahun 2015 lebih tinggi jika dibandingkan tahun 2014. Sebaliknya, pada triwulan III dan IV, jumlah tanaman yang menghasilkan pada tahun 2015 lebih rendah dibandingkan dengan tahun 2014.
Grafik 7 menunjukkan pola banyaknya tanaman mangga yang menghasilkan pada tahun 2015 sama dengan tahun 2014. Dari grafik, dapat dilihat bahwa tanaman mangga baru mulai menghasilkan pada triwulan III dan mencapai puncaknya pada triwulan IV. Pada triwulan I, jumlah tanaman menghasilkan mulai mengalami penurunan yang berlanjut sampai triwulan II.
GRAFIKGRAPH
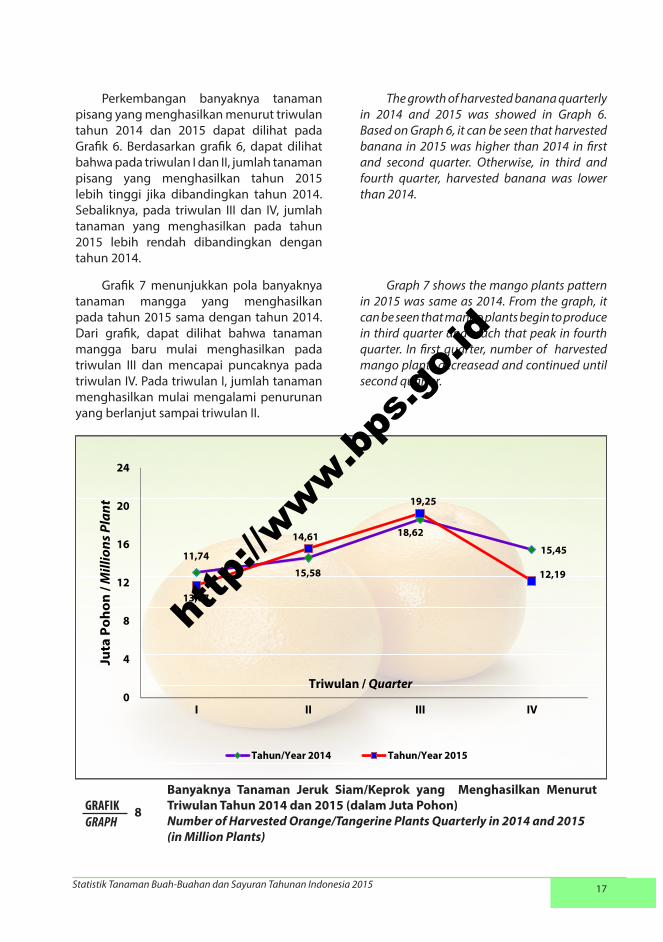
8
Banyaknya Tanaman Jeruk Siam/Keprok yang Menghasilkan Menurut Triwulan Tahun 2014 dan 2015 (dalam Juta Pohon)Number of Harvested Orange/Tangerine Plants Quarterly in 2014 and 2015 (in Million Plants)
13,07
14,61 18,62
15,4511,74
15,58
19,25
12,19
0
4
8
12
16
20
24
I II III IV
Juta
Poh
on /
Mill
ions
Pla
nt
Triwulan / Quarter
Tahun/Year 2014 Tahun/Year 2015
http
://www.b
ps.g
o.id
Statistics of Annual Fruit and Vegetable Plants Indonesia 201518
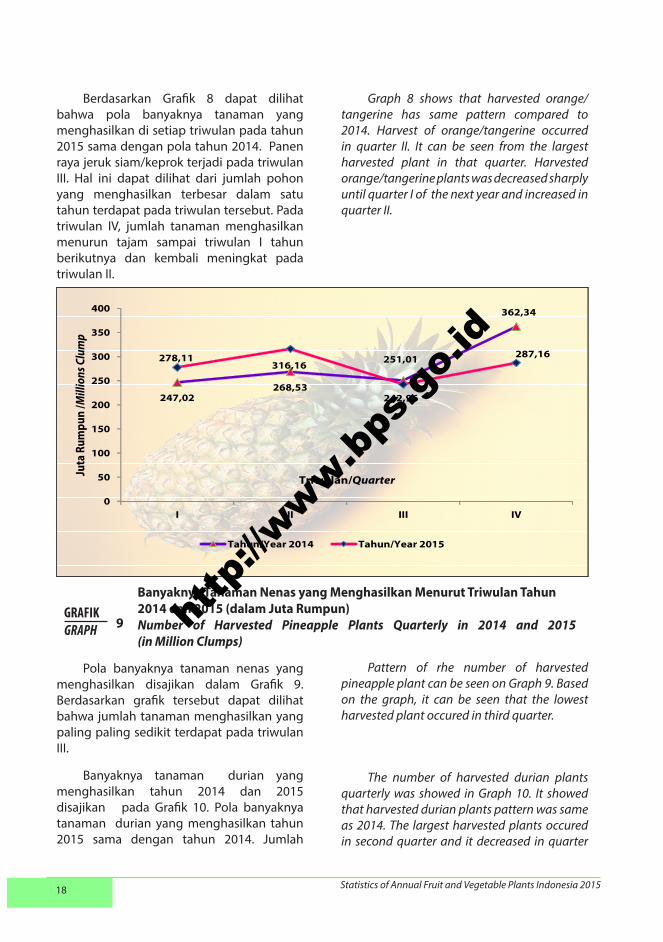
Banyaknya Tanaman Nenas yang Menghasilkan Menurut Triwulan Tahun 2014 dan 2015 (dalam Juta Rumpun)Number of Harvested Pineapple Plants Quarterly in 2014 and 2015 (in Million Clumps)
GRAFIKGRAPH 9
Berdasarkan Grafik 8 dapat dilihat bahwa pola banyaknya tanaman yang menghasilkan di setiap triwulan pada tahun 2015 sama dengan pola tahun 2014. Panen raya jeruk siam/keprok terjadi pada triwulan III. Hal ini dapat dilihat dari jumlah pohon yang menghasilkan terbesar dalam satu tahun terdapat pada triwulan tersebut. Pada triwulan IV, jumlah tanaman menghasilkan menurun tajam sampai triwulan I tahun berikutnya dan kembali meningkat pada triwulan II.
Pola banyaknya tanaman nenas yang menghasilkan disajikan dalam Grafik 9. Berdasarkan grafik tersebut dapat dilihat bahwa jumlah tanaman menghasilkan yang paling paling sedikit terdapat pada triwulan III.
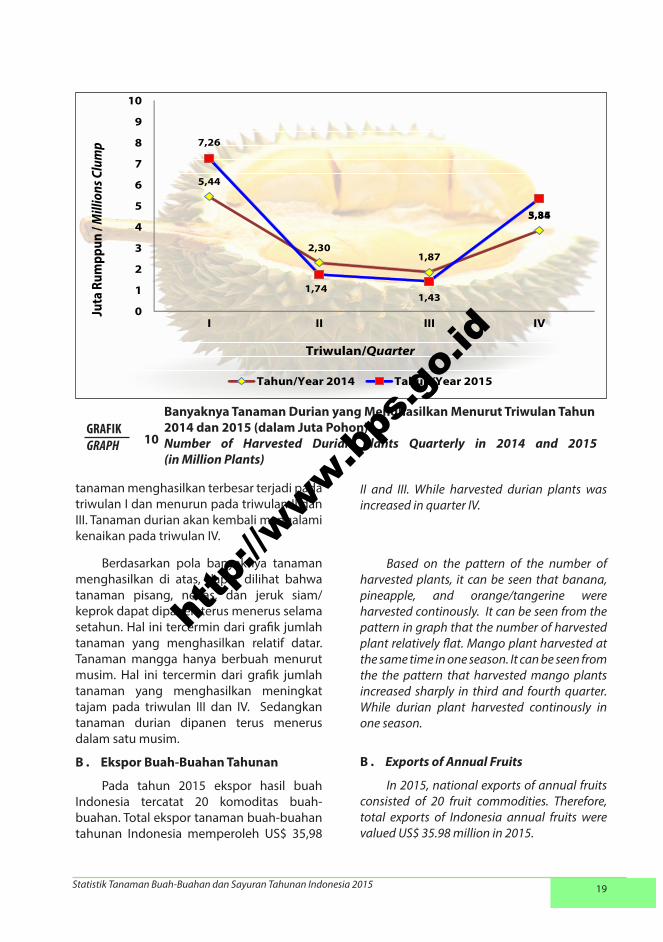
Banyaknya tanaman durian yang menghasilkan tahun 2014 dan 2015 disajikan pada Grafik 10. Pola banyaknya tanaman durian yang menghasilkan tahun 2015 sama dengan tahun 2014. Jumlah
Graph 8 shows that harvested orange/tangerine has same pattern compared to 2014. Harvest of orange/tangerine occurred in quarter II. It can be seen from the largest harvested plant in that quarter. Harvested orange/tangerine plants was decreased sharply until quarter I of the next year and increased in quarter II.
Pattern of rhe number of harvested pineapple plant can be seen on Graph 9. Based on the graph, it can be seen that the lowest harvested plant occured in third quarter.
The number of harvested durian plants quarterly was showed in Graph 10. It showed that harvested durian plants pattern was same as 2014. The largest harvested plants occured in second quarter and it decreased in quarter
247,02268,53
251,01
362,34
278,11316,16
242,96
287,16
0
50
100
150
200
250
300
350
400
I II III IV
Juta
Rum
pun
/Mill
ions
Clu
mp
Triwulan/Quarter
Tahun/Year 2014 Tahun/Year 2015
http
://www.b
ps.g
o.id
Statistik Tanaman Buah-Buahan dan Sayuran Tahunan Indonesia 2015 19
tanaman menghasilkan terbesar terjadi pada triwulan I dan menurun pada triwulan II dan III. Tanaman durian akan kembali mengalami kenaikan pada triwulan IV.
Berdasarkan pola banyaknya tanaman menghasilkan di atas, dapat dilihat bahwa tanaman pisang, nenas, dan jeruk siam/keprok dapat dipanen terus menerus selama setahun. Hal ini tercermin dari grafik jumlah tanaman yang menghasilkan relatif datar. Tanaman mangga hanya berbuah menurut musim. Hal ini tercermin dari grafik jumlah tanaman yang menghasilkan meningkat tajam pada triwulan III dan IV. Sedangkan tanaman durian dipanen terus menerus dalam satu musim.
Ekspor Buah-Buahan TahunanB .
Pada tahun 2015 ekspor hasil buah Indonesia tercatat 20 komoditas buah-buahan. Total ekspor tanaman buah-buahan tahunan Indonesia memperoleh US$ 35,98
II and III. While harvested durian plants was increased in quarter IV.
Based on the pattern of the number of harvested plants, it can be seen that banana, pineapple, and orange/tangerine were harvested continously. It can be seen from the pattern in graph that the number of harvested plant relatively flat. Mango plant harvested at the same time in one season. It can be seen from the the pattern that harvested mango plants increased sharply in third and fourth quarter. While durian plant harvested continously in one season.
Exports of Annual FruitsB .
In 2015, national exports of annual fruits consisted of 20 fruit commodities. Therefore, total exports of Indonesia annual fruits were valued US$ 35.98 million in 2015.
Banyaknya Tanaman Durian yang Menghasilkan Menurut Triwulan Tahun 2014 dan 2015 (dalam Juta Pohon)Number of Harvested Durian Plants Quarterly in 2014 and 2015 (in Million Plants)
GRAFIKGRAPH 10
5,44
2,301,87
3,84
7,26
1,741,43
5,35
0
1
2
3
4
5
6
7
8
9
10
I II III IV
Juta
Rum
ppun
/M
illio
ns C
lum
p
Triwulan/Quarter
Tahun/Year 2014 Tahun/Year 2015
http
://www.b
ps.g
o.id
Statistics of Annual Fruit and Vegetable Plants Indonesia 201520
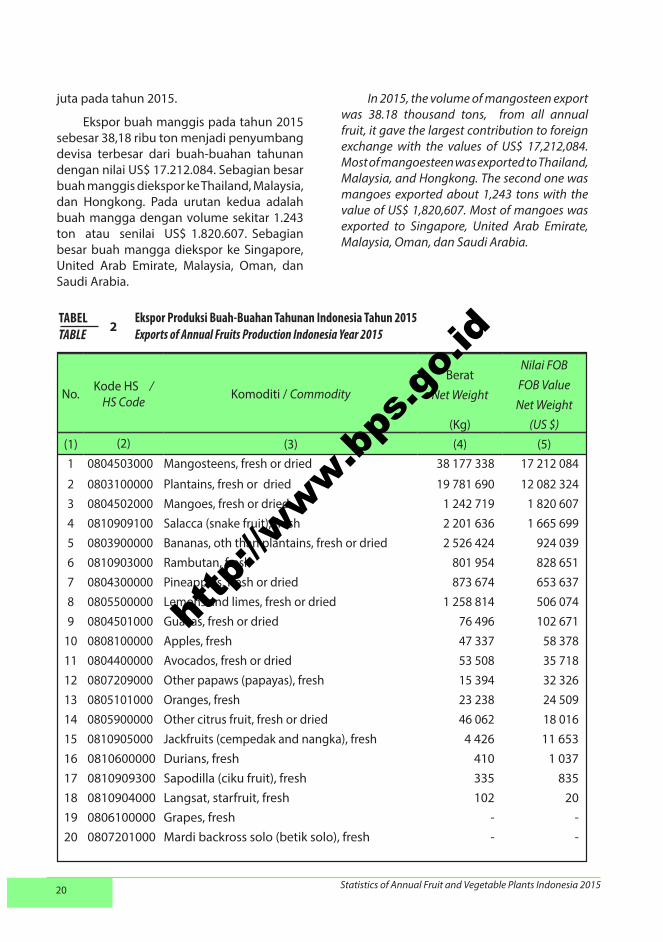
juta pada tahun 2015.
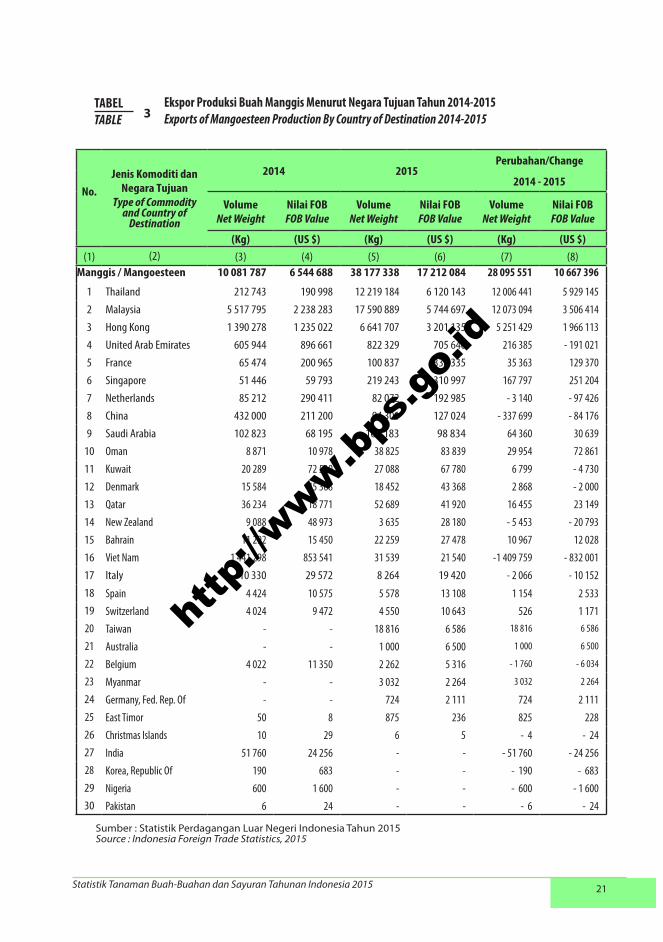
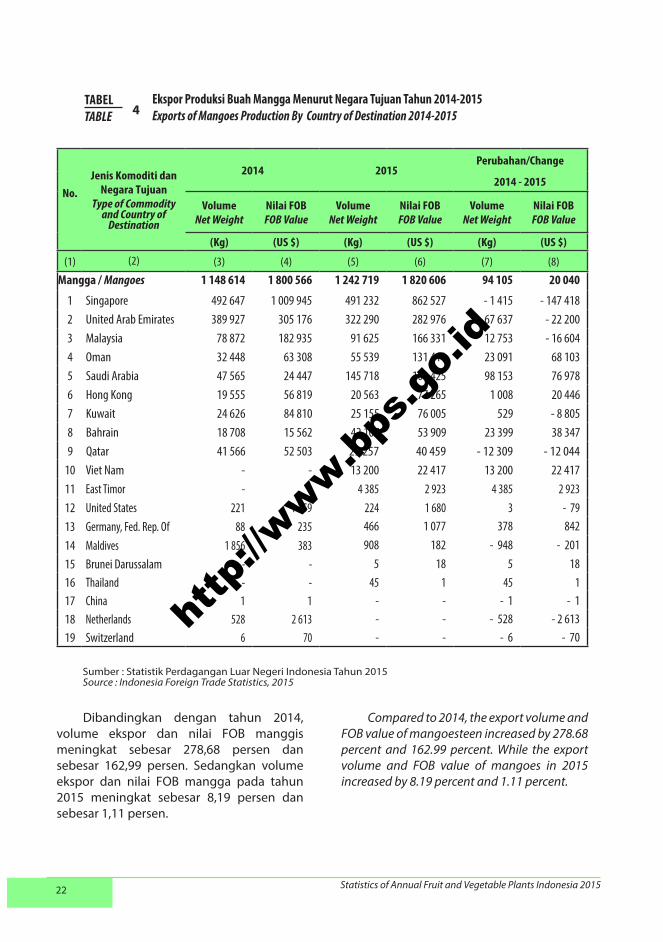
Ekspor buah manggis pada tahun 2015 sebesar 38,18 ribu ton menjadi penyumbang devisa terbesar dari buah-buahan tahunan dengan nilai US$ 17.212.084. Sebagian besar buah manggis diekspor ke Thailand, Malaysia, dan Hongkong. Pada urutan kedua adalah buah mangga dengan volume sekitar 1.243 ton atau senilai US$ 1.820.607. Sebagian besar buah mangga diekspor ke Singapore, United Arab Emirate, Malaysia, Oman, dan Saudi Arabia.
In 2015, the volume of mangosteen export was 38.18 thousand tons, from all annual fruit, it gave the largest contribution to foreign exchange with the values of US$ 17,212,084. Most of mangoesteen was exported to Thailand, Malaysia, and Hongkong. The second one was mangoes exported about 1,243 tons with the value of US$ 1,820,607. Most of mangoes was exported to Singapore, United Arab Emirate, Malaysia, Oman, dan Saudi Arabia.
No. Kode HS / HS Code Komoditi / Commodity
BeratNet Weight
Nilai FOBFOB Value
Net Weight(Kg) (US $)
(1) (2) (3) (4) (5)1 0804503000 Mangosteens, fresh or dried 38 177 338 17 212 084
2 0803100000 Plantains, fresh or dried 19 781 690 12 082 3243 0804502000 Mangoes, fresh or dried 1 242 719 1 820 6074 0810909100 Salacca (snake fruit), fresh 2 201 636 1 665 6995 0803900000 Bananas, oth than plantains, fresh or dried 2 526 424 924 0396 0810903000 Rambutan, fresh 801 954 828 6517 0804300000 Pineapples, fresh or dried 873 674 653 6378 0805500000 Lemons and limes, fresh or dried 1 258 814 506 0749 0804501000 Guavas, fresh or dried 76 496 102 671
10 0808100000 Apples, fresh 47 337 58 37811 0804400000 Avocados, fresh or dried 53 508 35 71812 0807209000 Other papaws (papayas), fresh 15 394 32 32613 0805101000 Oranges, fresh 23 238 24 50914 0805900000 Other citrus fruit, fresh or dried 46 062 18 01615 0810905000 Jackfruits (cempedak and nangka), fresh 4 426 11 65316 0810600000 Durians, fresh 410 1 03717 0810909300 Sapodilla (ciku fruit), fresh 335 83518 0810904000 Langsat, starfruit, fresh 102 2019 0806100000 Grapes, fresh - - 20 0807201000 Mardi backross solo (betik solo), fresh - -
Ekspor Produksi Buah-Buahan Tahunan Indonesia Tahun 2015Exports of Annual Fruits Production Indonesia Year 2015
TABELTABLE 2
http
://www.b
ps.g
o.id
Statistik Tanaman Buah-Buahan dan Sayuran Tahunan Indonesia 2015 21
Ekspor Produksi Buah Manggis Menurut Negara Tujuan Tahun 2014-2015 Exports of Mangoesteen Production By Country of Destination 2014-2015
TABELTABLE 3
No.Jenis Komoditi dan
Negara TujuanType of Commodity
and Country of Destination
2014 2015Perubahan/Change
2014 - 2015
VolumeNet Weight
Nilai FOBFOB Value
VolumeNet Weight
Nilai FOBFOB Value
VolumeNet Weight
Nilai FOBFOB Value
(Kg) (US $) (Kg) (US $) (Kg) (US $)(1) (2) (3) (4) (5) (6) (7) (8)
Manggis / Mangoesteen 10 081 787 6 544 688 38 177 338 17 212 084 28 095 551 10 667 396
1 Thailand 212 743 190 998 12 219 184 6 120 143 12 006 441 5 929 1452 Malaysia 5 517 795 2 238 283 17 590 889 5 744 697 12 073 094 3 506 4143 Hong Kong 1 390 278 1 235 022 6 641 707 3 201 135 5 251 429 1 966 1134 United Arab Emirates 605 944 896 661 822 329 705 640 216 385 - 191 0215 France 65 474 200 965 100 837 330 335 35 363 129 3706 Singapore 51 446 59 793 219 243 310 997 167 797 251 2047 Netherlands 85 212 290 411 82 072 192 985 - 3 140 - 97 4268 China 432 000 211 200 94 301 127 024 - 337 699 - 84 1769 Saudi Arabia 102 823 68 195 167 183 98 834 64 360 30 639
10 Oman 8 871 10 978 38 825 83 839 29 954 72 86111 Kuwait 20 289 72 510 27 088 67 780 6 799 - 4 73012 Denmark 15 584 45 368 18 452 43 368 2 868 - 2 00013 Qatar 36 234 18 771 52 689 41 920 16 455 23 14914 New Zealand 9 088 48 973 3 635 28 180 - 5 453 - 20 79315 Bahrain 11 292 15 450 22 259 27 478 10 967 12 02816 Viet Nam 1 441 298 853 541 31 539 21 540 -1 409 759 - 832 00117 Italy 10 330 29 572 8 264 19 420 - 2 066 - 10 15218 Spain 4 424 10 575 5 578 13 108 1 154 2 53319 Switzerland 4 024 9 472 4 550 10 643 526 1 17120 Taiwan - - 18 816 6 586 18 816 6 586
21 Australia - - 1 000 6 500 1 000 6 500
22 Belgium 4 022 11 350 2 262 5 316 - 1 760 - 6 034
23 Myanmar - - 3 032 2 264 3 032 2 264
24 Germany, Fed. Rep. Of - - 724 2 111 724 2 11125 East Timor 50 8 875 236 825 22826 Christmas Islands 10 29 6 5 - 4 - 2427 India 51 760 24 256 - - - 51 760 - 24 25628 Korea, Republic Of 190 683 - - - 190 - 68329 Nigeria 600 1 600 - - - 600 - 1 60030 Pakistan 6 24 - - - 6 - 24
Sumber : Statistik Perdagangan Luar Negeri Indonesia Tahun 2015Source : Indonesia Foreign Trade Statistics, 2015
http
://www.b
ps.g
o.id
Statistics of Annual Fruit and Vegetable Plants Indonesia 201522
Ekspor Produksi Buah Mangga Menurut Negara Tujuan Tahun 2014-2015Exports of Mangoes Production By Country of Destination 2014-2015
TABELTABLE 4
No.Jenis Komoditi dan
Negara TujuanType of Commodity
and Country of Destination
2014 2015Perubahan/Change
2014 - 2015
VolumeNet Weight
Nilai FOBFOB Value
VolumeNet Weight
Nilai FOBFOB Value
VolumeNet Weight
Nilai FOBFOB Value
(Kg) (US $) (Kg) (US $) (Kg) (US $)
(1) (2) (3) (4) (5) (6) (7) (8)
Mangga / Mangoes 1 148 614 1 800 566 1 242 719 1 820 606 94 105 20 040
1 Singapore 492 647 1 009 945 491 232 862 527 - 1 415 - 147 4182 United Arab Emirates 389 927 305 176 322 290 282 976 - 67 637 - 22 2003 Malaysia 78 872 182 935 91 625 166 331 12 753 - 16 6044 Oman 32 448 63 308 55 539 131 411 23 091 68 1035 Saudi Arabia 47 565 24 447 145 718 101 425 98 153 76 9786 Hong Kong 19 555 56 819 20 563 77 265 1 008 20 4467 Kuwait 24 626 84 810 25 155 76 005 529 - 8 8058 Bahrain 18 708 15 562 42 107 53 909 23 399 38 3479 Qatar 41 566 52 503 29 257 40 459 - 12 309 - 12 044
10 Viet Nam - - 13 200 22 417 13 200 22 41711 East Timor - - 4 385 2 923 4 385 2 92312 United States 221 1 759 224 1 680 3 - 7913 Germany, Fed. Rep. Of 88 235 466 1 077 378 84214 Maldives 1 856 383 908 182 - 948 - 20115 Brunei Darussalam - - 5 18 5 1816 Thailand - - 45 1 45 117 China 1 1 - - - 1 - 118 Netherlands 528 2 613 - - - 528 - 2 61319 Switzerland 6 70 - - - 6 - 70
Sumber : Statistik Perdagangan Luar Negeri Indonesia Tahun 2015Source : Indonesia Foreign Trade Statistics, 2015
Dibandingkan dengan tahun 2014, volume ekspor dan nilai FOB manggis meningkat sebesar 278,68 persen dan sebesar 162,99 persen. Sedangkan volume ekspor dan nilai FOB mangga pada tahun 2015 meningkat sebesar 8,19 persen dan sebesar 1,11 persen.
Compared to 2014, the export volume and FOB value of mangoesteen increased by 278.68 percent and 162.99 percent. While the export volume and FOB value of mangoes in 2015 increased by 8.19 percent and 1.11 percent.
http
://www.b
ps.g
o.id
Statistik Tanaman Buah-Buahan dan Sayuran Tahunan Indonesia 2015 23
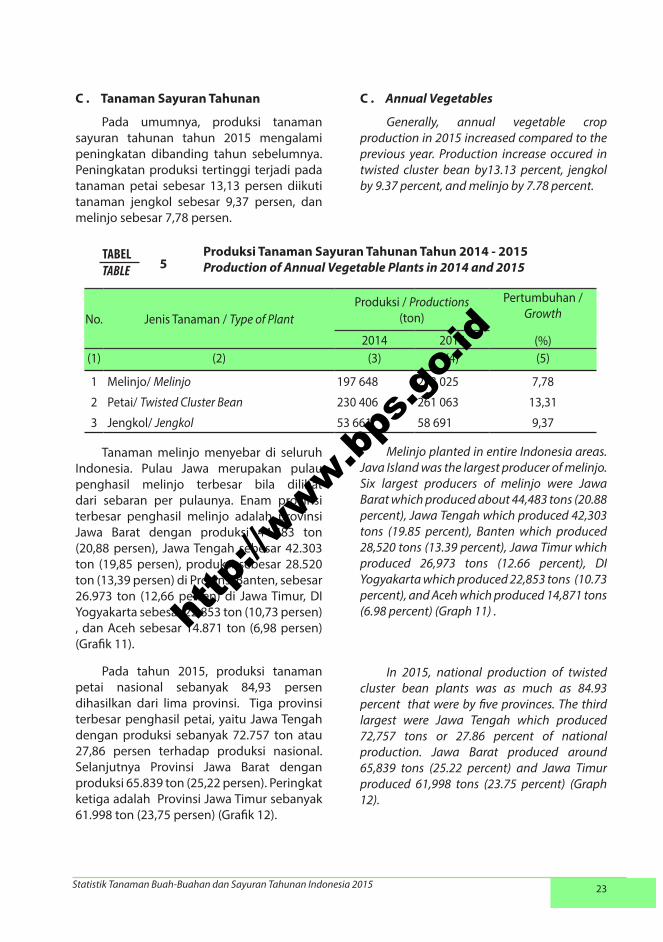
Tanaman Sayuran TahunanC .
Pada umumnya, produksi tanaman sayuran tahunan tahun 2015 mengalami peningkatan dibanding tahun sebelumnya. Peningkatan produksi tertinggi terjadi pada tanaman petai sebesar 13,13 persen diikuti tanaman jengkol sebesar 9,37 persen, dan melinjo sebesar 7,78 persen.
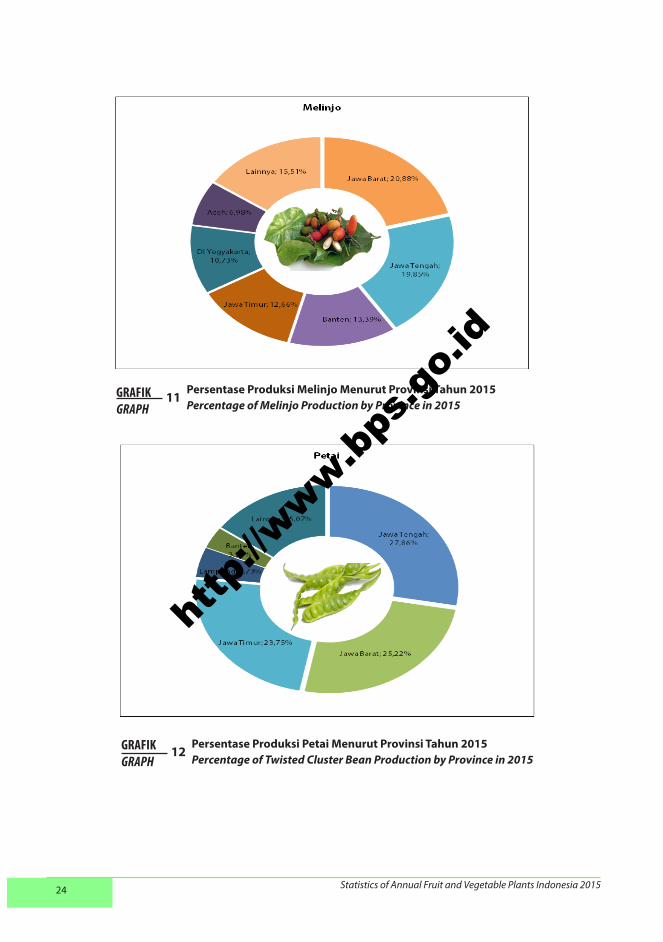
Tanaman melinjo menyebar di seluruh Indonesia. Pulau Jawa merupakan pulau penghasil melinjo terbesar bila dilihat dari sebaran per pulaunya. Enam provinsi terbesar penghasil melinjo adalah provinsi Jawa Barat dengan produksi 44.483 ton (20,88 persen), Jawa Tengah sebesar 42.303 ton (19,85 persen), produksi sebesar 28.520 ton (13,39 persen) di Provinsi Banten, sebesar 26.973 ton (12,66 persen) di Jawa Timur, DI Yogyakarta sebesar 22.853 ton (10,73 persen) , dan Aceh sebesar 14.871 ton (6,98 persen) (Grafik 11).
Pada tahun 2015, produksi tanaman petai nasional sebanyak 84,93 persen dihasilkan dari lima provinsi. Tiga provinsi terbesar penghasil petai, yaitu Jawa Tengah dengan produksi sebanyak 72.757 ton atau 27,86 persen terhadap produksi nasional. Selanjutnya Provinsi Jawa Barat dengan produksi 65.839 ton (25,22 persen). Peringkat ketiga adalah Provinsi Jawa Timur sebanyak 61.998 ton (23,75 persen) (Grafik 12).
Annual VegetablesC .
Generally, annual vegetable crop production in 2015 increased compared to the previous year. Production increase occured in twisted cluster bean by13.13 percent, jengkol by 9.37 percent, and melinjo by 7.78 percent.
Melinjo planted in entire Indonesia areas. Java Island was the largest producer of melinjo. Six largest producers of melinjo were Jawa Barat which produced about 44,483 tons (20.88 percent), Jawa Tengah which produced 42,303 tons (19.85 percent), Banten which produced 28,520 tons (13.39 percent), Jawa Timur which produced 26,973 tons (12.66 percent), DI Yogyakarta which produced 22,853 tons (10.73 percent), and Aceh which produced 14,871 tons (6.98 percent) (Graph 11) .
In 2015, national production of twisted cluster bean plants was as much as 84.93 percent that were by five provinces. The third largest were Jawa Tengah which produced 72,757 tons or 27.86 percent of national production. Jawa Barat produced around 65,839 tons (25.22 percent) and Jawa Timur produced 61,998 tons (23.75 percent) (Graph 12).
Produksi Tanaman Sayuran Tahunan Tahun 2014 - 2015Production of Annual Vegetable Plants in 2014 and 2015
TABELTABLE 5
No. Jenis Tanaman / Type of PlantProduksi / Productions
(ton)
Pertumbuhan / Growth
(%)2014 2015(1) (2) (3) (4) (5)
1 Melinjo/ Melinjo 197 648 213 025 7,78
2 Petai/ Twisted Cluster Bean 230 406 261 063 13,31
3 Jengkol/ Jengkol 53 661 58 691 9,37
http
://www.b
ps.g
o.id
Statistics of Annual Fruit and Vegetable Plants Indonesia 201524
Persentase Produksi Melinjo Menurut Provinsi Tahun 2015Percentage of Melinjo Production by Province in 2015
GRAFIKGRAPH
11
Persentase Produksi Petai Menurut Provinsi Tahun 2015Percentage of Twisted Cluster Bean Production by Province in 2015
GRAFIKGRAPH
12
http
://www.b
ps.g
o.id
Statistik Tanaman Buah-Buahan dan Sayuran Tahunan Indonesia 2015 25
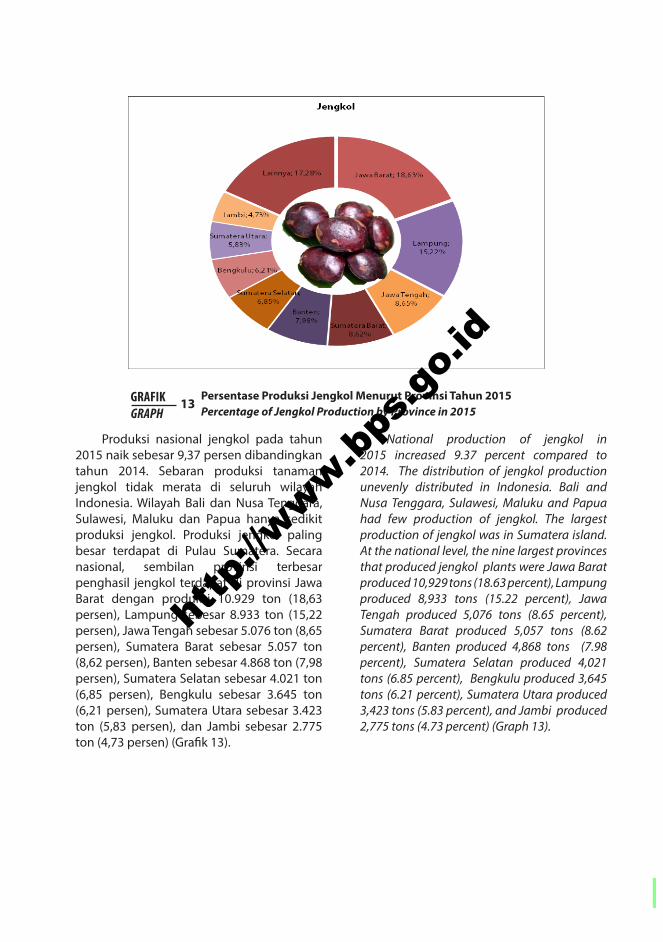
Produksi nasional jengkol pada tahun 2015 naik sebesar 9,37 persen dibandingkan tahun 2014. Sebaran produksi tanaman jengkol tidak merata di seluruh wilayah Indonesia. Wilayah Bali dan Nusa Tenggara, Sulawesi, Maluku dan Papua hanya sedikit produksi jengkol. Produksi jengkol paling besar terdapat di Pulau Sumatera. Secara nasional, sembilan provinsi terbesar penghasil jengkol terdapat di provinsi Jawa Barat dengan produksi 10.929 ton (18,63 persen), Lampung sebesar 8.933 ton (15,22 persen), Jawa Tengah sebesar 5.076 ton (8,65 persen), Sumatera Barat sebesar 5.057 ton (8,62 persen), Banten sebesar 4.868 ton (7,98 persen), Sumatera Selatan sebesar 4.021 ton (6,85 persen), Bengkulu sebesar 3.645 ton (6,21 persen), Sumatera Utara sebesar 3.423 ton (5,83 persen), dan Jambi sebesar 2.775 ton (4,73 persen) (Grafik 13).
National production of jengkol in 2015 increased 9.37 percent compared to 2014. The distribution of jengkol production unevenly distributed in Indonesia. Bali and Nusa Tenggara, Sulawesi, Maluku and Papua had few production of jengkol. The largest production of jengkol was in Sumatera island. At the national level, the nine largest provinces that produced jengkol plants were Jawa Barat produced 10,929 tons (18.63 percent), Lampung produced 8,933 tons (15.22 percent), Jawa Tengah produced 5,076 tons (8.65 percent), Sumatera Barat produced 5,057 tons (8.62 percent), Banten produced 4,868 tons (7.98 percent), Sumatera Selatan produced 4,021 tons (6.85 percent), Bengkulu produced 3,645 tons (6.21 percent), Sumatera Utara produced 3,423 tons (5.83 percent), and Jambi produced 2,775 tons (4.73 percent) (Graph 13).
Persentase Produksi Jengkol Menurut Provinsi Tahun 2015Percentage of Jengkol Production by Province in 2015
GRAFIKGRAPH
13
http
://www.b
ps.g
o.id

http
://www.b
ps.g
o.id

27Statistik Tanaman Buah-Buahan dan Sayuran Tahunan Indonesia 2015
TABEL-TABELTABLES
http
://www.b
ps.g
o.id

28 Statistics of Annual Fruit and Vegetable Plants Indonesia 2015
P r o v i n s iP r o v i n c e
Triwulan I / Quarter I Triwulan II / Quarter II
Tanaman yang Menghasilkan
Harvested Plant(Pohon/Tree)
ProduksiProduction
(ton)
Tanaman yang Menghasilkan
Harvested Plant(Pohon/Tree)
ProduksiProduction
(ton)
(1) (2) (3) (4) (5)
Aceh 23 382 1 068 26 782 1 391
Sumatera Utara 51 227 2 782 55 037 3 051
Sumatera Barat 174 989 14 096 177 825 15 080
Riau 5 457 144 4 872 111
Jambi 13 228 441 37 471 3 238
Sumatera Selatan 146 244 6 541 37 684 1 563
Bengkulu 24 856 1 331 22 479 978
Lampung 68 650 3 108 48 780 2 388
Kep. Bangka Belitung 2 180 123 1 747 79
Kepulauan Riau 899 25 425 22
DKI Jakarta 714 20 2 319 37
Jawa Barat 496 706 23 516 257 855 12 303
Jawa Tengah 291 606 11 609 156 606 5 783
DI Yogyakarta 42 748 2 440 6 932 136
Jawa Timur 699 734 28 277 294 066 12 854
Banten 12 255 364 4 462 115
Bali 23 518 882 8 033 303
Nusa Tenggara Barat 15 659 724 7 957 267
Nusa Tenggara Timur 135 739 4 091 61 098 1 811
Kalimantan Barat 3 140 68 2 526 55
Kalimantan Tengah 1 340 34 1 245 25
Kalimantan Selatan 257 9 300 9
Kalimantan Timur 5 250 215 4 080 96
Kalimatan Utara 111 3 137 4
Sulawesi Utara 13 330 674 12 348 479
Sulawesi Tengah 14 736 741 12 573 570
Sulawesi Selatan 145 950 5 771 69 575 2 684
Sulawesi Tenggara 3 769 165 2 399 105
Gorontalo 186 3 164 9
Sulawesi Barat 2 754 208 1 598 127
Maluku 8 231 450 6 489 296
Maluku Utara 2 399 149 2 218 127
Papua Barat 2 021 55 2 121 31
Papua 1 977 112 1 685 64
I N D O N E S I A 2 435 242 110 239 1 331 888 66 191
TABELTABLE
1.1Produksi dan Banyaknya Tanaman Alpukat yang Menghasilkan Menurut Provinsi 2015Production and Number of Harvested Plant of Avo ca d o by P rov i n ce 2 0 1 5
http
://www.b
ps.g
o.id

29Statistik Tanaman Buah-Buahan dan Sayuran Tahunan Indonesia 2015
Triwulan III / Quarter III Triwulan IV / Quarter IVTotal Produksi
Total Production(ton)
Tanaman yang Menghasilkan
Harvested Plant(Pohon/Tree)
ProduksiProduction
(ton)
Tanaman yang Menghasilkan
Harvested Plant(Pohon/Tree)
ProduksiProduction
(ton)
(6) (7) (8) (9) (10)
26 803 1 184 24 472 940 4 583
53 660 2 807 56 418 3 193 11 833
154 334 12 531 150 535 11 718 53 425
5 395 132 5 898 146 533
75 603 5 915 29 074 841 10 435
37 739 1 308 138 457 11 403 20 815
33 506 1 426 31 605 1 412 5 147
46 447 2 591 53 120 2 693 10 780
881 40 2 288 83 325
776 17 181 8 72
2 414 55 2 453 74 186
348 258 20 357 683 285 49 062 105 238
166 524 5 514 217 579 8 137 31 043
721 18 56 754 3 068 5 662
223 877 8 575 567 494 28 418 78 124
3 006 67 5 969 225 771
1 275 44 22 841 837 2 066
5 922 246 17 025 1 200 2 437
65 977 1 515 101 975 3 066 10 483
2 881 50 2 024 50 223
878 16 1 304 37 112
409 15 253 8 41
3 875 89 4 887 102 502
193 5 116 3 15
9 716 392 11 613 566 2 111
14 963 672 14 583 675 2 658
139 726 6 536 140 051 4 798 19 789
1 222 29 4 101 110 409
114 5 267 7 24
605 41 1 122 83 459
4 503 206 6 992 274 1 226
2 420 129 2 428 144 549
1 431 62 651 36 184
1 141 102 135 4 282
1 437 195 72 691 2 357 950 133 421 382 542
L anjutan Tabel/Continued Table 1.1
http
://www.b
ps.g
o.id

30 Statistics of Annual Fruit and Vegetable Plants Indonesia 2015
P r o v i n s iP r o v i n c e
Triwulan I / Quarter I Triwulan II / Quarter II
Tanaman yang Menghasilkan
Harvested Plant(Pohon/Tree)
ProduksiProduction
(ton)
Tanaman yang Menghasilkan
Harvested Plant(Pohon/Tree)
ProduksiProduction
(ton)
(1) (2) (3) (4) (5)
Aceh - - - -
Sumatera Utara 70 1 70 1
Sumatera Barat - - - -
Riau - - - -
Jambi - - - -
Sumatera Selatan - - - -
Bengkulu - - - -
Lampung - - - -
Kep. Bangka Belitung - - - -
Kepulauan Riau - - - -
DKI Jakarta - - - -
Jawa Barat 70 1 16 0
Jawa Tengah 510 7 731 13
DI Yogyakarta - - - -
Jawa Timur 3 430 61 2 306 34
Banten - - - -
Bali 152 646 2 906 142 131 2 777
Nusa Tenggara Barat 84 1 88 2
Nusa Tenggara Timur 4 0 6 0
Kalimantan Barat - - - -
Kalimantan Tengah 20 1 20 1
Kalimantan Selatan - - - -
Kalimantan Timur - - - -
Kalimatan Utara - - - -
Sulawesi Utara - - - -
Sulawesi Tengah 257 4 263 4
Sulawesi Selatan - - - -
Sulawesi Tenggara - - - -
Gorontalo - - - -
Sulawesi Barat - - - -
Maluku - - - -
Maluku Utara - - - -
Papua Barat - - - -
Papua - - - -
I N D O N E S I A 157 091 2 982 145 631 2 832
TABELTABLE
1.2Produksi dan Banyaknya Tanaman Anggur yang Menghasilkan Menurut Provinsi 2015Production and Number of Harvested Plant of G ra p e by P rov i n ce 2 0 1 5
http
://www.b
ps.g
o.id

31Statistik Tanaman Buah-Buahan dan Sayuran Tahunan Indonesia 2015
Triwulan III / Quarter III Triwulan IV / Quarter IVTotal Produksi
Total Production(ton)
Tanaman yang Menghasilkan
Harvested Plant(Pohon/Tree)
ProduksiProduction
(ton)
Tanaman yang Menghasilkan
Harvested Plant(Pohon/Tree)
ProduksiProduction
(ton)
(6) (7) (8) (9) (10)
- - - - -
70 1 - - 3
- - - - -
- - - - -
- - - - -
- - - - -
- - - - -
- - - - -
- - - - -
- - - - -
- - - - -
33 1 61 1 3
387 6 478 7 33
- - - - -
7 410 90 9 395 123 308
- - - - -
118 597 2 687 138 590 2 670 11 040
55 1 32 1 5
12 0 6 0 0
- - - - -
- - - - 2
- - - - -
- - - - -
- - - - -
- - - - -
241 4 242 4 16
- - - - -
- - - - -
- - - - -
- - - - -
- - - - -
- - - - -
- - - - -
- - - - -
126 805 2 790 148 804 2 806 11 410
L anjutan Tabel/Continued Table 1.2
http
://www.b
ps.g
o.id

32 Statistics of Annual Fruit and Vegetable Plants Indonesia 2015
P r o v i n s iP r o v i n c e
Triwulan I / Quarter I Triwulan II / Quarter II
Tanaman yang Menghasilkan
Harvested Plant(Pohon/Tree)
ProduksiProduction
(ton)
Tanaman yang Menghasilkan
Harvested Plant(Pohon/Tree)
ProduksiProduction
(ton)
(1) (2) (3) (4) (5)
Aceh - - 230 6
Sumatera Utara - - - -
Sumatera Barat 6 0 - -
Riau - - - -
Jambi - - - -
Sumatera Selatan - - - -
Bengkulu - - - -
Lampung - - - -
Kep. Bangka Belitung - - - -
Kepulauan Riau - - - -
DKI Jakarta - - - -
Jawa Barat - - - -
Jawa Tengah 12 0 - -
DI Yogyakarta - - - -
Jawa Timur 1 597 147 25 159 2 238 155 63 937
Banten - - - -
Bali - - - -
Nusa Tenggara Barat 220 3 295 5
Nusa Tenggara Timur 70 1 190 14
Kalimantan Barat - - - -
Kalimantan Tengah - - - -
Kalimantan Selatan - - - -
Kalimantan Timur - - - -
Kalimatan Utara - - - -
Sulawesi Utara - - - -
Sulawesi Tengah - - - -
Sulawesi Selatan - - - -
Sulawesi Tenggara - - - -
Gorontalo - - - -
Sulawesi Barat - - - -
Maluku - - - -
Maluku Utara - - - -
Papua Barat - - - -
Papua - - - -
I N D O N E S I A 1 597 455 25 163 2 238 870 63 962
Produksi dan Banyaknya Tanaman Apel yang Menghasilkan Menurut Provinsi 2015Production and Number of Harvested Plant of A p p l e by P rov i n ce 2 0 1 5
TABELTABLE 1.3
http
://www.b
ps.g
o.id

33Statistik Tanaman Buah-Buahan dan Sayuran Tahunan Indonesia 2015
Triwulan III / Quarter III Triwulan IV / Quarter IVTotal Produksi
Total Production(ton)
Tanaman yang Menghasilkan
Harvested Plant(Pohon/Tree)
ProduksiProduction
(ton)
Tanaman yang Menghasilkan
Harvested Plant(Pohon/Tree)
ProduksiProduction
(ton)
(6) (7) (8) (9) (10)
235 19 - - 25
- - - - -
15 1 6 0 1
- - - - -
- - - - -
- - - - -
- - - - -
- - - - -
- - - - -
- - - - -
- - - - -
- - - - -
- - - - -
- - - - -
2 292 341 67 181 2 351 662 81 864 238 141
- - 30 1 1
- - - - -
400 5 2 000 200 213
340 5 190 3 23
- - - - -
- - - - -
- - - - -
- - - - -
- - - - -
- - - - -
- - - - -
- - 2 500 30 30
- - - - -
- - - - -
- - - - -
- - - - -
- - - - -
- - - - -
- - - - -
2 293 331 67 211 2 356 388 82 098 238 434
L anjutan Tabel/Co n t i n u e d Ta b l e 1.3
http
://www.b
ps.g
o.id
34 Statistics of Annual Fruit and Vegetable Plants Indonesia 2015
P r o v i n s iP r o v i n c e
Triwulan I / Quarter I Triwulan II / Quarter II
Tanaman yang Menghasilkan
Harvested Plant(Pohon/Tree)
ProduksiProduction
(ton)
Tanaman yang Menghasilkan
Harvested Plant(Pohon/Tree)
ProduksiProduction
(ton)
(1) (2) (3) (4) (5)
Aceh 7 975 162 8 230 137
Sumatera Utara 19 425 856 17 219 765
Sumatera Barat 4 505 148 4 005 135
Riau 15 068 264 14 224 270
Jambi 4 624 158 3 940 147
Sumatera Selatan 12 507 331 13 782 568
Bengkulu 3 763 106 2 928 60
Lampung 19 580 553 12 592 536
Kep. Bangka Belitung 1 467 50 991 29
Kepulauan Riau 1 438 36 1 015 35
DKI Jakarta 27 405 706 24 600 545
Jawa Barat 74 558 2 147 55 279 2 012
Jawa Tengah 116 921 3 022 117 341 3 068
DI Yogyakarta 13 784 473 6 461 116
Jawa Timur 357 368 11 248 326 279 11 905
Banten 14 590 405 10 042 353
Bali 4 286 83 3 429 66
Nusa Tenggara Barat 4 755 164 3 376 133
Nusa Tenggara Timur 8 843 187 7 375 134
Kalimantan Barat 11 904 256 9 822 224
Kalimantan Tengah 9 790 253 8 926 194
Kalimantan Selatan 24 099 395 12 645 231
Kalimantan Timur 11 605 276 8 932 270
Kalimatan Utara 262 6 332 8
Sulawesi Utara 1 517 46 1 505 36
Sulawesi Tengah 1 463 61 1 554 64
Sulawesi Selatan 1 529 43 1 719 60
Sulawesi Tenggara 4 865 119 5 187 146
Gorontalo 234 6 35 2
Sulawesi Barat 928 54 617 24
Maluku 3 826 82 2 798 62
Maluku Utara 2 501 108 2 467 99
Papua Barat 934 16 1 327 19
Papua 1 002 38 2 157 72
I N D O N E S I A 789 321 22 858 693 131 22 525
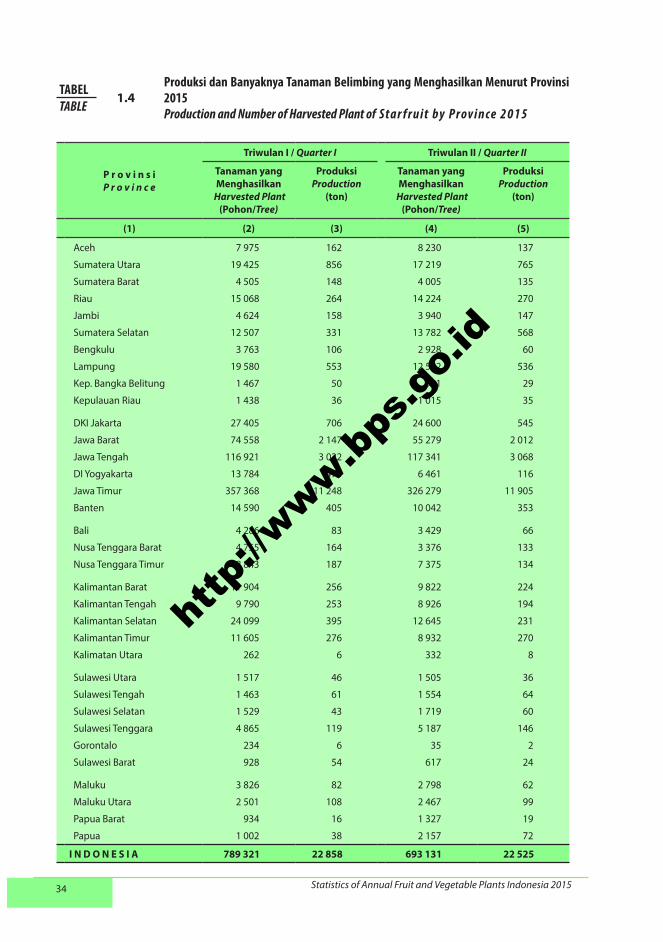
Produksi dan Banyaknya Tanaman Belimbing yang Menghasilkan Menurut Provinsi 2015Production and Number of Harvested Plant of S t a r f r u i t by P rov i n ce 2 0 1 5
TABELTABLE
1.4
http
://www.b
ps.g
o.id

35Statistik Tanaman Buah-Buahan dan Sayuran Tahunan Indonesia 2015
Triwulan III / Quarter III Triwulan IV / Quarter IVTotal Produksi
Total Production(ton)
Tanaman yang Menghasilkan
Harvested Plant(Pohon/Tree)
ProduksiProduction
(ton)
Tanaman yang Menghasilkan
Harvested Plant(Pohon/Tree)
ProduksiProduction
(ton)
(6) (7) (8) (9) (10)
6 519 170 4 329 95 564
20 655 997 28 782 1 410 4 028
3 866 123 4 213 145 551
14 460 249 15 593 261 1 044
2 068 58 3 297 91 454
9 199 207 15 612 478 1 584
4 301 85 2 923 91 342
13 488 403 15 091 566 2 058
1 237 23 811 16 118
1 146 16 1 517 32 119
31 034 839 27 051 846 2 936
66 438 2 096 58 765 1 632 7 887
105 781 2 565 144 113 4 466 13 121
15 440 270 6 590 202 1 061
369 637 12 036 331 981 18 812 54 001
6 927 207 10 655 252 1 217
4 133 85 5 294 105 339
3 330 111 3 917 123 531
7 092 250 7 202 217 788
8 567 205 10 501 221 906
7 038 237 7 591 182 866
19 517 347 10 679 254 1 227
10 854 268 9 573 250 1 064
319 7 338 7 28
1 154 26 1 684 41 149
1 625 75 1 686 72 272
1 690 53 1 857 64 220
2 931 76 6 045 122 463
232 5 44 2 15
529 30 481 26 134
2 986 66 2 943 72 282
2 557 106 2 258 94 407
902 18 175 3 56
589 24 137 2 136
748 241 22 333 743 728 31 252 98 968
L anjutan Tabel/Co n t i n u e d Ta b l e 1.4
http
://www.b
ps.g
o.id
36 Statistics of Annual Fruit and Vegetable Plants Indonesia 2015
P r o v i n s iP r o v i n c e
Triwulan I / Quarter I Triwulan II / Quarter II
Tanaman yang Menghasilkan
Harvested Plant(Pohon/Tree)
ProduksiProduction
(ton)
Tanaman yang Menghasilkan
Harvested Plant(Pohon/Tree)
ProduksiProduction
(ton)
(1) (2) (3) (4) (5)
Aceh 8 472 414 11 652 749
Sumatera Utara 30 197 1 976 25 398 1 721
Sumatera Barat 30 331 1 456 3 583 193
Riau 7 003 160 4 310 72
Jambi 111 937 12 538 13 225 1 325
Sumatera Selatan 593 910 38 981 54 796 6 227
Bengkulu 7 535 290 2 443 144
Lampung 112 487 8 941 27 316 1 261
Kep. Bangka Belitung 13 995 455 4 369 105
Kepulauan Riau 237 6 - -
DKI Jakarta 2 075 63 2 310 69
Jawa Barat 136 562 6 733 23 171 1 316
Jawa Tengah 218 349 13 368 63 222 3 172
DI Yogyakarta 15 888 890 9 557 1 232
Jawa Timur 121 501 6 194 57 215 2 342
Banten 61 452 3 636 4 918 313
Bali 31 464 888 8 365 184
Nusa Tenggara Barat 6 186 253 2 157 76
Nusa Tenggara Timur 81 5 9 0
Kalimantan Barat 12 861 586 6 593 269
Kalimantan Tengah 64 255 1 402 15 968 294
Kalimantan Selatan 236 990 19 621 2 425 246
Kalimantan Timur 60 110 1 978 11 149 406
Kalimatan Utara 3 373 104 6 814 286
Sulawesi Utara 50 677 2 490 23 652 1 235
Sulawesi Tengah 83 978 5 304 56 537 2 451
Sulawesi Selatan 540 896 29 639 113 874 5 138
Sulawesi Tenggara 148 278 5 147 61 764 2 822
Gorontalo 10 555 1 013 2 040 32
Sulawesi Barat 155 636 9 264 19 715 665
Maluku 61 922 4 564 10 411 217
Maluku Utara 12 873 890 11 075 677
Papua Barat 6 965 261 5 323 187
Papua 2 751 182 657 31
I N D O N E S I A 2 961 782 179 692 666 013 35 457
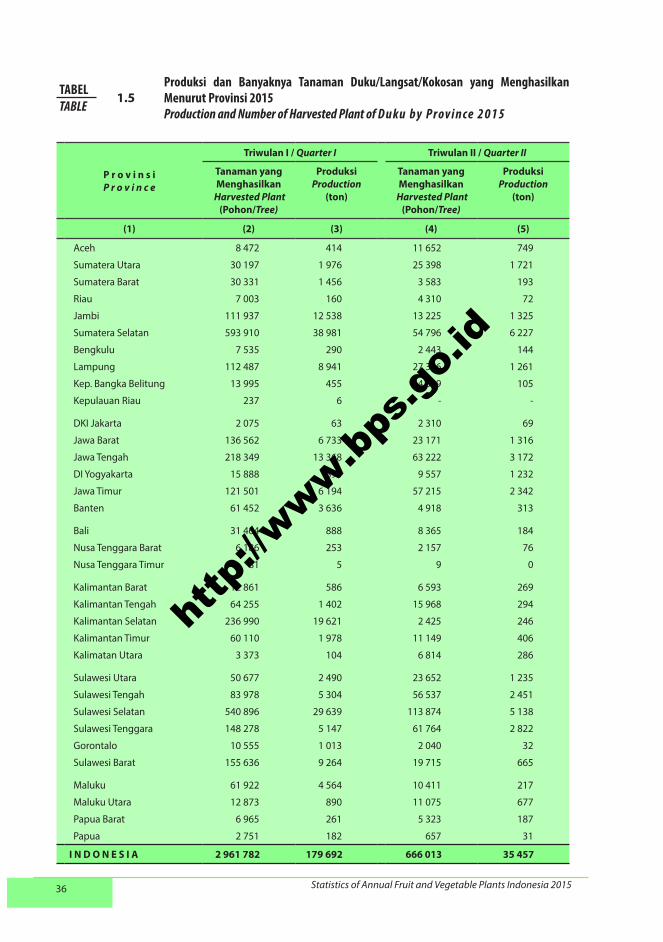
Produksi dan Banyaknya Tanaman Duku/Langsat/Kokosan yang Menghasilkan Menurut Provinsi 2015Production and Number of Harvested Plant of D u ku by P rov i n ce 2 0 1 5
TABELTABLE
1.5
http
://www.b
ps.g
o.id

37Statistik Tanaman Buah-Buahan dan Sayuran Tahunan Indonesia 2015
Triwulan III / Quarter III Triwulan IV / Quarter IVTotal Produksi
Total Production(ton)
Tanaman yang Menghasilkan
Harvested Plant(Pohon/Tree)
ProduksiProduction
(ton)
Tanaman yang Menghasilkan
Harvested Plant(Pohon/Tree)
ProduksiProduction
(ton)
(6) (7) (8) (9) (10)
34 231 1 617 15 822 698 3 478
72 802 5 764 65 502 4 407 13 868
2 883 152 13 425 457 2 258
4 432 214 27 577 922 1 368
460 74 49 696 4 097 18 034
5 135 333 26 734 1 369 46 910
2 846 120 5 580 290 844
11 030 275 32 637 1 678 12 155
- - 459 42 602
730 17 630 11 34
2 360 70 2 400 70 272
10 004 689 21 172 1 274 10 012
8 874 272 32 416 1 220 18 032
131 2 0 0 2 124
21 448 721 43 964 3 451 12 708
1 567 128 21 524 856 4 933
1 137 30 2 024 127 1 229
1 404 58 3 622 166 553
189 4 257 6 15
12 299 264 47 215 2 095 3 214
19 147 295 29 514 823 2 814
10 305 1 099 106 566 5 952 26 918
11 234 399 19 782 439 3 222
34 240 1 297 2 538 87 1 774
11 412 404 21 751 679 4 808
38 009 1 604 26 445 1 517 10 876
33 312 1 678 39 617 2 018 38 473
21 825 2 032 14 166 205 10 206
188 13 892 88 1 146
- - 23 190 2 497 12 426
16 219 245 18 229 303 5 329
8 033 585 9 072 637 2 789
9 476 163 2 697 65 676
60 6 5 0 219
407 422 20 624 727 120 38 546 274 319
L anjutan Tabel/Co n t i n u e d Ta b l e 1.5
http
://www.b
ps.g
o.id
38 Statistics of Annual Fruit and Vegetable Plants Indonesia 2015
TABELTABLE
1.6Produksi dan Banyaknya Tanaman Durian yang Menghasilkan Menurut Provinsi 2015Production and Number of Harvested Plant of D u r i a n by P rov i n ce 2 0 1 5
P r o v i n s iP r o v i n c e
Triwulan I / Quarter I Triwulan II / Quarter II
Tanaman yang Menghasilkan
Harvested Plant(Pohon/Tree)
ProduksiProduction
(ton)
Tanaman yang Menghasilkan
Harvested Plant(Pohon/Tree)
ProduksiProduction
(ton)
(1) (2) (3) (4) (5)
Aceh 44 157 2 760 61 438 3 493
Sumatera Utara 64 549 4 437 131 421 8 346
Sumatera Barat 211 054 12 162 88 961 5 650
Riau 81 083 2 094 115 698 4 463
Jambi 86 485 9 931 26 710 2 491
Sumatera Selatan 508 313 22 015 46 244 1 869
Bengkulu 131 013 7 289 60 504 2 084
Lampung 377 362 35 954 41 033 1 571
Kep. Bangka Belitung 18 964 1 355 320 12
Kepulauan Riau 55 2 55 866 3 013
DKI Jakarta 838 48 83 3
Jawa Barat 882 614 54 423 102 011 5 494
Jawa Tengah 1 132 786 62 695 139 982 11 603
DI Yogyakarta 127 805 5 807 3 949 48
Jawa Timur 1 481 581 119 621 326 907 24 611
Banten 301 965 25 361 39 808 2 140
Bali 165 511 9 132 47 795 3 121
Nusa Tenggara Barat 79 066 7 248 27 113 2 204
Nusa Tenggara Timur 22 038 693 14 439 430
Kalimantan Barat 39 394 1 300 21 015 535
Kalimantan Tengah 87 584 3 258 53 034 1 950
Kalimantan Selatan 170 417 10 293 7 466 191
Kalimantan Timur 116 138 5 023 22 722 1 206
Kalimatan Utara 14 918 611 14 498 704
Sulawesi Utara 41 730 3 062 20 783 721
Sulawesi Tengah 107 667 7 523 43 079 3 001
Sulawesi Selatan 567 989 42 893 143 758 6 286
Sulawesi Tenggara 121 245 5 789 33 069 1 027
Gorontalo 17 467 1 805 2 698 180
Sulawesi Barat 88 298 7 769 18 259 729
Maluku 144 129 6 358 24 465 1 121
Maluku Utara 7 104 606 5 304 482
Papua Barat 9 273 591 3 410 463
Papua 5 264 321 892 24
I N D O N E S I A 7 255 856 480 229 1 744 734 101 266
http
://www.b
ps.g
o.id

39Statistik Tanaman Buah-Buahan dan Sayuran Tahunan Indonesia 2015
Triwulan III / Quarter III Triwulan IV / Quarter IVTotal Produksi
Total Production(ton)
Tanaman yang Menghasilkan
Harvested Plant(Pohon/Tree)
ProduksiProduction
(ton)
Tanaman yang Menghasilkan
Harvested Plant(Pohon/Tree)
ProduksiProduction
(ton)
(6) (7) (8) (9) (10)
96 453 5 599 85 407 5 147 16 999
258 476 23 193 368 782 29 553 65 529
95 394 5 972 443 024 28 719 52 503
81 657 1 593 144 762 4 216 12 366
3 077 237 50 209 3 481 16 140
23 400 842 176 389 7 835 32 561
110 923 2 753 127 337 5 825 17 951
35 010 857 144 348 8 575 46 957
- - 62 984 3 675 5 042
14 090 1 641 23 035 804 5 460
1 742 40 209 9 100
107 731 4 675 624 945 42 518 107 110
36 530 1 202 648 452 26 952 102 452
546 7 60 737 2 494 8 356
172 181 10 404 862 268 79 079 233 715
22 106 1 967 295 914 19 078 48 546
7 839 189 61 230 2 812 15 254
21 511 2 068 49 615 2 686 14 206
5 126 205 21 509 489 1 817
61 241 2 318 208 214 14 888 19 041
33 901 1 181 113 180 6 802 13 191
8 293 216 165 807 4 718 15 418
61 066 1 346 108 135 2 598 10 173
27 059 1 691 10 321 327 3 333
7 748 364 39 754 3 317 7 464
39 409 2 985 76 464 6 453 19 962
29 693 1 940 102 408 7 399 58 518
14 465 1 825 35 613 735 9 376
3 490 440 12 747 654 3 079
20 569 1 354 48 839 3 257 13 109
21 467 1 429 160 862 7 033 15 941
4 741 258 6 659 658 2 004
4 066 341 6 174 186 1 581
140 21 2 449 115 481
1 431 140 81 153 5 348 782 333 087 995 735
L anjutan Tabel/Co n t i n u e d Ta b l e 1.6
http
://www.b
ps.g
o.id

40 Statistics of Annual Fruit and Vegetable Plants Indonesia 2015
P r o v i n s iP r o v i n c e
Triwulan I / Quarter I Triwulan II / Quarter II
Tanaman yang Menghasilkan
Harvested Plant(Pohon/Tree)
ProduksiProduction
(ton)
Tanaman yang Menghasilkan
Harvested Plant(Pohon/Tree)
ProduksiProduction
(ton)
(1) (2) (3) (4) (5)
Aceh 13 769 357 13 958 364
Sumatera Utara 62 432 1 856 74 608 2 045
Sumatera Barat 35 600 660 35 242 629
Riau 48 588 1 373 46 424 582
Jambi 20 354 700 12 754 366
Sumatera Selatan 35 583 767 26 513 568
Bengkulu 11 809 226 10 299 153
Lampung 53 381 1 327 35 630 675
Kep. Bangka Belitung 3 981 99 2 339 30
Kepulauan Riau 2 604 58 1 893 26
DKI Jakarta 21 839 400 18 338 305
Jawa Barat 641 924 14 357 526 042 11 960
Jawa Tengah 578 650 13 559 505 933 13 362
DI Yogyakarta 88 612 1 813 35 087 518
Jawa Timur 348 916 8 563 267 426 6 389
Banten 44 357 1 106 25 851 684
Bali 51 201 712 33 626 431
Nusa Tenggara Barat 171 917 3 890 128 393 2 562
Nusa Tenggara Timur 102 249 1 991 49 705 1 130
Kalimantan Barat 23 628 356 21 393 425
Kalimantan Tengah 26 193 422 23 365 287
Kalimantan Selatan 44 885 756 20 647 361
Kalimantan Timur 27 758 540 21 391 449
Kalimatan Utara 1 607 34 728 12
Sulawesi Utara 6 443 168 3 826 73
Sulawesi Tengah 7 085 189 10 172 199
Sulawesi Selatan 155 296 5 837 74 778 2 011
Sulawesi Tenggara 14 090 281 11 476 250
Gorontalo 712 13 81 2
Sulawesi Barat 1 492 45 2 214 43
Maluku 6 251 198 4 031 90
Maluku Utara 2 490 81 2 556 76
Papua Barat 1 786 23 26 140 217
Papua 1 753 58 3 513 111
I N D O N E S I A 2 659 235 62 815 2 076 372 47 385
Produksi dan Banyaknya Tanaman Jambu Biji yang Menghasilkan Menurut Provinsi 2015Production and Number of Harvested Plant of G ua va by P rov i n ce 2 0 1 5
TABELTABLE
1.7
http
://www.b
ps.g
o.id

41Statistik Tanaman Buah-Buahan dan Sayuran Tahunan Indonesia 2015
Triwulan III / Quarter III Triwulan IV / Quarter IVTotal Produksi
Total Production(ton)
Tanaman yang Menghasilkan
Harvested Plant(Pohon/Tree)
ProduksiProduction
(ton)
Tanaman yang Menghasilkan
Harvested Plant(Pohon/Tree)
ProduksiProduction
(ton)
(6) (7) (8) (9) (10)
18 312 440 15 343 331 1 492
78 340 2 013 98 907 2 893 8 807
31 998 531 38 331 711 2 531
49 529 624 46 954 667 3 246
6 625 125 10 116 229 1 420
21 400 414 40 236 859 2 608
11 950 176 7 779 177 732
32 833 561 37 360 930 3 493
2 228 38 4 739 92 259
2 180 45 3 652 58 187
17 554 235 16 018 213 1 153
401 881 8 453 499 585 12 020 46 790
471 542 10 129 527 264 11 000 48 050
41 289 526 47 724 426 3 283
331 672 6 613 280 249 6 775 28 340
23 980 427 34 819 973 3 190
21 355 256 25 405 295 1 694
87 621 1 840 157 852 3 111 11 403
31 482 812 32 021 821 4 754
20 328 311 25 279 465 1 557
17 946 230 23 620 337 1 276
16 206 287 23 358 491 1 895
22 003 368 23 135 344 1 701
686 17 610 13 76
3 970 69 3 947 76 386
8 809 150 6 940 109 647
59 950 1 344 97 294 2 785 11 977
10 166 219 12 446 229 979
1 183 50 1 034 49 114
1 407 38 1 460 33 159
4 233 100 5 048 106 494
3 001 93 2 657 77 327
25 284 207 176 4 451
2 801 109 176 2 280
1 881 744 37 850 2 151 534 47 701 195 751
L anjutan Tabel/Co n t i n u e d Ta b l e 1.7
http
://www.b
ps.g
o.id
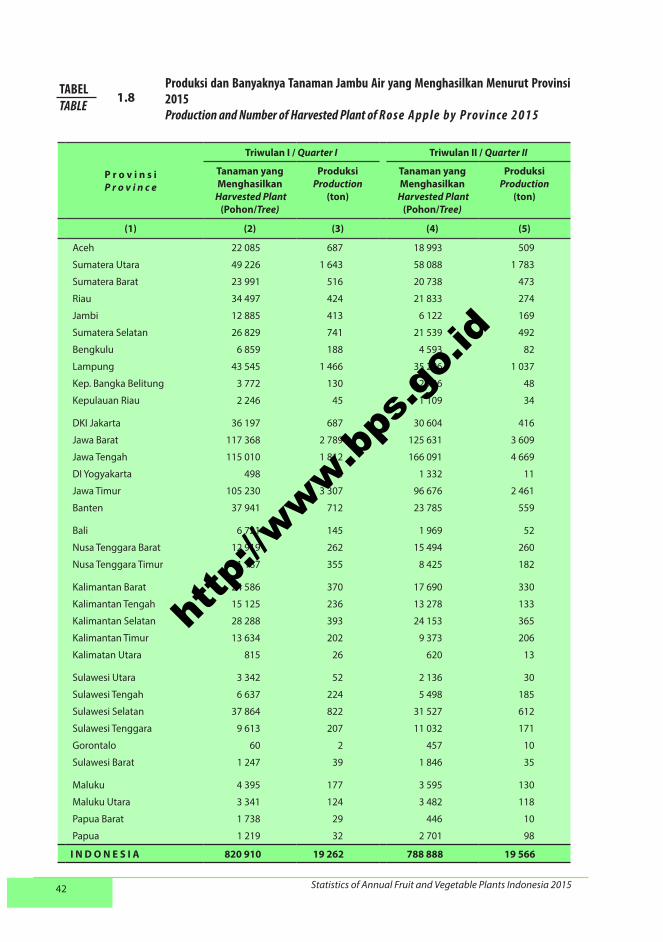
42 Statistics of Annual Fruit and Vegetable Plants Indonesia 2015
P r o v i n s iP r o v i n c e
Triwulan I / Quarter I Triwulan II / Quarter II
Tanaman yang Menghasilkan
Harvested Plant(Pohon/Tree)
ProduksiProduction
(ton)
Tanaman yang Menghasilkan
Harvested Plant(Pohon/Tree)
ProduksiProduction
(ton)
(1) (2) (3) (4) (5)
Aceh 22 085 687 18 993 509
Sumatera Utara 49 226 1 643 58 088 1 783
Sumatera Barat 23 991 516 20 738 473
Riau 34 497 424 21 833 274
Jambi 12 885 413 6 122 169
Sumatera Selatan 26 829 741 21 539 492
Bengkulu 6 859 188 4 593 82
Lampung 43 545 1 466 35 286 1 037
Kep. Bangka Belitung 3 772 130 2 746 48
Kepulauan Riau 2 246 45 1 109 34
DKI Jakarta 36 197 687 30 604 416
Jawa Barat 117 368 2 789 125 631 3 609
Jawa Tengah 115 010 1 812 166 091 4 669
DI Yogyakarta 498 5 1 332 11
Jawa Timur 105 230 3 307 96 676 2 461
Banten 37 941 712 23 785 559
Bali 6 721 145 1 969 52
Nusa Tenggara Barat 12 919 262 15 494 260
Nusa Tenggara Timur 11 187 355 8 425 182
Kalimantan Barat 24 586 370 17 690 330
Kalimantan Tengah 15 125 236 13 278 133
Kalimantan Selatan 28 288 393 24 153 365
Kalimantan Timur 13 634 202 9 373 206
Kalimatan Utara 815 26 620 13
Sulawesi Utara 3 342 52 2 136 30
Sulawesi Tengah 6 637 224 5 498 185
Sulawesi Selatan 37 864 822 31 527 612
Sulawesi Tenggara 9 613 207 11 032 171
Gorontalo 60 2 457 10
Sulawesi Barat 1 247 39 1 846 35
Maluku 4 395 177 3 595 130
Maluku Utara 3 341 124 3 482 118
Papua Barat 1 738 29 446 10
Papua 1 219 32 2 701 98
I N D O N E S I A 820 910 19 262 788 888 19 566
Produksi dan Banyaknya Tanaman Jambu Air yang Menghasilkan Menurut Provinsi 2015Production and Number of Harvested Plant of Ro se A p p l e by P rov i n ce 2 0 1 5
TABELTABLE
1.8
http
://www.b
ps.g
o.id

43Statistik Tanaman Buah-Buahan dan Sayuran Tahunan Indonesia 2015
Triwulan III / Quarter III Triwulan IV / Quarter IVTotal Produksi
Total Production(ton)
Tanaman yang Menghasilkan
Harvested Plant(Pohon/Tree)
ProduksiProduction
(ton)
Tanaman yang Menghasilkan
Harvested Plant(Pohon/Tree)
ProduksiProduction
(ton)
(6) (7) (8) (9) (10)
24 975 588 17 197 369 2 153
55 213 1 584 59 805 1 811 6 821
13 733 373 13 077 358 1 720
21 425 270 27 370 309 1 277
4 730 123 5 728 152 857
20 000 421 24 548 608 2 262
5 213 86 5 573 117 473
43 741 1 415 40 955 1 091 5 009
5 041 82 7 348 106 366
1 322 45 2 210 46 170
31 711 368 26 395 829 2 300
105 682 3 257 174 922 4 711 14 366
179 563 4 859 272 341 8 583 19 923
35 330 1 695 30 391 1 364 3 075
163 383 4 272 164 871 4 070 14 110
23 243 522 26 578 662 2 455
4 566 90 11 405 253 540
45 183 1 512 49 207 1 555 3 589
9 737 283 13 699 420 1 240
25 911 432 30 629 442 1 574
12 257 137 16 637 207 713
9 989 132 11 969 198 1 088
9 601 264 17 479 165 837
707 15 581 14 68
2 137 33 1 911 23 138
5 121 130 5 401 163 702
37 356 379 45 202 507 2 320
8 398 187 12 862 263 828
827 38 825 9 59
959 36 1 645 58 168
4 967 127 6 874 191 625
3 888 126 3 331 112 480
360 17 643 14 70
895 43 - - 173
917 164 23 941 1 129 609 29 780 92 549
L anjutan Tabel/Co n t i n u e d Ta b l e 1.8
http
://www.b
ps.g
o.id

44 Statistics of Annual Fruit and Vegetable Plants Indonesia 2015
P r o v i n s iP r o v i n c e
Triwulan I / Quarter I Triwulan II / Quarter II
Tanaman yang Menghasilkan
Harvested Plant(Pohon/Tree)
ProduksiProduction
(ton)
Tanaman yang Menghasilkan
Harvested Plant(Pohon/Tree)
ProduksiProduction
(ton)
(1) (2) (3) (4) (5)
Aceh 50 206 1 827 73 659 2 815
Sumatera Utara 2 612 670 106 522 2 584 405 124 597
Sumatera Barat 512 563 17 042 460 775 14 373
Riau 128 148 2 961 152 402 2 271
Jambi 99 489 3 433 71 379 2 546
Sumatera Selatan 175 644 4 345 179 275 4 841
Bengkulu 79 647 1 866 76 825 1 660
Lampung 34 800 1 127 55 720 2 184
Kep. Bangka Belitung 11 989 540 36 136 910
Kepulauan Riau 1 623 36 2 875 50
DKI Jakarta - - - -
Jawa Barat 241 548 9 049 641 125 10 828
Jawa Tengah 136 309 2 446 206 315 7 121
DI Yogyakarta 7 510 467 12 119 587
Jawa Timur 2 937 442 58 863 5 284 764 139 087
Banten 8 036 260 4 143 131
Bali 615 386 12 920 1 138 635 27 562
Nusa Tenggara Barat 12 642 396 17 692 736
Nusa Tenggara Timur 167 965 4 277 188 051 4 137
Kalimantan Barat 2 307 646 35 174 2 481 454 39 174
Kalimantan Tengah 114 157 1 577 95 869 1 204
Kalimantan Selatan 580 539 12 663 766 088 21 528
Kalimantan Timur 71 773 2 334 80 050 3 357
Kalimatan Utara 28 384 680 14 173 340
Sulawesi Utara 1 172 29 1 762 34
Sulawesi Tengah 29 520 1 499 21 027 849
Sulawesi Selatan 60 378 1 660 46 850 1 443
Sulawesi Tenggara 281 970 3 331 348 252 7 172
Gorontalo 6 497 183 27 422 620
Sulawesi Barat 308 915 10 924 373 719 14 418
Maluku 72 810 4 035 85 056 3 219
Maluku Utara 35 793 734 40 274 765
Papua Barat 1 108 20 944 16
Papua 5 284 147 6 627 152
I N D O N E S I A 11 739 563 303 367 15 575 862 440 727
Produksi dan Banyaknya Tanaman Jeruk Siam/Keprok yang Menghasilkan Menurut Provinsi 2015Production and Number of Harvested Plant of O ra n g e / Ta n g e r i n e by P rov i n ce 2 0 1 5
TABELTABLE
1.9
http
://www.b
ps.g
o.id

45Statistik Tanaman Buah-Buahan dan Sayuran Tahunan Indonesia 2015
Triwulan III / Quarter III Triwulan IV / Quarter IVTotal Produksi
Total Production(ton)
Tanaman yang Menghasilkan
Harvested Plant(Pohon/Tree)
ProduksiProduction
(ton)
Tanaman yang Menghasilkan
Harvested Plant(Pohon/Tree)
ProduksiProduction
(ton)
(6) (7) (8) (9) (10)
72 542 2 365 43 004 1 158 8 165
2 252 268 122 448 2 563 710 129 439 483 006
383 413 12 305 640 232 20 828 64 548
152 433 2 226 133 322 2 416 9 874
79 776 2 987 154 962 4 438 13 404
129 164 3 252 136 960 3 703 16 141
75 154 3 996 41 316 1 527 9 049
66 594 2 081 56 494 1 421 6 813
57 094 2 404 11 837 222 4 076
2 270 41 1 268 46 173
- - - - -
286 113 7 567 451 770 26 683 54 127
306 720 8 333 161 675 3 527 21 427
38 113 1 304 27 067 696 3 054
6 046 442 172 633 3 734 448 109 813 480 396
3 886 72 4 768 236 699
3 525 833 82 480 395 361 6 174 129 136
14 200 564 49 933 1 994 3 690
160 607 3 980 128 466 3 438 15 832
2 445 447 34 359 1 736 524 38 664 147 371
89 612 1 237 102 033 1 461 5 479
1 509 432 64 384 534 221 13 726 112 301
77 747 3 348 78 840 3 944 12 983
15 652 381 13 384 320 1 721
1 445 38 848 27 128
17 844 545 26 099 1 087 3 980
261 183 6 921 35 747 1 056 11 080
704 192 23 132 487 736 17 596 51 231
741 37 3 314 139 979
373 751 19 370 340 970 13 577 58 289
71 112 2 544 70 385 2 302 12 100
19 117 435 24 829 467 2 401
1 198 92 75 2 130
6 520 246 997 11 556
19 247 615 588 107 12 192 595 412 138 1 744 339
L anjutan Tabel/Co n t i n u e d Ta b l e 1.9
http
://www.b
ps.g
o.id

46 Statistics of Annual Fruit and Vegetable Plants Indonesia 2015
P r o v i n s iP r o v i n c e
Triwulan I / Quarter I Triwulan II / Quarter II
Tanaman yang Menghasilkan
Harvested Plant(Pohon/Tree)
ProduksiProduction
(ton)
Tanaman yang Menghasilkan
Harvested Plant(Pohon/Tree)
ProduksiProduction
(ton)
(1) (2) (3) (4) (5)
Aceh 48 568 3 438 48 205 2 385
Sumatera Utara 4 856 396 7 132 815
Sumatera Barat 1 695 80 1 576 74
Riau 3 519 141 2 984 108
Jambi 1 924 115 1 165 70
Sumatera Selatan 2 796 140 2 287 136
Bengkulu 1 316 104 471 35
Lampung 3 810 305 700 76
Kep. Bangka Belitung 309 11 329 15
Kepulauan Riau 358 8 545 13
DKI Jakarta 168 5 242 7
Jawa Barat 41 213 1 840 38 456 2 337
Jawa Tengah 87 410 5 949 69 433 4 383
DI Yogyakarta 1 417 86 474 14
Jawa Timur 30 973 1 081 171 433 7 760
Banten 2 087 65 1 016 34
Bali 3 567 133 2 944 63
Nusa Tenggara Barat 5 870 576 7 084 778
Nusa Tenggara Timur 37 180 1 111 33 866 986
Kalimantan Barat 6 105 316 6 825 313
Kalimantan Tengah 6 022 195 6 378 166
Kalimantan Selatan 3 399 161 5 377 285
Kalimantan Timur 4 804 231 3 189 163
Kalimatan Utara 411 17 502 21
Sulawesi Utara 1 518 83 548 25
Sulawesi Tengah 2 339 263 2 008 171
Sulawesi Selatan 215 696 27 546 82 913 8 477
Sulawesi Tenggara 8 819 224 12 846 607
Gorontalo 1 381 39 1 055 52
Sulawesi Barat 1 734 50 923 34
Maluku 2 372 203 2 228 156
Maluku Utara 1 497 136 1 481 123
Papua Barat 498 14 553 22
Papua 575 47 1 214 51
I N D O N E S I A 536 206 45 109 518 382 30 755
Produksi dan Banyaknya Tanaman Jeruk Besar yang Menghasilkan Menurut Provinsi 2015Production and Number of Harvested Plant of Po m e l o by P rov i n ce 2 0 1 5
TABELTABLE
1.10
http
://www.b
ps.g
o.id

47Statistik Tanaman Buah-Buahan dan Sayuran Tahunan Indonesia 2015
Triwulan III / Quarter III Triwulan IV / Quarter IVTotal Produksi
Total Production(ton)
Tanaman yang Menghasilkan
Harvested Plant(Pohon/Tree)
ProduksiProduction
(ton)
Tanaman yang Menghasilkan
Harvested Plant(Pohon/Tree)
ProduksiProduction
(ton)
(6) (7) (8) (9) (10)
54 572 2 565 45 879 3 633 12 021
8 181 747 10 295 998 2 956
1 662 78 1 420 67 299
3 124 87 2 109 34 370
448 16 1 729 144 345
1 590 108 1 461 95 479
647 73 829 59 271
2 906 285 1 740 77 743
186 14 468 12 52
206 6 231 6 33
122 2 50 1 15
25 234 983 31 927 2 282 7 442
38 619 3 479 50 244 3 391 17 202
3 308 229 3 713 89 418
9 613 5 199 29 632 1 120 15 160
692 26 431 21 146
3 709 64 2 203 45 305
4 368 423 8 865 683 2 460
27 667 1 063 22 646 656 3 816
6 264 227 12 851 540 1 396
4 921 182 8 084 327 870
3 087 149 2 516 91 686
3 100 105 3 369 94 593
598 22 459 18 78
649 29 729 38 175
2 448 185 1 735 147 766
27 235 1 710 34 520 1 644 39 377
10 812 304 9 963 394 1 529
946 38 453 45 174
839 75 1 237 129 288
1 460 73 2 467 139 571
1 526 111 1 338 110 480
439 25 35 1 62
603 62 303 15 175
251 781 18 744 295 931 17 145 111 753
L anjutan Tabel/Co n t i n u e d Ta b l e 1.10
http
://www.b
ps.g
o.id

48 Statistics of Annual Fruit and Vegetable Plants Indonesia 2015
P r o v i n s iP r o v i n c e
Triwulan I / Quarter I Triwulan II / Quarter II
Tanaman yang Menghasilkan
Harvested Plant(Pohon/Tree)
ProduksiProduction
(ton)
Tanaman yang Menghasilkan
Harvested Plant(Pohon/Tree)
ProduksiProduction
(ton)
(1) (2) (3) (4) (5)
Aceh 70 593 3 718 144 482 6 966
Sumatera Utara 95 226 7 656 139 940 9 370
Sumatera Barat 28 237 1 472 26 916 1 216
Riau 72 572 2 203 75 493 2 634
Jambi 18 889 1 048 11 160 755
Sumatera Selatan 65 987 3 115 38 881 1 840
Bengkulu 19 855 1 228 20 969 695
Lampung 107 787 6 219 67 230 4 203
Kep. Bangka Belitung 9 227 516 7 030 175
Kepulauan Riau 7 827 209 20 207 621
DKI Jakarta 71 258 1 976 46 302 1 243
Jawa Barat 702 000 36 259 743 087 41 367
Jawa Tengah 1 030 486 55 106 636 387 28 168
DI Yogyakarta 54 984 2 604 3 260 67
Jawa Timur 1 457 272 66 207 596 659 30 120
Banten 157 638 4 668 167 036 6 465
Bali 18 990 755 11 297 315
Nusa Tenggara Barat 108 147 7 118 127 801 8 053
Nusa Tenggara Timur 296 358 10 865 179 179 6 584
Kalimantan Barat 18 150 698 22 394 758
Kalimantan Tengah 44 070 1 175 24 516 733
Kalimantan Selatan 26 111 989 18 982 630
Kalimantan Timur 36 160 1 688 20 521 1 049
Kalimatan Utara 11 108 488 14 839 786
Sulawesi Utara 39 238 2 159 23 957 1 320
Sulawesi Tengah 45 404 3 307 41 277 2 710
Sulawesi Selatan 676 778 31 382 241 625 13 981
Sulawesi Tenggara 103 315 3 725 59 426 1 697
Gorontalo 34 444 2 034 18 002 1 011
Sulawesi Barat 59 772 5 483 44 508 1 005
Maluku 54 265 2 735 28 411 1 361
Maluku Utara 17 239 1 325 13 462 1 107
Papua Barat 7 744 248 2 925 98
Papua 1 233 65 7 565 374
I N D O N E S I A 5 568 364 270 443 3 645 726 179 477
Produksi dan Banyaknya Tanaman Mangga yang Menghasilkan Menurut Provinsi 2015Production and Number of Harvested Plant of M a n g o by P rov i n ce 2 0 1 5
TABELTABLE
1.11
http
://www.b
ps.g
o.id

49Statistik Tanaman Buah-Buahan dan Sayuran Tahunan Indonesia 2015
Triwulan III / Quarter III Triwulan IV / Quarter IVTotal Produksi
Total Production(ton)
Tanaman yang Menghasilkan
Harvested Plant(Pohon/Tree)
ProduksiProduction
(ton)
Tanaman yang Menghasilkan
Harvested Plant(Pohon/Tree)
ProduksiProduction
(ton)
(6) (7) (8) (9) (10)
81 564 3 837 87 375 4 168 18 689
99 601 6 338 148 876 8 809 32 173
29 526 1 455 50 124 2 569 6 712
83 453 2 553 100 828 2 858 10 248
11 277 821 27 832 1 699 4 323
121 963 4 347 104 809 5 255 14 557
44 301 1 652 30 687 1 480 5 055
173 450 9 744 189 704 10 714 30 880
17 154 369 57 004 2 228 3 288
13 866 816 17 559 562 2 208
52 429 1 287 44 072 1 369 5 875
1 926 974 93 169 2 415 639 139 431 310 226
2 812 903 126 296 3 573 759 187 066 396 636
305 647 10 128 479 196 23 941 36 740
5 185 913 259 689 7 980 809 450 629 806 645
142 225 9 877 290 347 14 282 35 292
207 286 10 805 720 581 42 679 54 554
766 516 45 525 1 002 421 60 001 120 697
324 048 10 760 629 335 27 661 55 870
37 055 1 479 51 163 2 114 5 049
38 835 1 314 56 696 1 785 5 007
34 639 1 005 113 639 5 950 8 574
40 187 1 427 69 459 2 377 6 541
16 688 782 14 335 461 2 517
27 245 1 652 39 733 2 365 7 496
49 189 3 341 89 436 6 273 15 631
271 039 15 516 982 177 56 326 117 205
167 051 12 565 189 747 7 881 25 868
32 932 2 058 52 651 2 409 7 512
19 637 906 49 407 3 833 11 227
23 454 1 581 65 809 3 763 9 440
17 990 1 060 19 309 1 179 4 671
2 804 201 5 468 132 679
5 435 288 205 21 748
13 184 276 644 643 19 750 191 1 084 270 2 178 833
L anjutan Tabel/Co n t i n u e d Ta b l e 1.11
http
://www.b
ps.g
o.id

50 Statistics of Annual Fruit and Vegetable Plants Indonesia 2015
P r o v i n s iP r o v i n c e
Triwulan I / Quarter I Triwulan II / Quarter II
Tanaman yang Menghasilkan
Harvested Plant(Pohon/Tree)
ProduksiProduction
(ton)
Tanaman yang Menghasilkan
Harvested Plant(Pohon/Tree)
ProduksiProduction
(ton)
(1) (2) (3) (4) (5)
Aceh 2 709 140 4 639 202
Sumatera Utara 29 069 1 164 17 608 962
Sumatera Barat 114 508 6 209 34 824 2 117
Riau 20 778 570 66 652 992
Jambi 17 529 704 4 314 347
Sumatera Selatan 39 423 1 112 14 095 679
Bengkulu 33 960 1 009 12 229 512
Lampung 54 672 3 018 16 982 275
Kep. Bangka Belitung 30 005 1 130 1 569 13
Kepulauan Riau 395 11 419 24
DKI Jakarta - - - -
Jawa Barat 754 697 57 926 56 480 3 259
Jawa Tengah 183 387 7 882 73 638 1 577
DI Yogyakarta 27 610 1 724 19 032 441
Jawa Timur 279 703 18 796 76 298 2 263
Banten 177 224 5 780 8 009 335
Bali 187 242 7 526 60 037 2 261
Nusa Tenggara Barat 56 409 2 956 22 061 690
Nusa Tenggara Timur 121 4 5 0
Kalimantan Barat 5 633 136 1 349 37
Kalimantan Tengah 12 431 266 6 980 148
Kalimantan Selatan 17 112 710 9 695 127
Kalimantan Timur 6 417 200 1 858 157
Kalimatan Utara 374 13 629 21
Sulawesi Utara 8 622 475 3 206 126
Sulawesi Tengah 14 879 782 2 661 161
Sulawesi Selatan 132 525 2 717 125 405 1 902
Sulawesi Tenggara 2 464 50 427 4
Gorontalo - - - -
Sulawesi Barat 20 717 466 10 614 286
Maluku 5 105 127 4 033 65
Maluku Utara 1 891 128 1 100 77
Papua Barat 0 1 - -
Papua 100 8 - -
I N D O N E S I A 2 237 711 123 740 656 848 20 060
Produksi dan Banyaknya Tanaman Manggis yang Menghasilkan Menurut Provinsi 2015Production and Number of Harvested Plant of M a n g o s te e n by P rov i n ce 2 0 1 5
TABELTABLE 1.12
http
://www.b
ps.g
o.id
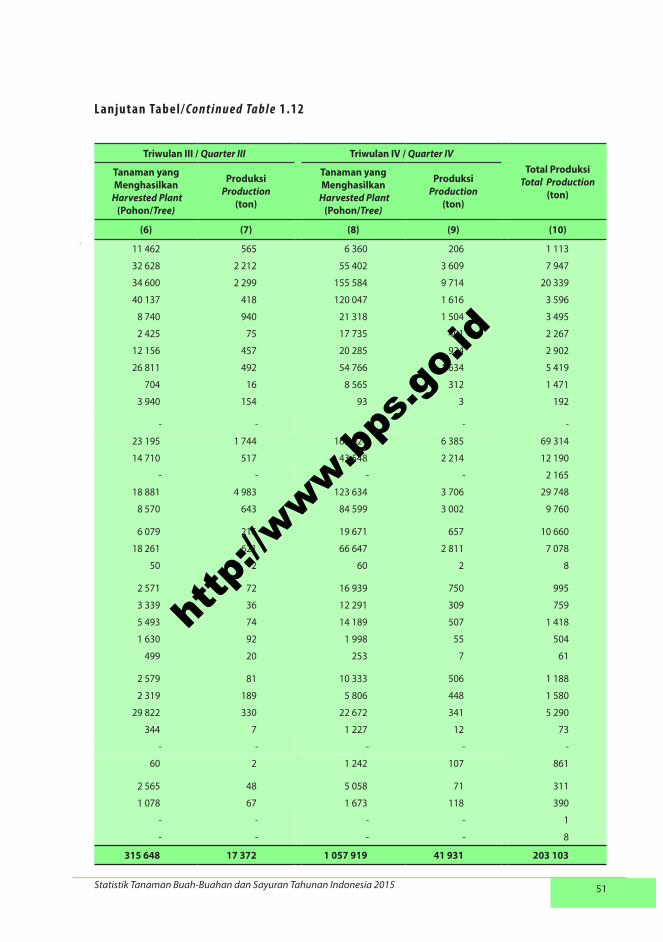
51Statistik Tanaman Buah-Buahan dan Sayuran Tahunan Indonesia 2015
Triwulan III / Quarter III Triwulan IV / Quarter IVTotal Produksi
Total Production(ton)
Tanaman yang Menghasilkan
Harvested Plant(Pohon/Tree)
ProduksiProduction
(ton)
Tanaman yang Menghasilkan
Harvested Plant(Pohon/Tree)
ProduksiProduction
(ton)
(6) (7) (8) (9) (10)
11 462 565 6 360 206 1 113
32 628 2 212 55 402 3 609 7 947
34 600 2 299 155 584 9 714 20 339
40 137 418 120 047 1 616 3 596
8 740 940 21 318 1 504 3 495
2 425 75 17 735 401 2 267
12 156 457 20 285 924 2 902
26 811 492 54 766 1 634 5 419
704 16 8 565 312 1 471
3 940 154 93 3 192
- - - - -
23 195 1 744 165 924 6 385 69 314
14 710 517 43 548 2 214 12 190
- - - - 2 165
18 881 4 983 123 634 3 706 29 748
8 570 643 84 599 3 002 9 760
6 079 216 19 671 657 10 660
18 261 621 66 647 2 811 7 078
50 2 60 2 8
2 571 72 16 939 750 995
3 339 36 12 291 309 759
5 493 74 14 189 507 1 418
1 630 92 1 998 55 504
499 20 253 7 61
2 579 81 10 333 506 1 188
2 319 189 5 806 448 1 580
29 822 330 22 672 341 5 290
344 7 1 227 12 73
- - - - -
60 2 1 242 107 861
2 565 48 5 058 71 311
1 078 67 1 673 118 390
- - - - 1
- - - - 8
315 648 17 372 1 057 919 41 931 203 103
L anjutan Tabel/Co n t i n u e d Ta b l e 1.12
http
://www.b
ps.g
o.id
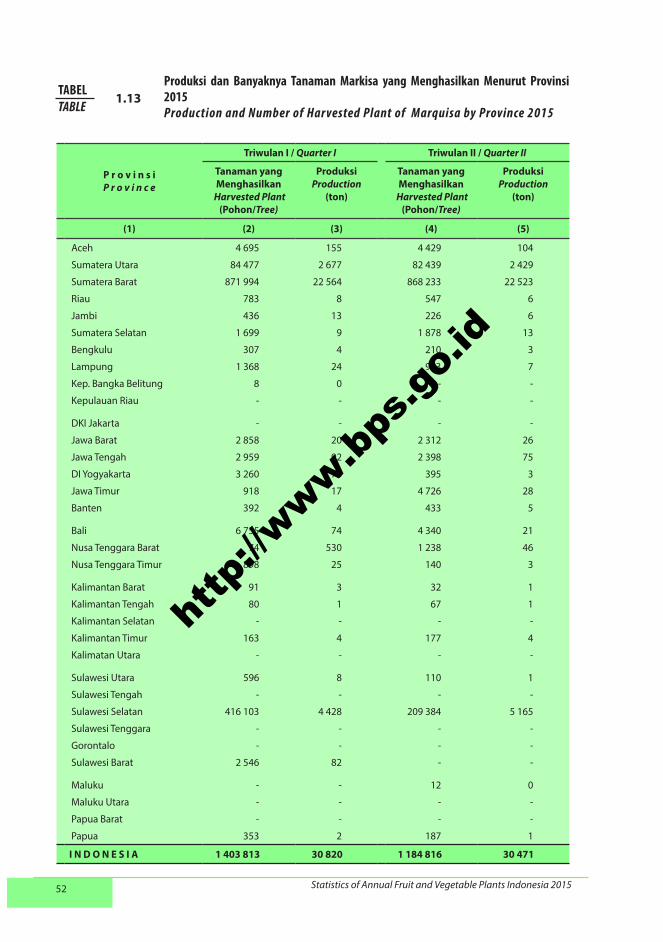
52 Statistics of Annual Fruit and Vegetable Plants Indonesia 2015
P r o v i n s iP r o v i n c e
Triwulan I / Quarter I Triwulan II / Quarter II
Tanaman yang Menghasilkan
Harvested Plant(Pohon/Tree)
ProduksiProduction
(ton)
Tanaman yang Menghasilkan
Harvested Plant(Pohon/Tree)
ProduksiProduction
(ton)
(1) (2) (3) (4) (5)
Aceh 4 695 155 4 429 104
Sumatera Utara 84 477 2 677 82 439 2 429
Sumatera Barat 871 994 22 564 868 233 22 523
Riau 783 8 547 6
Jambi 436 13 226 6
Sumatera Selatan 1 699 9 1 878 13
Bengkulu 307 4 210 3
Lampung 1 368 24 903 7
Kep. Bangka Belitung 8 0 - -
Kepulauan Riau - - - -
DKI Jakarta - - - -
Jawa Barat 2 858 20 2 312 26
Jawa Tengah 2 959 92 2 398 75
DI Yogyakarta 3 260 76 395 3
Jawa Timur 918 17 4 726 28
Banten 392 4 433 5
Bali 6 755 74 4 340 21
Nusa Tenggara Barat 74 530 1 238 46
Nusa Tenggara Timur 898 25 140 3
Kalimantan Barat 91 3 32 1
Kalimantan Tengah 80 1 67 1
Kalimantan Selatan - - - -
Kalimantan Timur 163 4 177 4
Kalimatan Utara - - - -
Sulawesi Utara 596 8 110 1
Sulawesi Tengah - - - -
Sulawesi Selatan 416 103 4 428 209 384 5 165
Sulawesi Tenggara - - - -
Gorontalo - - - -
Sulawesi Barat 2 546 82 - -
Maluku - - 12 0
Maluku Utara - - - -
Papua Barat - - - -
Papua 353 2 187 1
I N D O N E S I A 1 403 813 30 820 1 184 816 30 471
Produksi dan Banyaknya Tanaman Markisa yang Menghasilkan Menurut Provinsi 2015Produc tion and Number of Harvested Plant of Marquisa by Province 2015
TABELTABLE
1.13
http
://www.b
ps.g
o.id
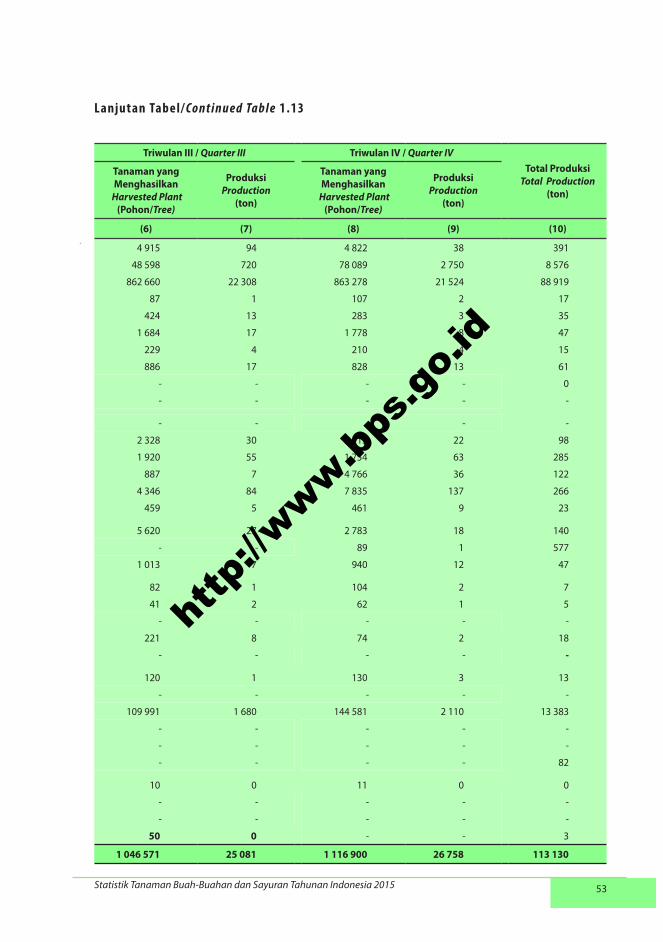
53Statistik Tanaman Buah-Buahan dan Sayuran Tahunan Indonesia 2015
Triwulan III / Quarter III Triwulan IV / Quarter IVTotal Produksi
Total Production(ton)
Tanaman yang Menghasilkan
Harvested Plant(Pohon/Tree)
ProduksiProduction
(ton)
Tanaman yang Menghasilkan
Harvested Plant(Pohon/Tree)
ProduksiProduction
(ton)
(6) (7) (8) (9) (10)
4 915 94 4 822 38 391
48 598 720 78 089 2 750 8 576
862 660 22 308 863 278 21 524 88 919
87 1 107 2 17
424 13 283 3 35
1 684 17 1 778 8 47
229 4 210 4 15
886 17 828 13 61
- - - - 0
- - - - -
- - - - -
2 328 30 3 915 22 98
1 920 55 1 754 63 285
887 7 4 766 36 122
4 346 84 7 835 137 266
459 5 461 9 23
5 620 27 2 783 18 140
- - 89 1 577
1 013 7 940 12 47
82 1 104 2 7
41 2 62 1 5
- - - - -
221 8 74 2 18
- - - - -
120 1 130 3 13
- - - - -
109 991 1 680 144 581 2 110 13 383
- - - - -
- - - - -
- - - - 82
10 0 11 0 0
- - - - -
- - - - -
50 0 - - 3
1 046 571 25 081 1 116 900 26 758 113 130
L anjutan Tabel/Co n t i n u e d Ta b l e 1.13
http
://www.b
ps.g
o.id
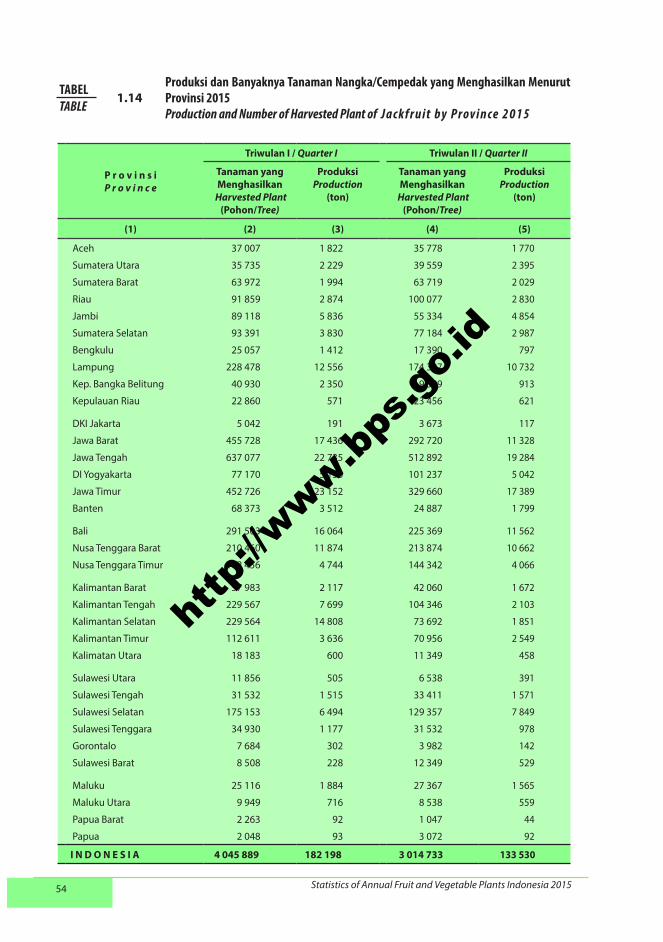
54 Statistics of Annual Fruit and Vegetable Plants Indonesia 2015
P r o v i n s iP r o v i n c e
Triwulan I / Quarter I Triwulan II / Quarter II
Tanaman yang Menghasilkan
Harvested Plant(Pohon/Tree)
ProduksiProduction
(ton)
Tanaman yang Menghasilkan
Harvested Plant(Pohon/Tree)
ProduksiProduction
(ton)
(1) (2) (3) (4) (5)
Aceh 37 007 1 822 35 778 1 770
Sumatera Utara 35 735 2 229 39 559 2 395
Sumatera Barat 63 972 1 994 63 719 2 029
Riau 91 859 2 874 100 077 2 830
Jambi 89 118 5 836 55 334 4 854
Sumatera Selatan 93 391 3 830 77 184 2 987
Bengkulu 25 057 1 412 17 390 797
Lampung 228 478 12 556 174 387 10 732
Kep. Bangka Belitung 40 930 2 350 19 599 913
Kepulauan Riau 22 860 571 23 456 621
DKI Jakarta 5 042 191 3 673 117
Jawa Barat 455 728 17 436 292 720 11 328
Jawa Tengah 637 077 22 735 512 892 19 284
DI Yogyakarta 77 170 5 150 101 237 5 042
Jawa Timur 452 726 23 152 329 660 17 389
Banten 68 373 3 512 24 887 1 799
Bali 291 503 16 064 225 369 11 562
Nusa Tenggara Barat 210 460 11 874 213 874 10 662
Nusa Tenggara Timur 162 456 4 744 144 342 4 066
Kalimantan Barat 57 983 2 117 42 060 1 672
Kalimantan Tengah 229 567 7 699 104 346 2 103
Kalimantan Selatan 229 564 14 808 73 692 1 851
Kalimantan Timur 112 611 3 636 70 956 2 549
Kalimatan Utara 18 183 600 11 349 458
Sulawesi Utara 11 856 505 6 538 391
Sulawesi Tengah 31 532 1 515 33 411 1 571
Sulawesi Selatan 175 153 6 494 129 357 7 849
Sulawesi Tenggara 34 930 1 177 31 532 978
Gorontalo 7 684 302 3 982 142
Sulawesi Barat 8 508 228 12 349 529
Maluku 25 116 1 884 27 367 1 565
Maluku Utara 9 949 716 8 538 559
Papua Barat 2 263 92 1 047 44
Papua 2 048 93 3 072 92
I N D O N E S I A 4 045 889 182 198 3 014 733 133 530
Produksi dan Banyaknya Tanaman Nangka/Cempedak yang Menghasilkan Menurut Provinsi 2015Production and Number of Harvested Plant of J a c k f r u i t by P rov i n ce 2 0 1 5
TABELTABLE
1.14
http
://www.b
ps.g
o.id

55Statistik Tanaman Buah-Buahan dan Sayuran Tahunan Indonesia 2015
Triwulan III / Quarter III Triwulan IV / Quarter IVTotal Produksi
Total Production(ton)
Tanaman yang Menghasilkan
Harvested Plant(Pohon/Tree)
ProduksiProduction
(ton)
Tanaman yang Menghasilkan
Harvested Plant(Pohon/Tree)
ProduksiProduction
(ton)
(6) (7) (8) (9) (10)
47 310 2 500 38 160 1 762 7 854
52 851 3 598 44 916 2 796 11 018
55 478 1 748 61 055 2 091 7 862
98 236 2 032 99 311 2 645 10 381
49 527 4 192 61 353 4 821 19 703
58 499 1 781 83 306 3 765 12 363
21 345 897 18 435 835 3 941
146 200 8 926 185 201 9 822 42 036
14 601 703 42 143 1 968 5 934
19 580 616 16 355 586 2 394
6 087 279 4 405 183 770
318 010 11 346 440 215 20 513 60 623
623 871 22 862 863 186 40 033 104 914
97 420 5 513 206 702 12 676 28 381
445 725 19 770 1 089 399 56 184 116 495
27 410 1 489 53 800 1 894 8 694
244 697 11 750 247 997 10 358 49 734
326 010 19 526 433 558 26 298 68 360
129 014 3 925 249 347 7 902 20 637
39 922 1 176 85 320 3 690 8 655
94 845 2 096 130 632 3 770 15 668
62 461 1 445 101 643 2 656 20 760
68 246 2 149 85 391 2 528 10 862
22 543 841 7 182 234 2 133
6 223 352 7 334 406 1 654
27 819 1 493 34 600 2 114 6 693
145 212 6 407 178 123 11 447 32 197
31 995 1 404 52 304 2 625 6 184
6 615 469 10 156 272 1 185
12 571 648 16 838 1 030 2 435
17 621 817 31 220 1 603 5 869
10 642 661 9 682 642 2 578
608 17 1 264 31 184
1 422 110 1 287 49 344
3 330 616 143 538 4 991 820 240 229 699 495
L anjutan Tabel/Co n t i n u e d Ta b l e 1.14
http
://www.b
ps.g
o.id
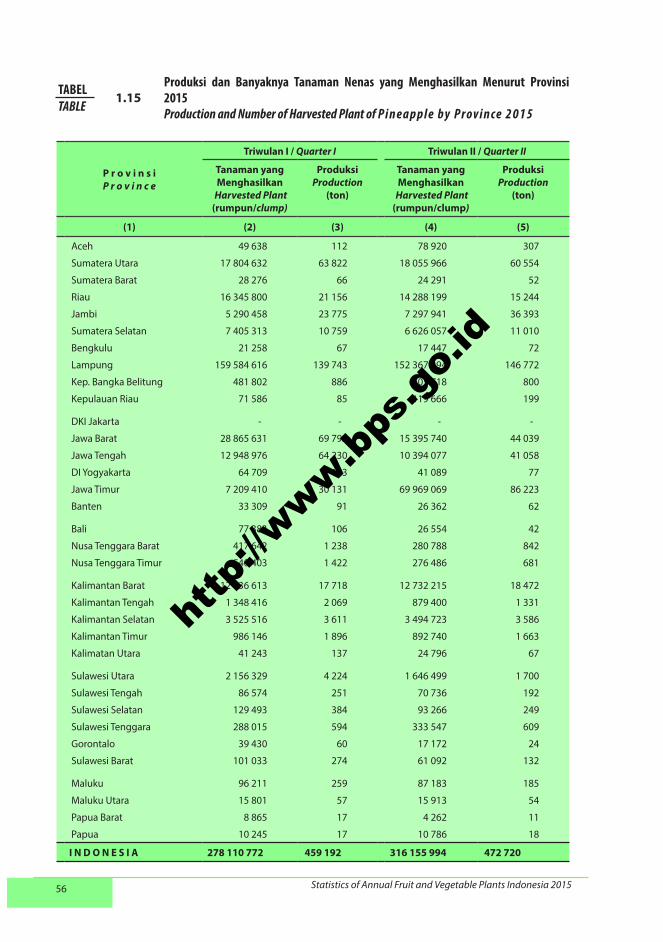
56 Statistics of Annual Fruit and Vegetable Plants Indonesia 2015
P r o v i n s iP r o v i n c e
Triwulan I / Quarter I Triwulan II / Quarter II
Tanaman yang Menghasilkan
Harvested Plant(rumpun/clump)
ProduksiProduction
(ton)
Tanaman yang Menghasilkan
Harvested Plant(rumpun/clump)
ProduksiProduction
(ton)
(1) (2) (3) (4) (5)
Aceh 49 638 112 78 920 307
Sumatera Utara 17 804 632 63 822 18 055 966 60 554
Sumatera Barat 28 276 66 24 291 52
Riau 16 345 800 21 156 14 288 199 15 244
Jambi 5 290 458 23 775 7 297 941 36 393
Sumatera Selatan 7 405 313 10 759 6 626 057 11 010
Bengkulu 21 258 67 17 447 72
Lampung 159 584 616 139 743 152 367 294 146 772
Kep. Bangka Belitung 481 802 886 505 718 800
Kepulauan Riau 71 586 85 119 666 199
DKI Jakarta - - - -
Jawa Barat 28 865 631 69 792 15 395 740 44 039
Jawa Tengah 12 948 976 64 230 10 394 077 41 058
DI Yogyakarta 64 709 143 41 089 77
Jawa Timur 7 209 410 30 131 69 969 069 86 223
Banten 33 309 91 26 362 62
Bali 77 383 106 26 554 42
Nusa Tenggara Barat 417 642 1 238 280 788 842
Nusa Tenggara Timur 540 403 1 422 276 486 681
Kalimantan Barat 12 036 613 17 718 12 732 215 18 472
Kalimantan Tengah 1 348 416 2 069 879 400 1 331
Kalimantan Selatan 3 525 516 3 611 3 494 723 3 586
Kalimantan Timur 986 146 1 896 892 740 1 663
Kalimatan Utara 41 243 137 24 796 67
Sulawesi Utara 2 156 329 4 224 1 646 499 1 700
Sulawesi Tengah 86 574 251 70 736 192
Sulawesi Selatan 129 493 384 93 266 249
Sulawesi Tenggara 288 015 594 333 547 609
Gorontalo 39 430 60 17 172 24
Sulawesi Barat 101 033 274 61 092 132
Maluku 96 211 259 87 183 185
Maluku Utara 15 801 57 15 913 54
Papua Barat 8 865 17 4 262 11
Papua 10 245 17 10 786 18
I N D O N E S I A 278 110 772 459 192 316 155 994 472 720
Produksi dan Banyaknya Tanaman Nenas yang Menghasilkan Menurut Provinsi 2015Production and Number of Harvested Plant of P i n e a p p l e by P rov i n ce 2 0 1 5
TABELTABLE
1.15
http
://www.b
ps.g
o.id
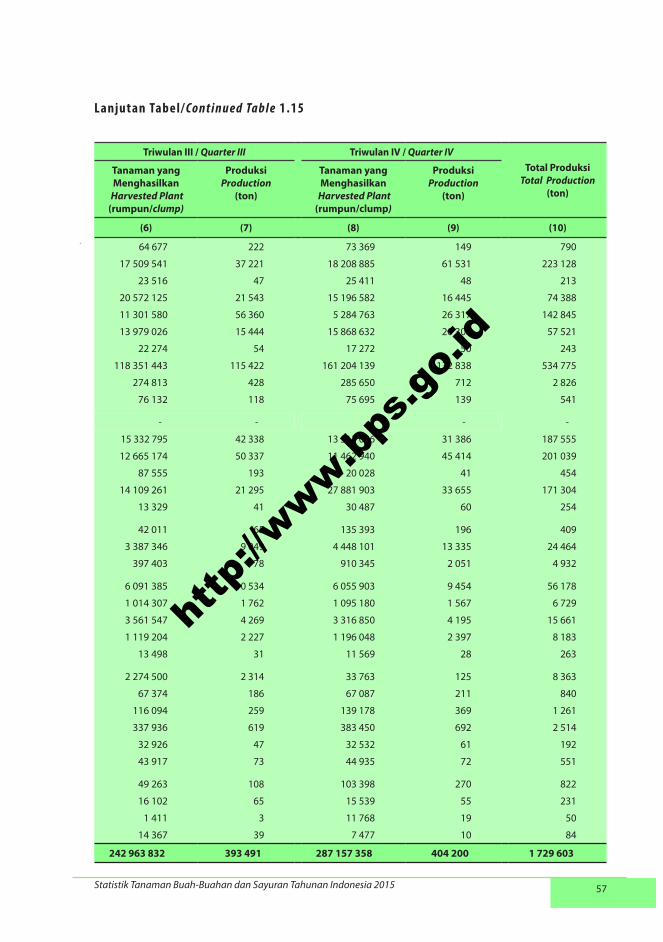
57Statistik Tanaman Buah-Buahan dan Sayuran Tahunan Indonesia 2015
Triwulan III / Quarter III Triwulan IV / Quarter IVTotal Produksi
Total Production(ton)
Tanaman yang Menghasilkan
Harvested Plant(rumpun/clump)
ProduksiProduction
(ton)
Tanaman yang Menghasilkan
Harvested Plant(rumpun/clump)
ProduksiProduction
(ton)
(6) (7) (8) (9) (10)
64 677 222 73 369 149 790
17 509 541 37 221 18 208 885 61 531 223 128
23 516 47 25 411 48 213
20 572 125 21 543 15 196 582 16 445 74 388
11 301 580 56 360 5 284 763 26 317 142 845
13 979 026 15 444 15 868 632 20 308 57 521
22 274 54 17 272 50 243
118 351 443 115 422 161 204 139 132 838 534 775
274 813 428 285 650 712 2 826
76 132 118 75 695 139 541
- - - - -
15 332 795 42 338 13 513 086 31 386 187 555
12 665 174 50 337 11 462 940 45 414 201 039
87 555 193 20 028 41 454
14 109 261 21 295 27 881 903 33 655 171 304
13 329 41 30 487 60 254
42 011 65 135 393 196 409
3 387 346 9 049 4 448 101 13 335 24 464
397 403 778 910 345 2 051 4 932
6 091 385 10 534 6 055 903 9 454 56 178
1 014 307 1 762 1 095 180 1 567 6 729
3 561 547 4 269 3 316 850 4 195 15 661
1 119 204 2 227 1 196 048 2 397 8 183
13 498 31 11 569 28 263
2 274 500 2 314 33 763 125 8 363
67 374 186 67 087 211 840
116 094 259 139 178 369 1 261
337 936 619 383 450 692 2 514
32 926 47 32 532 61 192
43 917 73 44 935 72 551
49 263 108 103 398 270 822
16 102 65 15 539 55 231
1 411 3 11 768 19 50
14 367 39 7 477 10 84
242 963 832 393 491 287 157 358 404 200 1 729 603
L anjutan Tabel/Co n t i n u e d Ta b l e 1.15
http
://www.b
ps.g
o.id

58 Statistics of Annual Fruit and Vegetable Plants Indonesia 2015
P r o v i n s iP r o v i n c e
Triwulan I / Quarter I Triwulan II / Quarter II
Tanaman yang Menghasilkan
Harvested Plant(Pohon/Tree)
ProduksiProduction
(ton)
Tanaman yang Menghasilkan
Harvested Plant(Pohon/Tree)
ProduksiProduction
(ton)
(1) (2) (3) (4) (5)
Aceh 116 461 2 913 107 735 2 752
Sumatera Utara 193 877 7 804 188 893 8 101
Sumatera Barat 150 283 3 381 151 235 3 165
Riau 177 960 2 322 153 755 1 672
Jambi 205 509 10 245 119 260 1 921
Sumatera Selatan 132 502 4 469 135 067 4 233
Bengkulu 67 526 1 607 58 854 1 483
Lampung 1 768 153 17 872 1 663 526 15 936
Kep. Bangka Belitung 25 766 857 23 927 428
Kepulauan Riau 61 276 625 59 778 496
DKI Jakarta 10 806 200 7 706 138
Jawa Barat 992 657 23 733 946 551 22 465
Jawa Tengah 1 142 032 23 427 1 221 863 27 942
DI Yogyakarta 119 136 3 085 109 683 2 985
Jawa Timur 1 847 272 65 081 1 775 509 67 781
Banten 106 240 2 665 68 138 2 046
Bali 131 854 1 951 124 072 2 659
Nusa Tenggara Barat 103 516 2 635 118 573 2 738
Nusa Tenggara Timur 692 706 15 109 776 708 18 748
Kalimantan Barat 156 830 2 785 89 651 2 004
Kalimantan Tengah 54 689 1 027 51 267 830
Kalimantan Selatan 68 848 1 068 80 325 1 129
Kalimantan Timur 115 563 2 435 130 843 2 773
Kalimatan Utara 160 609 2 368 5 011 129
Sulawesi Utara 49 306 1 136 53 507 1 696
Sulawesi Tengah 39 230 1 375 38 067 1 088
Sulawesi Selatan 246 359 9 706 236 185 9 669
Sulawesi Tenggara 122 439 2 001 127 849 2 140
Gorontalo 11 469 293 8 725 124
Sulawesi Barat 17 189 324 16 924 332
Maluku 86 173 3 825 76 524 3 042
Maluku Utara 9 892 369 10 373 366Papua Barat 2 893 58 2 250 45
Papua 4 261 186 5 557 175
I N D O N E S I A 9 191 282 218 937 8 743 891 213 231
Produksi dan Banyaknya Tanaman Pepaya yang Menghasilkan Menurut Provinsi 2015Production and Number of Harvested Plant of Pa p a ya by P rov i n ce 2 0 1 5
TABELTABLE
1.16
http
://www.b
ps.g
o.id

59Statistik Tanaman Buah-Buahan dan Sayuran Tahunan Indonesia 2015
Triwulan III / Quarter III Triwulan IV / Quarter IVTotal Produksi
Total Production(ton)
Tanaman yang Menghasilkan
Harvested Plant(Pohon/Tree)
ProduksiProduction
(ton)
Tanaman yang Menghasilkan
Harvested Plant(Pohon/Tree)
ProduksiProduction
(ton)
(6) (7) (8) (9) (10)
123 325 3 285 113 152 2 239 11 189
174 437 4 847 195 788 5 553 26 305
145 519 3 160 252 833 5 244 14 950
122 181 1 311 171 590 1 733 7 038
205 839 2 413 254 898 6 810 21 389
136 597 4 054 122 145 4 550 17 306
71 971 1 388 55 704 1 638 6 116
1 705 846 19 823 1 657 825 16 911 70 542
17 876 289 19 300 269 1 843
58 094 483 58 091 472 2 076
5 271 78 5 162 87 503
925 558 19 249 968 531 21 038 86 485
1 206 523 25 363 1 146 261 27 012 103 744
149 602 4 214 137 823 2 259 12 543
1 917 517 56 845 1 923 691 76 308 266 015
85 302 2 969 93 069 2 144 9 824
117 645 1 765 117 075 2 389 8 764
94 436 2 800 237 629 3 138 11 311
779 887 13 666 729 455 19 163 66 686
132 197 2 486 150 979 2 317 9 592
58 451 1 262 52 024 953 4 072
61 829 950 58 823 1 015 4 162
151 229 1 881 133 092 2 067 9 156
5 635 119 4 764 95 2 711
53 025 1 532 47 363 1 120 5 484
35 208 1 038 38 658 1 151 4 652
187 759 8 009 336 876 15 119 42 503
113 895 1 955 115 050 1 685 7 781
15 232 530 13 737 300 1 247
11 426 233 13 091 534 1 423
74 499 3 070 49 931 1 726 11 663
10 522 367 9 803 332 1 434
1 974 73 1 868 47 223
10 319 431 943 8 800
8 966 626 191 938 9 287 024 227 426 851 532
L anjutan Tabel/Co n t i n u e d Ta b l e 1.16
http
://www.b
ps.g
o.id
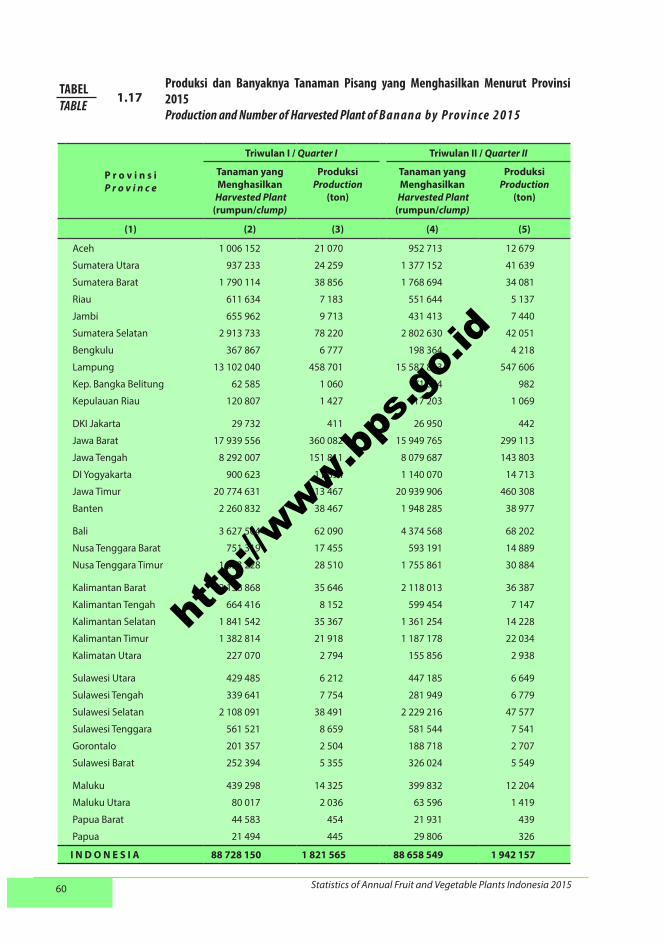
60 Statistics of Annual Fruit and Vegetable Plants Indonesia 2015
P r o v i n s iP r o v i n c e
Triwulan I / Quarter I Triwulan II / Quarter II
Tanaman yang Menghasilkan
Harvested Plant(rumpun/clump)
ProduksiProduction
(ton)
Tanaman yang Menghasilkan
Harvested Plant(rumpun/clump)
ProduksiProduction
(ton)
(1) (2) (3) (4) (5)
Aceh 1 006 152 21 070 952 713 12 679
Sumatera Utara 937 233 24 259 1 377 152 41 639
Sumatera Barat 1 790 114 38 856 1 768 694 34 081
Riau 611 634 7 183 551 644 5 137
Jambi 655 962 9 713 431 413 7 440
Sumatera Selatan 2 913 733 78 220 2 802 630 42 051
Bengkulu 367 867 6 777 198 364 4 218
Lampung 13 102 040 458 701 15 587 853 547 606
Kep. Bangka Belitung 62 585 1 060 71 044 982
Kepulauan Riau 120 807 1 427 117 203 1 069
DKI Jakarta 29 732 411 26 950 442
Jawa Barat 17 939 556 360 082 15 949 765 299 113
Jawa Tengah 8 292 007 151 811 8 079 687 143 803
DI Yogyakarta 900 623 11 894 1 140 070 14 713
Jawa Timur 20 774 631 313 467 20 939 906 460 308
Banten 2 260 832 38 467 1 948 285 38 977
Bali 3 627 504 62 090 4 374 568 68 202
Nusa Tenggara Barat 751 319 17 455 593 191 14 889
Nusa Tenggara Timur 1 853 228 28 510 1 755 861 30 884
Kalimantan Barat 2 136 868 35 646 2 118 013 36 387
Kalimantan Tengah 664 416 8 152 599 454 7 147
Kalimantan Selatan 1 841 542 35 367 1 361 254 14 228
Kalimantan Timur 1 382 814 21 918 1 187 178 22 034
Kalimatan Utara 227 070 2 794 155 856 2 938
Sulawesi Utara 429 485 6 212 447 185 6 649
Sulawesi Tengah 339 641 7 754 281 949 6 779
Sulawesi Selatan 2 108 091 38 491 2 229 216 47 577
Sulawesi Tenggara 561 521 8 659 581 544 7 541
Gorontalo 201 357 2 504 188 718 2 707
Sulawesi Barat 252 394 5 355 326 024 5 549
Maluku 439 298 14 325 399 832 12 204
Maluku Utara 80 017 2 036 63 596 1 419
Papua Barat 44 583 454 21 931 439
Papua 21 494 445 29 806 326
I N D O N E S I A 88 728 150 1 821 565 88 658 549 1 942 157
Produksi dan Banyaknya Tanaman Pisang yang Menghasilkan Menurut Provinsi 2015Production and Number of Harvested Plant of Ba n a n a by P rov i n ce 2 0 1 5
TABELTABLE
1.17
http
://www.b
ps.g
o.id

61Statistik Tanaman Buah-Buahan dan Sayuran Tahunan Indonesia 2015
Triwulan III / Quarter III Triwulan IV / Quarter IVTotal Produksi
Total Production(ton)
Tanaman yang Menghasilkan
Harvested Plant(rumpun/clump)
ProduksiProduction
(ton)
Tanaman yang Menghasilkan
Harvested Plant(rumpun/clump)
ProduksiProduction
(ton)
(6) (7) (8) (9) (10)
947 713 12 734 1 145 368 14 563 61 046
1 137 178 35 293 1 287 412 38 351 139 542
1 598 980 28 768 1 728 466 35 247 136 952
530 557 4 470 522 661 4 525 21 315
390 695 7 061 393 689 8 055 32 269
2 772 653 18 855 1 793 200 21 060 160 186
407 430 5 775 424 786 7 219 23 989
13 652 362 483 001 12 498 907 448 041 1 937 349
66 478 990 60 419 825 3 857
95 958 919 112 163 1 073 4 488
21 642 353 141 087 856 2 062
15 796 312 285 955 16 044 163 361 138 1 306 288
7 887 386 142 142 8 395 626 144 026 581 782
1 010 181 15 476 1 007 044 9 136 51 219
16 946 757 384 327 18 945 930 471 335 1 629 437
1 326 553 22 239 2 230 614 38 128 137 811
2 272 196 28 969 2 156 480 30 180 189 441
749 582 22 609 794 852 18 266 73 219
1 744 477 24 504 1 344 891 24 400 108 298
2 192 497 39 504 2 260 779 33 197 144 734
568 940 5 340 543 294 6 524 27 163
1 689 179 15 271 1 352 487 14 628 79 494
1 040 362 14 811 1 323 827 13 381 72 144
151 382 3 918 146 454 2 479 12 129
236 543 5 859 512 325 10 422 29 142
248 086 6 111 296 545 6 809 27 453
1 749 708 33 893 1 939 649 55 427 175 388
590 372 6 291 572 343 6 596 29 087
145 608 2 407 167 227 2 377 9 995
363 678 4 951 623 479 12 638 28 493
414 065 12 646 410 425 13 302 52 477
55 421 1 421 71 502 2 394 7 270
19 608 776 49 192 422 2 091
24 977 827 6 938 67 1 665
78 845 516 1 678 466 81 304 224 1 857 087 7 299 275
L anjutan Tabel/Co n t i n u e d Ta b l e 1.17
http
://www.b
ps.g
o.id

62 Statistics of Annual Fruit and Vegetable Plants Indonesia 2015
P r o v i n s iP r o v i n c e
Triwulan I / Quarter I Triwulan II / Quarter II
Tanaman yang Menghasilkan
Harvested Plant(Pohon/Tree)
ProduksiProduction
(ton)
Tanaman yang Menghasilkan
Harvested Plant(Pohon/Tree)
ProduksiProduction
(ton)
(1) (2) (3) (4) (5)
Aceh 52 703 1 576 77 500 2 202
Sumatera Utara 40 712 2 751 59 992 3 526
Sumatera Barat 91 445 3 705 30 953 1 308
Riau 63 389 1 966 119 586 1 657
Jambi 72 289 3 568 12 907 665
Sumatera Selatan 256 567 11 349 31 387 794
Bengkulu 37 510 1 961 15 708 761
Lampung 482 072 27 618 58 106 1 387
Kep. Bangka Belitung 56 581 2 785 10 230 468
Kepulauan Riau 1 200 59 134 221 4 427
DKI Jakarta 23 557 763 6 849 288
Jawa Barat 2 024 324 121 125 70 465 3 967
Jawa Tengah 2 243 300 103 744 89 440 2 720
DI Yogyakarta 290 989 20 953 33 308 1 004
Jawa Timur 1 920 448 90 215 221 889 9 024
Banten 429 410 26 138 57 801 1 419
Bali 306 701 15 413 9 708 265
Nusa Tenggara Barat 116 659 6 632 32 851 1 668
Nusa Tenggara Timur 68 918 1 273 27 108 788
Kalimantan Barat 55 911 1 382 28 449 456
Kalimantan Tengah 310 449 6 359 122 903 2 911
Kalimantan Selatan 371 597 20 517 34 208 2 294
Kalimantan Timur 285 220 10 468 59 608 2 096
Kalimatan Utara 5 111 136 6 696 355
Sulawesi Utara 43 915 2 242 10 649 389
Sulawesi Tengah 63 502 2 554 23 263 916
Sulawesi Selatan 637 118 32 916 232 988 8 879
Sulawesi Tenggara 264 575 8 207 82 477 2 076
Gorontalo 8 185 134 1 827 33
Sulawesi Barat 56 160 2 033 12 377 587
Maluku 18 333 565 11 236 174
Maluku Utara 9 164 513 9 885 568
Papua Barat 10 259 282 4 297 141
Papua 4 659 168 2 008 42
I N D O N E S I A 10 722 932 532 070 1 742 880 60 255
Produksi dan Banyaknya Tanaman Rambutan yang Menghasilkan Menurut Provinsi 2015Production and Number of Harvested Plant of Ra m b u t a n by P rov i n ce 2 0 1 5
TABELTABLE
1.18
http
://www.b
ps.g
o.id
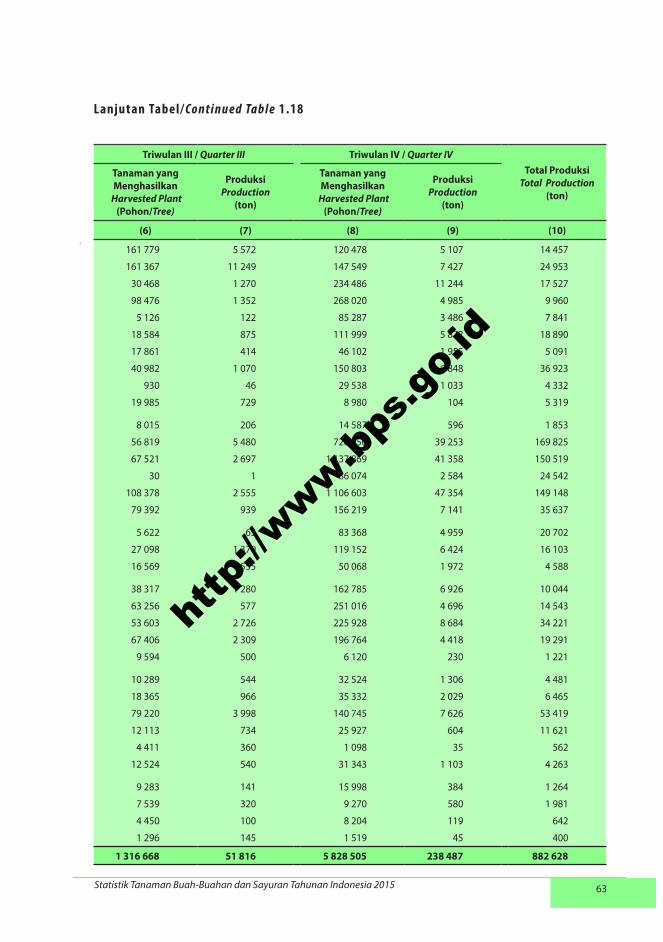
63Statistik Tanaman Buah-Buahan dan Sayuran Tahunan Indonesia 2015
Triwulan III / Quarter III Triwulan IV / Quarter IVTotal Produksi
Total Production(ton)
Tanaman yang Menghasilkan
Harvested Plant(Pohon/Tree)
ProduksiProduction
(ton)
Tanaman yang Menghasilkan
Harvested Plant(Pohon/Tree)
ProduksiProduction
(ton)
(6) (7) (8) (9) (10)
161 779 5 572 120 478 5 107 14 457
161 367 11 249 147 549 7 427 24 953
30 468 1 270 234 486 11 244 17 527
98 476 1 352 268 020 4 985 9 960
5 126 122 85 287 3 486 7 841
18 584 875 111 999 5 872 18 890
17 861 414 46 102 1 955 5 091
40 982 1 070 150 803 6 848 36 923
930 46 29 538 1 033 4 332
19 985 729 8 980 104 5 319
8 015 206 14 587 596 1 853
56 819 5 480 726 750 39 253 169 825
67 521 2 697 1 137 869 41 358 150 519
30 1 86 074 2 584 24 542
108 378 2 555 1 106 603 47 354 149 148
79 392 939 156 219 7 141 35 637
5 622 65 83 368 4 959 20 702
27 098 1 379 119 152 6 424 16 103
16 569 555 50 068 1 972 4 588
38 317 1 280 162 785 6 926 10 044
63 256 577 251 016 4 696 14 543
53 603 2 726 225 928 8 684 34 221
67 406 2 309 196 764 4 418 19 291
9 594 500 6 120 230 1 221
10 289 544 32 524 1 306 4 481
18 365 966 35 332 2 029 6 465
79 220 3 998 140 745 7 626 53 419
12 113 734 25 927 604 11 621
4 411 360 1 098 35 562
12 524 540 31 343 1 103 4 263
9 283 141 15 998 384 1 264
7 539 320 9 270 580 1 981
4 450 100 8 204 119 642
1 296 145 1 519 45 400
1 316 668 51 816 5 828 505 238 487 882 628
L anjutan Tabel/Co n t i n u e d Ta b l e 1.18
http
://www.b
ps.g
o.id
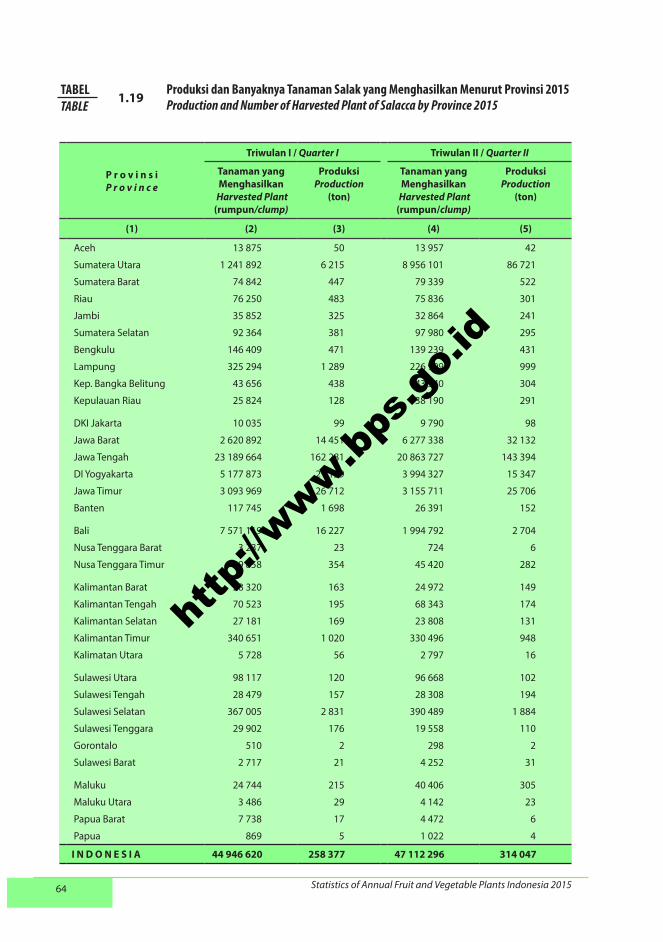
64 Statistics of Annual Fruit and Vegetable Plants Indonesia 2015
P r o v i n s iP r o v i n c e
Triwulan I / Quarter I Triwulan II / Quarter II
Tanaman yang Menghasilkan
Harvested Plant(rumpun/clump)
ProduksiProduction
(ton)
Tanaman yang Menghasilkan
Harvested Plant(rumpun/clump)
ProduksiProduction
(ton)
(1) (2) (3) (4) (5)
Aceh 13 875 50 13 957 42
Sumatera Utara 1 241 892 6 215 8 956 101 86 721
Sumatera Barat 74 842 447 79 339 522
Riau 76 250 483 75 836 301
Jambi 35 852 325 32 864 241
Sumatera Selatan 92 364 381 97 980 295
Bengkulu 146 409 471 139 239 431
Lampung 325 294 1 289 226 999 999
Kep. Bangka Belitung 43 656 438 43 540 304
Kepulauan Riau 25 824 128 38 190 291
DKI Jakarta 10 035 99 9 790 98
Jawa Barat 2 620 892 14 451 6 277 338 32 132
Jawa Tengah 23 189 664 162 281 20 863 727 143 394
DI Yogyakarta 5 177 873 21 129 3 994 327 15 347
Jawa Timur 3 093 969 26 712 3 155 711 25 706
Banten 117 745 1 698 26 391 152
Bali 7 571 119 16 227 1 994 792 2 704
Nusa Tenggara Barat 3 237 23 724 6
Nusa Tenggara Timur 49 858 354 45 420 282
Kalimantan Barat 28 320 163 24 972 149
Kalimantan Tengah 70 523 195 68 343 174
Kalimantan Selatan 27 181 169 23 808 131
Kalimantan Timur 340 651 1 020 330 496 948
Kalimatan Utara 5 728 56 2 797 16
Sulawesi Utara 98 117 120 96 668 102
Sulawesi Tengah 28 479 157 28 308 194
Sulawesi Selatan 367 005 2 831 390 489 1 884
Sulawesi Tenggara 29 902 176 19 558 110
Gorontalo 510 2 298 2
Sulawesi Barat 2 717 21 4 252 31
Maluku 24 744 215 40 406 305
Maluku Utara 3 486 29 4 142 23
Papua Barat 7 738 17 4 472 6
Papua 869 5 1 022 4
I N D O N E S I A 44 946 620 258 377 47 112 296 314 047
Produksi dan Banyaknya Tanaman Salak yang Menghasilkan Menurut Provinsi 2015Production and Number of Harvested Plant of Salacca by Province 2015
TABELTABLE
1.19
http
://www.b
ps.g
o.id

65Statistik Tanaman Buah-Buahan dan Sayuran Tahunan Indonesia 2015
Triwulan III / Quarter III Triwulan IV / Quarter IVTotal Produksi
Total Production(ton)
Tanaman yang Menghasilkan
Harvested Plant(rumpun/clump)
ProduksiProduction
(ton)
Tanaman yang Menghasilkan
Harvested Plant(rumpun/clump)
ProduksiProduction
(ton)
(6) (7) (8) (9) (10)
11 675 39 12 490 48 179
8 686 757 83 550 9 175 053 16 099 192 585
66 334 406 64 358 391 1 766
76 858 283 150 024 502 1 569
23 996 175 19 491 123 864
101 430 288 98 058 287 1 251
144 398 379 120 124 307 1 588
196 014 902 169 120 794 3 984
40 537 253 49 969 422 1 417
27 080 140 26 650 135 694
10 710 100 10 870 139 436
1 474 411 4 319 1 304 442 6 079 56 981
18 963 386 92 395 18 707 571 73 393 471 463
5 287 277 19 256 6 168 833 17 551 73 283
2 654 040 28 124 3 445 504 24 477 105 019
21 653 113 34 268 208 2 171
2 479 521 4 982 1 950 073 3 291 27 204
642 4 3 290 19 52
27 296 144 55 680 359 1 139
31 693 181 39 746 188 681
63 765 231 58 293 176 776
23 112 215 28 761 162 677
332 698 829 304 215 940 3 737
1 200 7 725 4 83
95 032 1 188 81 581 1 042 2 452
59 111 565 81 844 548 1 464
300 481 3 360 182 396 1 699 9 774
17 073 75 22 689 117 478
38 0 23 0 4
3 294 22 4 025 45 119
41 370 305 39 473 263 1 088
5 179 38 5 306 40 130
4 232 5 14 102 59 87
100 0 347 1 10
41 272 393 242 873 42 429 394 149 908 965 205
L anjutan Tabel/Co n t i n u e d Ta b l e 1.19
http
://www.b
ps.g
o.id

66 Statistics of Annual Fruit and Vegetable Plants Indonesia 2015
P r o v i n s iP r o v i n c e
Triwulan I / Quarter I Triwulan II / Quarter II
Tanaman yang Menghasilkan
Harvested Plant(Pohon/Tree)
ProduksiProduction
(ton)
Tanaman yang Menghasilkan
Harvested Plant(Pohon/Tree)
ProduksiProduction
(ton)
(1) (2) (3) (4) (5)
Aceh 31 117 1 065 29 522 936
Sumatera Utara 31 772 1 947 33 359 1 717
Sumatera Barat 64 877 3 060 51 113 2 090
Riau 44 458 1 225 44 854 991
Jambi 18 730 955 16 287 855
Sumatera Selatan 42 687 1 453 42 588 1 251
Bengkulu 9 585 406 7 744 239
Lampung 119 160 4 853 102 581 3 683
Kep. Bangka Belitung 2 868 183 2 386 106
Kepulauan Riau 1 863 45 2 171 55
DKI Jakarta 8 443 169 7 653 147
Jawa Barat 135 687 6 493 119 469 3 086
Jawa Tengah 85 706 3 257 84 336 3 056
DI Yogyakarta 30 240 1 432 28 873 995
Jawa Timur 59 724 2 193 83 526 3 474
Banten 17 231 679 9 493 493
Bali 33 051 1 237 30 169 925
Nusa Tenggara Barat 38 236 2 102 45 839 2 597
Nusa Tenggara Timur 11 396 272 7 296 191
Kalimantan Barat 23 630 823 27 444 904
Kalimantan Tengah 15 725 423 14 538 303
Kalimantan Selatan 15 083 392 17 381 465
Kalimantan Timur 16 327 493 11 719 432
Kalimatan Utara 80 3 90 4
Sulawesi Utara 0 4 - -
Sulawesi Tengah 1 226 72 1 056 52
Sulawesi Selatan 5 962 230 11 419 421
Sulawesi Tenggara 1 954 45 939 31
Gorontalo 11 0 8 0
Sulawesi Barat 10 1 656 64
Maluku 18 0 18 1
Maluku Utara - - - -
Papua Barat 156 3 166 3
Papua 5 0 250 10
I N D O N E S I A 867 018 35 515 834 943 29 577
Produksi dan Banyaknya Tanaman Sawo yang Menghasilkan Menurut Provinsi 2015
Production and Number of Harvested Plant of Sapodilla / Star Apple by Province 2015
TABELTABLE
1.20
http
://www.b
ps.g
o.id

67Statistik Tanaman Buah-Buahan dan Sayuran Tahunan Indonesia 2015
Triwulan III / Quarter III Triwulan IV / Quarter IVTotal Produksi
Total Production(ton)
Tanaman yang Menghasilkan
Harvested Plant(Pohon/Tree)
ProduksiProduction
(ton)
Tanaman yang Menghasilkan
Harvested Plant(Pohon/Tree)
ProduksiProduction
(ton)
(6) (7) (8) (9) (10)
27 224 1 039 29 228 1 475 4 515
33 999 2 014 28 642 1 711 7 389
56 192 2 510 58 757 2 513 10 173
49 227 1 029 55 515 1 196 4 441
13 005 526 17 465 657 2 993
42 651 1 438 34 970 1 560 5 702
10 110 339 12 165 392 1 376
95 166 3 781 82 367 3 340 15 657
3 992 167 3 964 128 584
9 993 577 1 959 54 731
7 339 140 7 854 146 602
80 507 2 752 168 857 7 339 19 670
86 973 2 981 96 899 3 176 12 470
46 196 1 450 49 377 2 704 6 581
97 746 3 796 70 970 2 637 12 100
7 696 330 13 311 526 2 028
35 059 1 125 27 800 853 4 140
59 441 3 543 68 098 3 586 11 828
10 165 321 7 561 267 1 051
26 819 698 36 255 819 3 244
15 722 312 15 848 360 1 398
12 784 402 19 598 627 1 886
11 618 336 15 734 486 1 747
71 2 57 2 11
- - - - 4
1 132 79 2 190 142 345
10 442 475 12 657 612 1 738
1 126 34 905 33 143
11 0 11 1 1
661 13 26 2 80
18 1 25 1 3
- - - - -
20 0 - - 6
4 0 - - 10
853 109 32 210 939 065 37 345 134 647
L anjutan Tabel/Co n t i n u e d Ta b l e 1.20
http
://www.b
ps.g
o.id

68 Statistics of Annual Fruit and Vegetable Plants Indonesia 2015
P r o v i n s iP r o v i n c e
Triwulan I / Quarter I Triwulan II / Quarter II
Tanaman yang Menghasilkan
Harvested Plant(Pohon/Tree)
ProduksiProduction
(ton)
Tanaman yang Menghasilkan
Harvested Plant(Pohon/Tree)
ProduksiProduction
(ton)
(1) (2) (3) (4) (5)
Aceh 10 774 177 8 891 112
Sumatera Utara 8 969 165 14 012 261
Sumatera Barat 33 812 530 35 354 569
Riau 11 114 153 8 691 92
Jambi 9 407 133 7 638 115
Sumatera Selatan 19 539 245 12 050 153
Bengkulu 5 251 159 3 815 138
Lampung 24 348 392 14 013 164
Kep. Bangka Belitung 1 436 24 1 002 15
Kepulauan Riau 315 5 2 380 27
DKI Jakarta 1 510 17 1 204 14
Jawa Barat 233 020 3 383 179 781 2 566
Jawa Tengah 156 423 2 404 104 331 1 365
DI Yogyakarta 51 663 630 21 673 213
Jawa Timur 267 353 5 195 185 350 3 249
Banten 49 947 605 36 765 404
Bali 13 718 170 2 304 25
Nusa Tenggara Barat 210 870 4 714 33 091 396
Nusa Tenggara Timur 58 278 853 35 657 372
Kalimantan Barat 11 074 141 8 570 102
Kalimantan Tengah 12 745 179 10 439 210
Kalimantan Selatan 37 890 479 30 364 350
Kalimantan Timur 15 270 199 9 229 124
Kalimatan Utara 3 241 37 738 10
Sulawesi Utara 7 549 116 5 090 109
Sulawesi Tengah 5 780 95 6 646 132
Sulawesi Selatan 49 229 1 002 33 834 568
Sulawesi Tenggara 13 367 176 14 816 140
Gorontalo 427 6 241 5
Sulawesi Barat 1 076 10 1 992 39
Maluku 4 906 88 3 818 59
Maluku Utara 2 234 43 2 173 40
Papua Barat 839 11 1 370 28
Papua 125 2 1 175 15
I N D O N E S I A 1 333 499 22 538 838 497 12 181
Produksi dan Banyaknya Tanaman Sirsak yang Menghasilkan Menurut Provinsi 2015Produc tion and Number of Harvested Plant of Soursop by Province 2015
TABELTABLE
1.21
http
://www.b
ps.g
o.id

69Statistik Tanaman Buah-Buahan dan Sayuran Tahunan Indonesia 2015
Triwulan III / Quarter III Triwulan IV / Quarter IVTotal Produksi
Total Production(ton)
Tanaman yang Menghasilkan
Harvested Plant(Pohon/Tree)
ProduksiProduction
(ton)
Tanaman yang Menghasilkan
Harvested Plant(Pohon/Tree)
ProduksiProduction
(ton)
(6) (7) (8) (9) (10)
11 113 198 6 392 105 592
13 472 249 13 852 279 954
37 042 507 35 669 507 2 113
8 276 82 9 633 105 432
5 615 81 9 005 115 444
12 371 156 12 492 215 769
5 831 72 3 992 61 430
17 271 234 16 120 242 1 032
1 039 13 1 068 14 66
219 3 467 7 42
1 252 13 1 214 29 73
149 276 1 847 170 830 3 813 11 609
142 049 1 562 140 928 2 139 7 470
19 212 219 25 550 174 1 236
174 923 2 635 191 364 3 171 14 250
32 561 351 45 396 546 1 906
3 009 30 3 214 30 255
24 708 307 38 296 496 5 913
31 971 438 36 999 545 2 208
9 219 126 13 374 148 517
10 457 126 12 977 186 701
15 683 211 23 660 357 1 397
10 114 108 10 273 111 542
655 8 878 10 65
3 745 60 5 363 105 390
4 550 62 3 215 49 338
19 855 223 24 386 292 2 085
10 288 121 12 615 127 564
256 7 233 5 23
1 891 38 1 512 33 120
2 779 27 3 396 37 211
2 183 38 2 097 38 159
1 030 31 40 1 71
0 0 18 0 17
783 915 10 183 876 518 14 092 58 994
L anjutan Tabel/Co n t i n u e d Ta b l e 1.21
http
://www.b
ps.g
o.id

70 Statistics of Annual Fruit and Vegetable Plants Indonesia 2015
P r o v i n s iP r o v i n c e
Triwulan I / Quarter I Triwulan II / Quarter II
Tanaman yang Menghasilkan
Harvested Plant(Pohon/Tree)
ProduksiProduction
(ton)
Tanaman yang Menghasilkan
Harvested Plant(Pohon/Tree)
ProduksiProduction
(ton)
(1) (2) (3) (4) (5)
Aceh 5 899 239 7 496 322
Sumatera Utara 4 800 199 5 563 304
Sumatera Barat 7 450 312 5 590 228
Riau 14 984 466 15 139 353
Jambi 18 660 1 003 6 630 309
Sumatera Selatan 21 568 667 13 922 406
Bengkulu 2 841 210 2 649 163
Lampung 48 832 1 983 27 204 832
Kep. Bangka Belitung 4 934 276 3 602 187
Kepulauan Riau 474 16 6 719 196
DKI Jakarta 3 862 76 1 732 42
Jawa Barat 195 813 7 877 91 820 4 457
Jawa Tengah 245 559 7 435 170 884 6 641
DI Yogyakarta 84 724 4 673 21 289 1 235
Jawa Timur 91 159 3 741 55 959 2 593
Banten 63 632 1 892 46 318 1 354
Bali 3 876 169 1 067 67
Nusa Tenggara Barat 5 152 255 2 921 133
Nusa Tenggara Timur 31 328 1 148 20 628 529
Kalimantan Barat 12 728 330 5 905 153
Kalimantan Tengah 10 911 250 9 121 156
Kalimantan Selatan 17 924 464 10 790 307
Kalimantan Timur 22 557 786 17 602 626
Kalimatan Utara 5 138 220 1 140 34
Sulawesi Utara 903 23 1 161 40
Sulawesi Tengah 5 017 233 3 541 127
Sulawesi Selatan 103 684 4 441 21 410 1 044
Sulawesi Tenggara 12 530 581 10 627 242
Gorontalo 18 0 23 1
Sulawesi Barat 4 323 253 4 430 122
Maluku 22 504 1 455 12 513 463
Maluku Utara 2 733 155 2 578 125
Papua Barat 6 749 135 1 216 67
Papua 310 16 1 786 66
I N D O N E S I A 1 083 576 41 979 610 975 23 924
TABELTABLE
1.22Produksi dan Banyaknya Tanaman Sukun yang Menghasilkan Menurut Provinsi 2015Produc tion and Number of Harvested Plant of Breadfruit by Province 2015
http
://www.b
ps.g
o.id

71Statistik Tanaman Buah-Buahan dan Sayuran Tahunan Indonesia 2015
Triwulan III / Quarter III Triwulan IV / Quarter IVTotal Produksi
Total Production(ton)
Tanaman yang Menghasilkan
Harvested Plant(Pohon/Tree)
ProduksiProduction
(ton)
Tanaman yang Menghasilkan
Harvested Plant(Pohon/Tree)
ProduksiProduction
(ton)
(6) (7) (8) (9) (10)
8 112 271 7 287 305 1 137
4 168 183 4 095 168 854
5 328 186 5 544 286 1 012
14 719 286 16 006 420 1 525
8 764 252 10 282 268 1 832
15 416 296 15 153 589 1 958
4 291 152 2 693 87 612
23 369 708 35 948 1 567 5 090
4 060 182 4 959 238 883
638 20 7 185 280 512
1 534 31 2 875 131 280
122 735 4 500 192 996 13 342 30 176
194 746 5 088 242 059 6 483 25 647
21 872 1 236 36 706 2 183 9 327
69 745 2 722 82 187 3 599 12 655
25 390 926 49 907 1 491 5 663
1 234 76 1 724 80 392
1 486 66 3 896 282 736
20 656 531 22 198 475 2 683
10 885 199 15 614 291 973
8 344 151 12 565 223 780
5 284 160 7 765 323 1 254
18 985 582 17 912 606 2 600
1 547 51 788 26 331
798 27 1 030 36 126
3 205 126 2 639 94 580
25 140 995 63 381 2 642 9 122
6 658 215 12 455 404 1 442
5 0 10 0 1
3 365 98 3 375 252 725
10 500 405 17 374 787 3 110
2 876 149 2 826 135 564
969 61 795 39 302
963 54 485 28 164
647 787 20 985 902 714 38 160 125 048
L anjutan Tabel/Co n t i n u e d Ta b l e 1.22
http
://www.b
ps.g
o.id

72 Statistics of Annual Fruit and Vegetable Plants Indonesia 2015
P r o v i n s iP r o v i n c e
Triwulan I / Quarter I Triwulan II / Quarter II
Tanaman yang Menghasilkan
Harvested Plant(Pohon/Tree)
ProduksiProduction
(ton)
Tanaman yang Menghasilkan
Harvested Plant(Pohon/Tree)
ProduksiProduction
(ton)
(1) (2) (3) (4) (5)
Aceh 6 822 336 7 136 253
Sumatera Utara 16 950 627 12 065 506
Sumatera Barat 49 254 1 229 33 752 1 439
Riau 31 154 1 085 30 349 390
Jambi 19 559 941 14 423 761
Sumatera Selatan 30 923 1 088 14 304 309
Bengkulu 28 002 1 014 29 446 688
Lampung 71 552 2 488 51 473 1 461
Kep. Bangka Belitung 2 744 115 526 9
Kepulauan Riau 9 043 388 1 185 33
DKI Jakarta - - - -
Jawa Barat 89 053 3 032 30 055 1 269
Jawa Tengah 64 552 1 474 26 994 437
DI Yogyakarta 653 25 22 0
Jawa Timur 1 164 25 3 179 169
Banten 92 581 1 783 34 734 1 264
Bali - - - -
Nusa Tenggara Barat - - - -
Nusa Tenggara Timur - - - -
Kalimantan Barat 20 733 478 15 006 277
Kalimantan Tengah 7 734 194 4 890 90
Kalimantan Selatan 4 232 206 1 902 89
Kalimantan Timur 12 879 550 10 865 311
Kalimatan Utara 204 3 36 1
Sulawesi Utara - - - -
Sulawesi Tengah 496 19 77 5
Sulawesi Selatan 217 4 20 1
Sulawesi Tenggara 696 11 767 23
Gorontalo 10 1 10 1
Sulawesi Barat - - - -
Maluku 152 2 2 0
Maluku Utara - - - -
Papua Barat 112 3 116 3
Papua 100 5 120 2
I N D O N E S I A 561 571 17 126 323 454 9 791
Produksi dan Banyaknya Tanaman Jengkol yang Menghasilkan Menurut Provinsi 2015Produc tion and Number of Harvested Plant of Jengkol by Province 2015
TABELTABLE
1.23
http
://www.b
ps.g
o.id

73Statistik Tanaman Buah-Buahan dan Sayuran Tahunan Indonesia 2015
Triwulan III / Quarter III Triwulan IV / Quarter IVTotal Produksi
Total Production(ton)
Tanaman yang Menghasilkan
Harvested Plant(Pohon/Tree)
ProduksiProduction
(ton)
Tanaman yang Menghasilkan
Harvested Plant(Pohon/Tree)
ProduksiProduction
(ton)
(6) (7) (8) (9) (10)
9 221 384 9 469 166 1 139
19 573 831 35 812 1 459 3 423
39 489 1 165 39 811 1 224 5 057
38 112 481 35 356 511 2 467
6 800 246 18 352 827 2 775
39 000 1 315 42 271 1 309 4 021
34 531 1 108 23 043 835 3 645
69 984 2 158 80 773 2 826 8 933
2 008 98 3 032 147 369
1 374 40 3 650 143 604
- - - - -
62 956 1 899 116 512 4 729 10 929
30 672 686 75 325 2 479 5 076
110 1 779 9 35
324 8 706 36 238
19 686 492 32 374 1 147 4 686
- - - - -
- - - - -
- - - - -
35 492 875 34 493 902 2 532
5 831 155 7 149 147 586
2 022 88 6 911 202 585
11 906 332 15 107 217 1 410
62 1 34 1 6
- - - - -
192 10 285 13 47
40 1 237 16 22
652 25 945 24 83
- - - - 2
- - - - -
- - 2 0 2
- - - - -
4 0 - - 6
120 6 - - 13
430 161 12 405 582 428 19 369 58 691
L anjutan Tabel/Co n t i n u e d Ta b l e 1.23
http
://www.b
ps.g
o.id
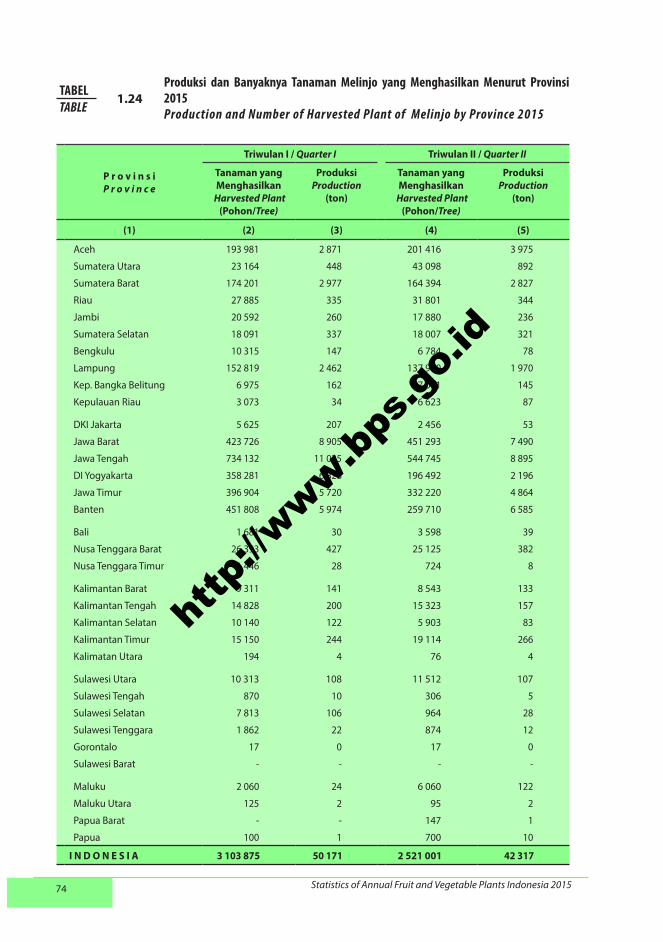
74 Statistics of Annual Fruit and Vegetable Plants Indonesia 2015
P r o v i n s iP r o v i n c e
Triwulan I / Quarter I Triwulan II / Quarter II
Tanaman yang Menghasilkan
Harvested Plant(Pohon/Tree)
ProduksiProduction
(ton)
Tanaman yang Menghasilkan
Harvested Plant(Pohon/Tree)
ProduksiProduction
(ton)
(1) (2) (3) (4) (5)
Aceh 193 981 2 871 201 416 3 975
Sumatera Utara 23 164 448 43 098 892
Sumatera Barat 174 201 2 977 164 394 2 827
Riau 27 885 335 31 801 344
Jambi 20 592 260 17 880 236
Sumatera Selatan 18 091 337 18 007 321
Bengkulu 10 315 147 6 784 78
Lampung 152 819 2 462 137 960 1 970
Kep. Bangka Belitung 6 975 162 7 041 145
Kepulauan Riau 3 073 34 6 623 87
DKI Jakarta 5 625 207 2 456 53
Jawa Barat 423 726 8 905 451 293 7 490
Jawa Tengah 734 132 11 035 544 745 8 895
DI Yogyakarta 358 281 6 828 196 492 2 196
Jawa Timur 396 904 5 720 332 220 4 864
Banten 451 808 5 974 259 710 6 585
Bali 1 681 30 3 598 39
Nusa Tenggara Barat 26 393 427 25 125 382
Nusa Tenggara Timur 1 446 28 724 8
Kalimantan Barat 9 311 141 8 543 133
Kalimantan Tengah 14 828 200 15 323 157
Kalimantan Selatan 10 140 122 5 903 83
Kalimantan Timur 15 150 244 19 114 266
Kalimatan Utara 194 4 76 4
Sulawesi Utara 10 313 108 11 512 107
Sulawesi Tengah 870 10 306 5
Sulawesi Selatan 7 813 106 964 28
Sulawesi Tenggara 1 862 22 874 12
Gorontalo 17 0 17 0
Sulawesi Barat - - - -
Maluku 2 060 24 6 060 122
Maluku Utara 125 2 95 2
Papua Barat - - 147 1
Papua 100 1 700 10
I N D O N E S I A 3 103 875 50 171 2 521 001 42 317
Produksi dan Banyaknya Tanaman Melinjo yang Menghasilkan Menurut Provinsi 2015Produc tion and Number of Harvested Plant of Melinjo by Province 2015
TABELTABLE
1.24
http
://www.b
ps.g
o.id

75Statistik Tanaman Buah-Buahan dan Sayuran Tahunan Indonesia 2015
Triwulan III / Quarter III Triwulan IV / Quarter IVTotal Produksi
Total Production(ton)
Tanaman yang Menghasilkan
Harvested Plant(Pohon/Tree)
ProduksiProduction
(ton)
Tanaman yang Menghasilkan
Harvested Plant(Pohon/Tree)
ProduksiProduction
(ton)
(6) (7) (8) (9) (10)
178 588 4 402 175 130 3 623 14 871
28 399 621 29 549 721 2 682
164 703 2 786 164 022 2 774 11 364
23 543 286 30 467 399 1 364
19 522 215 16 233 175 886
11 892 176 14 642 335 1 169
8 450 97 10 672 125 447
121 076 1 686 120 928 1 958 8 076
8 075 161 8 863 192 660
1 371 20 6 191 58 199
2 070 28 1 986 29 317
253 069 5 148 692 203 22 940 44 483
654 832 9 121 829 863 13 252 42 303
278 463 3 449 512 048 10 380 22 853
325 854 8 395 562 620 7 994 26 973
178 770 2 843 417 842 13 118 28 520
3 252 41 10 094 114 224
24 743 392 31 101 475 1 676
177 6 1 028 40 82
9 422 122 11 163 153 549
15 567 168 17 441 245 770
3 000 52 2 980 49 306
5 668 102 21 469 271 883
190 4 339 10 22
11 205 104 11 075 107 426
252 3 246 4 22
1 600 19 9 583 187 340
455 8 1 567 23 65
- - - - 0
- - - - -
4 329 73 11 966 249 468
187 3 220 4 11
100 1 - - 2
60 1 - - 12
2 338 884 40 533 3 723 531 80 004 213 025
L anjutan Tabel/Co n t i n u e d Ta b l e 1.24
http
://www.b
ps.g
o.id
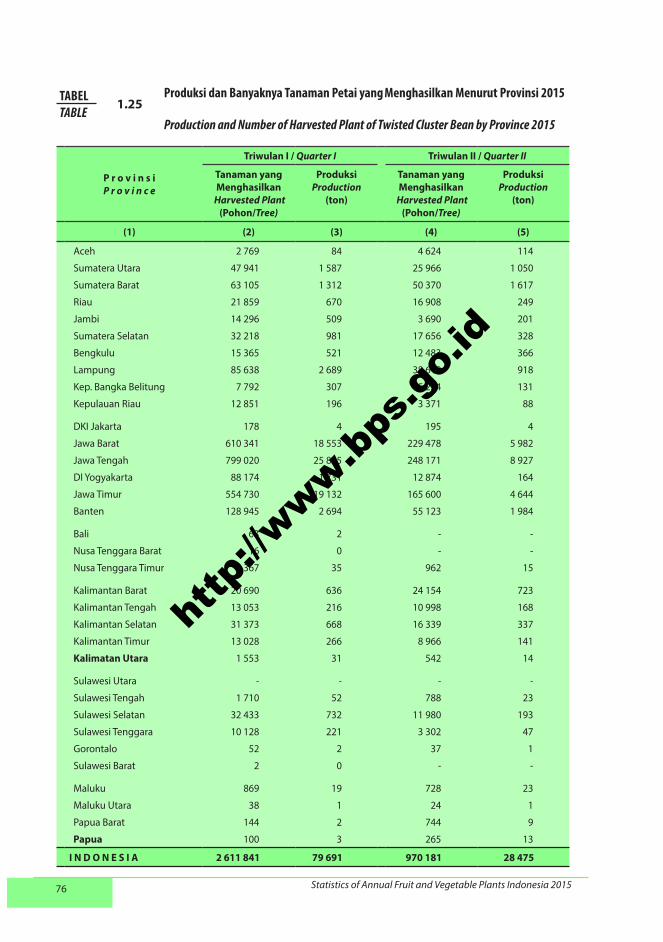
76 Statistics of Annual Fruit and Vegetable Plants Indonesia 2015
P r o v i n s iP r o v i n c e
Triwulan I / Quarter I Triwulan II / Quarter II
Tanaman yang Menghasilkan
Harvested Plant(Pohon/Tree)
ProduksiProduction
(ton)
Tanaman yang Menghasilkan
Harvested Plant(Pohon/Tree)
ProduksiProduction
(ton)
(1) (2) (3) (4) (5)
Aceh 2 769 84 4 624 114
Sumatera Utara 47 941 1 587 25 966 1 050
Sumatera Barat 63 105 1 312 50 370 1 617
Riau 21 859 670 16 908 249
Jambi 14 296 509 3 690 201
Sumatera Selatan 32 218 981 17 656 328
Bengkulu 15 365 521 12 483 366
Lampung 85 638 2 689 38 619 918
Kep. Bangka Belitung 7 792 307 5 224 131
Kepulauan Riau 12 851 196 3 371 88
DKI Jakarta 178 4 195 4
Jawa Barat 610 341 18 553 229 478 5 982
Jawa Tengah 799 020 25 835 248 171 8 927
DI Yogyakarta 88 174 1 731 12 874 164
Jawa Timur 554 730 19 132 165 600 4 644
Banten 128 945 2 694 55 123 1 984
Bali 63 2 - -
Nusa Tenggara Barat 16 0 - -
Nusa Tenggara Timur 1 367 35 962 15
Kalimantan Barat 20 690 636 24 154 723
Kalimantan Tengah 13 053 216 10 998 168
Kalimantan Selatan 31 373 668 16 339 337
Kalimantan Timur 13 028 266 8 966 141
Kalimatan Utara 1 553 31 542 14
Sulawesi Utara - - - -
Sulawesi Tengah 1 710 52 788 23
Sulawesi Selatan 32 433 732 11 980 193
Sulawesi Tenggara 10 128 221 3 302 47
Gorontalo 52 2 37 1
Sulawesi Barat 2 0 - -
Maluku 869 19 728 23
Maluku Utara 38 1 24 1
Papua Barat 144 2 744 9
Papua 100 3 265 13
I N D O N E S I A 2 611 841 79 691 970 181 28 475
TABELTABLE
1.25Produksi dan Banyaknya Tanaman Petai yang Menghasilkan Menurut Provinsi 2015
Production and Number of Harvested Plant of Twisted Cluster Bean by Province 2015
http
://www.b
ps.g
o.id
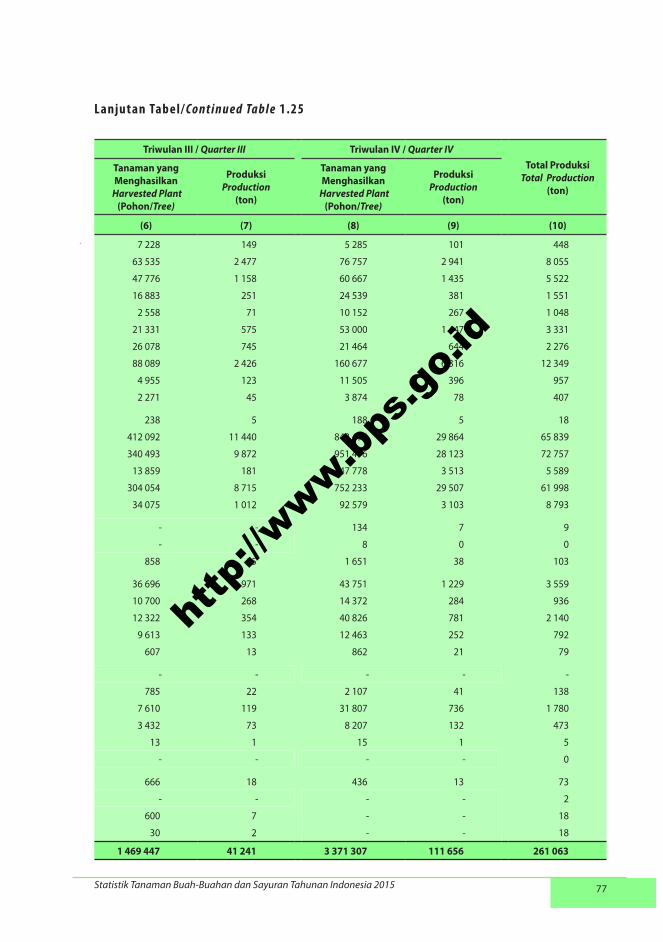
77Statistik Tanaman Buah-Buahan dan Sayuran Tahunan Indonesia 2015
Triwulan III / Quarter III Triwulan IV / Quarter IVTotal Produksi
Total Production(ton)
Tanaman yang Menghasilkan
Harvested Plant(Pohon/Tree)
ProduksiProduction
(ton)
Tanaman yang Menghasilkan
Harvested Plant(Pohon/Tree)
ProduksiProduction
(ton)
(6) (7) (8) (9) (10)
7 228 149 5 285 101 448
63 535 2 477 76 757 2 941 8 055
47 776 1 158 60 667 1 435 5 522
16 883 251 24 539 381 1 551
2 558 71 10 152 267 1 048
21 331 575 53 000 1 447 3 331
26 078 745 21 464 644 2 276
88 089 2 426 160 677 6 316 12 349
4 955 123 11 505 396 957
2 271 45 3 874 78 407
238 5 188 5 18
412 092 11 440 842 494 29 864 65 839
340 493 9 872 951 476 28 123 72 757
13 859 181 147 778 3 513 5 589
304 054 8 715 752 233 29 507 61 998
34 075 1 012 92 579 3 103 8 793
- - 134 7 9
- - 8 0 0
858 15 1 651 38 103
36 696 971 43 751 1 229 3 559
10 700 268 14 372 284 936
12 322 354 40 826 781 2 140
9 613 133 12 463 252 792
607 13 862 21 79
- - - - -
785 22 2 107 41 138
7 610 119 31 807 736 1 780
3 432 73 8 207 132 473
13 1 15 1 5
- - - - 0
666 18 436 13 73
- - - - 2
600 7 - - 18
30 2 - - 18
1 469 447 41 241 3 371 307 111 656 261 063
L anjutan Tabel/Co n t i n u e d Ta b l e 1.25
http
://www.b
ps.g
o.id
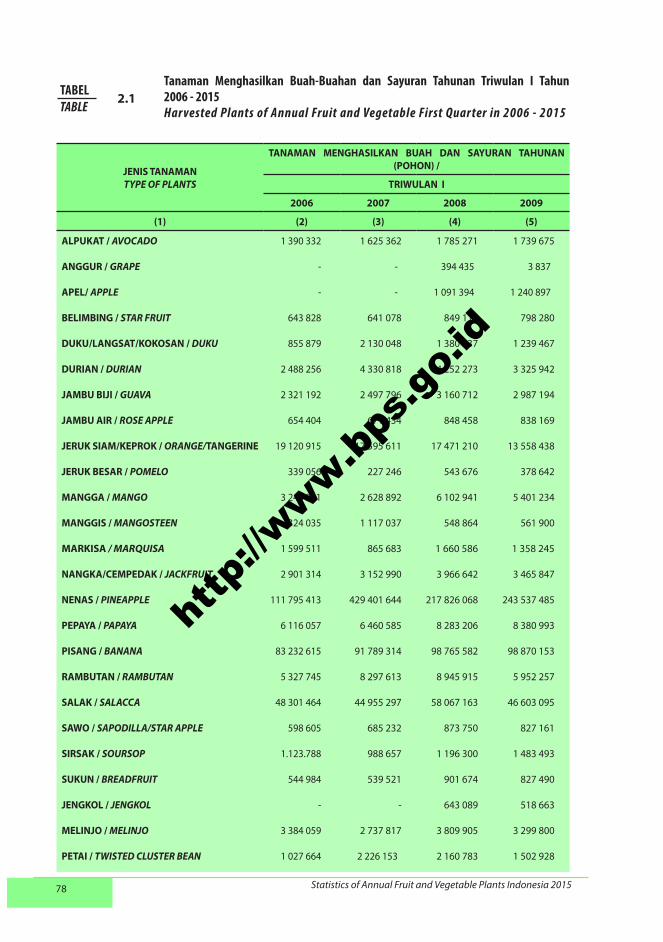
78 Statistics of Annual Fruit and Vegetable Plants Indonesia 2015
JENIS TANAMANTYPE OF PLANTS
TANAMAN MENGHASILKAN BUAH DAN SAYURAN TAHUNAN (POHON) /
TRIWULAN I
2006 2007 2008 2009
(1) (2) (3) (4) (5)
ALPUKAT / AVOCADO 1 390 332 1 625 362 1 785 271 1 739 675
ANGGUR / GRAPE - - 394 435 3 837
APEL/ APPLE - - 1 091 394 1 240 897
BELIMBING / STAR FRUIT 643 828 641 078 849 119 798 280
DUKU/LANGSAT/KOKOSAN / DUKU 855 879 2 130 048 1 380 237 1 239 467
DURIAN / DURIAN 2 488 256 4 330 818 4 252 273 3 325 942
JAMBU BIJI / GUAVA 2 321 192 2 497 796 3 160 712 2 987 194
JAMBU AIR / ROSE APPLE 654 404 671 434 848 458 838 169
JERUK SIAM/KEPROK / ORANGE/TANGERINE 19 120 915 17 595 611 17 471 210 13 558 438
JERUK BESAR / POMELO 339 056 227 246 543 676 378 642
MANGGA / MANGO 3 248 251 2 628 892 6 102 941 5 401 234
MANGGIS / MANGOSTEEN 324 035 1 117 037 548 864 561 900
MARKISA / MARQUISA 1 599 511 865 683 1 660 586 1 358 245
NANGKA/CEMPEDAK / JACKFRUIT 2 901 314 3 152 990 3 966 642 3 465 847
NENAS / PINEAPPLE 111 795 413 429 401 644 217 826 068 243 537 485
PEPAYA / PAPAYA 6 116 057 6 460 585 8 283 206 8 380 993
PISANG / BANANA 83 232 615 91 789 314 98 765 582 98 870 153
RAMBUTAN / RAMBUTAN 5 327 745 8 297 613 8 945 915 5 952 257
SALAK / SALACCA 48 301 464 44 955 297 58 067 163 46 603 095
SAWO / SAPODILLA/STAR APPLE 598 605 685 232 873 750 827 161
SIRSAK / SOURSOP 1.123.788 988 657 1 196 300 1 483 493
SUKUN / BREADFRUIT 544 984 539 521 901 674 827 490
JENGKOL / JENGKOL - - 643 089 518 663
MELINJO / MELINJO 3 384 059 2 737 817 3 809 905 3 299 800
PETAI / TWISTED CLUSTER BEAN 1 027 664 2 226 153 2 160 783 1 502 928
Tanaman Menghasilkan Buah-Buahan dan Sayuran Tahunan Triwulan I Tahun 2006 - 2015Harvested Plants of Annual Fruit and Vegetable First Quar ter in 2006 - 2015
TABELTABLE
2.1
http
://www.b
ps.g
o.id

79Statistik Tanaman Buah-Buahan dan Sayuran Tahunan Indonesia 2015
HARVESTED PLANTS OF ANNUAL FRUIT AND VEGETABLE (TREES)
QUARTER I
2010 2011 2012 2013 2014 2015
(6) (7) (8) (9) (10) (11)
1 961 201 1 800 929 1 687 484 1 964 034 2 071 458 2 435 242
198 010 140 271 189 580 158 501 201 186 157 091
2 692 512 2 776 727 2 620 952 3 041 129 2 244 726 1 597 455
772 057 817 551 900 252 852 356 846 529 789 321
2 685 308 676 780 2 795 733 2 434 859 1 990 716 2 961 782
4 142 877 2 245 628 4 527 516 5 061 857 5 444 927 7 255 856
2 906 510 2 621 389 2 845 252 2 799 433 2 679 133 2 659 235
900 112 755 818 923 144 883 274 911 968 820 910
12 432 175 13 575 832 12 557 356 12 191 442 13 070 771 11 739 563
409 080 541 993 393 509 411 912 348 584 536 206
6 501 550 4 895 839 5 878 793 5 765 281 5 923 338 5 568 364
866 041 368 118 1 621 543 1 489 809 1 265 034 2 237 711
1 598 643 1 022 878 1 516 401 1 348 173 1 429 459 1 403 813
3 798 778 3 299 054 3 844 237 3 416 585 3 931 023 4 045 889
191 533 800 226 775 385 275 999 161 219 847 853 247 018 538 278 110 772
7 946 986 8 252 852 9 753 609 10 885 543 9 478 964 9 191 282
95 829 016 86 995 379 96 332 898 92 006 359 80 503 933 88 728 150
7 135 297 2 097 822 6 129 018 7 726 621 9 339 503 10 722 932
44 191 666 43 887 511 42 600 057 56 102 076 49 339 692 44 946 620
841 961 740 748 818 369 858 630 833 594 867 018
1 416 348 1 641 575 1 339 858 1 435 516 1 395 451 1 333 499
920 982 863 443 977 054 975 122 1 037 355 1 083 576
465 172 523 907 535 306 505 414 497 347 561 571
3 994 547 3 094 301 3 201 716 3 864 483 3 687 058 3 103 875
1 988 114 1 373 073 1 980 274 2 258 269 2 512 835 2 611 841
L anjutan Tabel/Co n t i n u e d Ta b l e 2.1
http
://www.b
ps.g
o.id

80 Statistics of Annual Fruit and Vegetable Plants Indonesia 2015
JENIS TANAMANTYPE OF PLANTS
TANAMAN MENGHASILKAN BUAH DAN SAYURAN TAHUNAN (POHON) /
TRIWULAN II
2006 2007 2008 2009
(1) (2) (3) (4) (5)
ALPUKAT / AVOCADO 777 669 737 134 1 086 494 1 087 965
ANGGUR / GRAPE - - 296 230 190 871
APEL/ APPLE - - 1 857 895 1 803 531
BELIMBING / STAR FRUIT 591 498 594 493 735 444 727 261
DUKU/LANGSAT/KOKOSAN / DUKU 543 662 678 920 551 660 708 893
DURIAN / DURIAN 1 201 858 1 141 407 1 680 408 1 922 202
JAMBU BIJI / GUAVA 1 755 971 1 812 618 2 133 399 2 302 602
JAMBU AIR / ROSE APPLE 618 874 589 981 850 694 878 451
JERUK SIAM/KEPROK / ORANGE/TANGERINE 23 861 780 21 648 435 23 965 987 14 772 465
JERUK BESAR / POMELO 683 972 563 252 548 805 675 643
MANGGA / MANGO 2 247 198 2 186 242 5 470 821 6 353 304
MANGGIS / MANGOSTEEN 182 592 364 008 309 487 241 039
MARKISA / MARQUISA 1 666 588 1 678 392 1 766 419 1 021 008
NANGKA/CEMPEDAK / JACKFRUIT 2 688 922 2 395 427 3 295 265 3 328 457
NENAS / PINEAPPLE 95 618 732 414 012 716 200 304 476 244 633 527
PEPAYA / PAPAYA 7 058 236 6 181 646 8 764 642 8 772 179
PISANG / BANANA 78 440 396 83 099 709 94 189 648 112 577 851
RAMBUTAN / RAMBUTAN 1 115 563 1 289 651 2 116 539 2 500 030
SALAK / SALACCA 25 713 291 21 616 651 45 663 732 48 142 605
SAWO / SAPODILLA/STAR APPLE 586 015 697 152 772 819 837 915
SIRSAK / SOURSOP 777 987 746 517 729 771 1 507 242
SUKUN / BREADFRUIT 417 518 383 266 597 680 575 254
JENGKOL / JENGKOL - - 460 390 385 385
MELINJO / MELINJO 3 100 558 2 633 364 3 394 563 4 028 576
PETAI / TWISTED CLUSTER BEAN 543 392 765 680 801 096 810 773
Tanaman Menghasilkan Buah-Buahan dan Sayuran Tahunan Triwulan II Tahun 2006 - 2015Harvested Plants of Annual Fruit and Vegetable Second Quarter in 2006 - 2015
TABELTABLE
2.2
http
://www.b
ps.g
o.id
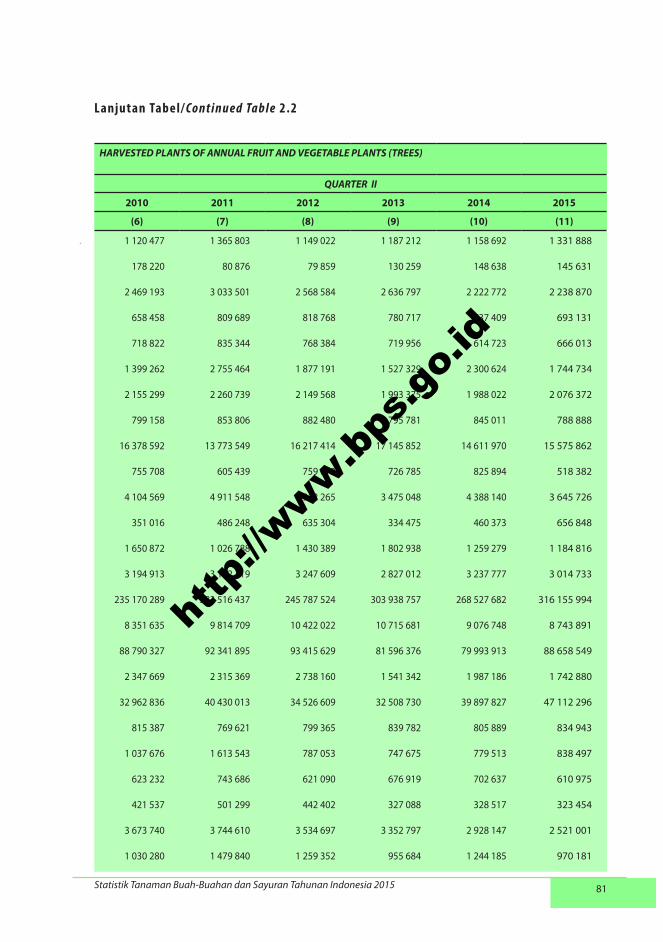
81Statistik Tanaman Buah-Buahan dan Sayuran Tahunan Indonesia 2015
HARVESTED PLANTS OF ANNUAL FRUIT AND VEGETABLE PLANTS (TREES)
QUARTER II
2010 2011 2012 2013 2014 2015
(6) (7) (8) (9) (10) (11)
1 120 477 1 365 803 1 149 022 1 187 212 1 158 692 1 331 888
178 220 80 876 79 859 130 259 148 638 145 631
2 469 193 3 033 501 2 568 584 2 636 797 2 222 772 2 238 870
658 458 809 689 818 768 780 717 737 409 693 131
718 822 835 344 768 384 719 956 614 723 666 013
1 399 262 2 755 464 1 877 191 1 527 329 2 300 624 1 744 734
2 155 299 2 260 739 2 149 568 1 993 375 1 988 022 2 076 372
799 158 853 806 882 480 795 781 845 011 788 888
16 378 592 13 773 549 16 217 414 17 145 852 14 611 970 15 575 862
755 708 605 439 759 072 726 785 825 894 518 382
4 104 569 4 911 548 4 952 265 3 475 048 4 388 140 3 645 726
351 016 486 248 635 304 334 475 460 373 656 848
1 650 872 1 026 788 1 430 389 1 802 938 1 259 279 1 184 816
3 194 913 3 192 719 3 247 609 2 827 012 3 237 777 3 014 733
235 170 289 283 516 437 245 787 524 303 938 757 268 527 682 316 155 994
8 351 635 9 814 709 10 422 022 10 715 681 9 076 748 8 743 891
88 790 327 92 341 895 93 415 629 81 596 376 79 993 913 88 658 549
2 347 669 2 315 369 2 738 160 1 541 342 1 987 186 1 742 880
32 962 836 40 430 013 34 526 609 32 508 730 39 897 827 47 112 296
815 387 769 621 799 365 839 782 805 889 834 943
1 037 676 1 613 543 787 053 747 675 779 513 838 497
623 232 743 686 621 090 676 919 702 637 610 975
421 537 501 299 442 402 327 088 328 517 323 454
3 673 740 3 744 610 3 534 697 3 352 797 2 928 147 2 521 001
1 030 280 1 479 840 1 259 352 955 684 1 244 185 970 181
L anjutan Tabel/Co n t i n u e d Ta b l e 2.2
http
://www.b
ps.g
o.id

82 Statistics of Annual Fruit and Vegetable Plants Indonesia 2015
JENIS TANAMANTYPE OF PLANTS
TANAMAN MENGHASILKAN BUAH-BUAHAN DAN SAYURAN TAHUNAN (POHON) /
TRIWULAN III
2006 2007 2008 2009
(1) (2) (3) (4) (5)
ALPUKAT / AVOCADO 822 187 654 242 1 604 958 1 165 918
ANGGUR / GRAPE - - 290 127 255 724
APEL/ APPLE - - 1 915 355 2 128 121
BELIMBING / STAR FRUIT 605 933 631 116 761 796 817 700
DUKU/LANGSAT/KOKOSAN / DUKU 530 772 414 148 617 108 617 347
DURIAN / DURIAN 1 242 377 719 313 1 743 296 2 138 523
JAMBU BIJI / GUAVA 1 878 162 1 792 516 2 231 545 2 413 383
JAMBU AIR / ROSE APPLE 921 471 787 734 1 059 899 1 069 547
JERUK SIAM/KEPROK / ORANGE/TANGERINE 18 859 343 20 748 578 17 838 821 16 900 447
JERUK BESAR / POMELO 383 793 361 109 528 420 479 341
MANGGA / MANGO 11 097 018 8 176 702 16 609 488 14 937 846
MANGGIS / MANGOSTEEN 275 715 178 988 289 280 449 016
MARKISA / MARQUISA 1 772 848 1 722 415 1 502 619 1 712 462
NANGKA/CEMPEDAK / JACKFRUIT 3 140 734 2 981 416 4 035 702 3 515 398
NENAS / PINEAPPLE 207 852 751 390 292 530 248 624 796 250 191 178
PEPAYA / PAPAYA 6 330 763 6 165 395 8 376 636 8 350 290
PISANG / BANANA 76 520 103 76 323 154 91 827 909 104 726 777
RAMBUTAN / RAMBUTAN 1 279 611 1 568 122 2 326 225 3 234 199
SALAK / SALACCA 26 416 340 30 863 918 40 413 105 48 270 754
SAWO / SAPODILLA/STAR APPLE 669 222 703 105 824 955 887 075
SIRSAK / SOURSOP 675 339 659 423 744 071 953 586
SUKUN / BREADFRUIT 389 986 605 578 781 417 686 462
JENGKOL / JENGKOL - - 494 920 540 354
MELINJO / MELINJO 2 812 555 2 969 302 3 505 415 3 361 081
PETAI / TWISTED CLUSTER BEAN 835 994 1 002 364 1 773 427 1 573 432
Tanaman Menghasilkan Buah-Buahan dan Sayuran Tahunan Triwulan III Tahun 2006 - 2015Harvested Plants of Annual Fruit and Vegetable Third Quarter in 2006 - 2015
TABELTABLE
2.3
http
://www.b
ps.g
o.id
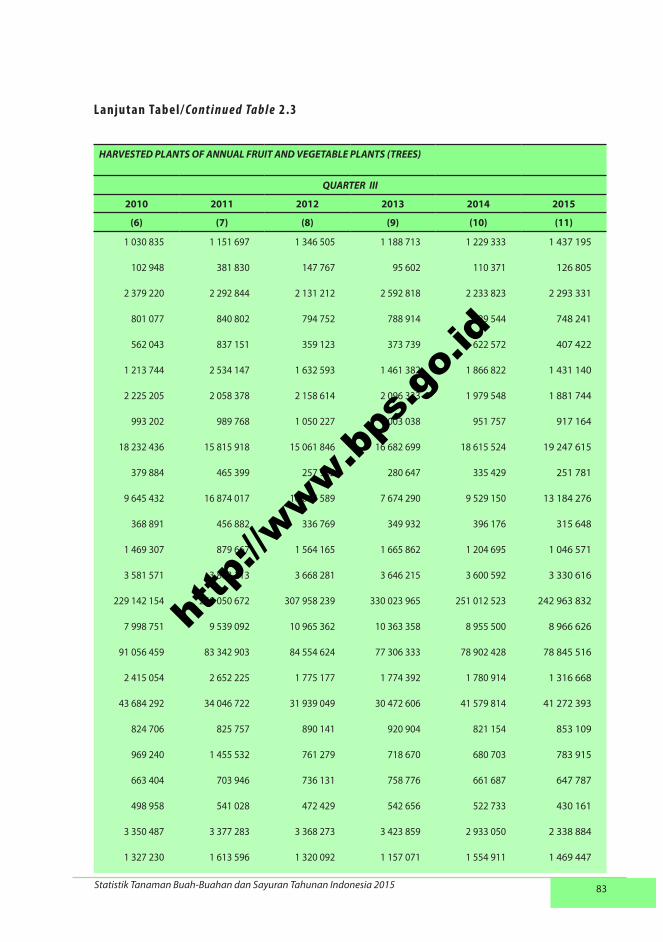
83Statistik Tanaman Buah-Buahan dan Sayuran Tahunan Indonesia 2015
HARVESTED PLANTS OF ANNUAL FRUIT AND VEGETABLE PLANTS (TREES)
QUARTER III
2010 2011 2012 2013 2014 2015
(6) (7) (8) (9) (10) (11)
1 030 835 1 151 697 1 346 505 1 188 713 1 229 333 1 437 195
102 948 381 830 147 767 95 602 110 371 126 805
2 379 220 2 292 844 2 131 212 2 592 818 2 233 823 2 293 331
801 077 840 802 794 752 788 914 829 544 748 241
562 043 837 151 359 123 373 739 622 572 407 422
1 213 744 2 534 147 1 632 593 1 461 382 1 866 822 1 431 140
2 225 205 2 058 378 2 158 614 2 096 333 1 979 548 1 881 744
993 202 989 768 1 050 227 1 003 038 951 757 917 164
18 232 436 15 815 918 15 061 846 16 682 699 18 615 524 19 247 615
379 884 465 399 257 962 280 647 335 429 251 781
9 645 432 16 874 017 16 005 589 7 674 290 9 529 150 13 184 276
368 891 456 882 336 769 349 932 396 176 315 648
1 469 307 879 667 1 564 165 1 665 862 1 204 695 1 046 571
3 581 571 3 863 213 3 668 281 3 646 215 3 600 592 3 330 616
229 142 154 259 050 672 307 958 239 330 023 965 251 012 523 242 963 832
7 998 751 9 539 092 10 965 362 10 363 358 8 955 500 8 966 626
91 056 459 83 342 903 84 554 624 77 306 333 78 902 428 78 845 516
2 415 054 2 652 225 1 775 177 1 774 392 1 780 914 1 316 668
43 684 292 34 046 722 31 939 049 30 472 606 41 579 814 41 272 393
824 706 825 757 890 141 920 904 821 154 853 109
969 240 1 455 532 761 279 718 670 680 703 783 915
663 404 703 946 736 131 758 776 661 687 647 787
498 958 541 028 472 429 542 656 522 733 430 161
3 350 487 3 377 283 3 368 273 3 423 859 2 933 050 2 338 884
1 327 230 1 613 596 1 320 092 1 157 071 1 554 911 1 469 447
L anjutan Tabel/Co n t i n u e d Ta b l e 2.3
http
://www.b
ps.g
o.id

84 Statistics of Annual Fruit and Vegetable Plants Indonesia 2015
JENIS TANAMANTYPE OF PLANTS
TANAMAN MENGHASILKAN BUAH-BUAHAN DAN SAYURAN TAHUNAN (POHON) /
TRIWULAN IV
2006 2007 2008 2009
(1) (2) (3) (4) (5)
ALPUKAT / AVOCADO 1 299 549 1 231 433 1 687 879 1 667 172
ANGGUR / GRAPE - - 353 997 177 048
APEL/ APPLE - - 2 241 827 2 517 292
BELIMBING / STAR FRUIT 715 914 632 780 698 451 786 233
DUKU/LANGSAT/KOKOSAN / DUKU 992 939 511 558 1 335 641 1 639 289
DURIAN / DURIAN 4 186 748 2 547 198 4 468 633 5 804 426
JAMBU BIJI / GUAVA 2 310 831 1 997 890 2 345 208 2 405 002
JAMBU AIR / ROSE APPLE 1 040 867 1 107 312 1 188 402 1 237 252
JERUK SIAM/KEPROK / ORANGE/TANGERINE 17 468 422 16 376 144 15 685 517 19 472 340
JERUK BESAR / POMELO 300 002 238 301 354 172 507 717
MANGGA / MANGO 19 079 048 20 304 320 16 714 310 21 273 183
MANGGIS / MANGOSTEEN 787 701 317 936 766 086 1 154 047
MARKISA / MARQUISA 1 592 561 1 590 197 1 459 627 1 503 563
NANGKA/CEMPEDAK / JACKFRUIT 4 728 997 4 729 213 4 979 188 5 542 872
NENAS / PINEAPPLE 508 639 143 431 279 781 340 052 634 267 548 491
PEPAYA / PAPAYA 6 579 732 6 696 067 8 409 165 8 207 586
PISANG / BANANA 82 945 499 86 618 510 92 535 107 106 016 795
RAMBUTAN / RAMBUTAN 7 239 244 4 085 437 8 213 224 10 078 626
SALAK / SALACCA 44 980 394 40 460 814 57 885 642 53 581 665
SAWO / SAPODILLA/STAR APPLE 782 078 757 715 825 353 965 976
SIRSAK / SOURSOP 921 747 958 211 932 116 1 185 623
SUKUN / BREADFRUIT 672 048 1 244 100 895 653 858 737
JENGKOL / JENGKOL - - 708 358 619 373
MELINJO / MELINJO 3 559 024 3 412 084 4 119 830 3 932 487
PETAI / TWISTED CLUSTER BEAN 1 949 343 2 278 420 2 333 221 2 549 881
TABELTABLE
2.4Tanaman Menghasilkan Buah-Buahan dan Sayuran Tahunan Triwulan IV Tahun 2006 - 2015Harvested Plants of Annual Fruit and Vegetable Fourth Quarter in 2006 - 2015
http
://www.b
ps.g
o.id
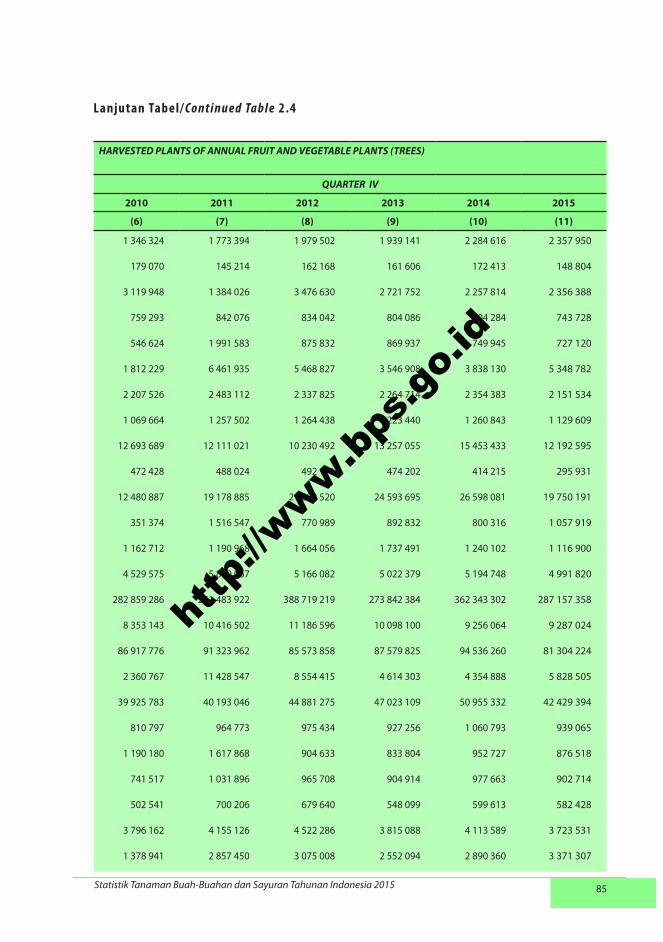
85Statistik Tanaman Buah-Buahan dan Sayuran Tahunan Indonesia 2015
HARVESTED PLANTS OF ANNUAL FRUIT AND VEGETABLE PLANTS (TREES)
QUARTER IV
2010 2011 2012 2013 2014 2015
(6) (7) (8) (9) (10) (11)
1 346 324 1 773 394 1 979 502 1 939 141 2 284 616 2 357 950
179 070 145 214 162 168 161 606 172 413 148 804
3 119 948 1 384 026 3 476 630 2 721 752 2 257 814 2 356 388
759 293 842 076 834 042 804 086 804 284 743 728
546 624 1 991 583 875 832 869 937 749 945 727 120
1 812 229 6 461 935 5 468 827 3 546 908 3 838 130 5 348 782
2 207 526 2 483 112 2 337 825 2 264 714 2 354 383 2 151 534
1 069 664 1 257 502 1 264 438 1 223 440 1 260 843 1 129 609
12 693 689 12 111 021 10 230 492 13 257 055 15 453 433 12 192 595
472 428 488 024 492 171 474 202 414 215 295 931
12 480 887 19 178 885 21 882 520 24 593 695 26 598 081 19 750 191
351 374 1 516 547 770 989 892 832 800 316 1 057 919
1 162 712 1 190 968 1 664 056 1 737 491 1 240 102 1 116 900
4 529 575 5 819 067 5 166 082 5 022 379 5 194 748 4 991 820
282 859 286 261 483 922 388 719 219 273 842 384 362 343 302 287 157 358
8 353 143 10 416 502 11 186 596 10 098 100 9 256 064 9 287 024
86 917 776 91 323 962 85 573 858 87 579 825 94 536 260 81 304 224
2 360 767 11 428 547 8 554 415 4 614 303 4 354 888 5 828 505
39 925 783 40 193 046 44 881 275 47 023 109 50 955 332 42 429 394
810 797 964 773 975 434 927 256 1 060 793 939 065
1 190 180 1 617 868 904 633 833 804 952 727 876 518
741 517 1 031 896 965 708 904 914 977 663 902 714
502 541 700 206 679 640 548 099 599 613 582 428
3 796 162 4 155 126 4 522 286 3 815 088 4 113 589 3 723 531
1 378 941 2 857 450 3 075 008 2 552 094 2 890 360 3 371 307
L anjutan Tabel/Co n t i n u e d Ta b l e 2.4
http
://www.b
ps.g
o.id

86 Statistics of Annual Fruit and Vegetable Plants Indonesia 2015
JENIS TANAMANTYPE OF PLANTS
PRODUKSI BUAH-BUAHAN DAN SAYURAN TAHUNAN (TON) /
TRIWULAN I
2006 2007 2008 2009
(1) (2) (3) (4) (5)
ALPUKAT / AVOCADO 70 109 65 165 77 064 73 979
ANGGUR / GRAPE - - 5 991 43
APEL/ APPLE - - 22 822 34 817
BELIMBING / STAR FRUIT 16 817 14 610 19 126 18 857
DUKU/LANGSAT/KOKOSAN / DUKU 41 826 104 572 56 543 61 393
DURIAN / DURIAN 183 783 288 790 247 234 201 339
JAMBU BIJI / GUAVA 54 180 50 204 65 080 68 292
JAMBU AIR / ROSE APPLE 21 813 16 230 20 573 21 920
JERUK SIAM/KEPROK / ORANGE/TANGERINE 626 928 563 866 503 173 381 903
JERUK BESAR / POMELO 14 842 12 278 16 817 18 233
MANGGA / MANGO 104 451 124 565 243 119 234 061
MANGGIS / MANGOSTEEN 13 590 70 290 22 125 26 279
MARKISA / MARQUISA 19 835 18 052 35 558 18 308
NANGKA/CEMPEDAK / JACKFRUIT 159 040 129 888 156 535 140 366
NENAS / PINEAPPLE 146 519 194.808*) 318 168 363 236
PEPAYA / PAPAYA 167 478 148 550 178 343 212 241
PISANG / BANANA 1 321 432 1 385 951 1 540 576 1 535 591
RAMBUTAN / RAMBUTAN 316 077 442 772 426 931 310 396
SALAK / SALACCA 404 093 191 259 269 961 180 469
SAWO / SAPODILLA/STAR APPLE 23 061 23 692 32 219 31 057
SIRSAK / SOURSOP 29 108 13 092 19 985 26 243
SUKUN / BREADFRUIT 21 935 18 902 30 723 30 727
JENGKOL / JENGKOL - - 22 878 15 569
MELINJO / MELINJO 56 514 46 257 58 873 52 077
PETAI / TWISTED CLUSTER BEAN 31 768 65 793 59 854 42 699
Produksi Buah-Buahan dan S ayuran Tahunan Triwulan I Tahun 2006 - 2015P ro d u c t i o n o f A n n ua l Fr u i t a n d Ve g e t a b l e Fi r s t Q ua r te r i n 2 0 0 6 - 2 0 1 5
TABELTABLE
3.1
http
://www.b
ps.g
o.id

87Statistik Tanaman Buah-Buahan dan Sayuran Tahunan Indonesia 2015
PRODUCTION OF ANNUAL FRUIT AND VEGETABLE PLANTS (TONS)
QUARTER I
2010 2011 2012 2013 2014 2015
(6) (7) (8) (9) (10) (11)
75 698 69 635 82 445 99 147 98 733 110 239
3 254 2 335 3 060 3 176 3 335 2 982
55 469 40 689 58 013 67 046 57 456 25 163
17 760 18 574 26 211 21 665 21 188 22 858
146 903 27 046 157 860 133 056 111 334 179 692
237 904 117 303 287 758 354 426 375 047 480 229
64 351 55 531 70 072 63 263 56 080 62 815
18 949 15 053 22 378 20 660 20 401 19 262
400 005 403 488 345 454 317 825 303 081 303 367
23 028 17 282 21 379 22 155 23 614 45 109
249 610 193 569 252 638 290 036 290 197 270 443
48 037 12 093 112 016 83 803 53 441 123 740
34 657 15 601 33 857 32 867 28 617 30 820
144 500 121 933 167 912 138 362 159 932 182 198
327 046 371 777 397 786 371 361 425 329 459 192
152 832 169 476 205 069 260 116 221 717 218 937
1 435 451 1 384 642 1 606 922 1 626 934 1 483 743 1 821 565
276 235 65 548 258 936 320 515 454 182 532 070
150 987 278 804 240 676 388 153 304 222 258 377
33 122 26 256 31 953 30 887 32 925 35 515
24 632 34 621 18 085 18 713 19 619 22 538
28 960 22 877 35 210 36 117 35 271 41 979
12 248 12 838 15 643 18 041 14 747 17 126
60 321 44 657 45 770 64 324 52 618 50 171
51 978 38 744 57 969 68 328 66 186 79 691
L anjutan Tabel/Co n t i n u e d Ta b l e 3.1
http
://www.b
ps.g
o.id
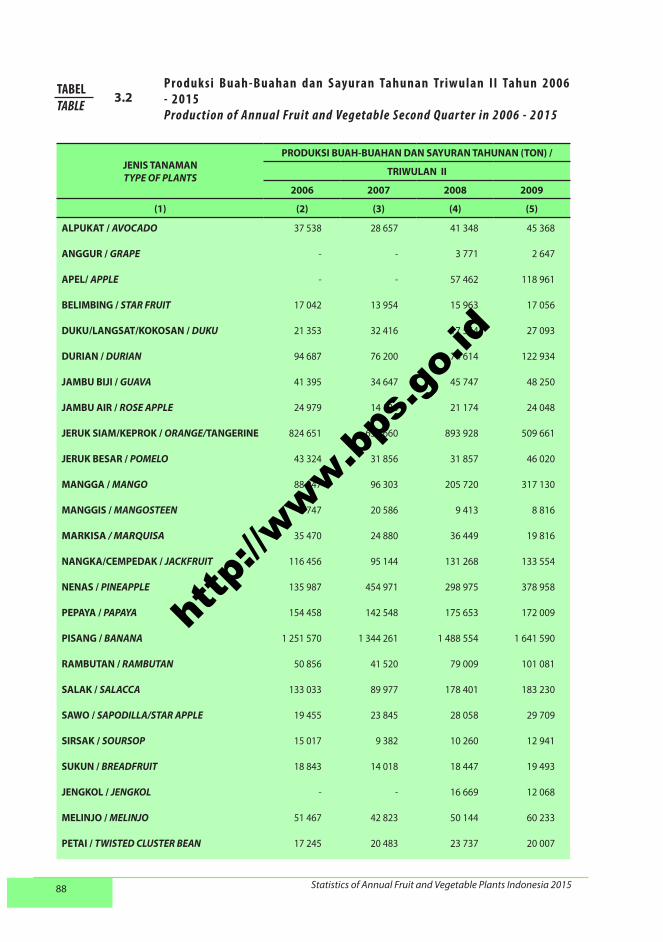
88 Statistics of Annual Fruit and Vegetable Plants Indonesia 2015
JENIS TANAMANTYPE OF PLANTS
PRODUKSI BUAH-BUAHAN DAN SAYURAN TAHUNAN (TON) /
TRIWULAN II
2006 2007 2008 2009
(1) (2) (3) (4) (5)
ALPUKAT / AVOCADO 37 538 28 657 41 348 45 368
ANGGUR / GRAPE - - 3 771 2 647
APEL/ APPLE - - 57 462 118 961
BELIMBING / STAR FRUIT 17 042 13 954 15 963 17 056
DUKU/LANGSAT/KOKOSAN / DUKU 21 353 32 416 17 564 27 093
DURIAN / DURIAN 94 687 76 200 74 614 122 934
JAMBU BIJI / GUAVA 41 395 34 647 45 747 48 250
JAMBU AIR / ROSE APPLE 24 979 14 136 21 174 24 048
JERUK SIAM/KEPROK / ORANGE/TANGERINE 824 651 634 660 893 928 509 661
JERUK BESAR / POMELO 43 324 31 856 31 857 46 020
MANGGA / MANGO 88 247 96 303 205 720 317 130
MANGGIS / MANGOSTEEN 5 747 20 586 9 413 8 816
MARKISA / MARQUISA 35 470 24 880 36 449 19 816
NANGKA/CEMPEDAK / JACKFRUIT 116 456 95 144 131 268 133 554
NENAS / PINEAPPLE 135 987 454 971 298 975 378 958
PEPAYA / PAPAYA 154 458 142 548 175 653 172 009
PISANG / BANANA 1 251 570 1 344 261 1 488 554 1 641 590
RAMBUTAN / RAMBUTAN 50 856 41 520 79 009 101 081
SALAK / SALACCA 133 033 89 977 178 401 183 230
SAWO / SAPODILLA/STAR APPLE 19 455 23 845 28 058 29 709
SIRSAK / SOURSOP 15 017 9 382 10 260 12 941
SUKUN / BREADFRUIT 18 843 14 018 18 447 19 493
JENGKOL / JENGKOL - - 16 669 12 068
MELINJO / MELINJO 51 467 42 823 50 144 60 233
PETAI / TWISTED CLUSTER BEAN 17 245 20 483 23 737 20 007
Produksi Buah-Buahan dan S ayuran Tahunan Triwulan II Tahun 2006 - 2015Produc tion of A nnual Fruit and Vegetable Second Quar ter in 2006 - 2 0 1 5
TABELTABLE
3.2
http
://www.b
ps.g
o.id

89Statistik Tanaman Buah-Buahan dan Sayuran Tahunan Indonesia 2015
PRODUCTION OF ANNUAL FRUIT AND VEGETABLE PLANTS (TONS)
QUARTER II
2010 2011 2012 2013 2014 2015
(6) (7) (8) (9) (10) (11)
51 117 64 482 55 619 52 479 50 301 66 191
2 792 1 473 1 037 2 019 2 299 2 832
43 992 40 101 57 183 40 205 61 395 63 962
14 930 17 670 22 855 19 350 18 617 22 525
32 455 31 213 38 876 45 829 27 915 35 457
62 658 151 790 113 003 84 444 131 400 101 266
45 434 48 647 46 681 38 301 39 842 47 385
18 245 19 325 22 123 16 816 18 169 19 566
570 310 381 865 482 144 416 742 437 540 440 727
33 756 24 471 45 932 41 830 67 123 30 755
142 886 187 860 223 900 159 119 209 853 179 477
11 265 19 251 26 306 12 548 17 756 20 060
38 902 34 976 31 089 37 863 25 940 30 471
121 560 116 670 120 785 106 672 126 303 133 530
355 666 424 291 391 351 619 400 448 134 472 720
171 990 244 063 229 167 201 577 206 838 213 231
1 409 483 1 602 930 1 497 024 1 428 822 1 702 644 1 942 157
79 300 73 978 82 492 46 513 70 235 60 255
157 963 256 736 237 698 179 393 242 890 314 047
28 972 27 122 30 588 30 067 29 839 29 577
11 821 12 439 11 412 11 614 11 269 12 181
17 700 21 564 19 439 19 969 20 065 23 924
11 440 15 732 12 810 11 315 8 770 9 791
53 349 54 990 50 869 50 482 42 312 42 317
23 808 43 681 32 056 29 245 34 093 28 475
L anjutan Tabel/Co n t i n u e d Ta b l e 3.2
http
://www.b
ps.g
o.id

90 Statistics of Annual Fruit and Vegetable Plants Indonesia 2015
JENIS TANAMANTYPE OF PLANTS
PRODUKSI BUAH-BUAHAN DAN SAYURAN TAHUNAN (TON) /
TRIWULAN III
2006 2007 2008 2009
(1) (2) (3) (4) (5)
ALPUKAT / AVOCADO 38 630 31 550 42 293 48 314
ANGGUR / GRAPE - - 5 100 3 729
APEL/ APPLE - - 27 739 54 384
BELIMBING / STAR FRUIT 16 240 16 829 18 509 18 199
DUKU/LANGSAT/KOKOSAN / DUKU 29 220 19 624 19 736 23 693
DURIAN / DURIAN 96 887 57 167 97 261 101 481
JAMBU BIJI / GUAVA 45 462 45 779 46 487 50 939
JAMBU AIR / ROSE APPLE 36 960 26 437 32 374 25 389
JERUK SIAM/KEPROK / ORANGE/TANGERINE 570 241 637 427 509 444 499 594
JERUK BESAR / POMELO 18 194 19 044 16 053 21 424
MANGGA / MANGO 454 245 384 349 807 765 697 522
MANGGIS / MANGOSTEEN 9 114 8 583 8 592 15 724
MARKISA / MARQUISA 25 506 27 256 31 377 44 631
NANGKA/CEMPEDAK / JACKFRUIT 137 902 144 243 160 548 153 813
NENAS / PINEAPPLE 367 795 363.242*) 361 860 371 032
PEPAYA / PAPAYA 149 844 160 602 163 471 203 367
PISANG / BANANA 1 231 444 1 238 376 1 404 334 1 559 823
RAMBUTAN / RAMBUTAN 50 851 62 288 95 025 87 921
SALAK / SALACCA 130 119 301 463 152 527 196 506
SAWO / SAPODILLA/STAR APPLE 27 140 25 228 29 612 31 261
SIRSAK / SOURSOP 13 867 13 445 9 800 11 409
SUKUN / BREADFRUIT 16 158 21 366 29 372 24 203
JENGKOL / JENGKOL - - 14 772 17 392
MELINJO / MELINJO 47 961 52 782 55 233 47 941
PETAI / TWISTED CLUSTER BEAN 29 394 24 825 56 209 44 548
Produksi Buah-Buahan dan S ayuran Tahunan Triwulan III Tahun 2006 - 2015P ro d u c t i o n o f A n n ua l Fr u i t a n d Ve g e t a b l e Th i rd Q ua r te r i n 2 0 0 6 - 2 0 1 5
TABELTABLE
3.3
http
://www.b
ps.g
o.id
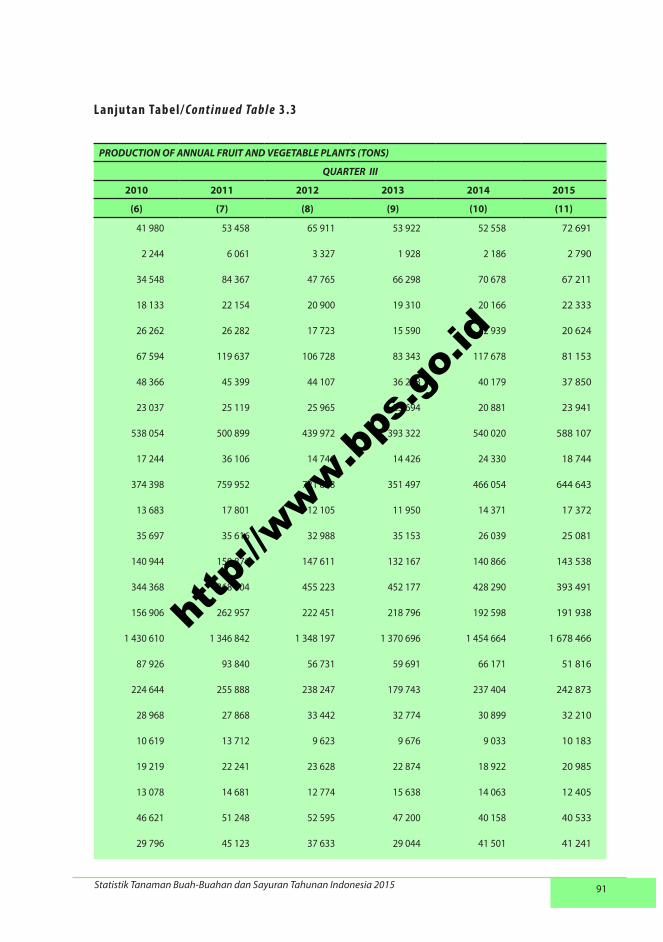
91Statistik Tanaman Buah-Buahan dan Sayuran Tahunan Indonesia 2015
PRODUCTION OF ANNUAL FRUIT AND VEGETABLE PLANTS (TONS)
QUARTER III
2010 2011 2012 2013 2014 2015
(6) (7) (8) (9) (10) (11)
41 980 53 458 65 911 53 922 52 558 72 691
2 244 6 061 3 327 1 928 2 186 2 790
34 548 84 367 47 765 66 298 70 678 67 211
18 133 22 154 20 900 19 310 20 166 22 333
26 262 26 282 17 723 15 590 32 939 20 624
67 594 119 637 106 728 83 343 117 678 81 153
48 366 45 399 44 107 36 278 40 179 37 850
23 037 25 119 25 965 23 694 20 881 23 941
538 054 500 899 439 972 393 322 540 020 588 107
17 244 36 106 14 746 14 426 24 330 18 744
374 398 759 952 721 838 351 497 466 054 644 643
13 683 17 801 12 105 11 950 14 371 17 372
35 697 35 616 32 988 35 153 26 039 25 081
140 944 150 876 147 611 132 167 140 866 143 538
344 368 368 604 455 223 452 177 428 290 393 491
156 906 262 957 222 451 218 796 192 598 191 938
1 430 610 1 346 842 1 348 197 1 370 696 1 454 664 1 678 466
87 926 93 840 56 731 59 691 66 171 51 816
224 644 255 888 238 247 179 743 237 404 242 873
28 968 27 868 33 442 32 774 30 899 32 210
10 619 13 712 9 623 9 676 9 033 10 183
19 219 22 241 23 628 22 874 18 922 20 985
13 078 14 681 12 774 15 638 14 063 12 405
46 621 51 248 52 595 47 200 40 158 40 533
29 796 45 123 37 633 29 044 41 501 41 241
L anjutan Tabel/Co n t i n u e d Ta b l e 3.3
http
://www.b
ps.g
o.id
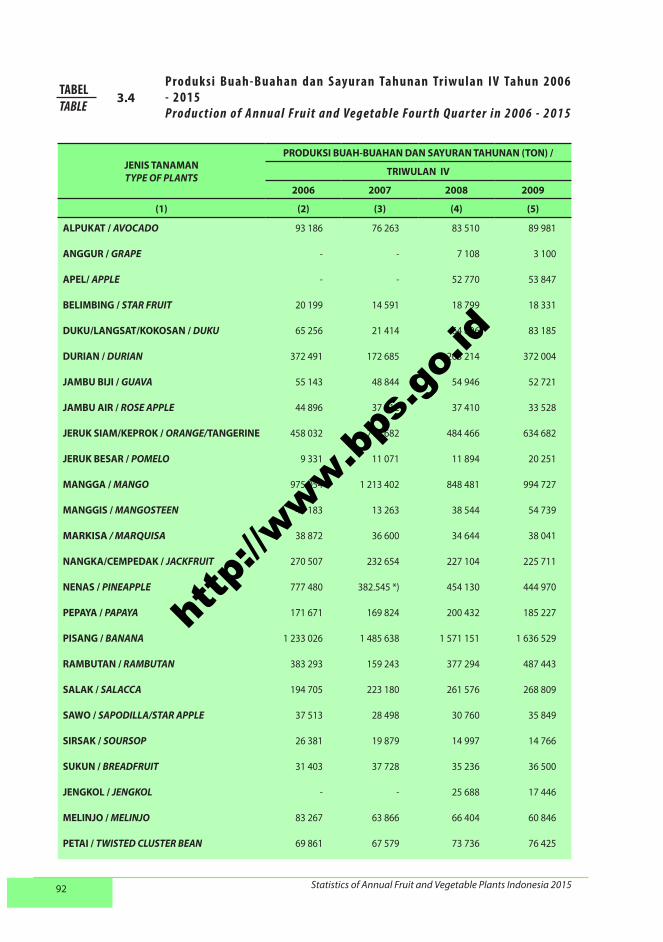
92 Statistics of Annual Fruit and Vegetable Plants Indonesia 2015
JENIS TANAMANTYPE OF PLANTS
PRODUKSI BUAH-BUAHAN DAN SAYURAN TAHUNAN (TON) /
TRIWULAN IV
2006 2007 2008 2009
(1) (2) (3) (4) (5)
ALPUKAT / AVOCADO 93 186 76 263 83 510 89 981
ANGGUR / GRAPE - - 7 108 3 100
APEL/ APPLE - - 52 770 53 847
BELIMBING / STAR FRUIT 20 199 14 591 18 799 18 331
DUKU/LANGSAT/KOKOSAN / DUKU 65 256 21 414 64 806 83 185
DURIAN / DURIAN 372 491 172 685 263 214 372 004
JAMBU BIJI / GUAVA 55 143 48 844 54 946 52 721
JAMBU AIR / ROSE APPLE 44 896 37 212 37 410 33 528
JERUK SIAM/KEPROK / ORANGE/TANGERINE 458 032 715 682 484 466 634 682
JERUK BESAR / POMELO 9 331 11 071 11 894 20 251
MANGGA / MANGO 975 054 1 213 402 848 481 994 727
MANGGIS / MANGOSTEEN 44 183 13 263 38 544 54 739
MARKISA / MARQUISA 38 872 36 600 34 644 38 041
NANGKA/CEMPEDAK / JACKFRUIT 270 507 232 654 227 104 225 711
NENAS / PINEAPPLE 777 480 382.545 *) 454 130 444 970
PEPAYA / PAPAYA 171 671 169 824 200 432 185 227
PISANG / BANANA 1 233 026 1 485 638 1 571 151 1 636 529
RAMBUTAN / RAMBUTAN 383 293 159 243 377 294 487 443
SALAK / SALACCA 194 705 223 180 261 576 268 809
SAWO / SAPODILLA/STAR APPLE 37 513 28 498 30 760 35 849
SIRSAK / SOURSOP 26 381 19 879 14 997 14 766
SUKUN / BREADFRUIT 31 403 37 728 35 236 36 500
JENGKOL / JENGKOL - - 25 688 17 446
MELINJO / MELINJO 83 267 63 866 66 404 60 846
PETAI / TWISTED CLUSTER BEAN 69 861 67 579 73 736 76 425
Produksi Buah-Buahan dan S ayuran Tahunan Triwulan IV Tahun 2006 - 2015P ro d u c t i o n o f A n n ua l Fr u i t a n d Ve g e t a b l e Fo u r t h Q ua r te r i n 2 0 0 6 - 2 0 1 5
TABELTABLE
3.4
http
://www.b
ps.g
o.id
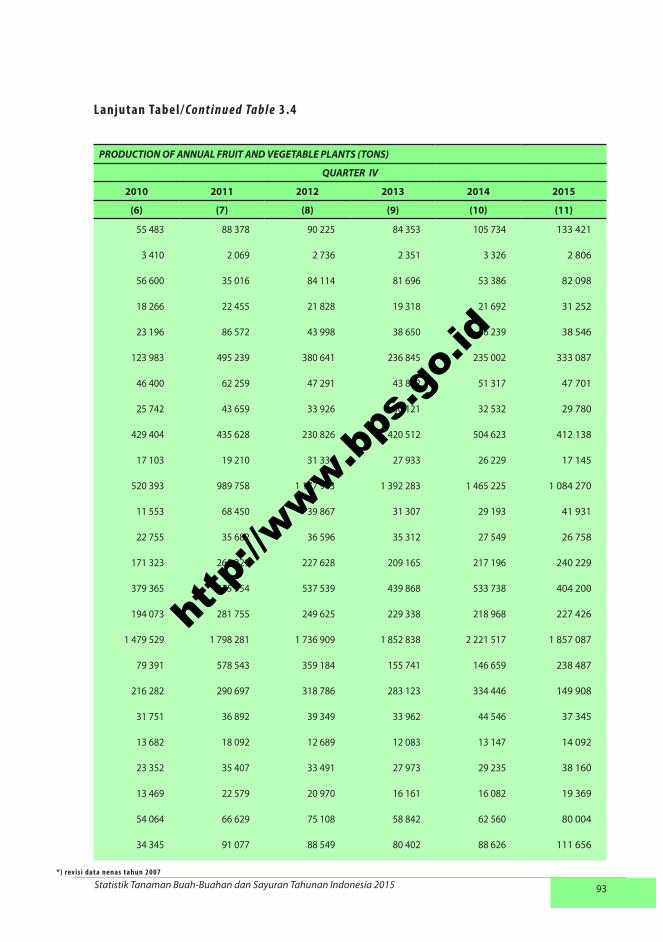
93Statistik Tanaman Buah-Buahan dan Sayuran Tahunan Indonesia 2015
PRODUCTION OF ANNUAL FRUIT AND VEGETABLE PLANTS (TONS)
QUARTER IV
2010 2011 2012 2013 2014 2015
(6) (7) (8) (9) (10) (11)
55 483 88 378 90 225 84 353 105 734 133 421
3 410 2 069 2 736 2 351 3 326 2 806
56 600 35 016 84 114 81 696 53 386 82 098
18 266 22 455 21 828 19 318 21 692 31 252
23 196 86 572 43 998 38 650 36 239 38 546
123 983 495 239 380 641 236 845 235 002 333 087
46 400 62 259 47 291 43 802 51 317 47 701
25 742 43 659 33 926 30 121 32 532 29 780
429 404 435 628 230 826 420 512 504 623 412 138
17 103 19 210 31 331 27 933 26 229 17 145
520 393 989 758 1 177 963 1 392 283 1 465 225 1 084 270
11 553 68 450 39 867 31 307 29 193 41 931
22 755 35 682 36 596 35 312 27 549 26 758
171 323 265 329 227 628 209 165 217 196 240 229
379 365 375 954 537 539 439 868 533 738 404 200
194 073 281 755 249 625 229 338 218 968 227 426
1 479 529 1 798 281 1 736 909 1 852 838 2 221 517 1 857 087
79 391 578 543 359 184 155 741 146 659 238 487
216 282 290 697 318 786 283 123 334 446 149 908
31 751 36 892 39 349 33 962 44 546 37 345
13 682 18 092 12 689 12 083 13 147 14 092
23 352 35 407 33 491 27 973 29 235 38 160
13 469 22 579 20 970 16 161 16 082 19 369
54 064 66 629 75 108 58 842 62 560 80 004
34 345 91 077 88 549 80 402 88 626 111 656
L anjutan Tabel/Co n t i n u e d Ta b l e 3.4
*) revisi data nenas tahun 2007
http
://www.b
ps.g
o.id

94 Statistics of Annual Fruit and Vegetable Plants Indonesia 2015
JENIS TANAMANTYPE OF PLANTS
PRODUKSI BUAH-BUAHAN DAN SAYURAN TAHUNAN (TON) /
TAHUN
2006 2007 2008 2009
(1) (2) (3) (4) (5)
ALPUKAT / AVOCADO 239 463 201 635 244 215 257 642
ANGGUR / GRAPE - - 21 970 9 519
APEL/ APPLE - - 160 793 262 009
BELIMBING / STAR FRUIT 70 298 59 984 72 397 72 443
DUKU/LANGSAT/KOKOSAN / DUKU 157 655 178 026 158 649 195 364
DURIAN / DURIAN 747 848 594 842 682 323 797 798
JAMBU BIJI / GUAVA 196 180 179 474 212 260 220 202
JAMBU AIR / ROSE APPLE 128 648 94 015 111 495 104 885
JERUK SIAM/KEPROK / ORANGE/TANGERINE 2 479 852 2 551 635 2 391 011 2 025 840
JERUK BESAR / POMELO 85 691 74 249 76 621 105 928
MANGGA / MANGO 1 621 997 1 818 619 2 105 085 2 243 440
MANGGIS / MANGOSTEEN 72 634 112 722 78 674 105 558
MARKISA / MARQUISA 119 683 106 788 138 027 120 796
NANGKA/CEMPEDAK / JACKFRUIT 683 904 601 929 675 455 653 444
NENAS / PINEAPPLE 1 427 781 1,395,566 *) 1 433 133 1 558 196
PEPAYA / PAPAYA 643 451 621 524 717 899 772 844
PISANG / BANANA 5 037 472 5 454 226 6 004 615 6 373 533
RAMBUTAN / RAMBUTAN 801 077 705 823 978 259 986 841
SALAK / SALACCA 861 950 805 879 862 465 829 014
SAWO / SAPODILLA/STAR APPLE 107 169 101 263 120 649 127 876
SIRSAK / SOURSOP 84 373 55 798 55 042 65 359
SUKUN / BREADFRUIT 88 339 92 014 113 778 110 923
JENGKOL / JENGKOL - - 80 007 62 475
MELINJO / MELINJO 239 209 205 728 230 654 221 097
PETAI / TWISTED CLUSTER BEAN 148 268 178 680 213 536 183 679
P r o d u k s i B u a h - B u a h a n d a n S a y u r a n Ta h u n a n Ta h u n 2 0 0 6 - 2 0 1 5P r o d u c t i o n o f A n n u a l F r u i t a n d V e g e t a b l e i n 2 0 0 6 - 2 0 1 5
TABELTABLE
3.5
http
://www.b
ps.g
o.id
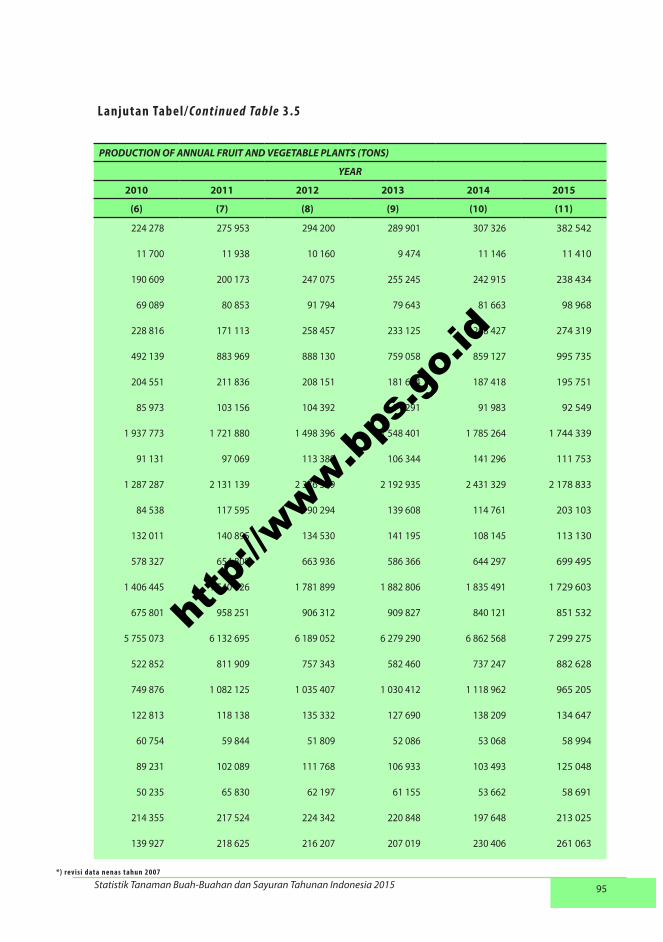
95Statistik Tanaman Buah-Buahan dan Sayuran Tahunan Indonesia 2015
PRODUCTION OF ANNUAL FRUIT AND VEGETABLE PLANTS (TONS)
YEAR
2010 2011 2012 2013 2014 2015
(6) (7) (8) (9) (10) (11)
224 278 275 953 294 200 289 901 307 326 382 542
11 700 11 938 10 160 9 474 11 146 11 410
190 609 200 173 247 075 255 245 242 915 238 434
69 089 80 853 91 794 79 643 81 663 98 968
228 816 171 113 258 457 233 125 208 427 274 319
492 139 883 969 888 130 759 058 859 127 995 735
204 551 211 836 208 151 181 644 187 418 195 751
85 973 103 156 104 392 91 291 91 983 92 549
1 937 773 1 721 880 1 498 396 1 548 401 1 785 264 1 744 339
91 131 97 069 113 388 106 344 141 296 111 753
1 287 287 2 131 139 2 376 339 2 192 935 2 431 329 2 178 833
84 538 117 595 190 294 139 608 114 761 203 103
132 011 140 895 134 530 141 195 108 145 113 130
578 327 654 808 663 936 586 366 644 297 699 495
1 406 445 1 540 626 1 781 899 1 882 806 1 835 491 1 729 603
675 801 958 251 906 312 909 827 840 121 851 532
5 755 073 6 132 695 6 189 052 6 279 290 6 862 568 7 299 275
522 852 811 909 757 343 582 460 737 247 882 628
749 876 1 082 125 1 035 407 1 030 412 1 118 962 965 205
122 813 118 138 135 332 127 690 138 209 134 647
60 754 59 844 51 809 52 086 53 068 58 994
89 231 102 089 111 768 106 933 103 493 125 048
50 235 65 830 62 197 61 155 53 662 58 691
214 355 217 524 224 342 220 848 197 648 213 025
139 927 218 625 216 207 207 019 230 406 261 063
L anjutan Tabel/Co n t i n u e d Ta b l e 3.5
*) revisi data nenas tahun 2007
http
://www.b
ps.g
o.id

96 Statistics of Annual Fruit and Vegetable Plants Indonesia 2015
http
://www.b
ps.g
o.id

97Statistik Tanaman Buah-Buahan dan Sayuran Tahunan Indonesia 2015
LAMPIRANAPPENDIX
http
://www.b
ps.g
o.id
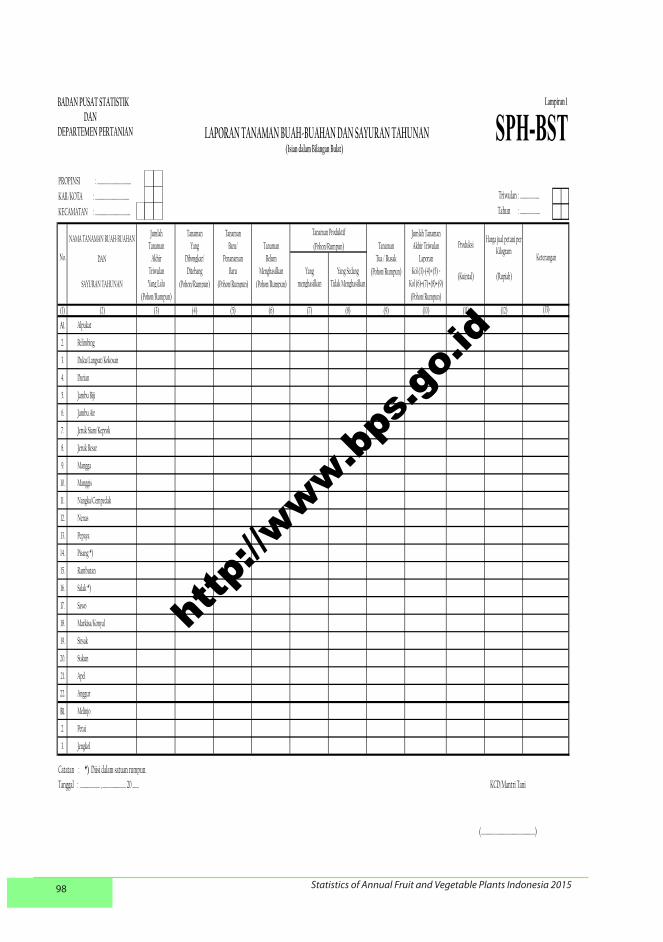
98 Statistics of Annual Fruit and Vegetable Plants Indonesia 2015
Lampiran 1
PROPINSI : …………………….….……..
KAB./KOTA : …….………………..……….
KECAMATAN : ……………..…………………
Jumlah Tanaman Tanaman Jumlah TanamanTanaman Yang Baru/ Tanaman Tanaman Akhir Triwulan
DAN Akhir Dibongkar/ Penanaman Belum Tua / Rusak LaporanTriwulan Ditebang Baru Menghasilkan Yang Yang Sedang (Pohon/Rumpun) Kol (3)-(4)+(5) =
SAYURAN TAHUNAN Yang Lalu (Pohon/Rumpun) (Pohon/Rumpun) (Pohon/Rumpun) menghasilkan Tidak Menghasilkan Kol (6)+(7)+(8)+(9)(Pohon/Rumpun) (Pohon/Rumpun)
(1) (2) (3) (4) (5) (6) (7) (8) (9) (10) (11) (12)
A1. Alpukat
2. Belimbing
3. Duku/Langsat/Kokosan
4. Durian
5. Jambu Biji
6. Jambu Air
7. Jeruk Siam/Keprok
8. Jeruk Besar
9. Mangga
10. Manggis
11. Nangka/Cempedak
12. Nenas
13. Pepaya
14. Pisang *)
15. Rambutan
16. Salak *)
17. Sawo
18. Markisa/Konyal
19. Sirsak
20. Sukun
21. Apel
22. Anggur
B1. Melinjo
2. Petai
3. Jengkol
Catatan : *) Diisi dalam satuan rumpun.
(………………………………………………....)
KCD/Mantri Tani
(Pohon/Rumpun)
Tanaman Produktif
(13)
ProduksiHarga jual petani per
Kilogram
(Rupiah)
Tanggal : ………………… , ……………………. 20 …….
LAPORAN TANAMAN BUAH-BUAHAN DAN SAYURAN TAHUNAN (Isian dalam Bilangan Bulat)
No.
NAMA TANAMAN BUAH-BUAHAN
(Kuintal)
Keterangan
Triwulan : …………………
Tahun : ………………….
SPH-BST BADAN PUSAT STATISTIK DAN DEPARTEMEN PERTANIAN
http
://www.b
ps.g
o.id
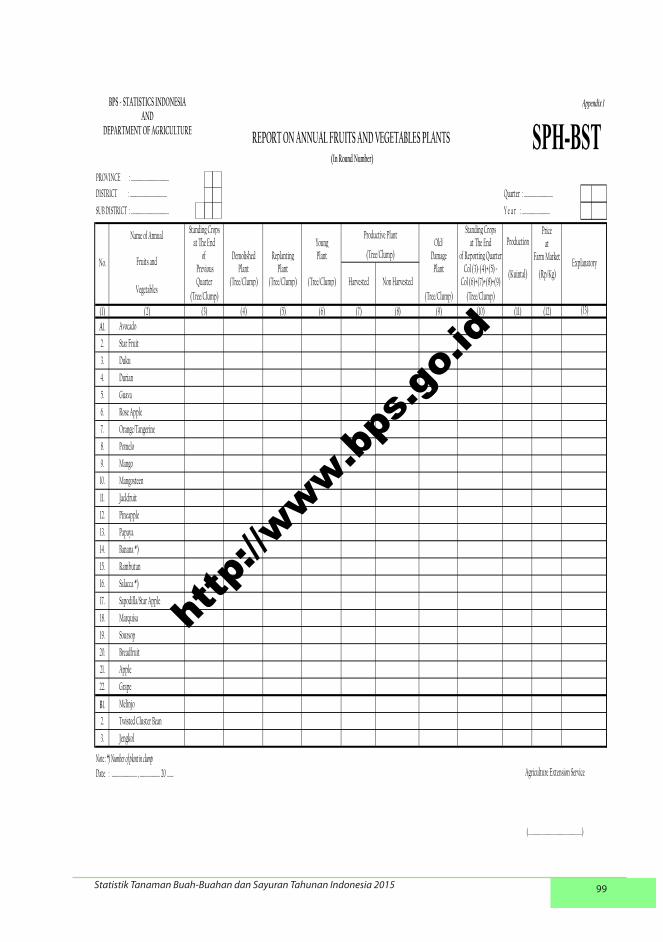
99Statistik Tanaman Buah-Buahan dan Sayuran Tahunan Indonesia 2015
Appendix 1
PROVINCE : …………………………………..
DISTRICT : …………………………………. Quarter : ….......…………......…
SUB DISTRICT : ………………………………….. Y e a r : ……………...............
Standing Crops Standing Crops Priceat The End Young Old/ at The End at
of Demolished Replanting Plant Damage of Reporting Quarter Farm Market Previous Plant Plant Plant Col (3)-(4)+(5) =Quarter (Tree/Clump) (Tree/Clump) (Tree/Clump) Harvested Non Harvested Col (6)+(7)+(8)+(9)
(Tree/Clump) (Tree/Clump) (Tree/Clump)(1) (2) (3) (4) (5) (6) (7) (8) (9) (10) (11) (12)A1. Avocado
2. Star Fruit
3. Duku
4. Durian
5. Guava
6. Rose Apple
7. Orange/Tangerine
8. Pomelo
9. Mango
10. Mangosteen
11. Jackfruit
12. Pineapple
13. Papaya
14. Banana *)
15. Rambutan
16. Salacca *)
17. Sapodilla/Star Apple
18. Marquisa
19. Soursop
20. Breadfruit
21. Apple
22. Grape
B1. Melinjo
2. Twisted Cluster Bean
3. Jengkol
Note : *) Number of plant in clumpDate : ……....…………..… , …………………. 20 …….
(In Round Number)
REPORT ON ANNUAL FRUITS AND VEGETABLES PLANTS
(Tree/Clump)
Name of Annual
No. Fruits and
Vegetables
Productive Plant
Explanatory
Production
(………………………………………………....)
Agriculture Extension Service
(Kuintal)
(13)
(Rp/Kg)
BPS - STATISTICS INDONESIA AND
DEPARTMENT OF AGRICULTURE SPH-BST
http
://www.b
ps.g
o.id
http
://www.b
ps.g
o.id
Recommended