Acc
epte
d A
rticl
eDietary composition of black drum Pogonias cromis in a hypersaline estuary reflects water
quality and prey availability
K.S. RUBIO1, M. AJEMIAN2, G.W. STUNZ3, T.A. PALMER1, B.LEBRETON4 AND J.
BESERES POLLACK1
1 Department of Life Sciences, Texas A&M University – Corpus Christi, 6300 Ocean Drive,
Corpus Christi, TX 78412-5800, U.S.A.
2 Florida Atlantic University, Harbor Branch Oceanographic Institute, Fort Pierce, FL, 34946,
U.S.A.
3 Harte Research Institute for Gulf of Mexico Studies, Texas A&M University—Corpus Christi,
6300 Ocean Drive, SL2 101 Corpus Christi, TX 78412-5869, U.S.A.
4 UMR Littoral, Environment et Societies, CNRS – University of La Rochelle, Institut du littoral
et de l’environnement, 2 rue Olympe de Gouges, 17000 La Rochelle, France
Correspondence
J. Beseres Pollack
Department of Life Sciences, Texas A&M University – Corpus Christi, 6300 Ocean Drive,
Corpus Christi, TX 78412-5800, U.S.A.
Email: [email protected]
Funding information
This article is protected by copyright. All rights reserved.
This article has been accepted for publication in the Journal of Fish Biology and undergone full peer review but has not been through the copyediting, typesetting, pagination and proofreading process, which may lead to differences between thisversion and the Version of Record. Please cite this article as doi: 10.1111/jfb.13654

Acc
epte
d A
rticl
e
2
The authors thank the organizations and agencies that helped fund this research, including the
Texas Coastal Bend Bays & Estuaries Program (CBBEP), Harvey Weil Sportsman Conservation
Award, Texas Sea Grant, and Texas A&M University-Corpus Christi.
Running headline: POGONIAS CROMIS DIET IN A HYPERSALINE ESTUARY
The Baffin Bay estuary is a hypersaline system in the Gulf of Mexico that supports an important
recreational and commercial fishery for black drum Pogonias cromis, a benthic predator.
Seasonal measurements of water quality variables, benthic macrofauna densities and biomass,
and determination of P. cromis food sources using stomach-content and stable-isotope analyses
were carried out to determine how P. cromis food sources change with water quality and how
this may affect P. cromis diet. Gut-content analysis indicated P. cromis selectively consumed
bivalves Mulinia lateralis and Anomalocardia auberiana. Isotope compositions demonstrated
that P. cromis relied on these benthic food resources produced in the Baffin Bay estuary year-
round. Biomass and densities of these bivalves were influenced by changes in water quality
variables, particularly salinity and dissolved oxygen. Thus, this paper demonstrates the
relationship between water quality variables, benthic macrofauna, and their use as food resources
by a carnivorous fish species, and emphasizes the need for integrated assessments when studying
the effects of water quality on ecosystem function. Holistic approaches such as these can provide
important information for management and conservation of fishery resources and can improve
predictions of ecosystem response to climate variability.
KEYWORDS
This article is protected by copyright. All rights reserved.

Acc
epte
d A
rticl
e
3
Baffin Bay (U.S.A.), black drum; food resources; macrofauna; salinity; stable isotopes.
This article is protected by copyright. All rights reserved.

Acc
epte
d A
rticl
e
4
1 | INTRODUCTION
Estuaries are important habitats for fishes due to high levels of primary production (Nixon, 1982)
supporting high density and diversity of prey, and providing nursery and feeding grounds for
ecologically and economically important species (Blaber & Blaber, 1980; Whitfield, 1999; Beck
et al., 2001; Levin et al., 2001). Because estuaries are located at the land–ocean interface,
anthropogenic and environmental changes affect the structure and dynamics of biotic
communities (Kennish et al., 2002; Nixon & Buckley, 2002). In particular, the availability of
individual food resources fluctuates over time and space in response to environmental changes
(Montagna & Kalke, 1992; Beseres Pollack et al., 2009), altering energy flow pathways
(Whitfield, 1986; Elliott et al., 2007). This may be especially the case for systems already
experiencing environmental stressors such as hypersalinity.
In coastal ecosystems, salinity is an important factor influencing fish abundance and
distribution (Alber, 2002; Harrison & Whitfield, 2006). The often abrupt salinity changes
common to estuaries can cause considerable physiological demands on fishes (Whitfield, 1999).
Although fishes living in estuaries are adapted to salinity fluctuations, individual response to
salinity stress varies by species and scale (Williams et al., 1990; Blaber, 1997). Low diversity
and richness of fishes in hypersaline systems has been attributed to osmoregulatory stress and
associated biotic interactions such as disappearance of particular food resources (Boltt, 1975;
Whitfield, 1999). Freshwater inflow is typically delivered in pulses governed by stochastic and
complex long-term cycles (Montagna et al., 2013). Reduced freshwater inflows increase salinity
stress and can lead to negative effects on estuarine biodiversity and productivity (Fourqurean et
al., 1993; Scavia et al., 2002; Nicholson et al., 2008). Increases in upstream water withdrawals
(Montagna et al., 2002) coupled with predicted increases in aridity (Seager et al., 2007) and
This article is protected by copyright. All rights reserved.

Acc
epte
d A
rticl
e
5
increased storminess will lead to stronger and longer periods of hypersaline conditions and more
frequent salinity disturbances (Pachauri & Meyer, 2014). Improved scientific understanding of
the response of fish to acute salinity fluctuations in hypersaline systems is critical for supporting
effective management and conservation of fishery resources (Ludwig et al., 1993).
The Baffin Bay estuary is a shallow, subtropical estuarine system on the Gulf of Mexico
coastline experiencing hypersaline conditions as a function of a semi-arid climate and high
evaporation rates (Wetz et al., 2017). Within this system, the large-bodied sciaenid black drum,
Pogonias cromis (L. 1766), supports an important recreational and commercial fishery (Ross et
al., 1983; Osburn & Matlock, 1984; Olsen, 2016). Pogonias cromis movement between Gulf of
Mexico estuaries is minimal, indicating populations are largely isolated from one another
(Osburn & Matlock, 1984; Ajemian et al., 2018) and probably rely on locally produced food
resources. Juvenile and adult P. cromis exploit a variety of benthic food resources and can use
their strong pharyngeal teeth to crush the shells of molluscs and crustaceans (Simmons & Breuer,
1962; Dugas, 1986). Gut content analyses have identified the dwarf surf clam Mulinia lateralis, a
species whose densities are highly variable over time (Breuer, 1962; Simmons & Breuer, 1962;
Montagna et al., 1993), as a primary food resource of P. cromis (Sutter et al. 1986). Changes in
water quality variables, especially salinity, can affect benthic macrofauna density, diversity and
community composition (Montagna et al., 1995), which may affect food resource availability to
this fish species.
Gut-content analysis reveals information about fish food resources at a relatively precise
taxonomic level, but provides only a snapshot of prey items recently ingested (Pinnegar &
Polunin, 1999). Differential digestion of prey may cause errors in determination of diet, as some
food resources composed primarily of soft tissues (e.g. annelids) are more rapidly digested
This article is protected by copyright. All rights reserved.

Acc
epte
d A
rticl
e
6
(Kennedy, 1969) and may be underrepresented compared with food resources with calcium
carbonate shells or chitinous pieces (Hyslop, 1980). It is also not always clear from gut-content
analysis how much a particular ingested food resource will contribute to consumer production in
relation to its assimilation rate. A complementary approach, stable-isotope analysis, can be used
to elucidate what food resources are actually ingested and assimilated (Pinnegar & Polunin,
2000; Fry et al., 2008). Isotope composition of gut contents reflects what has been ingested but
not yet assimilated. This provides information about material that cannot be identified through
standard gut-content analysis (e.g. soft tissue animals) but, like gut-content analysis, it only
provides a snapshot of what has been recently ingested. Muscle isotope composition reflects food
resources assimilated over a relatively long period due to slow tissue turn over (Vander Zanden
et al., 2015) and is thus less biased by short-term (i.e. day to day) variability (Pinnegar &
Polunin, 2000). Carbon isotope composition in particular can be useful for identifying the origin
of food resources (Fry & Sherr, 1984; Peterson & Fry, 1987) while nitrogen isotope composition
is commonly used to determine trophic levels (Post, 2002). Therefore, thse different techniques,
applied on different materials (i.e. gut content, muscle), are useful to get a more complete picture
of food resources used by consumers.
Determining relationships between water quality variables, composition of benthic
macrofauna community (i.e. fish prey) and food resources used by fish is needed to better
understand how changes in environmental conditions may affect fish populations through
cascading effects, particularly in ecosystems already under stress. Flooding caused by heavy
rains provided an opportunity to assess the response of P. cromis and benthic macrofauna to
acute salinity fluctuation in the hypersaline Baffin Bay estuary. To this end, the aims of this
paper are: to determine the food resources (i.e. benthic macrofauna) of P. cromis based on a
This article is protected by copyright. All rights reserved.
Acc
epte
d A
rticl
e
7
combination of gut-content and stable-isotope analyses, to define how densities and biomass of
P. cromis food resources change on a temporal and spatial basis when water quality variables are
modified and to assess if these changes affect use of food resources by fish.
2 | MATERIALS AND METHODS
2.1 | Study site
The Baffin Bay estuary is adjacent to the western edge of the upper Laguna Madre on the Texas
Gulf of Mexico, U.S.A. (Figure1). This 248 km2 subtropical estuary comprises a secondary bay:
Baffin Bay and three tertiary bays: Alazan Bay, Cayo del Grullo and Laguna Salada (Figure 1).
Freshwater inflow occurs sporadically via several ephemeral streams. Long residence times (> 1
year), minimal freshwater inflow and high evaporation rates create a system that is prone to
hypersaline conditions (Armstrong, 1987; Buskey et al., 1998; Tunnell and Judd, 2002; Wetz et
al., 2017).
2.2 | Water quality, benthic macrofauna and sediment organic matter
Ten stations throughout the Baffin Bay estuary were sampled seasonally for water quality,
benthic macrofauna and surface sediment organic matter (SSOM) from March 2014 to March
2015 (Figure 1). Four additional stations (CG3, AL6, AL7, AL9) were sampled from September
2014 to March 2015 to increase spatial coverage. Stations were characterized by muddy
sediments and absence of macrophytes. Water quality measurements [temperature, dissolved
This article is protected by copyright. All rights reserved.
Acc
epte
d A
rticl
e
8
oxygen (DO), pH, turbidity, salinity, Secchi depth] were collected during the day at each station,
each season, at the surface and bottom of the water column using a multi-variable monitoring
instrument (Hydrolab Surveyor II; OTT-Hydromet; www.ott.com or YSI 6 series; YSI-Xylem;
www.ysi.com) and a Secchi disc.
Benthic macrofauna were sampled using 35.4 cm2 cylindrical cores to a depth of 10 cm.
Five replicate cores were collected from each station, each season: three for community
composition and two for stable-isotope measurements. Community composition samples were
immediately preserved with 10% buffered formalin for 48 hours and then preserved in 70%
ethanol. Macrofauna were extracted on a 500 µm sieve in the laboratory, sorted using a
dissecting microscope, identified to the lowest possible taxonomic level (usually species) and
enumerated. Species names were verified using Tunnell et al., (2010) and WoRMS Editorial
Board, (2017). Biomass measurements were obtained after grouping species into higher
taxonomic levels (Cnidaria, Polychaeta, Gastropoda, Bivalvia, Crustacea) and drying at 55° C for
24–48 h until reaching a constant mass. Mollusc shells were removed with 10% HCl prior to
drying and weighing.
Cores for stable-isotope analyses were sieved on a 500 µm-mesh screen in the field and
macrofauna were transported live to the laboratory in coolers. Macrofauna for stable-isotope
analyses were kept separately in artificial seawater for 24–48 h to evacuate gut contents before
being stored at –20° C.
SSOM was collected using 35.4 cm2 cylindrical cores. The top 3 cm of sediment were
collected and immediately placed on ice. In the laboratory, samples were sieved on a 500 μm-
mesh screen to remove macrofauna, shell hash and large detrital particles and then freeze-dried
and ground using a mortar and pestle.
This article is protected by copyright. All rights reserved.

Acc
epte
d A
rticl
e
9
2.3 | Pogonias cromis muscle and gut contents
Pogonias cromis were collected throughout the Baffin Bay estuary over five seasons (winter,
spring, summer, autumn 2014, winter 2015) as part of the Texas Parks and Wildlife Department
fisheries-independent sampling programme (Martinez-Andrade et al., 2005) (Figure 1). Fish
were collected using gill nets [183 m long x 1.2 m deep with 46 m sections of 7.6, 10.2, 12.7 and
15.2 cm stretch mesh (Matlock & Weaver, 1979)] set perpendicular to the shoreline and
immediately placed on ice in the field. In the laboratory, epaxial muscle tissue (n = 5–14
individuals per season) was removed from the anterior portion of all P. cromis specimens for
stable-isotope analysis and frozen at –20° C. No muscle sample was collected for stable-isotope
measurements in autumn 2014.
Whole digestive tracts (guts) of P. cromis were removed beginning with the oesophagus
and ending with the anal vent. Five non-empty digestive tracts per sampling month (P. cromis
200–400 mm total length) were selected for stable-isotope analyses and frozen at –20° C before
further processing. Digestive tracts for stable-isotope analyses were thawed and gut-content
items larger than 500 µm were identified to the lowest possible taxonomic level, enumerated and
weighed. Highly digested organic material (< 500 µm) was weighed and then centrifuged. The
remaining digestive tracts (if more than five fish were collected) were fixed in 10% buffered
formalin for 48 h and then preserved in 70% ethanol for quantifying the abundance and biomass
of macrofauna in the gut. Macrofauna were extracted on a 500 µm sieve, sorted using a
dissecting microscope, identified to the lowest possible taxonomic level and enumerated.
Biomass measurements were obtained after grouping species into higher taxa levels (Polychaeta,
Gastropoda, Bivalvia, Crustacea), drying at 55° C for 24–48 h and then weighing. Fish handling
methods followed a university-approved animal use protocol (AUP #09-14, Texas A&M
This article is protected by copyright. All rights reserved.

Acc
epte
d A
rticl
e
10
University-Corpus Christi).
2.4 | Stable-isotope composition measurements
Macrofauna from sediment samples and gut contents collected for stable-isotope analyses were
freeze-dried and ground to a homogenous powder using a ball mill (MM 400, Retsch;
www.retsch.com). SSOM samples and soft tissues from shelled organisms occurring in
sediments and guts were decarbonated with 1 mol l–1 HCl before δ13C measurements. Samples
were then dried at 60° C using a dry block heater under air flow. Dried samples were re-
homogenized into ultrapure water using an ultrasonic bath, freeze-dried and ground again. δ15N
measurements on all samples were carried out on non-acidified samples.
Isotope composition was determined for benthic macrofauna, SSOM, P. cromis muscle
and gut content samples using an elemental analyzer (ECS 4010 with a Zero Blank autosampler,
Costech; www.costechanalytical.com) connected to a continuous-flow isotope-ratio mass
spectrometer (Delta V Plus, Thermo Scientific; www.thermofisher.com) via a Conflo IV
interface. Analyses were conducted at the stable-isotope facility at Texas A&M University-
Corpus Christi. Carbon and nitrogen isotope compositions are expressed in δ-notation in parts
per thousand (‰) as deviation from international standards (Vienna Pee Dee Belemnite for δ13C
and N2 in air for δ15N) and following the formula: δx‰ = [(RsampleR–1standard) – 1]103, where x is
13C or 15N and R is 13C:12C or 15N:14N, respectively. Two-point calibration was done using
international reference materials (USGS-40: δ15N = –4.52‰; δ13C = –26.39‰ and USGS-41:
δ15N = 47.57‰; δ13C = 37.63‰) (Paul et al., 2007). Laboratory standards [Acetanilide (gold
nanoparticles, GNPs) and rice (SIGF standards)] were analyzed after every 12 samples to
This article is protected by copyright. All rights reserved.
Acc
epte
d A
rticl
e
11
monitor instrument performance and check data normalization. The precision of the laboratory
standards was ± 0.2‰ for carbon and nitrogen.
2.5 | Data analysis
Principal component analysis (PCA) was used to determine spatio-temporal patterns in water
quality. Variables were first log-transformed and then standardized. Another multivariate
approach, non-metric multidimensional scaling (nMDS) was used to determine patterns in both
macrofauna community composition and gut content composition (Clarke & Warwick, 1994).
nMDS analyses were carried out using a Bray-Curtis similarity matrix on square-root
transformed data. Differences in macrofauna composition of the gut content compositions among
seasons and bays were tested with two-way crossed analyses of similarities (ANOSIM) with bay
and season as factors (Supporting Information Tables S1, S2). ANOSIM tests were run using two
separate times, each using different data because of the uneven sampling pattern (Table 1): fish
from Alazan and Baffin Bays over the four sampling seasons in 2014 (winter, spring, summer,
autumn) and fish collected throughout the entire Baffin Bay estuary in spring and fall 2014.
Spring and fall 2014 were the only seasons where all bays within the Baffin Bay estuary were
sampled contiguously for fish. Neither ANOSIM included fish collected in winter 2015 because
fish were only collected in Baffin Bay during this season. A 3-way ANOSIM (P. cromis Size
class x Bay x Season) showed no significant difference in gut composition among size classes (P
> 0.05; total length, LT size classes < 300, 300–450, > 450 mm). Prey are usually < 5 mm in
length, whereas the range of fish sizes analyzed had LT 166–622 mm; there is no reasonable
assumption that the prey ingested in this system are limited by gape size.
Relationships among water quality variables and macrofauna community composition
This article is protected by copyright. All rights reserved.

Acc
epte
d A
rticl
e
12
were determined using BIO-ENV (Clarke & Ainsworth, 1993; Supporting Information Table
S3). Spearman rank correlations were calculated to characterize the relationships between
individual water quality variables and benthic macrofauna abundance, biomass and Hill’s N1
diversity (Hill, 1973; Sanders, 1968). Partial correlations were used to take into account
simultaneous changes in other water quality variables when running correlations (e.g. salinity
was correlated with macrofauna metrics using partial correlations with temperature and DO). All
univariate metrics and correlations were calculated using SAS 9.3 software (SAS Institute Inc.;
www.sas.com). All multivariate statistics were calculated using PRIMER 6 software (Clarke &
Gorley, 2006).
Comparisons between isotope compositions were conducted using parametric procedures
(Student’s t-test) when conditions of normality (Shapiro-Wilk test) and equality of variances (F-
test) were respected. Non-parametric procedures (Wilcoxon and Kruskal–Wallis tests) were used
when one of these conditions was not respected (Zar, 2010).
Gut contents were described using four metrics. The percent frequency of occurrence (%F)
was calculated as: %F = 100SaS–1, where Sa is the number of guts containing prey item a and S is
the total number of non-empty guts examined (Hyslop, 1980). Prey selection was assessed using
the Strauss Index (LSI) ( ; Strauss, 1979): = + , where ra is the relative abundance of
prey type a in the diet (as a proportion of the total number of prey in the diet) and pa is the
relative abundance of prey type a in the environment (from benthic core data). Values range
from –1 to +1, with positive values representing preference and negative values representing
avoidance or inaccessibility. Percent mass of total identifiable contents (%M) and percentage of
empty guts (vacuity index) were also calculated.
This article is protected by copyright. All rights reserved.

Acc
epte
d A
rticl
e
13
3 | RESULTS
3.1 | Water quality
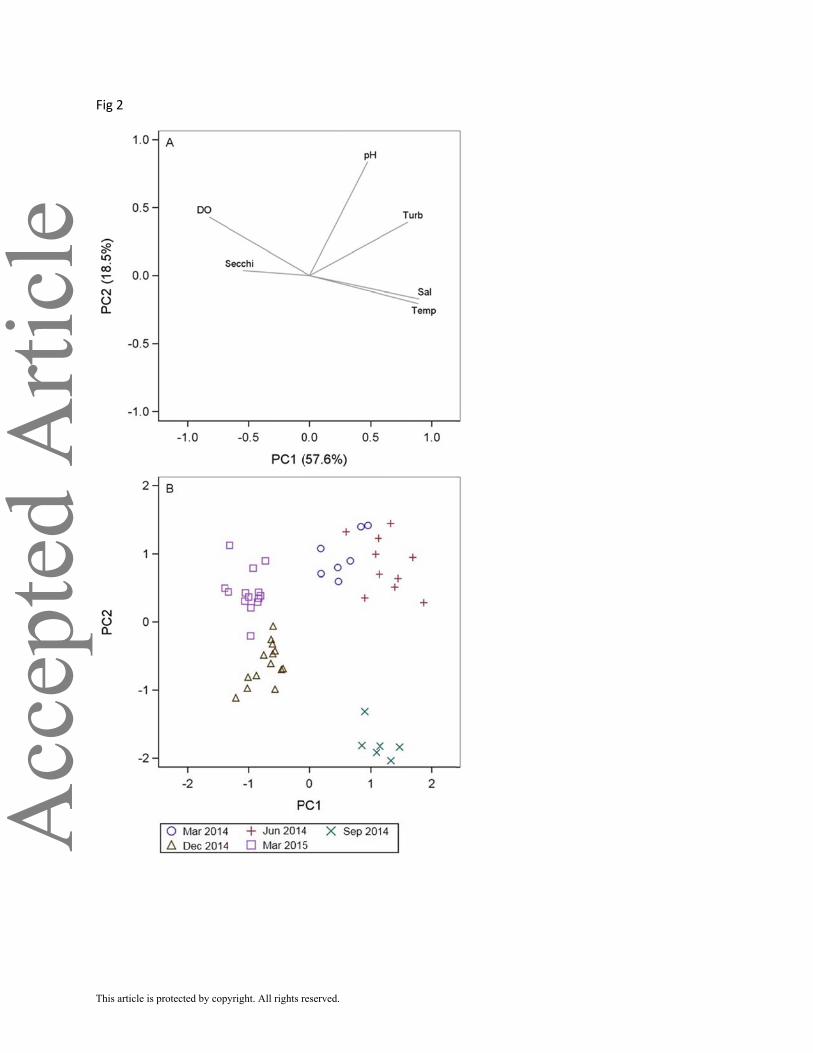
Comparisons of all water quality variables over space and time were achieved simultaneously
using the first two components of the PCA (Figure 2). Principal components 1 and 2 accounted
for 57.6% and 18.5% of the variation in the data. Water quality separated into two main groups
along PC 1. Water quality among all samples varied more by sampling date than by location.
This resulted in two periods of distinct water quality conditions in the Baffin Bay estuary: first,
March, June and September 2014 had higher salinity, temperature and turbidity and lower DO;
second, December 2014 and March 2015 had lower salinity, temperature and turbidity and
higher DO.
Mean salinity of the Baffin Bay estuary ranged from 49.2 in March to 53.6 in September
2014 and decreased to 44.8 in December 2014 and 40.9 in March 2015 [Figure 3(a)]. A reverse
salinity gradient, where salinity increases upstream, occurred in all months sampled except in
March 2014 and March 2015. The mean salinity in Baffin Bay was 2.2–4.1 lower than in the
tertiary bays in March, June and September 2014 and 0.4–2.1 lower in December 2014 and
March 2015.
Mean temperature of the Baffin Bay estuary varied seasonally from 15.9° C in December
2014 to 30.0° C in June and September 2014 [Figure 3(b)]. Mean DO concentrations were lowest
in September 2014 (5.2 mg l–1) and highest in March 2015 [8.8 mg l–1, Figure 3(c)].
3.2 | Benthic macrofauna
This article is protected by copyright. All rights reserved.

Acc
epte
d A
rticl
e
14
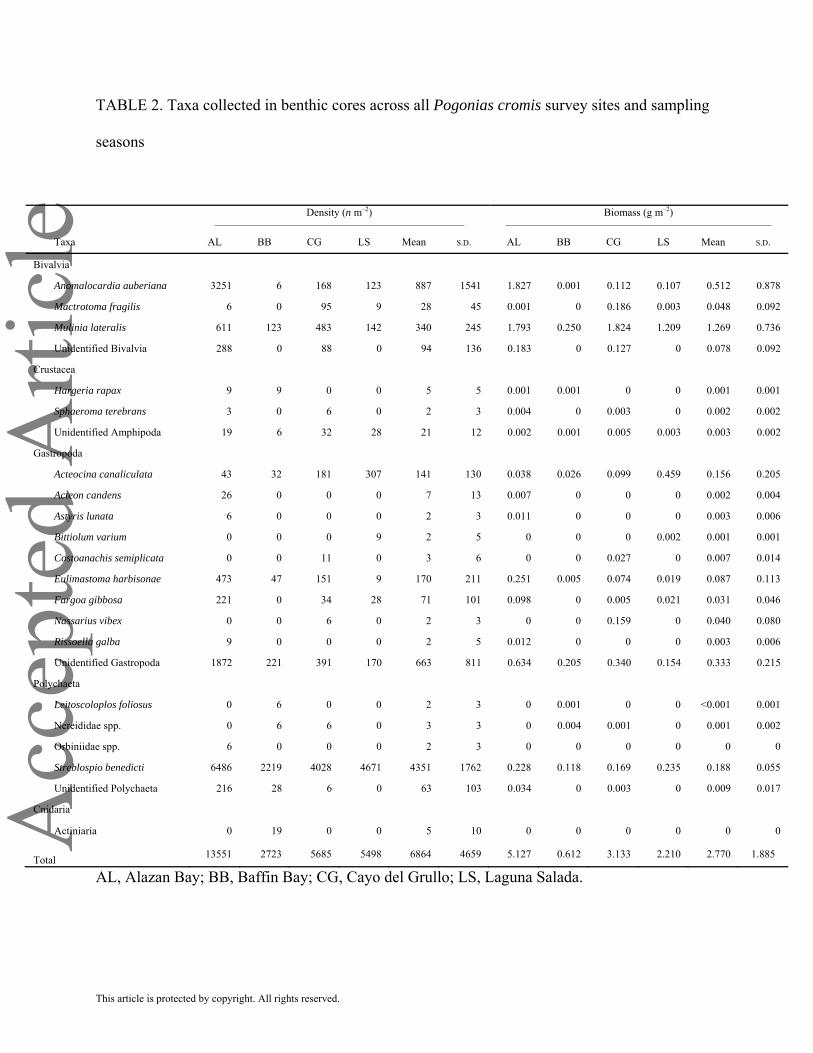
Polychaete worms dominated macrofauna densities, in particular Streblospio benedicti, ranging
from 2219 n m–2 in Baffin Bay to 6486 n m–2 in Alazan Bay (Figure 4 and Table 2). Other
abundant species included the bivalves Anomalocardia auberiana and Mulinia lateralis and
unidentified gastropods. Macrofauna biomass was dominated by the bivalves Mulinia lateralis
(from 0.25 g m–2 in Baffin Bay to 1.82 g m–2 in Cayo del Grullo), Anomalocardia auberiana
(from <0.01 g m–2 in Baffin Bay to 1.83 g m–2 in Alazan Bay) and unidentified gastropods (from
0.15 g m–2 in Laguna Salada to 0.63 g m–2 in Alazan Bay). Streblospio benedicti dominated
polychaete biomass, ranging from 0.12 g m–2 in Baffin Bay to 0.24 g m–2 in Laguna Salada
(Figure 4 and Table 2).
Mean macrofauna density was highest in March 2014 (8046 n m–2) and lowest in March
2015 (2583 n m–2). Mean biomass was lowest in March 2014 (0.9 g m–2) and highest in June
2014 (3.0 g m–2). Increasing salinity led to increasing Hill’s N1 diversity (rs = 0.28, P < 0.05)
and increasing DO concentrations led to increasing macrofauna biomass, Hill’s N1 diversity and
species richness (rs = 0.34, P < 0.05; rs = 0.38, P < 0.01; rs = 0.39, P < 0.01, respectively).
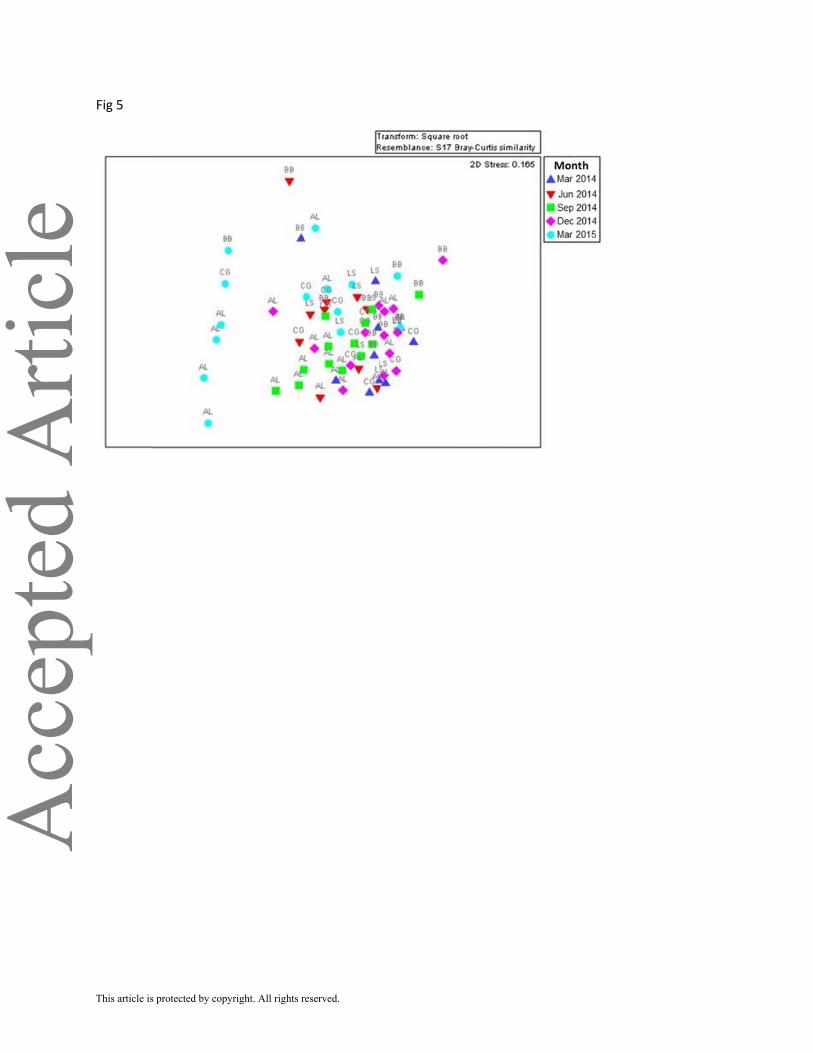
Salinity was the main water quality variable influencing macrofauna community composition (rs
= 0.193, P < 0.05), above any other single or combination of water quality variables (as
calculated using the BIO-ENV procedure). At higher salinities, the macrofauna community had
greater contributions of Streblospio benedicti and Acteocina canaliculata. The combination of
salinity and DO concentration was the next strongest contributor to changes in macrofauna
community composition (rs = 0.185, P < 0.01). Macrofauna community composition in a number
of samples from March 2015 differed from the rest of the dates, due to high relative densities of
the bivalves Mulinia lateralis and Anomalocardia auberiana (Figure 5).
This article is protected by copyright. All rights reserved.

Acc
epte
d A
rticl
e
15
3.3 | Gut content analysis
Of the 262 P. cromis collected within the Baffin Bay estuary between December 2013 and
February 2015, 84% of fish (mean ± S.D. LT = 335 ± 92 mm) contained stomach contents (Table
1). There was an overall decrease in vacuity indices throughout the Baffin Bay estuary over time,
from 54.9% in winter 2014 to 2.3% in autumn 2014 and 0.0% in winter 2015. Seven different
major taxa groups were identified in the guts (Table 3). Bivalves were the most frequently
occurring prey group in the gut contents (in 70% of guts). Bivalves also dominated the gut
biomass (64%). Unidentified bivalves were present in 68% of guts and contributed to 61% of gut
mass. The most conspicuous and common bivalve from the gut contents was Anomalocardia
auberiana (in 32% of guts, 2.2% of gut mass), followed by Mulinia lateralis (in 11% of guts,
0.5% of gut mass). Polychaetes were the next most frequently encountered and heaviest gut
content taxa (in 51% of guts, 17% of gut mass), followed by seagrass (in 26% of guts, 8% of gut
mass). Crustaceans and gastropods were each observed in 6% of guts and made up 2.4% and 0%
of gut biomass, respectively.
Bivalves were the only positively selected prey group throughout the Baffin Bay estuary,
with mean LSI ranging from 0.35 in Baffin Bay to 0.54 in Laguna Salada. Crustaceans were
neither positively selected nor negatively selected (–0.02 < LSI < 0.05). Polychaetes were the
least selected taxa (–0.49 < LSI < –0.22) in all bays except Cayo del Grullo, where gastropods
were least selected (LSI = –0.41). Seagrass did not occur in any benthic samples so could not be
included in the analysis of prey selectivity. Some molluscs inside gut tracts could not be easily
differentiated between gastropod and bivalve groups so were also not used in prey selectivity
analyses. Fish, seagrass and unidentified molluscs composed up to 2.8%, 26% and 7% of total
This article is protected by copyright. All rights reserved.

Acc
epte
d A
rticl
e
16
gut contents for each season-bay combination (5.5%, 35% and 38% of identifiable contents;
minimum of 0%).
Multivariate analyses (ANOSIM, nMDS) indicate that the gut taxa composition was
significantly different among bays (0.1 ≤ ANOSIM R ≤ 0.8, P < 0.05) except for spring 2014 and
fall 2014 (ANOSIM R = 0.04, P > 0.05). Gut contents in Baffin Bay were significantly different
to those in Laguna Salada (ANOSIM R = 0.43, P < 0.001) and Alazan Bay (ANOSIM R = 0.09,
P < 0.05). Gut contents in all other bays were not significantly different from each other (–0.1 ≤
ANOSIM R ≤ 0.2, P > 0.05). Differences in proportional biomass of unidentified bivalves caused
the highest dissimilarity among seasons, with biomass highest in summer 2014 and lowest in
winter 2014. The proportions of higher taxa in the guts were dissimilar from those in the
sediment cores, with the guts containing relatively more bivalves and fewer polychaetes and
gastropods.
3.4 | Stable-isotope composition
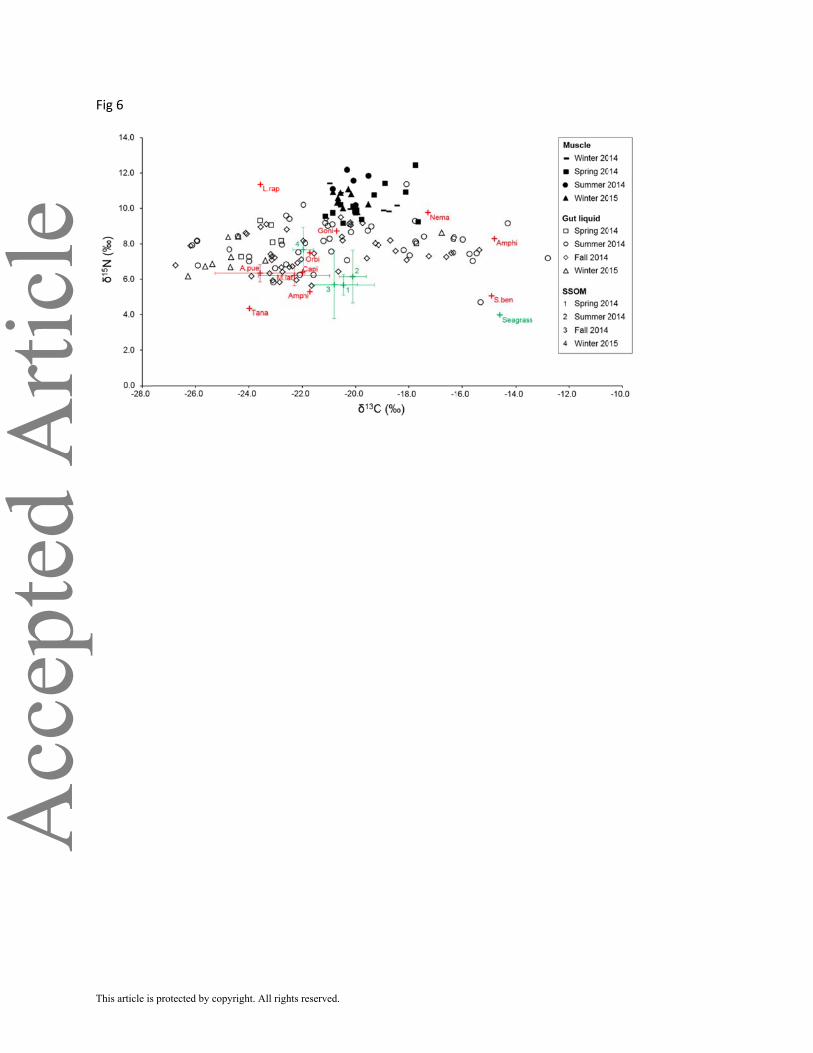
Isotope δ13C and δ15N values of SSOM ranged from –22.1 to –19.1‰ and from 4.1 to 10.2‰,
respectively (Figure 6). Isotope compositions of SSOM did not show any temporal (Kruskal
Wallis tests: δ13C: P > 0.05, δ15N: P > 0.05) or spatial (Kruskal Wallis tests: δ13C: P > 0.05,
δ15N: P > 0.05) pattern. Seagrass was more enriched in 13C than SSOM (δ13C –14.6‰) and had
low δ15N values (4.0‰).
Macrofauna δ13C values ranged from –24.0 (Tanaidacea) to –14.8‰ (Amphipod), which
was similar to ranges of δ13C values of seagrass and SSOM. δ15N values of macrofauna ranged
from 4.4 (Tanaidacea) to 11.4 (Leptochelia rapax).
This article is protected by copyright. All rights reserved.

Acc
epte
d A
rticl
e
17
Isotope δ13C and δ15N values of P. cromis gut liquid ranged from –26.7 to –12.8‰ (mean
± S.D., –21.2 ± 3.1‰) and from 4.7 to 11.4‰ (mean ± S.D., 7.8 ± 1.1‰), respectively. It was not
possible to determine spatial or temporal variations due to unbalanced sampling between bays
and dates. δ13C and δ15N values of P. cromis muscle (mean ± S.D. LT = 343 ± 65 mm) ranged
from –21.1 to –17.7‰ (mean ± S.D., –19.9 ± 0.9‰) and from 9.2 to 12.4‰ (mean ± S.D., 10.4 ±
0.8‰), respectively. Isotope composition of muscle did not show any temporal (Kruskal Wallis
tests: δ13C: P > 0.05, δ15N: P > 0.05) or spatial (Kruskal Wallis tests: δ13C: P > 0.05, δ15N: P >
0.05) pattern.
Gut-liquid samples had a much larger range of δ13C values than muscles (13.9‰ v.
7.4‰) whereas ranges of δ15N values were similar (Fisher test, δ13C: P < 0.001, δ15N: P > 0.05).
Gut liquid was significantly more depleted in 13C and 15N than muscle (Wilcoxon test, δ13C: P <
< 0.001; Student’s t-test: δ15N: P < 0.001). Average differences between gut liquid and muscle
were 1.8 and 2.6‰ for δ13C and δ15N values, respectively.
4 | DISCUSSION
4.1 | Effect of a major rain event on Baffin Bay estuary water conditions
The large salinity drop observed from September 2014 to March 2015 is related to a major rain
event in September 2014, with monthly precipitation totalling 345 mm (compared with the
monthly average of 62 mm throughout the remaining study period). Variations of DO and
temperature reflect seasonal patterns. The rain event led to a decrease in salinity from 53.6 to
40.9, compared with the hypersaline conditions that typically exist (40 to 60) due to evaporation
exceeding precipitation (Buskey et al., 1998). This provides an interesting case study, period of
This article is protected by copyright. All rights reserved.

Acc
epte
d A
rticl
e
18
strongly hypersaline conditions (typical in this estuary) followed by an acute freshwater pulse
and lower salinities, that can be used to determine how benthic macrofauna (i.e. fish food
resources) and fish diet change in relation to salinity drop.
4.2 | Food resources of P. cromis
Gut content analyses demonstrate that P. cromis ingest a relatively large diversity of prey items
originating from the benthic macrofauna. Observed macrofaunal densities were similar to those
reported in other studies from this estuary (Montagna & Kalke, 1995; Buskey et al., 1997). Some
food resources are actively preyed upon (i.e. bivalves, particularly M. lateralis and A. auberiana;
Sutter et al., 1986) whereas some are less selected (i.e. polychaetes, gastropods). The lower
densities of polychaetes measured in P. cromis gut contents may nevertheless be related to the
fact that they are made of soft tissues only, leading to a quicker digestion than animals with an
exoskeleton (i.e. bivalves, gastropods, crustaceans) (Hyslop, 1980).
Isotope δ13C values of SSOM, ranging from –22.1 to –19.1‰, are typical of what has
been observed in similar systems, indicating that SSOM in Baffin Bay estuary is a mixture of
several primary producers: very likely trapped phytoplankton (Fry & Sherr, 1984; Lebreton et
al., 2016) and benthic microalgae (Lebreton et al., 2016), with possible influence of detritus
from C3 and C4 plants (Fry & Sherr, 1984). The ranges of δ13C values among the benthic
macrofauna highlight that they rely on a wide diversity of food resources with coastal origin,
from trapped phytoplankton for the most 13C-depleted consumers (–24.0‰) to benthic
microalgae for the most 13C-enriched consumers (–14.8‰). The similar isotope compositions of
P. cromis gut liquids and benthic macrofauna confirm that the food resources ingested by P.
This article is protected by copyright. All rights reserved.

Acc
epte
d A
rticl
e
19
cromis predominantly originate from the Baffin Bay estuary, in accordance with previous
observations of limited mobility of P. cromis outside of the estuary (Osburn & Matlock, 1984;
Ajemian et al., 2018). The large range of gut-liquid δ13C values, overlapping the range of benthic
macrofauna δ13C values, highlights that this fish species can ingest a large range of prey items.
Isotope composition of the P. cromis muscle tissue indicates that this species assimilates food
resources produced in the Baffin Bay estuary. Mulinia lateralis can represent a large contribution
to P. cromis diet as the range of muscle δ13C values are relatively close to those of M. lateralis,
taking into account the trophic fractionation between food sources and consumers. Indeed,
muscle tissue isotope composition is enriched in 13C and 15N compared with gut contents
following trophic fractionation factors (1.8 for δ13C, 2.6 for δ15N) typically observed between a
consumer and its food sources (Post, 2002; Vander Zanden & Rasmussen, 2001).
The combination of gut-content analyses and isotope compositions of gut contents and
muscle tissues demonstrate that P. cromis rely on benthic food resources produced in the Baffin
Bay estuary yera-round. Such combination of approaches is highly beneficial to understand
trophodynamics, particularly for durophagous predators like P. cromis, which use strong
pharyngeal teeth to crush their prey (Simmons & Breuer, 1962; Grubich, 2003). Small and soft-
bodied benthic prey are indeed quickly digested beyond visible recognition (Kennedy, 1969;
Hofsten et al., 1983) compared with those containing digestion-resistant hard parts (Miller, 1974;
Sogard, 1984). In addition to providing information about what is ingested (i.e. gut content
isotope composition) and is actually assimilated by fish (i.e. muscle-isotope composition),
applying a stable-isotope approach as a complement to traditional gut-content analysis can also
provide information about the spatial origin of the food resources at the base of the food web (i.e.
water column v. sediment). Combining trophic data with information related to fish movement
This article is protected by copyright. All rights reserved.

Acc
epte
d A
rticl
e
20
and habitat use (Ajemian et al., 2018) could also provide complementary information on the
mechanisms by which natural and anthropogenic changes affect estuarine species.
4.3 | Changes of water quality conditions affect availability of P. cromis food sources
The highest relative densities of the most selected food items M. lateralis and A. auberiana
occurred in March 2015, when salinity was the lowest. Indeed, increases in freshwater inflows
can enhance productivity of suspension feeders due to nutrient stimulation of primary production
in the water column (Grange & Allanson, 1995; Kim & Montagna, 2012). Due to rapid
colonization after freshwater-related salinity variability, previous studies have identified M.
lateralis as a good indicator species for freshwater inflow effects (Montagna & Kalke, 1995;
Beseres Pollack et al., 2009). Anomalocardia auberiana has been identified as an indicator
species as well, with increased densities in areas experiencing regular flooding and reduced
salinities (Turney & Perkins, 1972). Mulinia lateralis densities are similar to those previously
documented in the Baffin Bay estuary (<100–2500 m–2; Montagna & Kalke, 1995; Buskey et al.,
1997). In the current study, bivalve biomass increased with increasing DO. Because low DO
conditions can significantly reduce macrofauna biomass and diversity (Dauer et al., 1992; Diaz
& Rosenberg, 1995), higher DO concentrations may serve to increase benthic secondary
production available for higher trophic levels. Variations in water quality therefore have
implications for P. cromis food resource dynamics. This indicates bivalve communities are
important to survey when trying to assess potential food limitation for these fish (Olsen et al.,
2014; Olsen, 2016). Because bivalve communities integrate water quality conditions, including
This article is protected by copyright. All rights reserved.
Acc
epte
d A
rticl
e
21
DO variation over diel cycles, they are useful for assessing ecosystem status above that which
can be determined with punctuated daily measurements.
4.4 | Effects of water quality changes on P. cromis diet
Vacuity index values decreased from winter 2014 (54.9%) to winter 2015 (0.0%), following the
trend of decreasing salinity (from 49.2 to 40.9), suggesting that P. cromis feeding activity was
higher at low salinities. This is probably related to the higher availability of bivalves when
salinities were lower. Higher feeding activity of P. cromis at low salinity is in accordance with
the hypothesis from Ajemian et al. (2018), who suggest that high salinities decrease fish capacity
to move, due to higher energy costs. Lower fish abundance has been reported in estuaries during
hypersaline periods, which has been attributed to the disappearance of certain food resources as
well as osmoregulatory stress (Boltt, 1975; Wallace, 1975). The sparid Acanthopagrus butcheri
(Munro 1949), a commercially and recreationally important fishery species in estuaries in south-
western Australia, was shown to be particularly susceptible to elevated salinities when unable to
access to areas of lower salinity (Hoeksema et al., 2006). High salinity may therefore lead to
cumulative negative effects, reducing the ability of fish to feed in hypersaline ecosystems, on top
of decreasing the quantities of their food resources. Nevertheless, such hypotheses need to be
confirmed, in particular with the help of physiological measurements.
Within hypersaline systems, acute salinity variability is another key stressor to estuarine
organisms (Bachman & Rand, 2008) that may affect food resources for higher trophic levels.
Indeed, in the Baffin Bay estuary, the macrofaunal community demonstrated substantial shifts in
dominant species before (Streblospio benedicti, Acteocina canaliculata) and after (Mulinia
This article is protected by copyright. All rights reserved.
Acc
epte
d A
rticl
e
22
lateralis, Anomalocardia auberiana) the acute salinity disturbance. Similarly, food resource
availability in three hypersaline estuaries in Western Australia has been attributed to the degree
of salinity variability for Acanthopagrus butcheri (Chuwen et al., 2007). The degree of salinity
variability in Florida Bay is related to the quality of food resources ingested by tidewater mojarra
Eucinostomus harengulus Goode & Bean 1879 and goldspotted killifish Floridichthys carpio
(Günther 1866) (Ley et al., 1994). Similarly, in a hypersaline lagoon in South America,
increased food-web complexity has been related to the stability of hypersaline conditions
(Almeida-Silva et al., 2015). Longer-term research is warranted to better understand the response
and recovery of food-web functioning in hypersaline systems as a result of acute salinity
fluctuation.
Better determination of the dependence between the two major species of bivalves (M.
lateralis and A. auberiana) in the Baffin Bay estuary and P. cromis is also warranted. Even if the
combination of gut content and isotope analyses provided very meaningful information about the
role of these two food sources, the broad ranges of δ13C values for P. cromis muscle as well as
for benthic macrofauna species limit the ability to determine to what degree P. cromis relies on
these two species of bivalves. If selective feeding continues to occur even when bivalve biomass
is reduced, altered macrofauna community composition would have stronger implications for
availability of P. cromis food resources (Charnov et al., 1976). On the other hand, the standing
stock of these bivalves is maybe large enough to support P. cromis and other fish populations,
even when biomasses are decreasing. Determining the daily ration of bivalves needed by P.
cromis would help determine the carrying capacity of the estuary to support P. cromis
populations during changing environmental conditions. Declines in food resources were
described as a probable contributor for striped bass Morone saxatilis (Walbaum 1792) exceeding
This article is protected by copyright. All rights reserved.

Acc
epte
d A
rticl
e
23
carrying capacity (Uphoff, 2003). In the Baffin Bay estuary, such an assessment should take into
account other fish species [e.g. sheepshead Archosargus probatocephalus (Walbaum 1792)
(Macreadie et al., 2011); cownose rays Rhinoptera bonasus (Mitchill 1815) (Myers et al., 2007)]
that rely on bivalve prey.
The reliance of fish on prey items such as bivalves may have higher implications than for
other benthic macrofauna species. Bivalves are generally suspension feeders; they rely on
primary production occurring in the water column, which demonstrates much larger temporal
and spatial variation than primary production in the sediment (Guarini et al., 2006), even at the
scale of an embayment such as the Baffin Bay estuary. The dynamics of primary production in
the sediment can be characterized by a constant adjustment to steady state conditions (Guarini et
al., 2000) because there is low within year variability. In contrast, water column primary
production depends more on meteorological conditions including light, temperature and nutrient
availability (Cloern 1996), the latter being related to freshwater inflow. Therefore, variations in
water column production may disproportionately affect suspension feeder density and biomass
compared with macrofauna relying on benthic production (i.e. deposit feeders). This suggests
that fish relying on food sources of pelagic origin will be more sensitive to salinity variations in
hypersaline ecosystems like the Baffin Bay estuary.
This paper highlights the relationship between water quality variables, benthic
macrofauna and their use as food resources by a carnivorous fish species. Although many studies
have revealed connections between water quality variables and benthic macrofauna (Montagna et
al., 2013), this study emphasizes the need for more integrated assessments of food-web
functioning when studying effects of changes in water quality. Holistic approaches such as these
can serve as an important component toward conservation and sustainable fisheries management
This article is protected by copyright. All rights reserved.

Acc
epte
d A
rticl
e
24
(Ludwig et al., 1993) and improved prediction of estuarine response to increasing climatic
variability (Bailey & van de Pol, 2015; Wetz & Yoskowitz, 2013). This may be of particular
interest in systems experiencing additional stressors such as hypersalinity.
ACKNOWLEDGEMENTS
We are grateful to Texas Parks and Wildlife Coastal Fisheries for providing P. cromis specimens
and to M. Wetz and S. Murray for their efforts in developing this collaborative project. We
acknowledge P. Rose (Isotope Core Laboratory - Texas A&M University-Corpus Christi) and G.
Guillou (University of La Rochelle stable isotope facility) for their advice and support in the
analyses. Many thanks are due to members of the Center for Sportfish Science and Conservation
and to the Coastal Conservation and Restoration Ecology Lab at TAMUCC for all their
assistance in the field and laboratory, especially P. Hajovsky, M. Martinez and N. Breaux. The
authors also thank two anonymous reviewers for providing insights and suggestions that greatly
improved the quality of this study. The Institutional Animal Care and Use Committee at Texas
A&M University-Corpus Christi approved all procedures involving animals in this project.
SUPPORTING INFORMATION
Supporting information can be found in the online version of this paper.
TABLE S1 Analysis of Similarities (ANOSIM) test for temporal differences in gut contents.
TABLE S2 Analysis of Similarities (ANOSIM) test for spatial differences in gut contents.
TABLE S3 Bio-Env (BEST) biota and, or environment matching.
This article is protected by copyright. All rights reserved.
Acc
epte
d A
rticl
e
25
REFERENCES
Ajemian, M.J., Mendenhall, K.S., Beseres Pollack, J., Wetz, M.S., & Stunz, G.W. (2018).
Moving forward in a reverse estuary: movement and habitat use of black drum (Pogonias
cromis) under distinct hydrological regimes. Estuaries & Coasts (online).
doi:10.1007/s12237-017-0363-6.
Alber, M. (2002). A conceptual model of estuarine inflow policy. Estuaries 25, 1246–1261.
doi:10.1007/BF02692222.
Almeida-Silva, R.H., Tubino, R.A., Zambrano, L.C., Hunder, D.A., Garritano, S.R., Monteiro-
Neto, C. (2015). Trophic ecology and food consumption of fishes in a hypersaline
tropical lagoon. Journal of Fish Biology 86, 1781-1795.
Armstrong, N. E. (1987). The ecology of open-bay bottoms of Texas: a community profile. U.S.
Fish and Wildlife Service Biological Report 85 (7.12). 119 pp.
Bachman, P.M., & Rand, G.M. (2008). Effects of salinity on native estuarine fish species in
south Florida. Ecotoxicology 17, 591-597.
Bailey, L.D., & van de Pol, M. (2015). Tackling extremes: challenges for ecological and
evolutionary research on extreme climatic events. Journal of Animal Ecology 85, 85-96.
Beck, M.W., Heck Jr., K.L., Able, K.W., Childers, D.L., Eggleston, D.B., Gillanders, B.M.,
Halpern, B., Hays, C.G., Hoshino, K., Minello, T.J., Orth, R.J., Sheridan, P.F. &
Weinstein, M.P. (2001). The identification, conservation, and management of estuarine
and marine nurseries for fish and invertebrates. BioScience 51, 833-641.
This article is protected by copyright. All rights reserved.

Acc
epte
d A
rticl
e
26
Beseres Pollack, J. Kinsey, J.W., & Montagna, P.A. (2009). Freshwater inflow biotic index
(FIBI) for the Lavaca-Colorado Estuary, Texas, USA. Environmental Bioindicators 4,
153-169.
Blaber, S.J.M. (1997). Fish and Fisheries of Tropical Estuaries. Fish and Fisheries Series 22.
London: Chapman & Hall.
Blaber, S.J.M., & Blaber, T.J.G. (1980). Factors affecting the distribution of juvenile estuarine
and inshore fish. Journal of Fish Biology 17, 143-162.
Boltt, R.E. (1975). The benthos of some southern African lakes. Part 5. The recovery of the
benthic fauna of St. Lucia following a period of excessively high salinity. Transactions of
the Royal Society of South Africa 41, 295–323.
Breuer, J.P. (1962). An ecological survey of the lower Laguna Madre of Texas, 1953-1959.
Publications of the Institute of Marine Science, University of Texas 8, 153-183.
Buskey, E.J., Montagna, P.A., Amos, A.F., Whitledge, T.E. (1997). Disruption of grazer
populations as a contributing factor to the initiation of the Texas brown tide algal bloom.
Limnology and Oceanography 45, 1215-1222.
Buskey, E.J., Wysor, B., Hyatt, C. (1998). The role of hypersalinity in the persistence of the
Texas ‘brown tide’ in the Laguna Madre. Journal of Plankton Research 20, 1553-1565.
Charnov, E.L., Orians, G.H, & Hyatt, K. (1976). Ecological implications of resource depression.
The American Naturalist 110, 247-259.
Chuwen, B.M., Platell, M.E., & Potter, I.C. (2007). Dietary compositions of the sparid
Acanthopagrus butcheri in three normally closed and variably hypersaline estuaries differ
markedly. Environmental Biology of Fishes 80, 363-376.
This article is protected by copyright. All rights reserved.

Acc
epte
d A
rticl
e
27
Clarke, K.R., & Ainsworth, M. (1993). A method of linking multivariate community structure to
environmental variables. Marine Ecology Progress Series 92, 205-219.
Clarke K.R., & Gorley, R.N. (2006). PRIMER v6: User manual/tutorial. Plymouth: PRIMER-E.
Clarke, K.R., & Warwick, R. (1994). Similarity-based testing for community patterns: the two-
way layout with no replication. Marine Biology 118,167-176.
Cloern, J.E. (1996). Phytoplankton bloom dynamics in coastal ecosystems: a review with some
general lessons from sustained investigation of San Francisco Bay, California. Reviews of
Geophysics 34, 127-168.
Dauer, D.M., Rodi, A.J., & Ranasinghe, J.A. (1992). Effects of low dissolved oxygen events on
the macrobenthos of the lower Chesapeake Bay. Estuaries 15, 384-391.
Diaz, R.J., & Rosenberg, R. (1995). Marine benthic hypoxia: a review of its ecological effects
and the behavioural responses of benthic macrofauna. Oceanography and Marine
Biology: an Annual Review 33, 245–303.
Dugas, C.N. (1986). Food habits of black drum, Pogonias cromis, in southeast Louisiana with
emphasis on their predation of the American oyster, Crassostrea virginica. Louisiana
Department of Wildlife and Fisheries Technical Bulletin 40, 32-38.
Elliott, M., Hemingway, K. L., Costello, M. J., Duhamel, S., Hostens, S., Labropoulou, M.,
Marshall, S., & Winkler, H. (2007). Links between fish and other trophic levels. In Fishes
in Estuaries (Elliott, M., Hemingway, K., eds.), pp. 124-216. Oxford: Blackwell Science.
Fourqurean, J.W., Jones, R.D., Zieman, J.C. (1993). Processes influencing water column nutrient
characteristics and phosphorus limitation of phytoplankton biomass in Florida Bay, FL,
USA: Inferences from spatial distributions. Estuarine, Coastal, and Shelf Science 36,
295-314.
This article is protected by copyright. All rights reserved.

Acc
epte
d A
rticl
e
28
Fry, B., & Sherr, E.B. (1984). δ13C measurements as indicators of carbon flow in marine and
freshwater ecosystems. Contributions in Marine Science 27, 13-47.
Fry, B., Cieri, M., Hughes, J., Tobias, C., Deegan, L., & Peterson, B. (2008). Stable isotope
monitoring of benthic-planktonic coupling using salt marsh fish. Marine Ecology
Progress Series 369, 193-204.
Grange, N., & Allanson, B.R. (1995). The influence of freshwater inflow on the nature, amount,
and distribution of seston in estuaries of the eastern cape, South Africa. Estuarine,
Coastal, and Shelf Science 40, 403-420.
Grubich, J.R. (2003). Morphological convergence of pharyngeal jaw structure in durophagous
perciform fish. Biological Journal of the Linnean Society 80, 147-165.
Guarini J.M., Blanchard G.F., & Gros P., (2000). Quantification of the microphytobenthic
primary production in European intertidal mudflats – a modelling approach. Continental
Shelf Research 20, 1771-1788.
Guarini J.M., Blanchard G.F., & Richard P. (2006). Modelling the dynamics of the
microphytobenthic biomass and primary production in European intertidal mudflats. In
Functioning of Microphytobenthos in Estuaries (Kromkamp, J.C., de Brouwer, J.F.C., &
Blanchard, G.F., eds.), pp. 187-226. Amsterdam:Royal Netherlands Academy of Arts and
Sciences.
Harrison, T.D., & Whitfield, A.K. (2006). Temperature and salinity as primary determinants
influencing the biogeography of fishes in South African estuaries. Estuarine, Coastal and
Shelf Science 66, 335-345.
Hill, M. (1973). Diversity and Evenness: a unifying notation and its consequences. Ecology 54,
427-432.
This article is protected by copyright. All rights reserved.
Acc
epte
d A
rticl
e
29
Hoeksema, S.D., Chuwen, B.M., Potter, I.C. (2006). Massive mortalities of the black bream
Acanthopagrus butcheri (Sparidae) in two normally-closed estuaries, following extreme
increases in salinity. Journal of the Marine Biological Association of the United Kingdom
86, 893–897.
Hofsten, A.V., Kahan, D., Katznelson, R., Bar-El, T. (1983). Digestion of free-living nematodes
fed to fish. Journal of Fish Biology 21, 419-428.
Hyslop, E.J. (1980). Gut contents analysis – a review of methods and their application. Journal
of Fish Biology 17, 411-429.
Kennedy, C.R. (1969). Tubificid oligochaetes as food of dace Leuciscus leuciscus (L.). Journal
of Fish Biology 1, 11-15.
Kennish, M.J. (2002). Environmental threats and environmental future of estuaries.
Environmental Conservation 29, 78-107.
Kim, H.C., & Montagna, P.A. (2012). Effects of climate-driven freshwater inflow variability on
macrobenthic secondary production in Texas lagoonal estuaries: A modeling study.
Ecological Modelling 235-236, 67-80.
Lebreton, B., Beseres Pollack, J., Blomberg, B.N., Palmer, T.A., Adams, L., Guillou, G., &
Montagna, P.A. (2016). Origin, composition and quality of suspended particulate organic
matter in relation to freshwater inflow in a South Texas estuary. Estuarine, Coastal and
Shelf Science 170, 70-82.
Levin, L., Boesch, D.F., Covich, A., Dahm, C., Erséus, C., Ewel, K.C., Kneib, R.T., Moldenke,
A., Palmer, M.A., Snelgrove, P., Strayer, D., & Weslawski, J.M. (2001). The Function of
Marine Critical Transition Zones and the Importance of Sediment Biodiversity.
Ecosystems 4, 430-451.
This article is protected by copyright. All rights reserved.

Acc
epte
d A
rticl
e
30
Ley, J.A., Montague, C.L., & McIvor, C.C. (1994). Food habits of mangrove fishes: a
comparison along estuarine gradients in northeastern Florida Bay. Bulletin of Marine
Science 54, 881-899.
Ludwig, D., Hilborn, R., Walters, C. (1993) Uncertainty, resource exploitation, and
conservation: Lessons from history. Ecological Applications 3, 547-549.
Macreadie, P., Geraldi, N., & Peterson, C. (2011). How small-scale variation in oyster reef
patchiness influences predation on bivalves. Marine Ecology Progress Series 429, 87-91.
Martinez-Andrade, F., Campbell, P., & Fuls, B. (2005). Trends in relative abundance and size of
selected finfishes and shellfishes along the Texas coast: November 1975–December
2003. Management Data Series Number 232. Austin, TX: Texas Parks and Wildlife
Department, Coastal Fisheries Division. Available at
www.tpwd.texas.gov/publications/pwdpubs/media/mds_coastal/Series%202_MDS232.pd
f
Matlock, G.C., & Weaver, J.E. (1979). Assessment and Monitoring of Texas Coastal Finfish
Resources. Austin, TX: Texas Parks and Wildlife Department Coastal Fisheries Branch.
Miller, J. M. (1974). The food of brook trout Salvelinus fontinalis (Mitchill) fry from different
subsections of Lawrence Creek, Wisconsin. Transactions of the American Fisheries
Society 103, 130-134.
Montagna, P.A., Alber, M., Doering, P., & Connor, M.S. (2002). Freshwater inflow: science,
policy, management. Estuaries 25, 1243-1245.
Montagna, P.A., & Kalke, R.D. (1992). The effect of freshwater inflow on meiofaunal and
macrofaunal populations in the Guadalupe and Nueces Estuaries, Texas. Estuaries 15,
307-326.
This article is protected by copyright. All rights reserved.

Acc
epte
d A
rticl
e
31
Montagna, P. A. & Kalke, R.D. (1995). Ecology of infaunal Mollusca in south Texas estuaries.
American Malacological Bulletin 11, 163-175.
Montagna, P.A., Palmer, T.A., & Beseres Pollack, J. (2013). Hydrological Changes and
Estuarine Dynamics. Springer Briefs in Environmental Science 8, 94 pp. doi:
10.1007/978-1-4614-5833-3.
Montagna, P.A., Stockwell, D.A., & Kalke, R.D. (1993). Dwarf surfclam Mulinia lateralis (Say,
1822) populations and feeding during the Texas brown tide event. Journal of Shellfish
Research 12, 433-442.
Myers, R.A., Baum, J.K., Shepherd, T.D., Powers, S.P., Peterson, C.H. (2007). Cascading effects
of the loss of apex predatory sharks from a coastal ocean. Science 315, 1846-1850. doi:
10.1126/science.1138657.
Nicholson, G., Jenkins, G. P., Sherwood, J., and Longmore, A. (2008). Physical environmental
conditions, spawning and early-life stages of an estuarine fish: climate change
implications for recruitment in intermittently open estuaries. Marine and Freshwater
Research 59, 735–749. doi:10.1071/MF07197.
Nixon, S.W. (1982). Nutrient dynamics, primary production, and fisheries yields of lagoons.
Proceedings International Symposium on coastal lagoons SCOR/IABO/UNESCO,
Bordeaux, France. Oceanologica Acta, 357-371.
Nixon, S.W., & Buckley, B.A. (2002). "A strikingly rich zone": nutrient enrichment and
secondary production in coastal marine ecosystems. Estuaries 25, 782-796.
Olsen, Z.T. (2016). Emaciated black drum (Pogonias cromis) in the upper Laguna Madre, Texas:
tracking the recovery of the population over two years. Texas Journal of Science 68, 79-
90.
This article is protected by copyright. All rights reserved.

Acc
epte
d A
rticl
e
32
Olsen, Z.T., Grubbs, F.P., Morris, A.D., & Tolan, J.M. (2014). Reports of Emaciated black drum
(Pogonias cromis) in the upper Laguna Madre, Texas. Texas Journal of Science 66, 75-
81.
Osburn, H.R., & Matlock, G.C. (1984). Black drum movement in Texas Bays. North American
Journal of Fisheries Management 4, 523-530.
Paul, D., Skrzypek, G., & Forizs, I. (2007). Normalization of measured stable isotopic
compositions to isotope reference scales –a review. Rapid Communications in Mass
Spectrometry 21, 3006-3014.
Pachauri, R. & Meyer, L. (Eds) (2014). Climate Change 2014: Synthesis Report. Contribution of
Working Groups I, II and III to the Fifth Assessment Report of the Intergovernmental
Panel on Climate Change. Geneva: IPCC. Available able at www.ipcc.ch/report/ar5/syr/
Peterson, B., & Fry, B. (1987). Stable Isotopes in Ecosystem Studies. Annual Review of Ecology
and Systematics 18, 293-320.
Pinnegar, J.K., & Polunin, N.V.C. (1999). Differential fractionation of δ13C and δ 15N among fish
tissues: implications for the study of trophic interactions. Functional Ecology 13, 225-
231.
Pinnegar, J.K., & Polunin, N.V.C. (2000). Contributions of stable isotope data to elucidating
food webs of Mediterranean rocky littoral fishes. Oecologia 122, 399-409.
Post, D.M. (2002). Using stable isotopes to estimate trophic position: models, methods, and
assumptions. Ecology 83, 703-718.
Ross, J.F., Pavela, J.S., & Chittenden, M.E. (1983). Seasonal occurrence of black drum,
Pogonias cromis, and red drum, Sciaenops ocellatus, off Texas. Northeast Gulf Science
6, 67-70.
This article is protected by copyright. All rights reserved.
Acc
epte
d A
rticl
e
33
Sanders, H. (1968). Marine benthic diversity: a comparative study. The American Naturalist 102,
243-282.
Scavia, D., Field, J.C., Boesch, D.F., Buddemeier, R.W., Burkett, V., Cayan, D.R., Fogarty, M.
Harwell, M.A., Howarth, R.W., Mason, C., Reed, D.J., Royer, T.C., Sallenger, A.H.,
Tituset, J.G. (2002). Climate change impacts on U.S. Coastal and Marine Ecosystems.
Estuaries 25, 149-164. https://doi.org/10.1007/BF02691304.
Seager, R., Ting, M., Held, I., Kushnir, Y., Lu, J., Vecchi, G., Huang, H.-P., Harnik, N.,
Leetmaa, A., Lau, N.-C., Li, C., Velez, J., & Naik, N. (2007). Model projections of an
imminent transition to a more arid climate in southwestern North America. Science 316,
1181-1184.
Simmons, E.G., & Breuer, J.P. (1962). A study of redfish, Sciaenops ocellatus Linnaeus and
black drum, Pogonias cromis Linnaeus. Publications of the Institute of Marine Science,
University of Texas 8, 184-211.
Sogard, S.M. (1984). Utilization of meiofauna as a food source by a grassbed fish, the spotted
dragonet Callionymus pauciradiatus. Marine Ecology Progress Series 17, 183-191.
Strauss, R.E. (1979). Reliability estimates for Ivlev's electivity index, the forage ration, and a
proposed linear index of food selection. Transactions of the American Fisheries Society
108, 344-352.
Sutter, F.C., Wailer, R.S., & McIlwain, T.D. (1986). Species profiles: life histories and
environmental requirements of coastal fishes and invertebrates (Gulf of Mexico) – Black
drum. U.S. Fish and Wildlife Service Biological Report 82, 10 pp.
Tunnell, Jr., J.W., & Judd, F.W. (2002). The Laguna Madre of Texas and Tamaulipas. Texas
A&M University Press, College Station.
This article is protected by copyright. All rights reserved.

Acc
epte
d A
rticl
e
34
Tunnell, Jr., J.W., Andrews, J., Barrera, N.C., & Moretzsohn, F. (2010). Encyclopedia of Texas
Seashells: Identification, Ecology, Distribution and History. College Station, TX: Texas
A & M University Press.
Turney, W.J., & Perkins, B.F. (1972). Molluscan Distribution in Florida Bay. Sedimenta III.
Miami, FL: University of Miami.
Uphoff, J. H. (2003). Predator-prey analysis of striped bass and Atlantic menhaden in upper
Chesapeake Bay. Fisheries Management and Ecology 10, 313-322.
Vander Zanden, M.J., implications for aquatic food web studies. Limnology and Oceanography
46, 2061-2066.
Vander Zanden, M.J., Clayton, M.K., Moody, E.K., Solomon, C.T., Weidel, B.C. (2015). Stable
isotope turnover and half-life in animal tissues: A literature synthesis. PLoS ONE 10,
e0116182.
Wallace, J.H. (1975). The estuarine fishes of the east coast of South Africa. Part I. Species
composition and length distribution in the estuarine and marine environments. Part II.
Seasonal abundance and migrations. Investigational Report Oceanographic Research
Institute (Durban) 40, 72 pp.
Wetz, M.S., Cira, E.K., Sterba-Boatwright, B., Montagna, P.A., Palmer, T.A., & Hayes, K.C.
(2017). Exceptionally high organic nitrogen concentrations in a semi-arid South Texas
estuary susceptible to brown tide blooms. Estuarine, Coastal & Shelf Science 188, 27-37.
Wetz, M.S. & Yoskowitz, D.W. (2013). An ‘extreme’ future for estuaries? Effects of extreme
climatic events on estuarine water quality and ecology. Marine Pollution Bulletin 69, 7-
18.
This article is protected by copyright. All rights reserved.

Acc
epte
d A
rticl
e
35
Whitfield, A.K. (1986). Fish community structure response to major habitat changes within the
littoral zone of an estuarine coastal lake. Environmental Biology of Fishes 17, 41–51.
Whitfield, A.K. (1999). Ichthyofaunal assemblages in estuaries: a South African case study.
Reviews in Fish Biology and Fisheries 9, 151-186.
Williams, W.D., Boulton, A.J., Taaffe, R.G. (1990). Salinity as a determinant of Salt Lake fauna:
a question of scale. Hydrobiologia 197, 257-266.
WoRMS Editorial Board. (2017). World Register of Marine Species. Available at
www.marinespecies.org at VLIZ. Accessed 2017-02-27. doi:10.14284/170
Zar, J.H. (2010). Biostatistical Analysis, 5th edn. Upper Saddle River, NJ: Pearson Education.
This article is protected by copyright. All rights reserved.
Acc
epte
d A
rticl
eFIGURE
samplin
Typeset
1
2
FIGURE
tempera
quality
2015) w
Typeset
1
2
3
FIGURE
dissolve
Typeset
E 1 Baffin B
ng stations.
tter
Delete A
Delete
E 2 Principa
ature; DO, d
data (O, Ma
within the Ba
tter
Replace
No colo
Delete
E 3 Times s
ed oxygen c
tter
Bay estuary
A, B and C
al compone
dissolved ox
arch 2014; +
affin Bay es
e A, B with
our necessar
series plots
concentratio
FIGU
y, Texas U.S
from panels
ent (PC) ana
xygen; Turb
+, June 201
stuary.
(a), (b).
ry on (b).
of mean (±
ons (DO) w
URE cap
S.A., indica
s.
and
alysis (a) loa
b, turbidity)
4; X, Septe
S.E.) of (a)
within the Ba
ptions
ating benthic
.
ading plot (
and (b) stat
mber 2014;
) salinity, (b
affin Bay es
c (●) and Po
(Sal, salinity
tion date sc
; , Decemb
b) temperatu
stuary.
ogonias cro
y; Temp,
cores of wat
ber 2014; □,
ure and (c)
omis (■)
ter
March
This article is protected by copyright. All rights reserved.

Acc
epte
d A
rticl
e1 Replace A, B etc with (a), (b) etc.
2 Replace y-axis label of (c) with DO (mg l–1).
FIGURE 4 Proportionally sized mean benthic core (a) abundance and (b) biomass for
comparison with (c) Pogonias cromis gut content biomass from individual bays within the
Baffin Bay estuary.
Typesetter
1 Replace A, B etc with (a), (b) etc.
FIGURE 5 Non-metric multidimensional scaling (nMDS) ordination plot of mean
macrofaunal community structure for each survey sampling date overlaid with 40% similarity
contour. AL, Alazan Bay; BB, Baffin Bay; CG, Cayo del Grullo; LS, Laguna Salada.
Typesetter
1 Replace A, B etc with (a), (b) etc.
FIGURE 6 Mean (± S.D.) Isotope compositions (δ13C and δ15N), of potential food sources and
of Pogonias cromis gut liquid (O, , □, ) and muscle tissue (●, , ■, ) at different seasons
in the Baffin Bay estuary. Primary producers and composite food sources are in green,
macrofauna in red. A.aub, Anomalocardia auberiana; Amphi, Amphipod; Capi, Capitellidae;
Goni, Goniadidae; L.rap, Leptochelia rapax; M.lat, Mulinia lateralis; Nema, Nematodes;
Orbi, Orbiniidae; S.ben, Streblospio benedicti; SSOM, Surface sediment organic matter;
Tana, Tanaidacea.
This article is protected by copyright. All rights reserved.

Acc
epte
d A
rticl
eTypesetter
1 Replace Fall with Autumn.
This article is protected by copyright. All rights reserved.

Acc
epte
d A
rticl
eFig 1
This article is protected by copyright. All rights reserved.
Acc
epte
d A
rticl
eFig 2
This article is protected by copyright. All rights reserved.

Acc
epte
d A
rticl
eFig 3
This article is protected by copyright. All rights reserved.

Acc
epte
d A
rticl
eFig 4
This article is protected by copyright. All rights reserved.
Acc
epte
d A
rticl
eFig 5
This article is protected by copyright. All rights reserved.
Acc
epte
d A
rticl
eFig 6
This article is protected by copyright. All rights reserved.

Acc
epte
d A
rticl
eTABLE 1. Number of Pogonias cromis guts examined and vacuity index in each season and bay.
Season AL BB CG LS BBE
Number of non-empty fish stomachs processed
2014-Winter 5 7
12
2014-Spring 18 23 4 5 50
2014-Summer 6 18
24
2014-Fall 10 2 41 41 93
2015-Winter
10
10
Vacuity index (% empty guts)
2014-Winter 28.6 81.1
54.9
2014-Spring 14.3 8 0 0 5.8
2014-Summer 14.3 0
7.2
2014-Fall 0 0 2.4 6.8 2.3
2015-Winter
0
0
Mean 14.3 17.8 1.2 3.4
AL, Alazan Bay; BB, Baffin Bay; CG, Cayo del Grullo; LS, Laguna Salada.
This article is protected by copyright. All rights reserved.
Acc
epte
d A
rticl
eTABLE 2. Taxa collected in benthic cores across all Pogonias cromis survey sites and sampling
seasons
Density (n m–2) –––––––––––––––––––––––––––––––––––––––––––––––
Biomass (g m–2) ––––––––––––––––––––––––––––––––––––––––––––––––––
Taxa AL BB CG LS Mean S.D. AL BB CG LS Mean S.D.
Bivalvia
Anomalocardia auberiana 3251 6 168 123 887 1541 1.827 0.001 0.112 0.107 0.512 0.878
Mactrotoma fragilis 6 0 95 9 28 45 0.001 0 0.186 0.003 0.048 0.092
Mulinia lateralis 611 123 483 142 340 245 1.793 0.250 1.824 1.209 1.269 0.736
Unidentified Bivalvia 288 0 88 0 94 136 0.183 0 0.127 0 0.078 0.092
Crustacea
Hargeria rapax 9 9 0 0 5 5 0.001 0.001 0 0 0.001 0.001
Sphaeroma terebrans 3 0 6 0 2 3 0.004 0 0.003 0 0.002 0.002
Unidentified Amphipoda 19 6 32 28 21 12 0.002 0.001 0.005 0.003 0.003 0.002
Gastropoda
Acteocina canaliculata 43 32 181 307 141 130 0.038 0.026 0.099 0.459 0.156 0.205
Acteon candens 26 0 0 0 7 13 0.007 0 0 0 0.002 0.004
Astyris lunata 6 0 0 0 2 3 0.011 0 0 0 0.003 0.006
Bittiolum varium 0 0 0 9 2 5 0 0 0 0.002 0.001 0.001
Costoanachis semiplicata 0 0 11 0 3 6 0 0 0.027 0 0.007 0.014
Eulimastoma harbisonae 473 47 151 9 170 211 0.251 0.005 0.074 0.019 0.087 0.113
Fargoa gibbosa 221 0 34 28 71 101 0.098 0 0.005 0.021 0.031 0.046
Nassarius vibex 0 0 6 0 2 3 0 0 0.159 0 0.040 0.080
Rissoella galba 9 0 0 0 2 5 0.012 0 0 0 0.003 0.006
Unidentified Gastropoda 1872 221 391 170 663 811 0.634 0.205 0.340 0.154 0.333 0.215
Polychaeta
Leitoscoloplos foliosus 0 6 0 0 2 3 0 0.001 0 0 <0.001 0.001
Nereididae spp. 0 6 6 0 3 3 0 0.004 0.001 0 0.001 0.002
Orbiniidae spp. 6 0 0 0 2 3 0 0 0 0 0 0
Streblospio benedicti 6486 2219 4028 4671 4351 1762 0.228 0.118 0.169 0.235 0.188 0.055
Unidentified Polychaeta 216 28 6 0 63 103 0.034 0 0.003 0 0.009 0.017
Cnidaria
Actiniaria 0 19 0 0 5 10 0 0 0 0 0 0 Total 13551 2723 5685 5498 6864 4659 5.127 0.612 3.133 2.210 2.770 1.885
AL, Alazan Bay; BB, Baffin Bay; CG, Cayo del Grullo; LS, Laguna Salada.
This article is protected by copyright. All rights reserved.

Acc
epte
d A
rticl
eTABLE 3. Frequency of occurrence and percentage mass of taxa in Pogonias cromis guts.
Sampling site
Taxa AL BB CG LS Mean S.D. Frequency of occurrence (%) Actinopterygii 0.0 0.0 2.4 0.0 0.6 1.2 Bivalvia 70.6 61.7 71.6 75.4 69.8 5.8
Anomalocardia auberiana 27.5 17.5 29.9 52.2 31.8 14.6Mulinia lateralis 6.9 17.3 0 21.2 11.4 9.7Nuculana acuta 0 0.9 0 0 0.2 0.5Unidentified Bivalvia 65.6 60.8 71.6 75.4 68.3 6.5
Oligochaeta 0 0.9 0 10 2.7 4.9Crustacea 1.4 23.2 0 1.2 6.5 11.2
Amphipoda 1.4 15.7 0 0 4.3 7.6Pericarida 0 7.5 0 0 1.9 3.8Portunidae 0 0 0 1.2 0.3 0.6
Mollusca Unidentified 14.2 9.7 12.5 0 9.1 6.3Gastropoda 6.7 5.1 0 11.2 5.7 4.6
Acteocina canaliculata 0 0 0 1.2 0.3 0.6Rissoina punctostriata 1.4 0.9 0 0 0.6 0.7Unidentified Gastropoda 5.3 4.2 0 10 4.9 4.1
Polychaeta 50.0 54.6 53.4 44.9 50.7 4.3Seagrass 12.8 18.8 27.1 43.2 25.5 13.2Unidentified 93.3 97.8 96.3 95.1 95.6 1.9
Biomass (% of identifiable gut) Actinopterygii 0.0 0.0 2.7 0.0 0.7 1.4
Bivalvia 63.9 44.5 67.5 79.2 63.7 14.4Anomalocardia auberiana 2.7 0.7 2.5 2.8 2.2 1.0Mulinia lateralis 0.2 0.4 0 1.6 0.5 0.7Nuculana acuta 0 0.0 0 0 0.0 0.0Unidentified Bivalvia 61.1 43.4 65.0 74.8 61.1 13.1
Oligochaeta 0 0 0 0.0 0.0 0.0Crustacea 0.6 8.3 0.0 0.9 2.4 3.9
Amphipoda 0.6 3.6 0 0 1.0 1.7Pericarida 0 4.7 0 0 1.2 2.4Portunidae 0 0 0 0.9 0.2 0.5
Gastropoda 0.1 0.0 0.0 0.5 0.0 0.2Acteocina canaliculata 0 0 0 <0.1 <0.1 0.0Rissoina punctostriata <0.1 <0.1 0 0 <0.1 0.0Unidentified Gastropoda 0.1 <0.1 0 0.5 0.1 0.2
Unidentified Mollusca 12.4 9.0 12.5 0 8.5 5.9
This article is protected by copyright. All rights reserved.

Acc
epte
d A
rticl
e
2
Polychaeta 16.2 37.4 13.8 1.0 17.1 15.1Seagrass 6.9 0.8 4.4 18.5 7.6 7.7
Biomass (% of total gut) Unidentified 71.3 69.7 79.5 64.1 71.2 6.4
Identified 28.7 30.3 20.7 36.8 29.1 6.6AL, Alazan Bay; BB, Baffin Bay; CG, Cayo del Grullo; LS, Laguna Salada.
This article is protected by copyright. All rights reserved.
Recommended


![78 rpm INSTRUMENTAL · - 140 - 78 rpm INSTRUMENTAL ANAHID AJEMIAN [violinist] 1645. 12” Red RCA Victor 12-0343. CHANT POÉME (Khatchaturian) / MARO AJEMIAN [pianist]. RONDO No](https://img.pdfslide.us/doc/110x75/5e556b4b0150106de171011b/78-rpm-140-78-rpm-instrumental-anahid-ajemian-violinist-1645-12a-red-rca.jpg)