{
Aging Population in Europe does it mean More Death from Fall?
Martin RusnákVeronika Bučková

Falls are prominent among the external causes of unintentional injury worldwide.
The frequency of falls increases with age and frailty level. Older people who are living in nursing homes fall more often than those who are living in community.
Approximately 28-35% of people aged of 65 and over fall each year.(WHO, 2007)
Falls in higher age

Falls occur as a result of a complex interaction of risk factors.
The main risk factors reflect the multitude of health determinants that directly or indirectly affect well-being. Those are categorized into four dimensions:
biological, behavioral, environmental and socioeconomic factors.
Age is the number one biological factor and its importance increases with population aging.
Women are more likely than men to fall and sustain fracture, resulting in twice more hospitalizations and emergency department visits than men. However, fall-related mortality disproportionately affects men. (Tromp et al., 1998)
Risk factors

This paper studies the time series by age of deadly injuries resulting from falls in Slovakia, neighboring countries and the European Union.
Using population projection it looks at prospects of the mortality from falls.
Clinical interventions, such as vitamin D supplementation, exercise or physical therapy programmes, and some comprehensive multifactorial fall assessment and management interventions can reduce falls and are safe for community-dwelling older adults.
Fall interventions at different settings, such as nursing homes, community, and hospitals have been developed and proven to be successful. The lack of dissemination of this knowledge into practice may explain the meagre progress that has been observed so far in falls prevention.(Alamgir et al., 2012)
Aim

Population data were downloaded from publicly available sources on demography by EUROSTAT;
Population forecasts were taken from the same source; Mortality data by ICD 10 for Slovakia were obtained from
the National Center for Health Information; Mortality data for Austria, Czech Republic, Hungary and
Poland were downloaded from WHO mortality database; Statistical environment {R} was used to derive forecasts; Forecasts made using linear regression with CI and
moving average with population prediction; PYLLs were computed using the LE0 for the last available
year;
Methodology

Results

Predicted populations
2013 2014 2015 2016 2017 2018 2019 2020
Slo-vakia
731851 754388 781948 812414 843666 874074 904784 936550
Czech Repub-lic
1825996 1878131 1931976 1986475 2038584 2086316 2131534 2174651
Hun-gary
1732074 1762328 1797409 1829923 1860145 1904118 1960287 2009518
Austria 1557189 1582917 1606761 1627298 1651251 1675593 1702173 1733143
Poland 5667297 5855196 6056323 6272669 6490349 6709653 6925817 7156358
5000001500000250000035000004500000550000065000007500000
Po
pu
lati
on

Prediction SMR Falls for SR
1996
1998
2000
2002
2004
2006
2008
2010
2012
2014
2016
2018
2020
0
20
40
60
80
100
120
140
SMregresiadci SMdci regresiehci SMhci regresiePPdci PPhci PPšt
andard
izova
ná ú
mrt
nosť
na 1
00 0
00 o
byv
ate
ľov
2012 2013 2014 2015 2016 2017 2018 2019 202025.3
predikcia regresiou 21.6 20.5 19.5 18.5 17.6 16.7 15.9 15.2
predikcia s využitím plávajúceho priemeru 56.4 58.1 60.3 62.7 65.1 67.4 69.7 72.0

SR SMR Falls by Age Groups
1996
2001
2006
2011
2016
0
10
20
30
40
50
60
70
80
90
65-69 roční
HM 65-69 yrsregresiaPPlci HMuci HMlci PPuci PPlci regresieuci regresie
hru
bá m
ort
ali
ta n
a 1
00 0
00
65-6
9 r
očn
ých
1996
1998
2000
2002
2004
2006
2008
2010
2012
2014
2016
2018
2020
0
20
40
60
80
100
120
140
75-79 roční
hru
bá m
ort
ali
ta n
a 1
00 0
00
75-7
9 r
očn
ých
1996
1998
2000
2002
2004
2006
2008
2010
2012
2014
2016
2018
2020
050
100150200250300350
80-84 roční
hru
bá m
ort
ali
ta n
a 1
00
000 8
0-8
4 r
očn
ých
1996
1999
2002
2005
2008
2011
2014
2017
2020
0
100
200
300
400
500
600
700
85+
hru
bá m
ort
ali
ta n
a 1
00
000 8
5+
ročn
ých
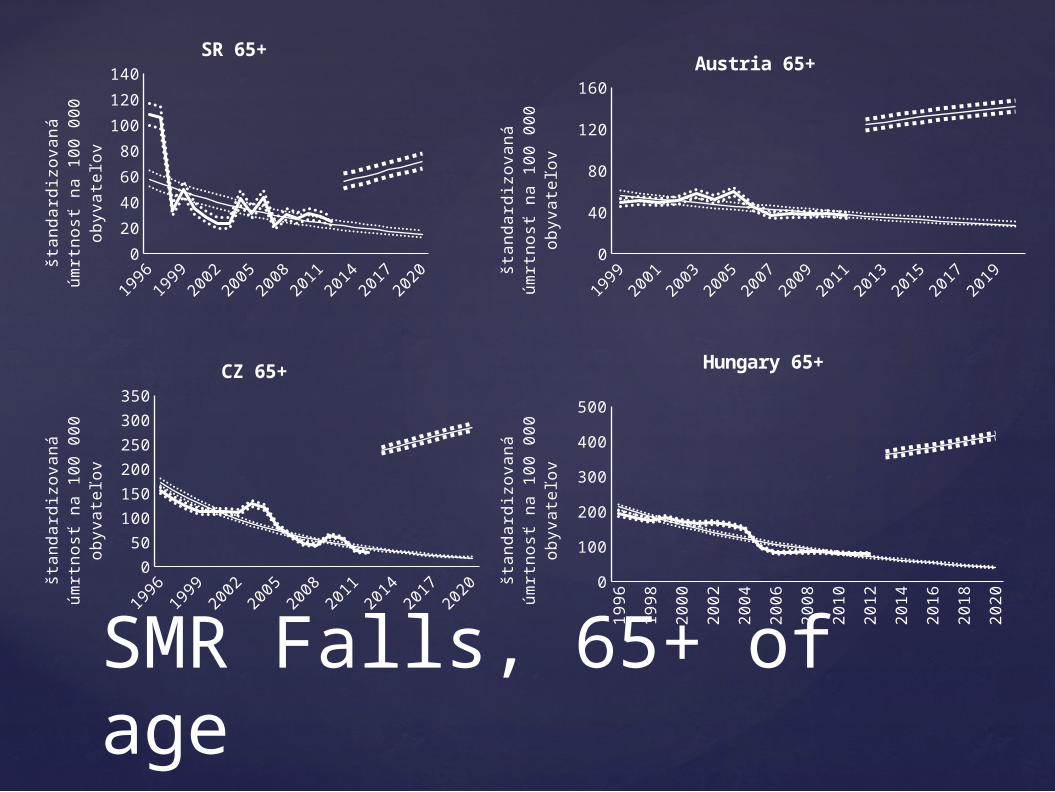
SMR Falls, 65+ of age
1996
1999
2002
2005
2008
2011
2014
2017
2020
0
20
40
60
80
100
120
140
SR 65+št
andard
izova
ná ú
mrt
nosť
na 1
00 0
00 o
byv
ate
ľov
1999
2001
2003
2005
2007
2009
2011
2013
2015
2017
2019
020406080
100120140160
Austria 65+
štandard
izova
ná ú
mrt
nosť
na 1
00 0
00 o
byv
ate
ľov
1996
1998
2000
2002
2004
2006
2008
2010
2012
2014
2016
2018
2020
0
50
100
150
200
250
300
350
CZ 65+
štandard
izova
ná ú
mrt
nosť
na 1
00 0
00 o
byv
ate
ľov
1996
1998
2000
2002
2004
2006
2008
2010
2012
2014
2016
2018
20200
50100150200250300350400450
Hungary 65+
štandard
izova
ná ú
mrt
nosť
na 1
00 0
00 o
byv
ate
ľov

Slovakia PYLL from Falls, 65+
1996
1997
1998
1999
2000
2001
2002
2003
2004
2005
2006
2007
2008
2009
2010
2011
2012
2013
2014
2015
2016
2017
2018
2019
2020
age-adjusted PYLL
23.6422337519911
23.1433884998268
17.8721123006203
17.9533869660099
14.9323561025996
14.3525058573614
12.933006419162
11.0582209970856
15.9680878771388
14.2203633062401
19.9579551520402
12.0487583785955
15.9056037496915
13.7538921864325
11.911204937818
13.3795584004869
12.6147857447133
NaN
NaN
NaN
NaN
NaN
NaN
NaN
NaN
moving average
NaN
NaN
NaN
NaN
NaN
NaN
NaN
NaN
NaN
NaN
NaN
NaN
NaN
NaN
NaN
NaN
NaN
34.5199441502598
35.94877264695
37.6602730259377
39.565505922377
41.4875771988875
43.328582618625
45.0205900563657
46.9055827383371
regression
19.639
19.045
18.466
17.904
17.365
16.839
16.329
15.836
15.359
14.895
14.451
14.013
13.595
13.187
12.792
12.411
12.039
11.6792467164723
11.3310932307103
10.993693237191
10.6667033756889
10.3497915730408
10.0426366630856
9.74492801964466
9.45636520209151
3
13
23
33
43
Slovakia, PYLL
age adju
sted P
YLL per 100,000 65+
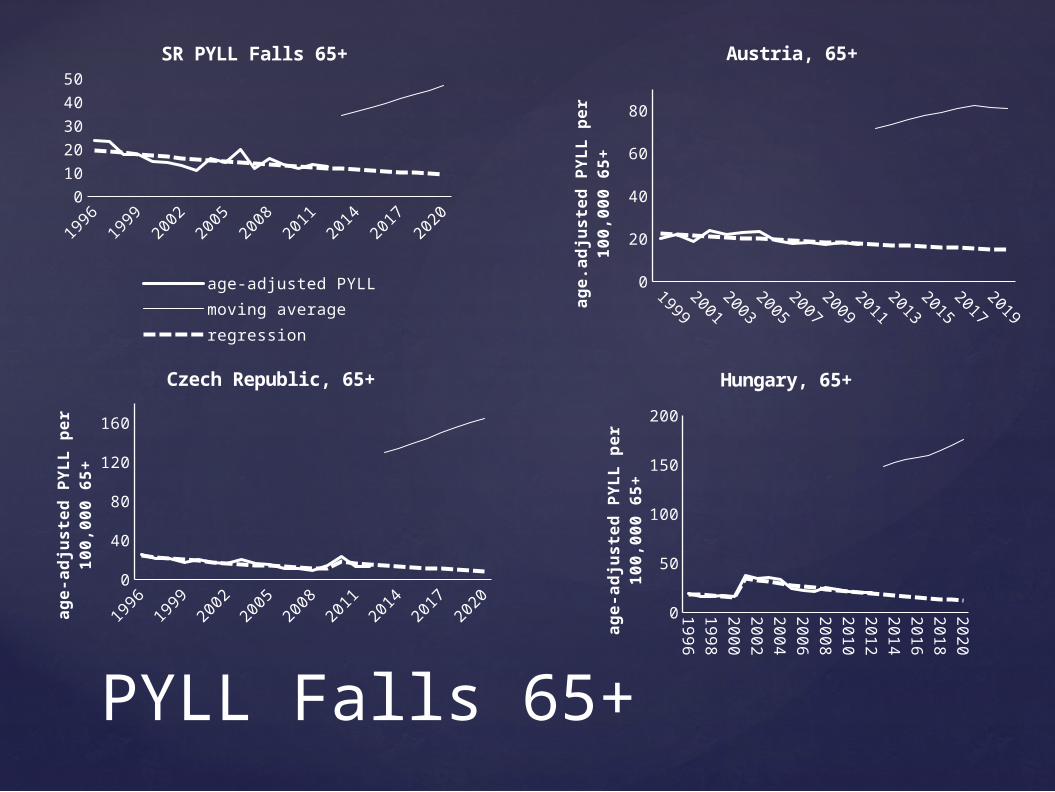
PYLL Falls 65+
19992001
20032005
20072009
20112013
20152017
2019
0102030405060708090
Austria, 65+
age.a
dju
sted P
YLL p
er
100,0
00 6
5+
1996
1998
2000
2002
2004
2006
2008
2010
2012
2014
2016
2018
2020
0
10
20
30
40
50
SR PYLL Falls 65+
age-adjusted PYLLmoving averageregression
1996
1998
2000
2002
2004
2006
2008
2010
2012
2014
2016
2018
2020
020406080
100120140160180
Czech Republic, 65+
age-a
dju
sted P
YLL p
er
100,0
00 6
5+
1996
1998
2000
2002
2004
2006
2008
2010
2012
2014
2016
2018
2020
020406080
100120140160180200
Hungary, 65+
age-a
dju
sted P
YLL p
er
100,0
00 6
5+

While linear regression provides an optimistic forecast of continuous reduction in standardised mortality the moving average using the population forecast reveals a constant increase over coming years;
The increase is more prominent in SR, HU and CZ compared to A;
There is a need to focus on preventing falls by increased provision of services for aging population to reduce the PYLL from falls.
Conclusions
Recommended