© 2001 Prentice-Hall, Inc. Chap 14-1
BA 201
Lecture 23Correlation Analysis
AndIntroduction to Multiple
Regression(Data)
© 2001 Prentice-Hall, Inc. Chap 14-2
Topics Correlation - Measuring the Strength of
the Association The Multiple Regression Model
© 2001 Prentice-Hall, Inc. Chap 14-3
Correlation Example: Mid-term Scores
Here is an Excel Workbook that contains the correlation analysis between Mid-term Scores and each of the various components of this course.
Microsoft Excel Worksheet
© 2001 Prentice-Hall, Inc. Chap 14-4
Purpose of Correlation Analysis
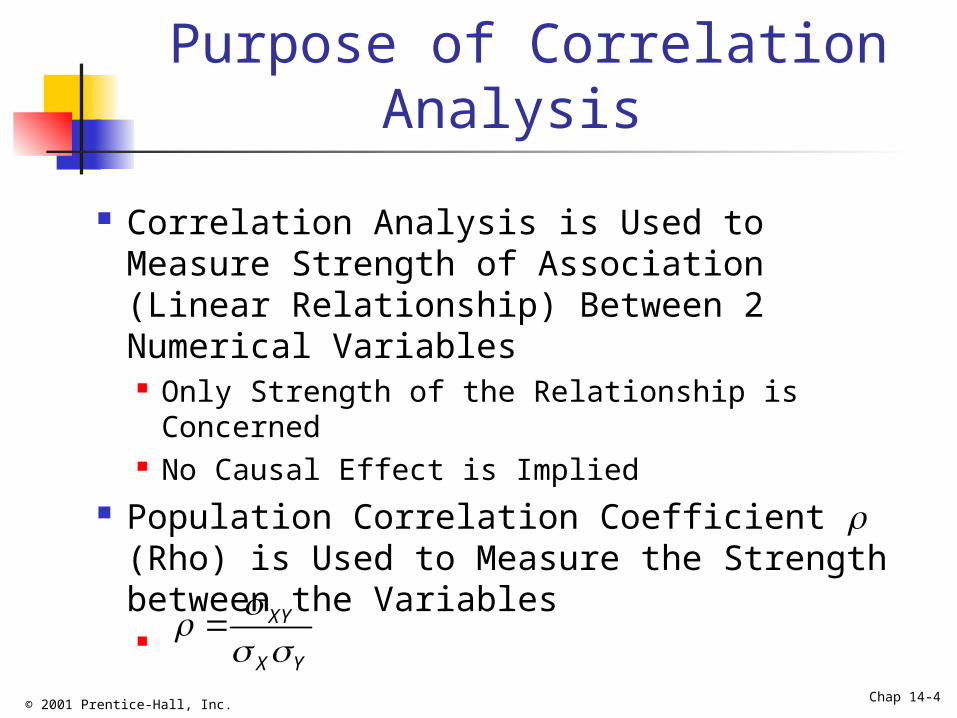
Correlation Analysis is Used to Measure Strength of Association (Linear Relationship) Between 2 Numerical Variables Only Strength of the Relationship is Concerned No Causal Effect is Implied
Population Correlation Coefficient (Rho) is Used to Measure the Strength between the Variables
XY
X Y
© 2001 Prentice-Hall, Inc. Chap 14-5
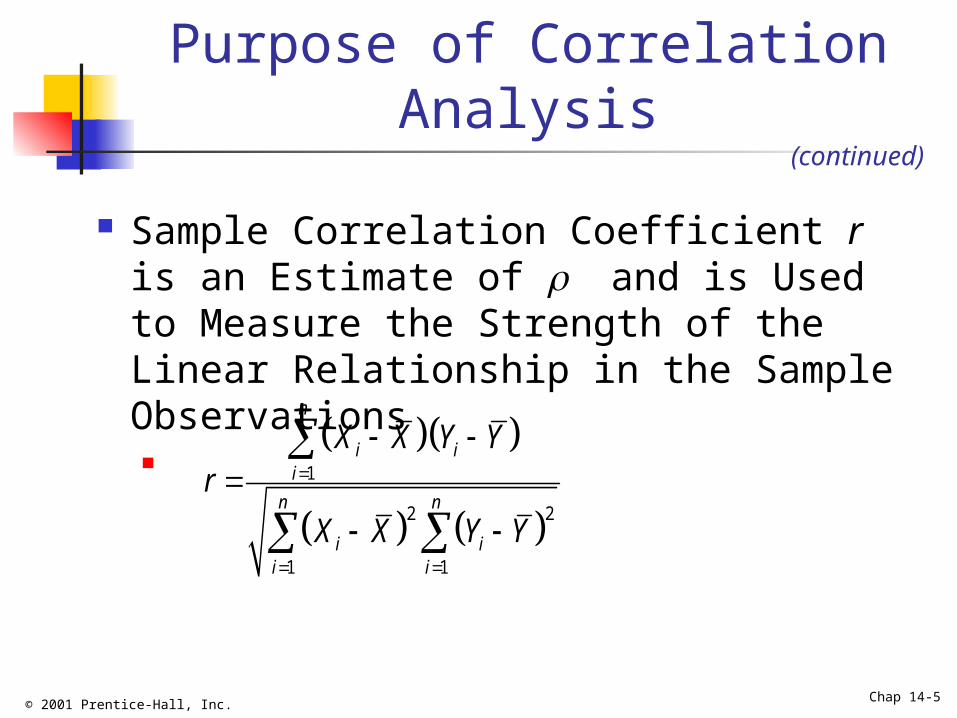
Purpose of Correlation Analysis
Sample Correlation Coefficient r is an Estimate of and is Used to Measure the Strength of the Linear Relationship in the Sample Observations
(continued)
1
2 2
1 1
n
i ii
n n
i ii i
X X Y Yr
X X Y Y
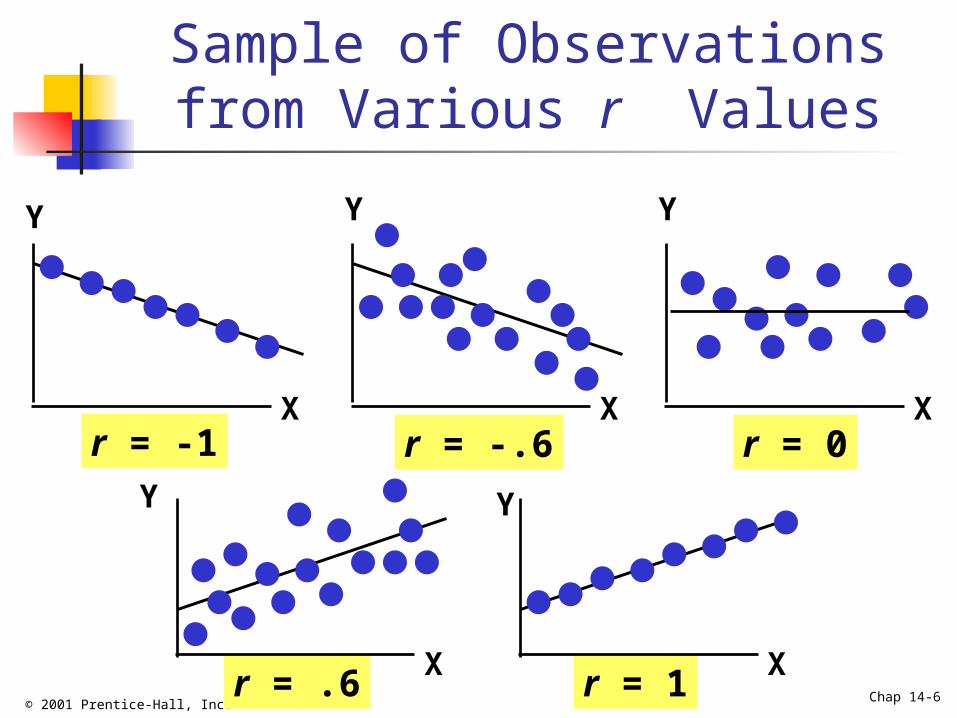
© 2001 Prentice-Hall, Inc. Chap 14-6r = .6 r = 1
Sample of Observations from Various r Values
Y
X
Y
X
Y
X
Y
X
Y
X
r = -1 r = -.6 r = 0
© 2001 Prentice-Hall, Inc. Chap 14-7
Features of and r
Unit Free Range between -1 and 1 The Closer to -1, the Stronger the
Negative Linear Relationship The Closer to 1, the Stronger the
Positive Linear Relationship The Closer to 0, the Weaker the Linear
Relationship
© 2001 Prentice-Hall, Inc. Chap 14-8
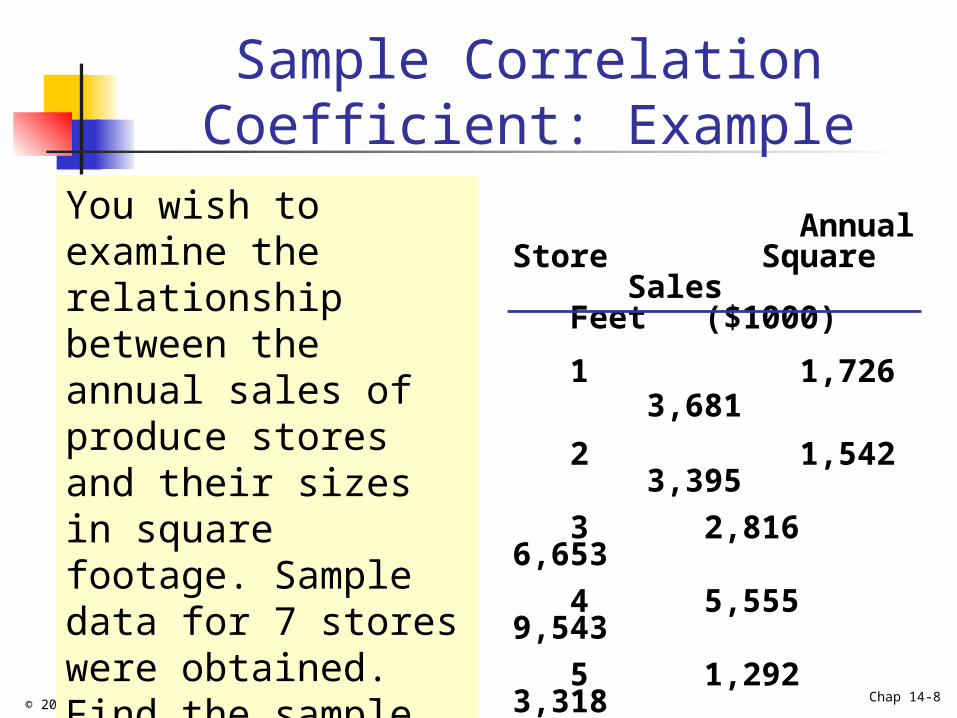
Sample Correlation Coefficient: Example
You wish to examine the relationship between the annual sales of produce stores and their sizes in square footage. Sample data for 7 stores were obtained. Find the sample correlation coefficient.
Annual Store Square Sales
Feet ($1000)
1 1,726 3,681
2 1,542 3,395
3 2,816 6,653
4 5,555 9,543
5 1,292 3,318
6 2,208 5,563
7 1,313 3,760
© 2001 Prentice-Hall, Inc. Chap 14-9
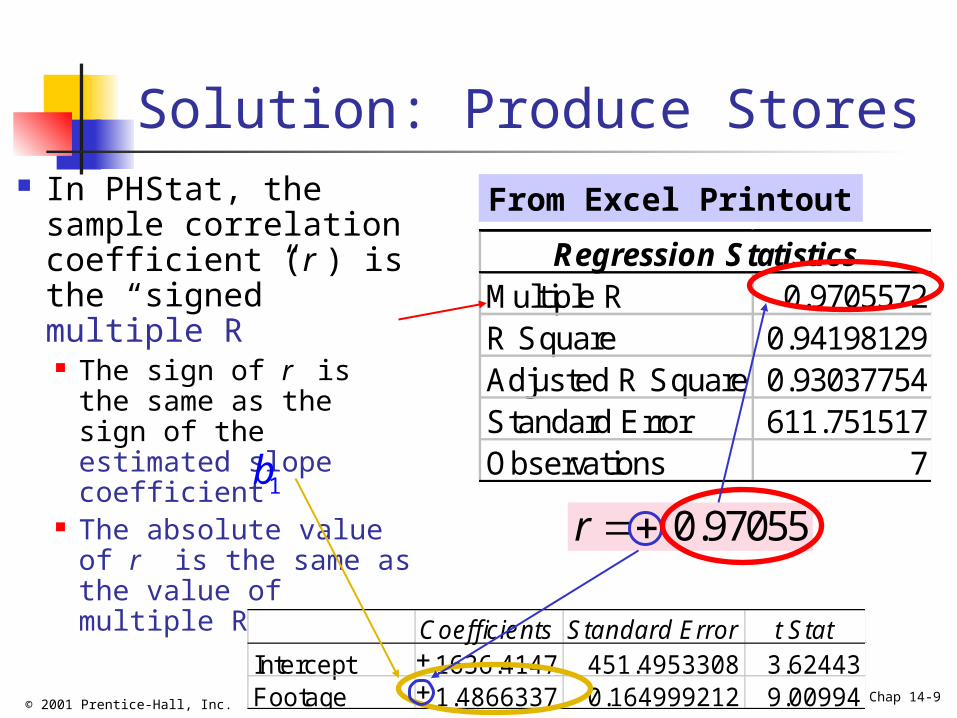
Solution: Produce Stores In PHStat, the
sample correlation coefficient (r ) is the “signed” multiple R The sign of r is the
same as the sign of the estimated slope coefficient
The absolute value of r is the same as the value of multiple R
1b
Regression StatisticsMultiple R 0.9705572R Square 0.94198129Adjusted R Square 0.93037754Standard Error 611.751517Observations 7
From Excel Printout
Coefficients Standard Error t StatIntercept 1636.4147 451.4953308 3.62443Footage 1.4866337 0.164999212 9.00994
1b
0.97055r
© 2001 Prentice-Hall, Inc. Chap 14-10
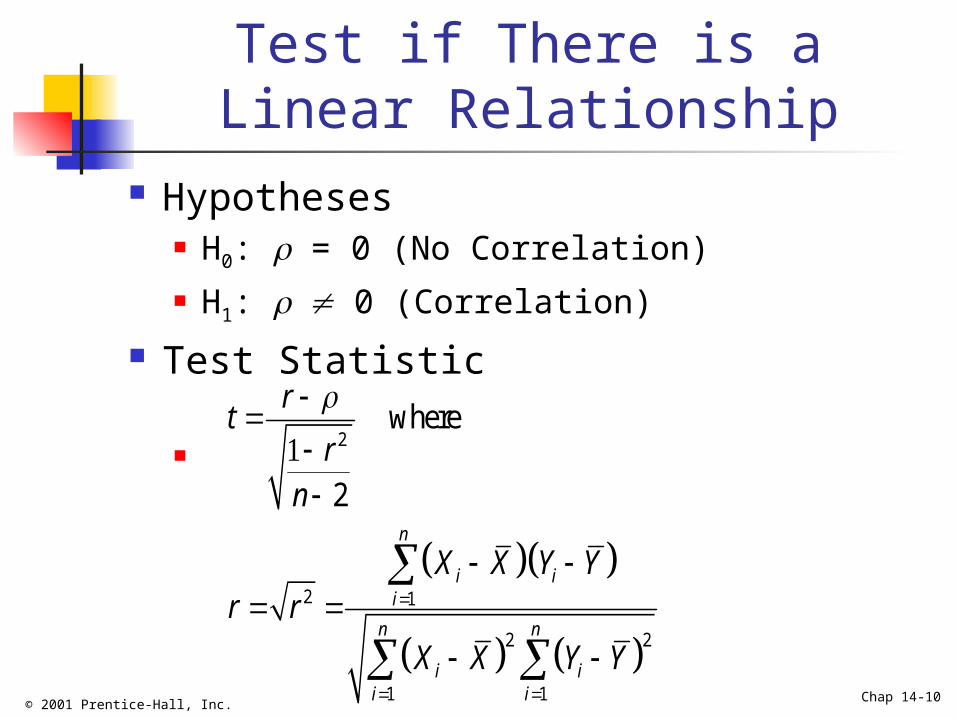
Test if There is a Linear Relationship
Hypotheses H0: = 0 (No Correlation) H1: 0 (Correlation)
Test Statistic
2
2 1
2 2
1 1
where
2n
i ii
n n
i ii i
rt
rn
X X Y Yr r
X X Y Y
© 2001 Prentice-Hall, Inc. Chap 14-11
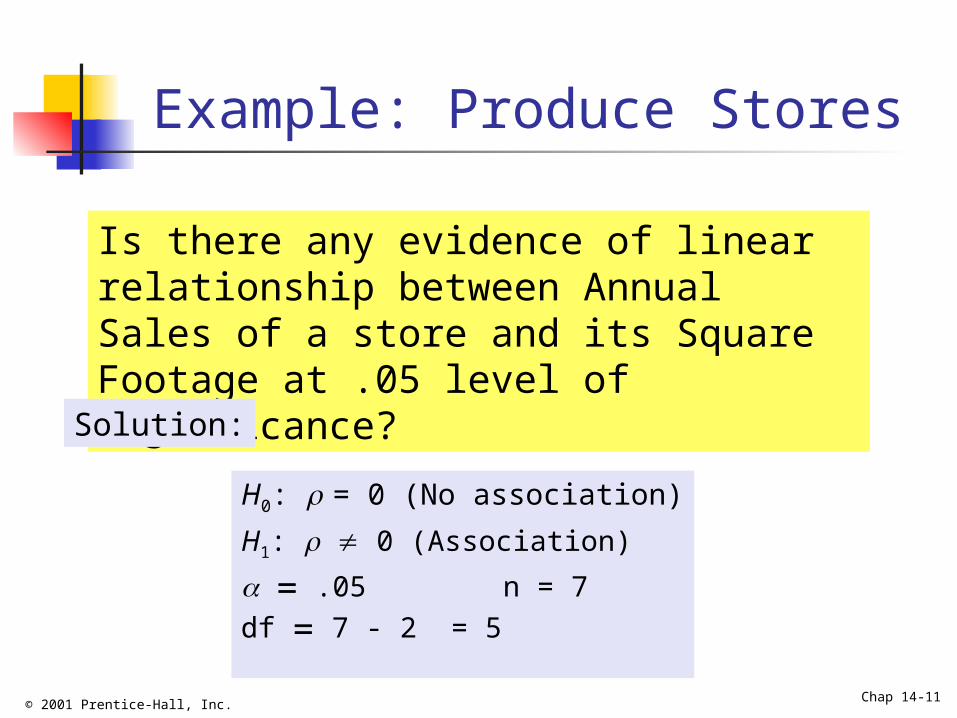
Example: Produce Stores
Is there any evidence of linear relationship between Annual Sales of a store and its Square Footage at .05 level of significance?
H0: = 0 (No association)
H1: 0 (Association)
.05 n = 7df 7 - 2 = 5
Solution:
© 2001 Prentice-Hall, Inc. Chap 14-12
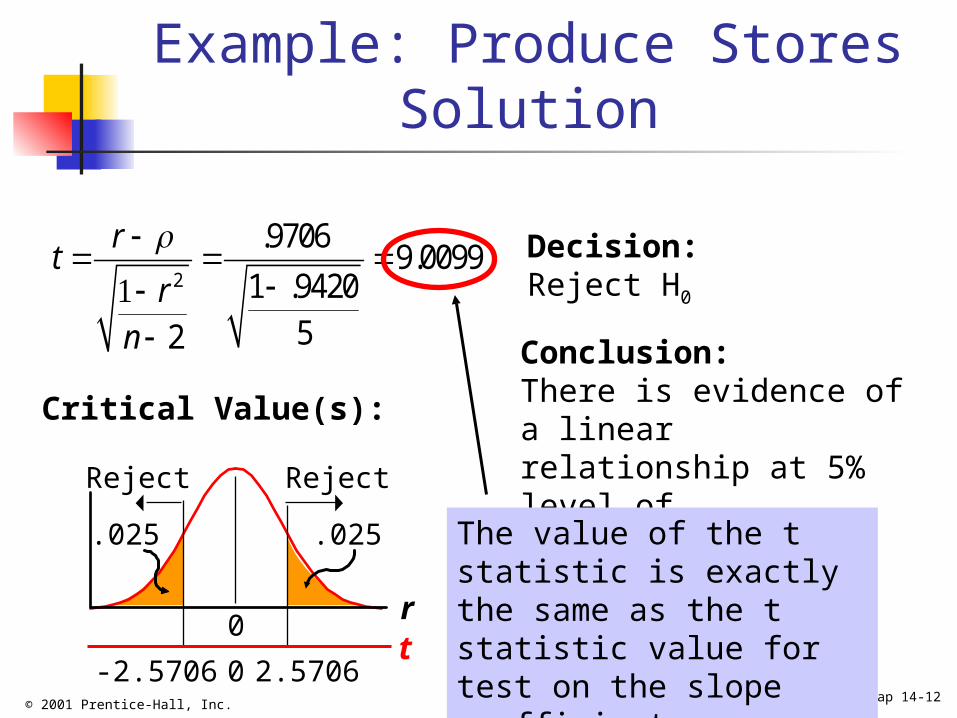
Example: Produce Stores Solution
0 2.5706-2.5706
.025
Reject Reject
.025
Critical Value(s):
Conclusion:There is evidence of a linear relationship at 5% level of significance
Decision:Reject H0
2
.97069.0099
1 .942052
rt
rn
The value of the t statistic is exactly the same as the t statistic value for test on the slope coefficient
r0
t
© 2001 Prentice-Hall, Inc. Chap 14-13
Simple Linear Regression in PHStat
In Excel, use PHStat | Regression | Simple Linear Regression …
EXCEL Spreadsheet of Regression Sales on Footage
Microsoft Excel Worksheet
© 2001 Prentice-Hall, Inc. Chap 14-14
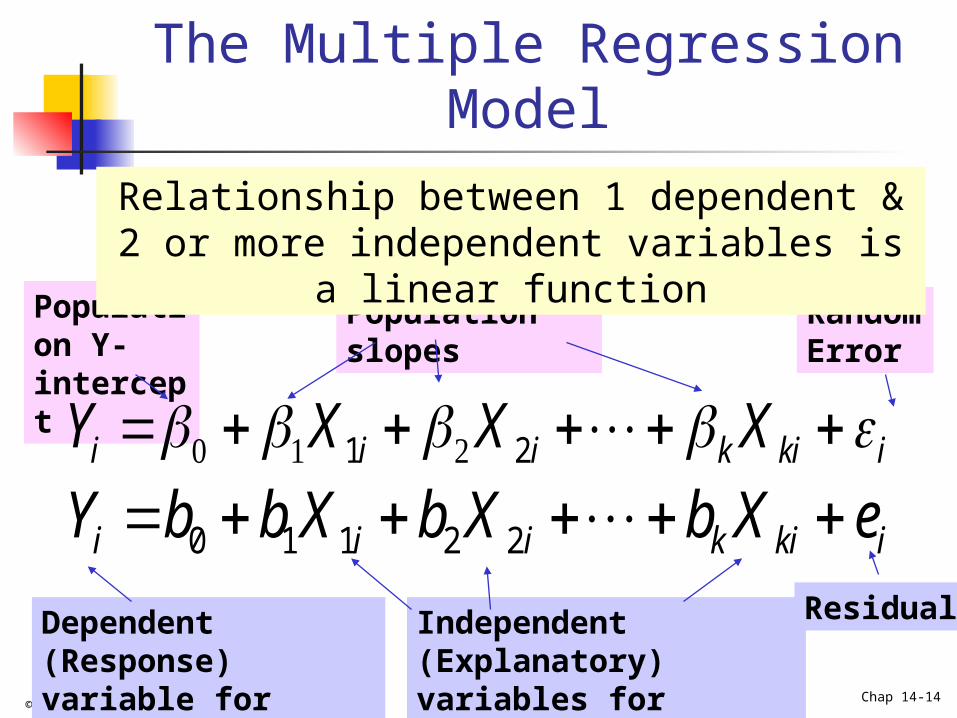
0 1 1 2 2i i i k ki iY b b X b X b X e
Population Y-intercept
Population slopes Random Error
The Multiple Regression Model
Relationship between 1 dependent & 2 or more independent variables is a linear
function
Dependent (Response) variable for sample
Independent (Explanatory) variables for sample model
1 2i i i k ki iY X X X
Residual
© 2001 Prentice-Hall, Inc. Chap 14-15
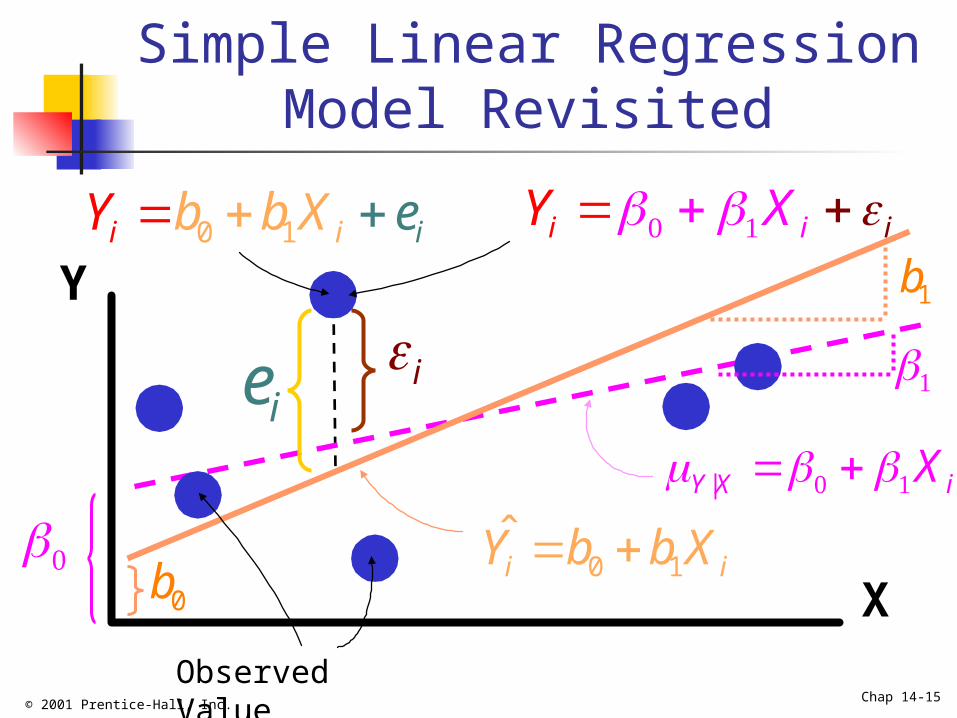
Simple Linear Regression Model Revisited
Y
XObserved Value
|Y X iX
i
ii iY X
0 1i iY b b X
ie
0 1i iib bY X e 1b
0b
© 2001 Prentice-Hall, Inc. Chap 14-16
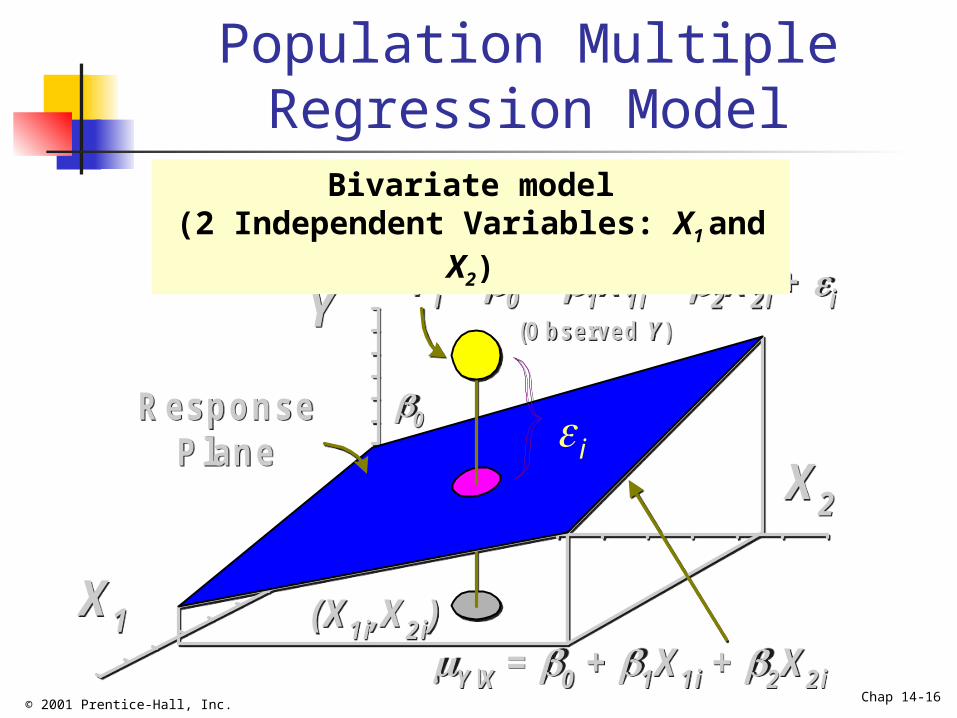
Population Multiple Regression Model
X2
Y
X1Y|X = 0 + 1X 1i + 2X 2i
0
Y i = 0 + 1X 1i + 2X 2i + i
ResponsePlane
(X 1i,X 2i)
(O bserved Y )
i
X2
Y
X1Y|X = 0 + 1X 1i + 2X 2i
0
Y i = 0 + 1X 1i + 2X 2i + i
ResponsePlane
(X 1i,X 2i)
(O bserved Y )
i
Bivariate model(2 Independent Variables: X1 and X2)
i
© 2001 Prentice-Hall, Inc. Chap 14-17
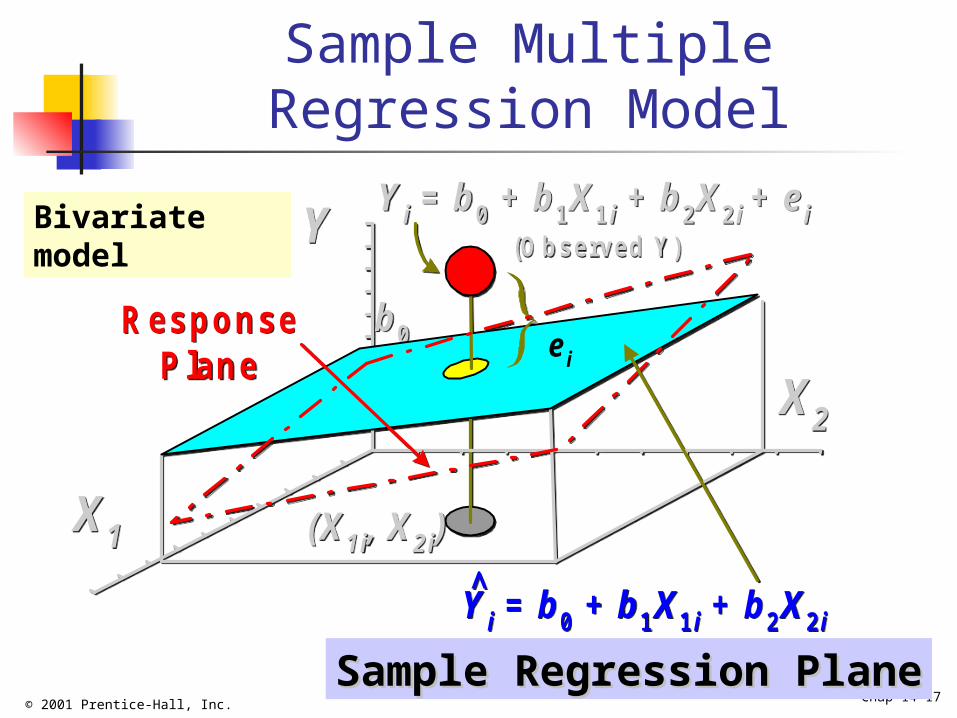
Sample Multiple Regression Model
X2
Y
X1
b0
Y i = b0 + b1X 1 i + b2X 2 i + e i
ResponsePlane
(X 1i, X 2i)
(O bserved Y)
^
e i
Y i = b0 + b1X 1 i + b2X 2 i
X2
Y
X1
b0
Y i = b0 + b1X 1 i + b2X 2 i + e i
ResponsePlane
(X 1i, X 2i)
(O bserved Y)
^
e i
Y i = b0 + b1X 1 i + b2X 2 i
Bivariate model
Sample Regression PlaneSample Regression Plane
© 2001 Prentice-Hall, Inc. Chap 14-18
Multiple Linear Regression Equation
Too complicated
by hand! Ouch!
© 2001 Prentice-Hall, Inc. Chap 14-19
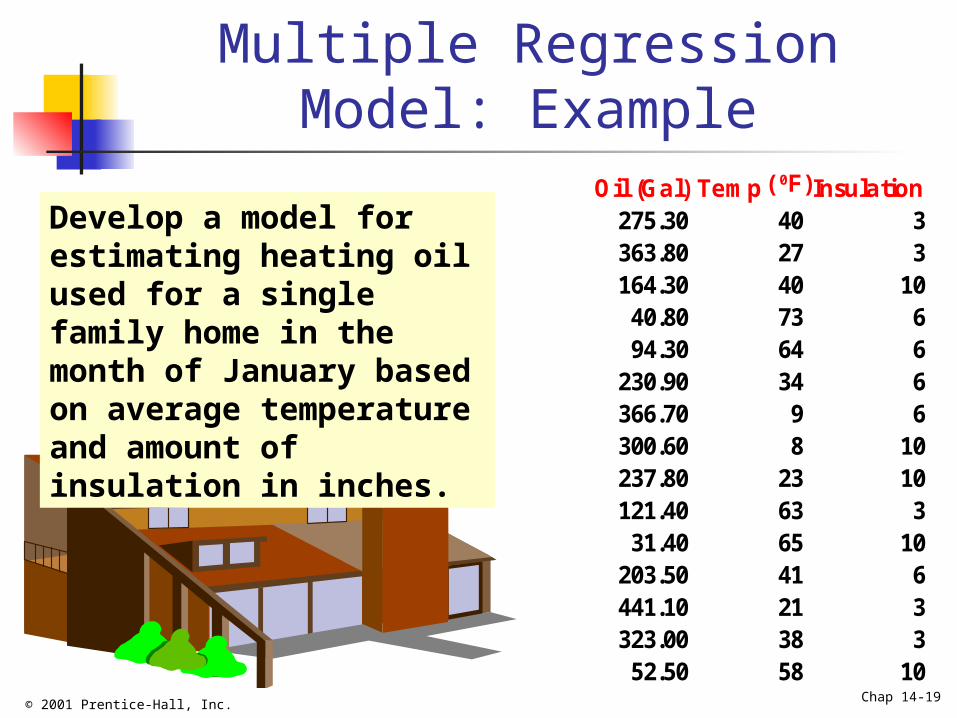
Multiple Regression Model: Example
Oil (Gal) Temp Insulation275.30 40 3363.80 27 3164.30 40 1040.80 73 694.30 64 6
230.90 34 6366.70 9 6300.60 8 10237.80 23 10121.40 63 331.40 65 10
203.50 41 6441.10 21 3323.00 38 352.50 58 10
(0F)
Develop a model for estimating heating oil used for a single family home in the month of January based on average temperature and amount of insulation in inches.
© 2001 Prentice-Hall, Inc. Chap 14-20
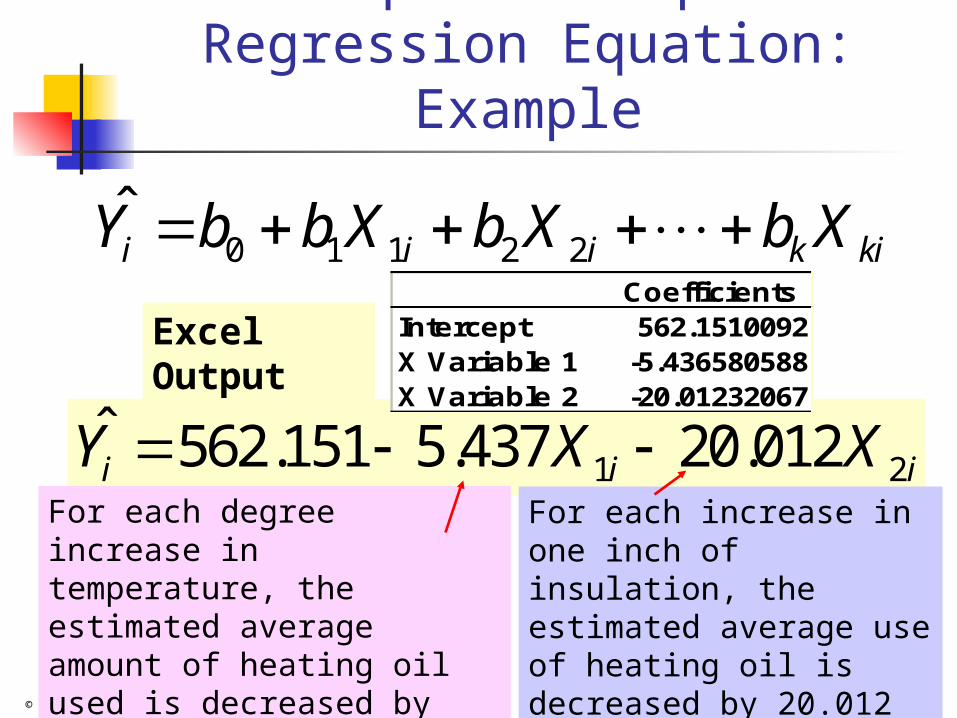
1 2ˆ 562.151 5.437 20.012i i iY X X
Sample Multiple Regression Equation: Example
CoefficientsIntercept 562.1510092X Variable 1 -5.436580588X Variable 2 -20.01232067
Excel Output
For each degree increase in temperature, the estimated average amount of heating oil used is decreased by 5.437 gallons, holding insulation constant.
For each increase in one inch of insulation, the estimated average use of heating oil is decreased by 20.012 gallons, holding temperature constant.
0 1 1 2 2i i i k kiY b b X b X b X
© 2001 Prentice-Hall, Inc. Chap 14-21
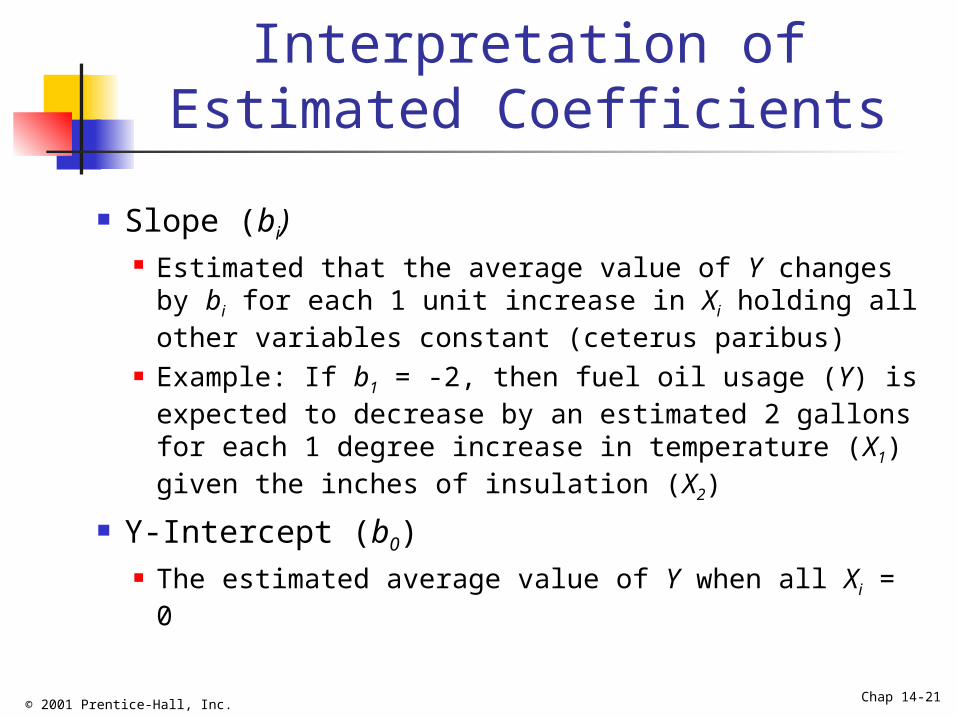
Interpretation of Estimated Coefficients
Slope (bi) Estimated that the average value of Y changes
by bi for each 1 unit increase in Xi holding all other variables constant (ceterus paribus)
Example: If b1 = -2, then fuel oil usage (Y) is expected to decrease by an estimated 2 gallons for each 1 degree increase in temperature (X1) given the inches of insulation (X2)
Y-Intercept (b0) The estimated average value of Y when all Xi = 0
© 2001 Prentice-Hall, Inc. Chap 14-22
Multiple Regression in PHStat
PHStat | Regression | Multiple Regression …
EXCEL spreadsheet for the heating oil example.
Microsoft Excel Worksheet
© 2001 Prentice-Hall, Inc. Chap 14-23
Summary
Discussed Correlation - Measuring the Strength of the Association
Developed The Multiple Regression Model
Recommended