Embed Size (px)
Citation preview

ZTO ExpressQ4 and Fiscal Year 2016
Investor Relations
Presentation
February 28, 2017
2
This presentation contains “forward-looking” statements within the meaning of Section 27A of the Securities Act of 1933,
as amended, and Section 21E of the Securities Exchange Act of 1934, as amended, and as defined in the Private
Securities Litigation Reform Act of 1995. These forward-looking statements include but are not limited to our unaudited
results for the fourth quarter of 2016, our management quotes and our financial outlook for the first quarter of 2017.
Our forward-looking statements are not historical facts but instead represent only our belief regarding expected results
and events, many of which, by their nature, are inherently uncertain and outside of our control. Our actual results and
other circumstances may differ, possibly materially, from the anticipated results and events indicated in these forward-
looking statements. Announced results for the fourth quarter of 2016 are preliminary, unaudited and subject to audit
adjustment. In addition, we may not meet our financial outlook for the first quarter of 2017 and may be unable to grow our
business in the manner planned. We may also modify our strategy for growth. In addition, there are other risks and
uncertainties that could cause our actual results to differ from what we currently anticipate, including those relating to the
development of the e-commerce industry in China, our significant reliance on the Alibaba ecosystem, risks associated
with our network partners and their employees and personnel, intense competition which could adversely affect our
results of operations and market share, any service disruption of our sorting hubs or the outlets operated by our network
partners or our technology system. For additional information on these and other important factors that could adversely
affect our business, financial condition, results of operations, and prospects, please see our filings with the U.S.
Securities and Exchange Commission.
All information provided in this presentation is as of the date of the presentation. We undertake no obligation to update
any forward-looking statement, whether as a result of new information, future events or otherwise, after the date of this
release, except as required by law.
Safe Harbor Statement and Disclaimer

3
Q4 and Fiscal Year 2016 Key Highlights
Superior ProfitabilitySignificant Scale Robust Growth
4,200+ Line-haul
Vehicles(1)
Notes
1. Includes over 2,930 self-owned trucks as of December 31, 2016, an increase from over 2,400 self-owned trucks as of September 30, 2016, among which 1,145 are high capacity, 15-17 meter long trucks, as
of December 31, 2016, compared to over 820 as of September 30, 2016.
2. Number of total service outlets across entire network as of December 31, 2016, an increase from about 25,000 service outlets as of September 30, 2016.
3. Includes 69 self-operated sorting hubs, and 6 sorting hubs operated by our network partners.
~26,000 Pickup/Delivery
Outlets(2)
75 Sorting Hubs(3)
1,484mparcel volume in
Q4 2016
4,498m parcels in FY2016
46% YoY
revenue growth in
Q4 2016
51% YoY
operating profit
growth in Q4 2016
RMB976moperating profit with
operating margin of
31% in Q4 2016
RMB740mnet income with net
margin of
23% in Q4 2016
RMB1.04basic and diluted
earnings per ADS in
Q4 2016
44% YoY
parcel volume
growth in Q4 2016
53% YoY
parcel volume
growth in FY2016
35% basic and
diluted earnings
per ADS YoY
growth in 2016

4
What We Do
“ZTO Express” Brand
Integrated IT Platform
Service Standardization
Delivery
Outlets
Sorting
Hubs
Sorting
Hubs
Line-haul
TransportationEnd customers
RecipientsPickup
Outlets
Core Express Delivery Network
Network
Partners
First-Mile Pickup Last-Mile Delivery
Network
Partners
Who We Are
We are a leading express delivery company in China focusing on providing timely and
reliable services through our highly scalable network partner model

5
Huge Market Opportunities from E-commerce Growth
Source: CNNIC, iResearch Report
20113.7 Billion
201520.7 Billion
2020E70.0 Billion
2011US$122 Billion
2015US$609 Billion
2020EUS$1,465 Billion
CAGR
49%
CAGR
19%
CAGR
54%
CAGR
27.6%
Source: The 13th Five-Year Plan issued by China Post Bureau.
Online Retail Sales (GMV) in China Express Delivery Parcel Volume in China

6
182
361
2015 2016E
5.0
11.5
2015 2020E
China Micro
Merchants(1) MarketChina Cross-Border
E-commerce Market
Significant Growth Potential from New Market Segments
Source iResearch Report
GMV (RMB trillion)
Source Internet Society of China
GMV (RMB billion)
18%CAGR
98%Growth
Note
1. Micro merchants refer to online merchants who promote and sell merchandise on social networking and other mobile platforms

7
Our Scale Strengthens Our Leading Market Position(1)
Notes
1. Data presented as of December 31, 2016 unless otherwise indicated
2. “Parcel volume” in any given period is defined as the number of parcels collected by our network partners using our waybills
3. Includes 69 self-operated sorting hubs, and 6 sorting hubs operated by our network partners
4. Includes ~2,930 self-owned vehicles and ~1,270 vehicles owned and operated by Tonglu Tongze Logistics Ltd., an entity majority owned by our employees
5. Only includes line-haul routes between sorting hubs as of December 31, 2016
6. Includes over 3,600 direct network partners and around 5,500 indirect network partners as of December 31, 2016
7. As of December 31, 2016,
>96% Cities and
Counties Covered
4,200+
Line-haul Vehicles(4)
1,980+
Line-haul
Routes(5)
~26,000
Pickup/Delivery
Outlets
17,300+
Direct
Employees(7)
75
Sorting Hubs(3)
4,498MM
Parcels(2) in 2016
~9,100
Network
Partners(6)

8
Key Differentiation from Our Competitors
Shared Success
System
Key regional managers are
also the shareholders of ZTO
Well-established network
partner entry and exit
mechanism
Well-Balanced
Network
Sophisticated last-mile
delivery fee and transit
fee mechanism tailored
for local conditions
Operating
Efficiency
Centralized planning of
sorting hubs enabling us to
accommodate high capacity
vehicles
Increasing use of self-owned
fleet, particularly large trailer
trucks
$
Industry leading service
quality in terms of overall
customer satisfaction(1), 72-
hour punctuality rate(2), and
customer complaint rate(2)
Superior Service
Quality
Notes
1. According to Horizon Consulting Group for 2015
2. According to State Post Bureau for 2015

9
Our Growth Strategies to Capture the Market Opportunities
Strengthen our
leading market
position in
China
Expand
presence in
cross-border
e-commerce
express delivery
Broaden
service
offerings and
expand
customer baseEnhance
technology
platform and
infrastructure
Long-term Vision
Become a leading
global logistic
service provider
Invest in Information
Technology
Increase Urban
Coverage Density
Increase the Level of
Sorting Automation
Expand and Upgrade
Line-haul Fleet
Build and Upgrade
Sorting Hubs
Nea
r Te
rm In
itia
tive
s
Increase Rural
Penetration

10
Key Financial Highlights for Q4 2016(1)(2)
Parcel Volume
1,484m
+44.2% YoY
Robust
Growth
Notes1. Total revenue and margins refer to the quarter ended Dec 31, 2016.2. All Margins are calculated as a % of total revenue.3. Net income for the fourth quarter of 2015 included a RMB224 million gain on deemed disposal of equity method investments. Excluding the impact of that factor, the net margin in the fourth quarter of 2015
would have been around 21.9%.4. Net income adjusted for share-based compensation expenses and gain on deemed disposal of equity method investments, if any.
Superior
Profitability
Revenue
RMB3,191m
+45.8% YoY
Income from
Operations
RMB976m
+51.2% YoY
Operating Margin
30.6% vs. 29.5% in
Q4 2015
Net Margin
23.2% vs. 32.1% in
Q4 2015(3)
Adjusted Net
Income(4)
RMB740m
+52.7% YoY

11
1,128 1,358 1,412
2,188 1,959
2,287 2,353
3,191
Q1 2015 Q2 2015 Q3 2015 Q4 2015 Q1 2016 Q2 2016 Q3 2016 Q4 2016
Strong Revenue Growth Driven by Robust Parcel Volume
Growth
Parcel Volume Total Revenue
Quarterly Parcel Volume Quarterly Revenue
1,816
2,946
4,498
2014 2015 2016
62%YoY
Growth
53%YoY
Growth
(RMB million)
498
687 732
1,029
828
1,085 1,102
1,484
Q1 2015 Q2 2015 Q3 2015 Q4 2015 Q1 2016 Q2 2016 Q3 2016 Q4 2016
(Parcel volume in millions)
(RMB million)
3,904
6,086
9,789
2014 2015 2016
(Parcel volume in millions)
56%YoY
Growth
61%YoY
Growth
YoY Growth 74% 68% 67%YoY Growth 46%58%66% 51% 44%
12
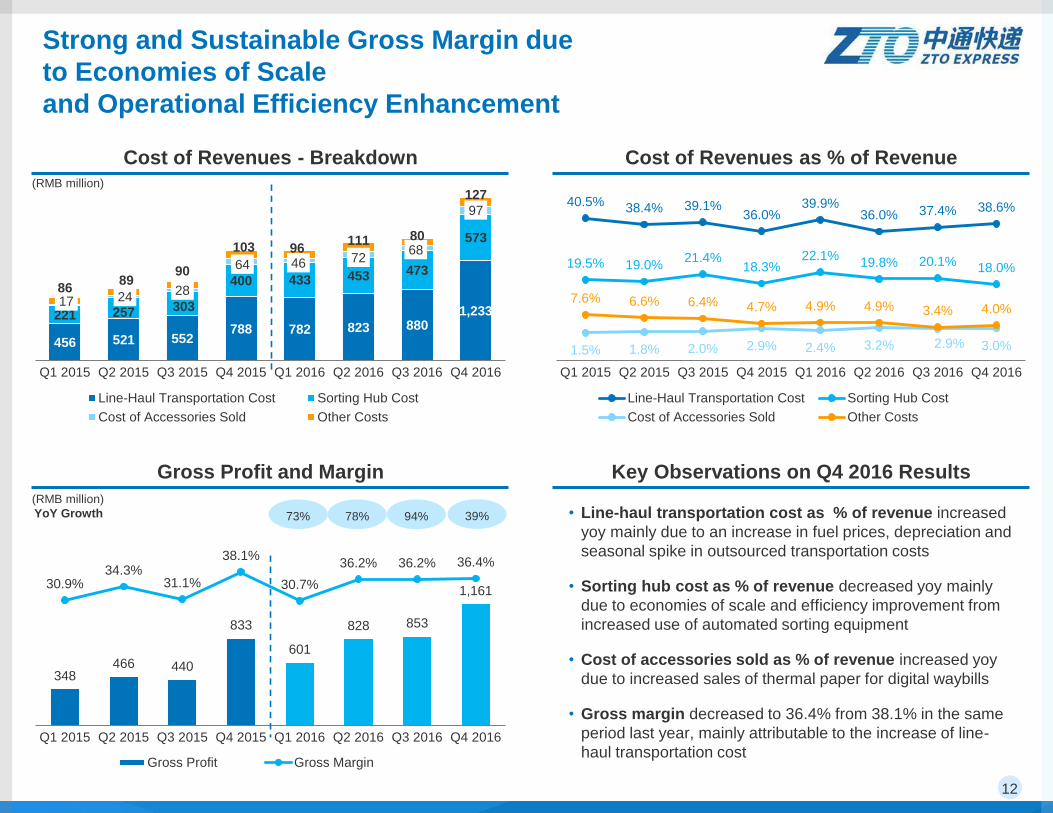
Strong and Sustainable Gross Margin due
to Economies of Scale
and Operational Efficiency Enhancement
Cost of Revenues - Breakdown Cost of Revenues as % of Revenue
Gross Profit and Margin Key Observations on Q4 2016 Results
456 521 552 788 782 823 880
1,233 221 257 303
400 433 453 473
573
17 24 28
64 46 72 68
97
86 89
90
103 96 111 80
127
Q1 2015 Q2 2015 Q3 2015 Q4 2015 Q1 2016 Q2 2016 Q3 2016 Q4 2016
Line-Haul Transportation Cost Sorting Hub Cost
Cost of Accessories Sold Other Costs
40.5% 38.4% 39.1%36.0%
39.9%36.0% 37.4% 38.6%
19.5% 19.0%21.4%
18.3%22.1%
19.8% 20.1% 18.0%
1.5% 1.8% 2.0% 2.9% 2.4% 3.2% 2.9% 3.0%
7.6% 6.6% 6.4% 4.7% 4.9% 4.9% 3.4% 4.0%
Q1 2015 Q2 2015 Q3 2015 Q4 2015 Q1 2016 Q2 2016 Q3 2016 Q4 2016
Line-Haul Transportation Cost Sorting Hub Cost
Cost of Accessories Sold Other Costs
348 466 440
833
601
828 853
1,161 30.9%
34.3%31.1%
38.1%
30.7%
36.2% 36.2% 36.4%
Q1 2015 Q2 2015 Q3 2015 Q4 2015 Q1 2016 Q2 2016 Q3 2016 Q4 2016
Gross Profit Gross Margin
• Line-haul transportation cost as % of revenue increased
yoy mainly due to an increase in fuel prices, depreciation and
seasonal spike in outsourced transportation costs
• Sorting hub cost as % of revenue decreased yoy mainly
due to economies of scale and efficiency improvement from
increased use of automated sorting equipment
• Cost of accessories sold as % of revenue increased yoy
due to increased sales of thermal paper for digital waybills
• Gross margin decreased to 36.4% from 38.1% in the same
period last year, mainly attributable to the increase of line-
haul transportation cost
YoY Growth 73% 78% 94%
(RMB million)
(RMB million)
39%
13
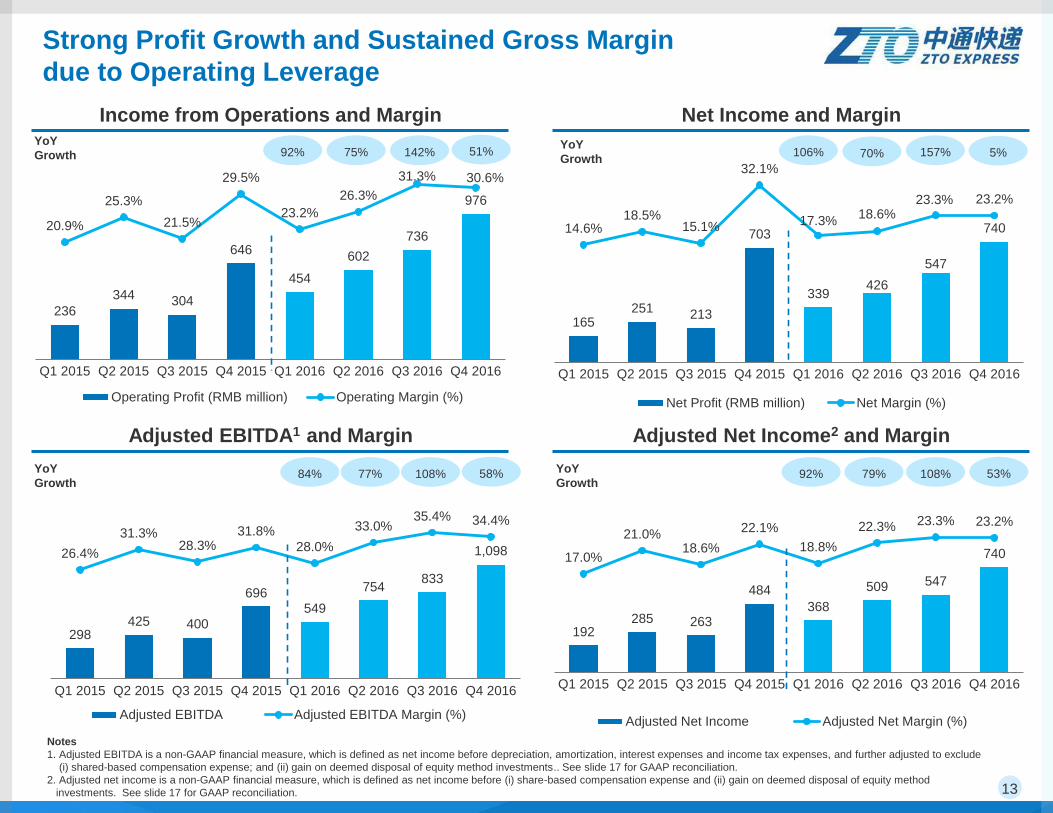
165 251 213
703
339 426
547
740 14.6%18.5%
15.1%
32.1%
17.3%18.6%
23.3% 23.2%
Q1 2015 Q2 2015 Q3 2015 Q4 2015 Q1 2016 Q2 2016 Q3 2016 Q4 2016
Net Profit (RMB million) Net Margin (%)
192 285 263
484
368
509 547
740 17.0%
21.0%18.6%
22.1%
18.8%
22.3% 23.3% 23.2%
Q1 2015 Q2 2015 Q3 2015 Q4 2015 Q1 2016 Q2 2016 Q3 2016 Q4 2016
Adjusted Net Income Adjusted Net Margin (%)
298 425 400
696 549
754 833
1,098 26.4%
31.3%28.3%
31.8%
28.0%
33.0%35.4% 34.4%
Q1 2015 Q2 2015 Q3 2015 Q4 2015 Q1 2016 Q2 2016 Q3 2016 Q4 2016
Adjusted EBITDA Adjusted EBITDA Margin (%)
236
344 304
646
454
602
736
976
20.9%
25.3%
21.5%
29.5%
23.2%
26.3%
31.3% 30.6%
Q1 2015 Q2 2015 Q3 2015 Q4 2015 Q1 2016 Q2 2016 Q3 2016 Q4 2016
Operating Profit (RMB million) Operating Margin (%)
Strong Profit Growth and Sustained Gross Margin
due to Operating Leverage
Income from Operations and Margin Net Income and Margin
Adjusted EBITDA1 and Margin Adjusted Net Income2 and Margin
Notes
1. Adjusted EBITDA is a non-GAAP financial measure, which is defined as net income before depreciation, amortization, interest expenses and income tax expenses, and further adjusted to exclude
(i) shared-based compensation expense; and (ii) gain on deemed disposal of equity method investments.. See slide 17 for GAAP reconciliation.
2. Adjusted net income is a non-GAAP financial measure, which is defined as net income before (i) share-based compensation expense and (ii) gain on deemed disposal of equity method
investments. See slide 17 for GAAP reconciliation.
YoY
Growth84% 77% 108% YoY
Growth92% 79% 108%
YoY
Growth106% 70% 157%
YoY
Growth 92% 75% 142% 51% 5%
58% 53%
14
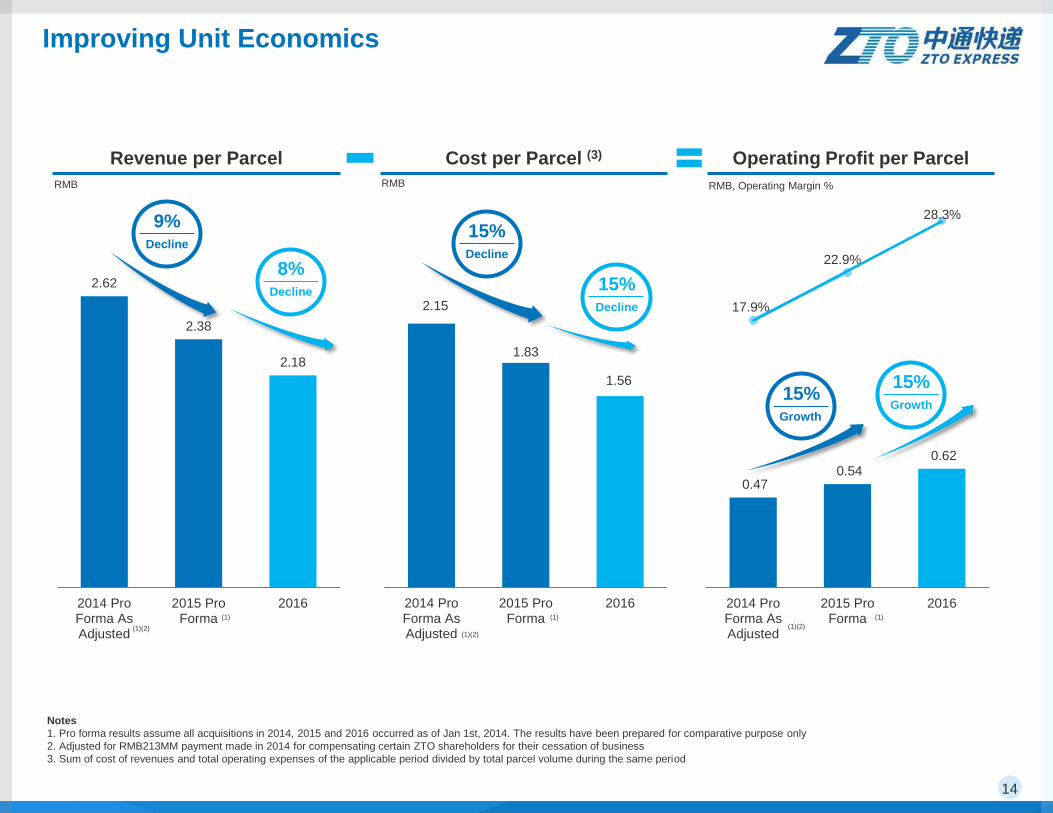
2.15
1.83
1.56
2014 ProForma AsAdjusted
2015 ProForma
2016
2.62
2.38
2.18
2014 ProForma AsAdjusted
2015 ProForma
2016
RMB
0.47 0.54
0.62
17.9%
22.9%
28.3%
2014 ProForma AsAdjusted
2015 ProForma
2016
RMB RMB, Operating Margin %
(1)(2)
(1) (1) (1)
9%Decline
8%Decline
15%Decline
15%Decline
15%Growth
(1)(2)(1)(2)
Improving Unit Economics
Notes
1. Pro forma results assume all acquisitions in 2014, 2015 and 2016 occurred as of Jan 1st, 2014. The results have been prepared for comparative purpose only
2. Adjusted for RMB213MM payment made in 2014 for compensating certain ZTO shareholders for their cessation of business
3. Sum of cost of revenues and total operating expenses of the applicable period divided by total parcel volume during the same period
Revenue per Parcel Cost per Parcel (3) Operating Profit per Parcel
15%Growth

15
619
1,062
1,986
172
414
703
2014 2015 2016
Purchases of Land Use Rights
Purchases of Property, Equipment and Vehicles
Strong Cash Flow and Increased Investment in
Capacity Expansion
Operating Cash Flow Capital Expenditure Cash and Cash Equivalents(1)
(RMB million)(RMB million)
1,072
1,868
2,537
2014 2015 2016
163
2,452
11,288
2014 2015 2016
(RMB million)
74%Growth
36%Growth
791
1,476
2,689
Note (1): Cash and cash equivalents as of December 31, 2016 included net proceeds of about RMB9.2bn from the public offering, but excluded restricted cash of RMB635m
(2015: RMB266m).
87%Growth
82%Growth

16
For the Three Months Ended
Dec. 31, 2015 Dec. 31, 2016
Adjusted EBITDA RMB million RMB million
Net Income 703 740
Add: Depreciation 37 99
Add: Amortization 4 7
Add: Interest Expenses 4 1
Add: Income Tax Expenses 166 251
EBITDA 914 1,098
Add: Share-based Compensation Expense 6 -
Less: Gain on Deemed Disposal of Equity Method Investments (224) -
Adjusted EBITDA 696 1,098
Adjusted EBITDA margin 32% 34%
Adjusted Net Income
Net Income 703 740
Add: Share-based Compensation Expense 6 -
Less: Gain on Deemed Disposal of Equity Method Investments (224) -
Adjusted Net Income 485 740
Adjusted Net Margin 22% 23%
Reconciliation of GAAP to Adjusted / Non-GAAP Measures
Note: Numbers may not add up due to rounding

17
2015 2016
Mar 31,
2015
Jun 30,
2015
Sep 30,
2015
Dec 31,
2015
Mar 31,
2016
Jun 30,
2016
Sep 30,
2016
Dec 31,
2016
Adjusted EBITDA RMB ‘000 RMB ‘000 RMB ‘000 RMB ‘000 RMB ‘000 RMB ‘000 RMB ‘000 RMB ‘000
Net Income164,773 250,647 213,147 703,051 338,814 425,802 547,177 739,811
Add: Depreciation33,290 35,356 39,217 37,413 51,008 62,453 89,174 99,032
Add: Amortization2,744 2,854 3,026 4,156 4,688 5,349 6,310 6,963
Add: Interest Expenses4,142 4,294 4,293 3,663 3,644 4,742 3,766 834
Add: Income Tax Expenses65,836 97,626 90,323 166,214 122,018 171,954 186,468 251,547
EBITDA270,785 390,777 350,006 914,497 520,172 670,300 832,895 1,098,187
Add: Share-based Compensation Expense27,136 33,927 50,141 5,596 38,634 83,366 251 251
Less: Gain on Deemed Disposal of Equity
Method Investments - - - (224,148) (9,551) - - -
Adjusted EBITDA297,921 424,704 400,147 695,945 549,255 753,666 833,146 1,098,438
Adjusted EBITDA margin 26.4% 31.3% 28.3% 31.8% 28.0% 33.0% 35.4% 34.4%
Adjusted Net Income RMB ‘000 RMB ‘000 RMB ‘000 RMB ‘000 RMB ‘000 RMB ‘000 RMB ‘000 RMB ‘000
Net Income164,773 250,647 213,147 703,051 338,814 425,802 547,177 739,881
Add: Share-based Compensation Expense27,136 33,927 50,141 5,596 38,634 83,366 251 251
Less: Gain on Deemed Disposal of Equity
Method Investments - - - (224,148) (9,551) - - -
Adjusted Net Income191,909 284,574 263,288 484,499 367,897 509,168 547,428 740,062
Adjusted Net Margin 17.0% 21.0% 18.6% 22.1% 18.8% 22.3% 23.3% 23.2%
Reconciliation of GAAP to Adjusted / Non-GAAP Measures
Note: Numbers may not add up due to rounding


![Q4 '07 Financial details Market up date [Read-Only] NOK Million Q4 2007 Q4 2006 Change Operating revenue 6 956 7 704 (747) Distribution costs (592) (630) 39 Cost of materials (3 709)](https://img.pdfslide.us/doc/110x75/5fb28c12d9bc73724f1f9ecf/q4-07-financial-details-market-up-date-read-only-nok-million-q4-2007-q4-2006.jpg)