Embed Size (px)
Citation preview
c
c
Theràal Anneal1ng and Superconductivi ty
in
- ---"'-------
zr Based Metallic Glasses
\
Thesis by
Gillian E. Marshall
In partial fulf1l1ment of
the requirements for the
Degree of Master of Science
Department of Physics
McGill University
Montreal, Ouebec
1986
(submitted May 28, 1986)
(
•
J
•
...
o , -~ ~I
..
for
David V. Baxter
It vas the bes t of tlmes, (
it vas the vorst of tilDes,
rI it vas the age of visdom,
i t vas the age of foolishness
. Charles Dickens
i'
c
c
·Ui-
AbstrAct
"
The effects of anneallng of the superconduct1ng transition
telllperatur~ of zirconium- based metallic glasses ·were studied. Kostly
binary glasses vere examined; the' second elemen t vas one of Cu, Ni, Co, or
Fe. Both Irreversible and reversible structural relaxation processes vere -examined.
For Fe-Zr in the range 75-80 at% Zr' Tc demonstrates an ini Hal
ç~
Irreversible increase upon annealing at 488 K. Inclusion of spin-
fluctua!10l\s into the McMll}an equation account for both the behavlour of
Fe-Zr .and trends in Tc vi th changes in composition.
S tudies on the revers i ble componen t shov tha t ve~y small reversi ble
'. changes in Tc may be effec te'd 1n Cu-Zr and Ni-Zr, none in ei ther Fe-Zr:, or
Co-Zr. This contrast may be understood in terms of different rates of
a~~mic diffusion.
- .
IJ
\

•
o
·1 v·
Résumé
On a etudié les effets de recuits à basses températures sur la
, , temperature cri tique de metaux amorphes supraconducteurs contenant du
zirconium. La plupart des alliages étudiés étaient binaires et le
deuxième élément était parmi les suivants: Cu, Ni, Co, ou Fe. "On a
observé des changements réversibles et ir-réversibles.
Pour Fe-Zr avec 75-80 at% Zr, il y a une augmentation de Tc
irréversible quand l'échantillon est recuit a 488 K pourcde courtes ~
périodes de temps. L'inclusion de fluctuations de spin dans l'équation de
HcMillan explique bien comment se comporte Fe· Zr, et explique aussi les
changements de Tc pour les autres a111ageS\
Des petits changements réversibles de T ont été remarqués dans Cu-Zr c
" " , et Ni-Zr, mais n'ont pas ete remarques dans Fe-Zr ou Co-Zr. Ces
différences peuvent être attribuées aux différentes vitesses de diffusion
d~es atomes dans ces quatres types de métaux amorphes.
•
, ,

ri -v·
c ,
~! ACknowledgements
l,'
1, vould l1ke to acknowledge the support of both Professor John \
Strom-dlsen and Dr. Zaven Altounian, for providing the opportun! ty to
1
-perform thls researeh and for introduclng me to the field of metaIlle
glasses.
l would a~so like to express my thanks for the teehnical support of
Prank VanGills. In preparing the manuscript, help yi th the IBM Yord
processor from Hazel Carine!, Professor Mark Sut ton and Ian Graham yas
greatly apprec1ated. l could not possibly overstate hoy much the
friendship and discussions vith various members of the fourth floor has
meant to me, especially Dr. David Baxter, Ian Graham, Reinhart Richter,
and Stefan· Idziak. \
l vould especially like to thank my famlly for constant
encouragement. My heartfelt thanks go out to Seidokwan, my judo club, for
throwlng me around and, from time to time, allowing me to throw them
around. In particular l thank my sensei, Don Niiya, for instilling me
vi th some measure of selfconf!dence.
Financial support was recei ved from McGlll Uni versi ty in the form of
teach!ng assistantships and a Carl Reinhardt bursary, from the Na,Fural ,
Sciences and Engineering Research Council of Canada (NSERC), and from
Ponds pour la Formation de Chercheurs et l'Aide a la Recherche (FCAR).
The flnanc1al support vas greatly appreciated.
\

o
o
·vi·
table of Contents
Abstract 111
Resume 1v
Acknovledgements v
Table of Contents vi
Lis t of Figures viii
List of Tables xi
Chapter 1 Introduction" 1 , Chapter 2 - Experimental Procedures l~
2.1 Sample Preparation 14
2.2 Differential Scanning Calorimetry
(DSC) and X-ray Diffraction 18
2.3 Anneal1ng Techniques 22
2.4 Superconducting Transition
Têmpera ture (T ) Keasuremen ts 25 c 2.5 Upper Critieal Field (He2 ) and
Susceptibility (x).Keasurements 33
Chapter 3 . Results
3.1 Irreversible Relaxation
3.1.1 Fe·Zr System
3.2 Reversible Relaxation
Chapter 4 - Discussion
4.1 Irreversible Relaxation:
Time Dependence
34
34
40
53
58
58
c
~ ,'!
'"
"
r :..., ---
-vii·
1
Table of Contents (cont.)
4.2 Irreversible Relaxation:
Changes in Parameters of
-Superconductivity
4.3 Reversible Relaxation
Chapter 5 - Conclusion J - -~
References
-_/
1
60 71
75
77
, "
, /
o /
\. 0
o
1.1
1.2
2.1
-vUi-
List of Figures
Sehematie time-temperature-transformation
(:-T-T) diagram shov}~g the 'nose' of
erystallization and the minimum cooling
rate required to avoid erystall1zation of
a sample
Schematic diagram of Meissner effect
a) a normal metai in a weak magnetic field
b) a superconductor in a veak magnetic
field, exhibiting the property of perfect
, diamagnetlsm
Helt-spinning equipment
2.2 DifferentiaI Scanning Calorlmeter (taken
directly from reference 2.3)
2.3 X - ray powder di f frac tome ter shoving the
reflectlon geometry
2.4 Horizontal furnace used for annealing
samples for tlmes exceedlng three hours /
/
2:5 Circuit for ac susceptibility bridge
2.6 Cross-section o,f the primary and secondary
coils for the ac susceptibility bridge
used to measure T _ c
2.7 Two typical Tc curves as plotted by the
X-y recorder for the susceptibllity bridge.
Notice small differences in both the height
of the transition and onset (highest)
temperature.
a) t • 20 min; anneal b) tanneal • 2.5 min.
3
8
16
20
21
23
26
27
31
•
c
,-
3.1
3.2
3.4
·lx·
List of Figures (cont.)
Graph of log tannea1 vs Tc for Fe2SZr75 12. The arrov indicates the as quenched Tc.
/ '-
Graph of log tannea1 vs Tc for Co2SZr75 • The arrov indica tes the as quenched T • c
Graph of log tanneal vs Te for Ni 2SZr7S ' The arrov indica tes the as quenched T , c
"
Graph of log tanneal vs Te for CU2SZr 75' The arrov indica tes the as quenched T , c
3.5 Graphs of log tanneal vs Te for a) Fe20ZraO #1, ~
b) Fe20ZraO #2, c) Fe22.SZr77.S' d) Fe25Zr75 •
36
37
38
39
The arrovs indicate the as quenched T , 43 c
3.6
3.7
3.8
3.9
3.10
Magnetism against field for Fe2SZr75 after subtraeting the sample holder
/"
Graph of (dUe2)
dT T c
.l
(d8e2)
Graph of dT T for Fe22.5Zr77,S' c
(dUe 2) for Graph of dT Tc Fe25Zr7S •
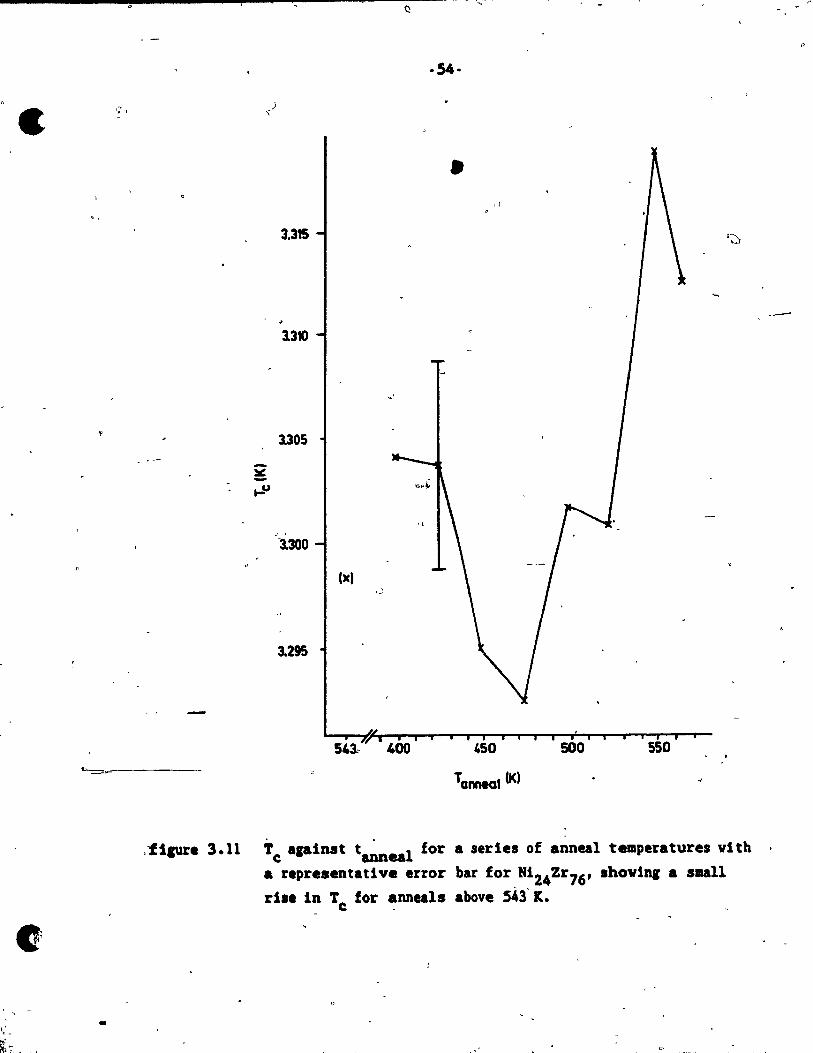
3.11 Tc a~ainst tanneal for a series of anneal
temperatures vi th a representative error bar for
N124Zr76 , shoving a sma11 rise in Tc
46
49
51
52
for anneâ"T! above 543 K. 54
-
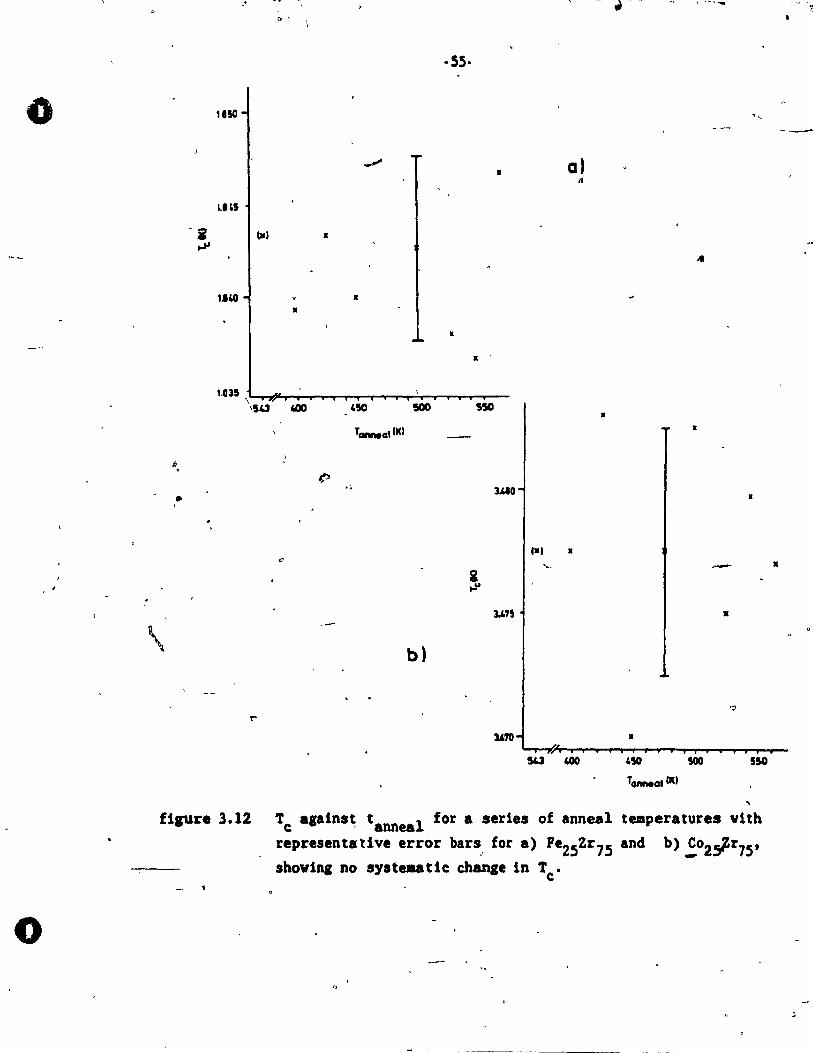
0/ 3.12
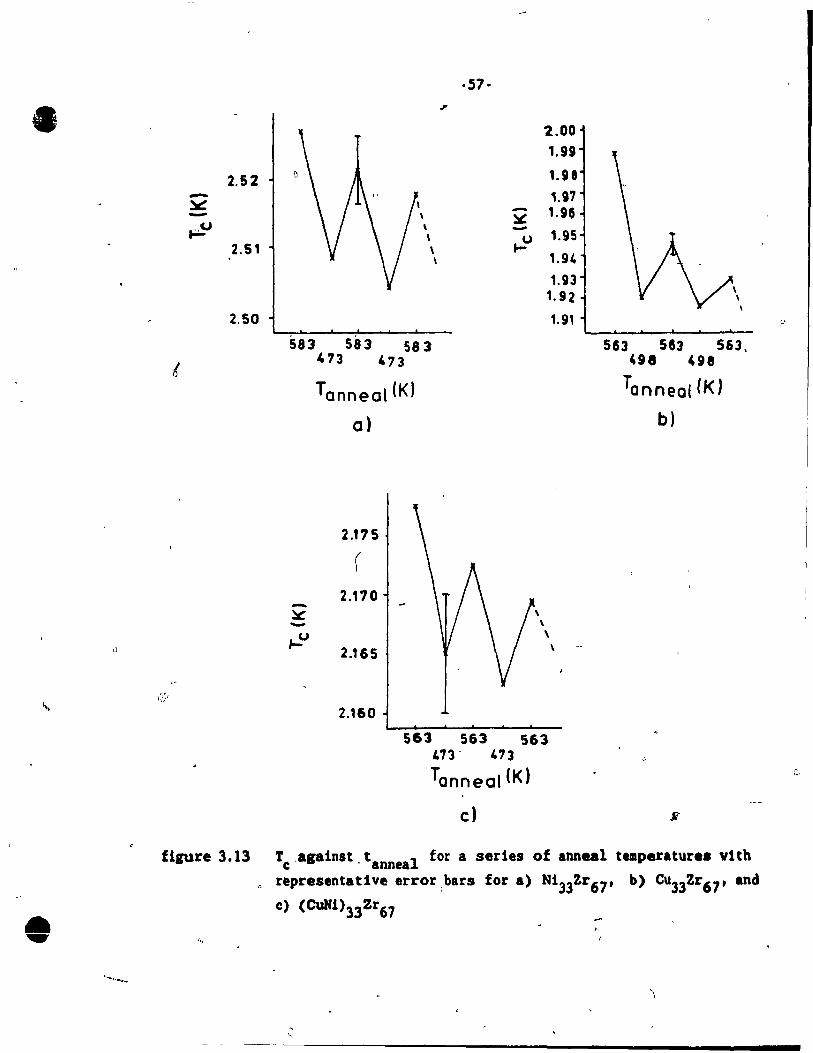
3.13
o
·x·
List of Figures (cont.)
Tc against tanneal for a series of anneal temperatures vith representative error bars for
a) Fe2SZr75 ' and b) LC~5Zr7S' showing no systematic change in T • c
T against t 1 for a series of anneal c annea temperatures vith representative error bars
for a) N133
Zr67 , b) Cu33Zr67 , and
c) (CuNi)33Zr67· />
\ \
f 55'
57 \
)
,
c
1 <
-xi-
List of Tables
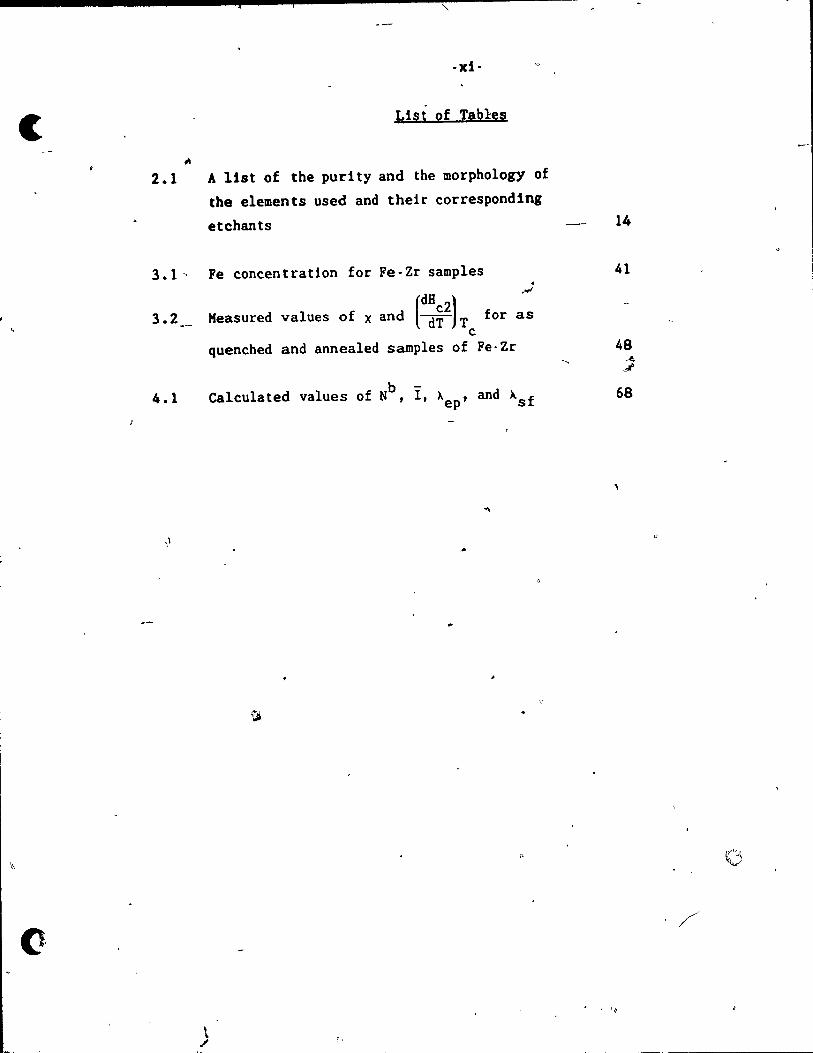
" 2.1 A list of the puri ty and the morphology of
the elements used and their correspondlng
etchants
3.1' Fe concentration for Fe-Zr samples
3.2
4.1
\ /
Heasured
quenched
(dB 2) values of x and d~ T for
c and annealed samples of Fe-Zr
as
Calculated values of Nb, Ï, Xep ' and Àsf
14
41
68
./
o·
o
·1·
Chapter 1 . Introduction
Amorphous solids are so11ds lacking long range atomic perlodicity.
They have been known to mankind for centuries, ordinary vindov glass being
a common example. Amorphous metals also lack long range atomic
periodici ty, but, as a dist inction from the broader class of amorphous
materials, a1so possess normal metallic properties. These have recently
been developed using a variety of techniques including vapour depositlon,
electrodeposition, and spu t tering. Amorphous metals vere firs t produced
using the technique of vapour deposition aB early as 1934 (1.1) • This vas
\ very interesting from the point of viey of physics, but vas not practical
due to the very small amount of material produced. This problem vas not
overcome until the advent in 1960 of methods for rapidly quenching metals
into the amorphous state from the liquid( 1.2). The most popular techniqué
of rapid quenching is the so-called "melt-spinning" technique yh{ch 1
permits the production of amorphous meta1s in industrial quantities.
Helt-spinning is the technique used to produce the metallic glasses for
this york, and is described in Chapter 2.
Metallic glasses are a subgroup of the broad clas.s of amorphous
metals. The term "metallic glass" is nov generally reserved for amorphous
metals quenched from the melt. They have recently recelved much attention
because of their interest1ng properties character1stic of an amorphous
material, coupled v1 th the possibility of production of large--quantit1ea.
'", ••
..
·2·
To produce a metallic glass an ingot of ~he desired constituent
composition is heated above the 11quid temperature and then cooled very
quickly. A very high cooling rate is required in order to undercool the
liquid belov the so-called glass temperature Tg' (defined typ~cally by the
13 viscosi ty TI ~ 10 poise) before significant nucleation of the crystal
phase occurs. The glass,is then a configurationally frozen 1iquid, a
metastable state at room temperature for Many alloys. The time-
témperature-transformation (T-T-T) diagram in figure 1.1 shows
schematically hoy long a glass at a given temperature viII take to
crystallize. The diagram illustrates the time required for a certain
fraction of the sample (typically 1 in 106) to transforme The crystal .
phase makes a "nose" under vhlch there Is glass. The nos~, at
approximately the glass temperature T , indicates that the liquid does not g
ctystallize readily at high temperatures because of thermal vibrations,
nor at low temperatures because of the high viscosity induced by Iow
temperatures. The tip of the nose indicates the optimal t~mperature-for
crystallization. In order to avoid crystallization in the glass formlng
process it ls necessary to cool the alloy from the liquid temperature fast
" enough to avold the nose of crystaillzatlon. The minimum coollng rate is
thus determined, as shown in figure 1.1.
It has been observed that metaI1ic glasses form near deep eutectics
of the constituent elements. This can be explained as follovs:-Although
the glass temperaturé Tg 18 approximately constant for the glass systems-

o
, T
o
~ TI - - ---
\ , \ ,
\ \ , ,
\
\ • , .. ::J , .. 0 , .. " Q.
Tg E - - --" ..
glass
- -
·3·
liquld
-
\ .. \ mtr\lmum \ cooling
\ rat. \
\ \
log time
crys-tel
figure 1.1 Schematlc time·temperature·tran.foraatlon (T·T·T) dl.,r .. shoving the 'nose' of crystallization and the alni.ua coolin, rate required to Avoid cry.tallizatlon of a ... ple
, > ( .. '
c -4·
used, the equi1ibriua ae1ting temperature Tl varies dramatica11y. Ve know
that in certain a110ys (those where the components have a large negative
heat of mixing) the equil1brium melt temperature is substantially lower -
than for the pure constituents. This leads to one or more sharp minima,
called eutectics. Since the cooling rate depends on the difference Tl-Tg'
glasses are easier to make for a small cooling rate, hence for small Tl'
which is found at deep eutectics. This observation that metallic glasses
form near deep eutectics of the constituent elements has been use fuI in
making new glasses.
It is convenient to divide metallic glasses into two distinct
categories. The first is one whose constituent elements comprfse a
transition metal or noble metal and a metalloid of group III, IV, or V.
The metalloid acts as a glass former or stabilizer. The second empirical
category is one whose constituent elements are only metallic. Examples of
J
the former are Fe-B, Fe-Ni-P-B, and Pd-Si, while examples of the latter
are Fe-Zr, Co-Zr, and Y-Al. The present work involves only metallic
glasses from the second category, specifica1ly Fe-Zr, Co-Zr, Ni-Zr, Cu-Zr,
and CU-Nir
Vhen a meta11ic glass is formed it is not necess~rily at a local
minimum of free energy. This is shown by the fact that its
characteristics change when it is annealed. The changes fall into two
distinct categories: reversible and Irreversible. The present york
examines both types of p~ess.
,
o ·5·
Vhen a sample is annealed the predominant change in characterlstics
ls Irreversible. The Irreversible change can be divided into tvo
processes: nucleation, which results in the eventual crystalllzàtion of
the sample, and what ls believed to be changes in the topological short
~ range order (TSRO). TSRO can be understood using the idea of free volume.
As quenched metallic glasses have quenehed in voids so that they have a
specifie volume that is larger, perhaps by as much as 'q
1%, than the
~ specifie volume of the same glass when fully relaxed. This excess
specifie volume is termed "free volume", and plays an important role ln
physical properties. Annealing an as quenched metallic glass at
temperatures weIl below the crystallization temperature Tx partly anneals
out the free volume. In changing the free volume the characteristics of
the gl~ss are then changed.
It has been~onstrated in some glasses(I.3)(1.4), however, that it
is possible to move reversib1y between' metastable states created at
different temperatures of annealing. Some authors, notab1y Egami(l.S),
suggest that this reversfble process is the result of 'changes in chemical
short range order (CSRO). CSRO is most easi1y understood using the idea
of a state or mixture of the alloy. Vhen quenched, a comp1ete1y random
mixture of the a1loy is not attained, so the chemical composition about
each atom is different from the average. This gives the a1loy chemical
sh~t range order. Egami ln particular has suggested that the local
configuration, or CSRO of the atoms can be chan~ed reversibly by anne.ling
c
c
·6·
the alloy at different temperatures. This could be the cause of the
reverslble component of relaxatIon observed ln some metallic glasses. If
this hypothesls ls correct then ve should expect to see a larger effect ln
a ternary glass where tvo of the constituent elements are very slmilar
than ln a binaty glass vhere only one of the tvo slmilar elements Is
present. In the ternary glass one would expect a larger rearranglng of ~
the two similar elements. The systems Cu-Zr, Ni-Zr, and (CuNi)-Zr vere
chosen to compare and thus to examIne in this vay the validity of Egami's
model. It should be n~d that most of the data supporting Egami's model
Is from ternary boron-based glasses.
Properties used to study this reversible relaxation effect include
Curie temperature(1.3) and magnetic anisotropy(1.6). In the present york
we have examined the influence of thermal annealing on the superconducting
transItion temperature Tc. Tc for the systems chosen occurs in the
convenient range of 1 to 4 K, can be measured precisely, and varies
significantly upon annealing. For these reasons Tc vas chosen as a
monl tor of the relaxation behaviour of the chosen systems.
Anderson et al.(1.4) examine the, effect of annealing a ~i24Zr76 glass
isochronally for short periods of time at temperature~ belov 300°C. They
flnd that at these temperatures the relaxation process, seen through the
superconducting transition temperature T appears to have a reversible c
component. The present york ex tends the york of reference 1.4 by
examining the behaviour of Ni-Zr, Cu-Zr, Ni-Cu-Zr, Co-Zr, and Fe-Zr, and

,
o
·7·
by maklng a comparison of the relaxation behaviour of the different
alloys.
Beeause of the changes in glasses upon anneal1ng, a thorough
understandlng of the effects of low-temperature anneallng of metallic
glasses ls important for an adequate a prlori prediction of the
macroscopie properties of the glasses. It is the purpose of the present
work to extend the understanding of the effects on the superconductlng
transition temperature Tc of annealing metallic glasses at temperatures
weIl below T . x
There are two common methods of measuring T. The easiest methbd ls e
to measure electrical resistanee using the property that superconducting
materials have zero de eleetrieal resistivity. The present york, hovever,
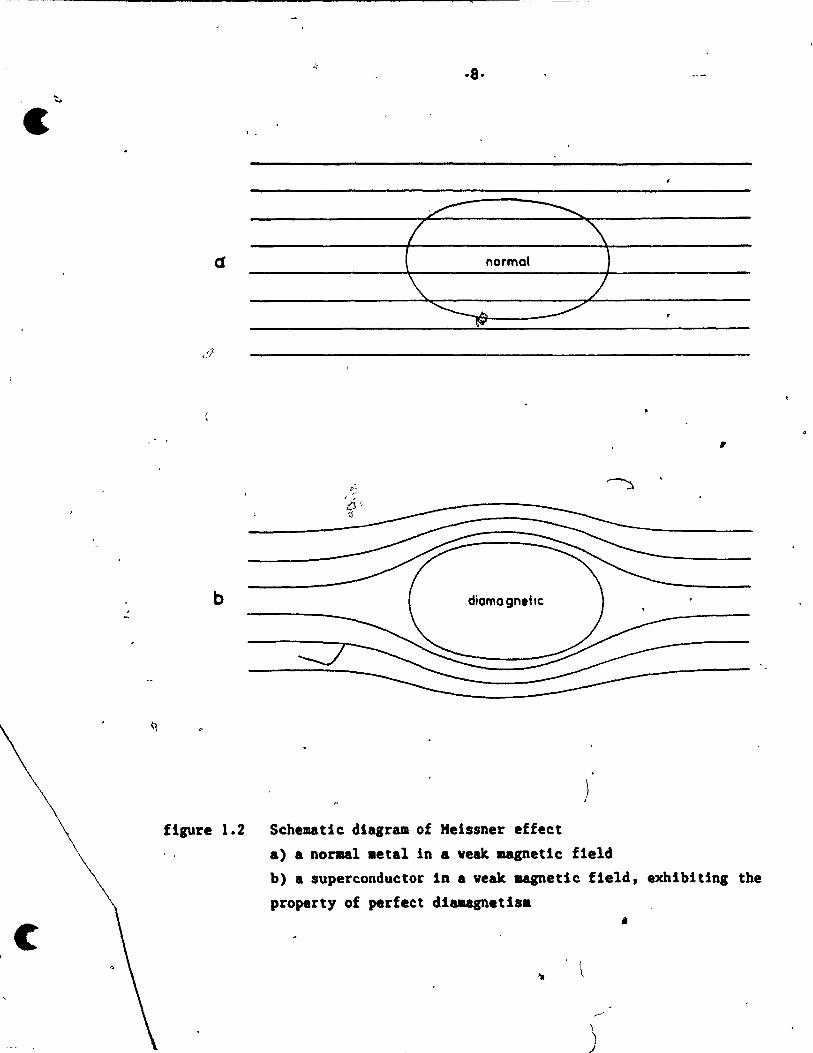
uses the Meissner effect, that superconductors in weak magnetic fields are
perfectly diamagnetic, havlng zero magnetic induction ln their interior.
Thus when a sample is placed in a magnetic field and cooled through its
superconducting transition temperature, the magnetic flux originally
presept ls ejected fro~the sample, as shown in figure 1.2.
Heasurlng T through resistance is generally mueh easier to do and ls . c
therefore a more common method. However mea$uring T vith a c
susceptlbility bridge as in the present work has the advantage that 1t ls
a bulk measurement. Should the sample be very inhomogeneous so that there
are, for example, tvo reglons vith tvo different transition temperatures,
only the higher temperature viII be measured by the resistance .ethod and
c
\ C
·8·
Cl normal
,
diama gn.tlc , b
~~~-~ -==-------
)
figure 1.2 Sehematie dtagram of Heissner effeet
" . a) a norul .etal in a vealt magneUe field
b) a supereonduetor in a veak aagnetie field, exhibiting the
property of perfeet diaaagnetis.
, )
J
j

• ).
•
o
·9·
the inhomogeneity will go undetected. By using the Heissner effect, if
tbere are two transition tempe ratures there should be two distinct jumps
in the mutual inductance. It has been suggested(1.7) that the Ni·Zr
system can show such an inhomogeneity.
It should be noted that superconductors fall into tvo categories:
type l and type II superconductors. Amorphous superconductors fall in the
latter category which is the "dirty )imit" of the theory. From the theory
of Abrikosov and Gorkov(1.8) the type of a superconductor is determined by
the Ginzburg'Landau parameter K:
_ ~ _ penetration depth K - ~ (T) - coherence length 0
1 Type II superconductors have K > J.r' Amorphous superconductors are
(1.1 )
typically(1.9) in the range of K - 40-100, so are classed extremely dirty .
superconductors. The fundamental difference betveen type l and type II
superconductors is that type l superconductors are homogeneous, while type
II superconductors exist in a mixed state, part normal and part
superconducting. Type II superconductors transform at the lover critlcal
field, Hel' from a homogeneous superconducting state to a mixed state; the
upper critical field, B 2' is the highest field at vhich the mixed state c .
can e~ist.
The folloving is a brief description of the major interactIons
causing superconductivlty, vith a small development leading to the
1
commonly used HcHillan equation describing T. Although a full c

c
--c
1 f
: \
--10-
understanding of the nature of the superconducting state for real
materials has not yet been achieved, the nature of the two basic
interactions responsible is known. They are the electron-phonon and the , 1 \ screened Coulomb interactions.
\
/ First., consider the electron-phonon interaction. A displacement of
one ion in a lattice of positive ions of a metal causes a change in the
crystal field and so produces a force on neighbouring i~~s. The ~ons are
thus coupled, forming a system of coupled oscillators whose excitations ( \.''u
are ca lIed lattice waves or phonons. The electron-phonon interaction
\~//-----~\iSeS from the fact that when an \ /
electron moves through the lattice,
nearb~~.$ ~-'drawn towards i t. This crea tes an excess in positive
charge where the electron had been and a second electron is drawn towards
this excess positive charge. This is the basi~ of the phonon media~ed
electron interaction, or the electron-phonon interaction.
Now consider the Coulomb interaction. The electrons in a metal can
be considered as being a free gas of electrons. Due to the charge at one
point o'ther charges in the metal are rearranged and this offsets the
Coulomb potential. This leads to an effectivê two body screened
interaction of the form(1.10)
V(r) Ze2
=--r
-Àr e (1.2)
vhere r ls the dIstance avay from the point charge Z. This Indicates that
the,inter-electron potential Is of tKe coulombic form times an exponential

o
o
-11-
damping factor and the damping factor has the effect of reducing the
potential to negl1gible s1ze at distances greater than - 1/~. k 19
typically of the order of k F for metals so there is an effective screening
at distances greater that the 1nterparticle spacing. Thus the Coulomb
repulsion between two electrons is reduced in metals, both in strength and
i~~ange, by the collective screening effect of other electrons. This
reduced Coulomb repulsion 1s the so-called screeped Coulomb effect which
plays a role in superconductivity_
The sum of the electron-phonon and screened Coulomb interactions
results in an apparent small net attraction between pairs of electrons. \
As was first shown by Bardeen, Cooper, and Schrieffer(l.ll), such an ~
interaction can lead to a collective bound state of ·Cooper pairs' of
electrons. From the resulting Hamiltonian the BCS theory deduces a_simple
relationship between critical temperature T and electron-phonon c
interaction to predict T : c
Tc = 1. 14<W>exp (- N(~)V)
where <w> is a typical phonon energy and N(O)V the electron-phonon
interaction strength which arises from N(O), the-electron density of
(1.3)
states at the Fermi surface and V, the electron pa1ring potential. The
major limitations of th1s theory are that the the Coulomb interaction is 1
ignored, and the inte'raction between electrons and phonons is assumed
small, wh11e it is known that thls second condition is not fulfilled for
J

... --
·12·
all superconductors.
Later, the theory was developed further{1.12) to include' the retarded
nature of the electron·phonon interaction which did not have to be assumed
small, and the retarded Coulomb interaction. The drawback of these _1
theories vas that/they required numerical solutions.
KcKillan{1.13) developed the existing theory for so-called "weak
coupl1ng" to arrive at the form of the eveI~tual Tc equation. Experimental
data was then taken to find appropriate values for certain numerical
coefficients. The KcKillan equation vas thus
Tc = 1~5 exp(-" _l.04{1+ Àep) 1
,.. ,...*{l +.0.62~ ) , ep ep
where the Debye temperature €b is taken for the characteristic phonon
* frequency, À is the electron-phonon coupling constant, and ~ the ep ,
retarded Coulomb potential parameter. Note that the numerical
(1.4)
coefficients are simply the resul t of numerical Integration. ' Since the
equat10n is approximate it is usually adequate to replace it by:
(1.5)
This equation for T 1s now the basis for compar1son for most experimental c ,
results. Further developments to account for spin-fluctuations are \
discussed in Chapter 4.
To summar1ze, the present work examines the effects of annealing
•

o
. ,
o
-13·
\ '
metallic glasses. The macroscopic property used to monitor changes in the
sa~le i5 the superc~nducting transition temperature Tc' and is measured
using the Meissner effect. The samples used are type II superconductors,
and the theory used to analyze the data is based on the HcHillan eq~ation
since the samples used are in the weak coupling limite Systems are;
examined and compared where spin-fluctuations are negligible and the
system Fe-Zr, where spin-fluctuations are significant, is analyzed. As
weIl as the above Irreversible effects a reversible component 1s examined
in man y of the systems. These topies are examined here because a thorough
understanding of the interactions affected by annealing is necessary for a ~\
complete understanding of the macroscopic characteristics of the glasses.
The ensuing chapters are organized as follows. Chapter 2 contains an
explanation of the experimental methods used. Results are presented in
Chapter 3 and are then discussed fully in Chapter 4. Finally the most
important conclusions are sU)llmarized in Chapter ,S.
c'
·14·
c Chapter 2 . Experimental Procedures
2.1 Samptê Preparation
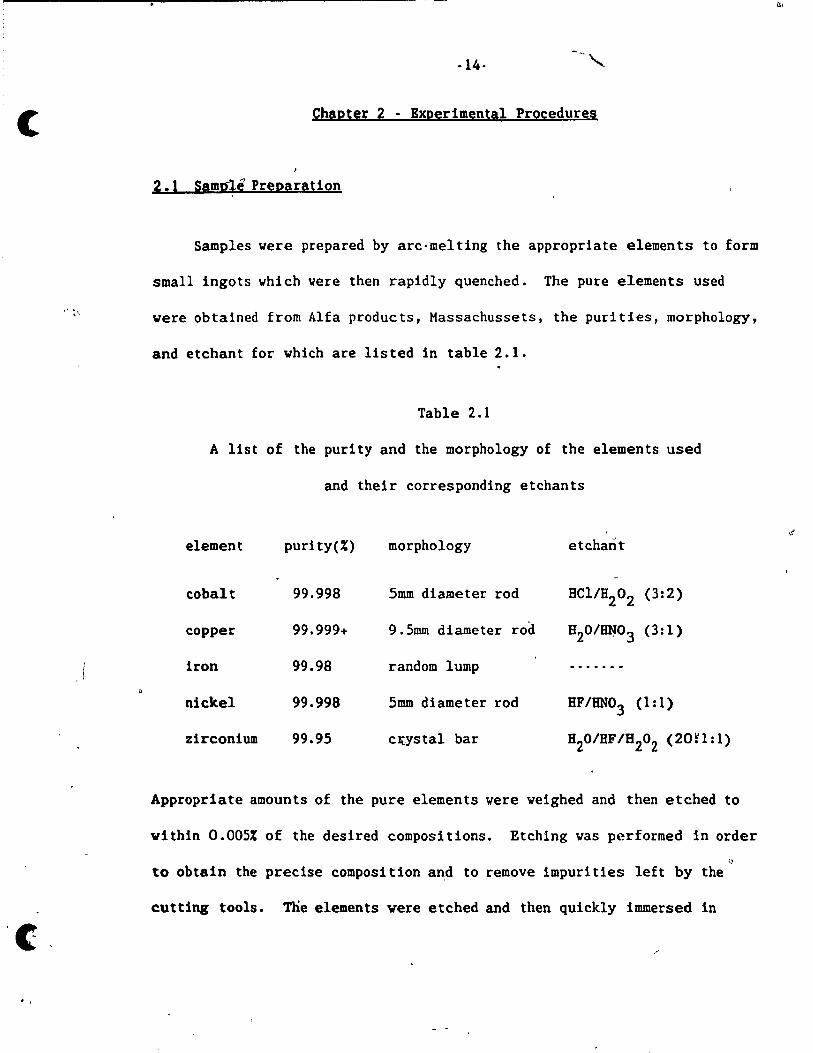
Samples vere prepared by arc·melting the appropriate elements to form
smaii ingots vhich vere then rapidIy quenched. The pure elements used
" .{\ vere obtained from Alfa products, Massachussets, the purities, morphology,
and etchant for vhich are Iisted in table 2.1.
Table 2.1
A list of the purity and the morphology of the elements used
and their corresponding etchants
,
element purity(%) morphology etchant
cobalt 99.998 5mm diameter rod 8el/H202 (3:2)
copper 99.999+ 9.5mm diameter rod 820/~O3 (3: 1)
Iron 99.98 random lump -.... --nickel 99.998 Smm diameter rod 8F/BN03 (1:1)
zirconium 99.95 c~ystal bar 820/HF/B202 (20~1:1)
Appropriate amounts of the pure elements vere veighed and then etcbed to
vithin 0.005% of the desired compositions. Etching vas performed in order
to obtain the precise composi tion an,d to remove impuri ties left by the
cutting tools. Tne elements vere etched and then Quickly immersed in
, ,
••
o
.l'
distilled vater to stop any further reactlon. The Iron lump shoved no
1 signs of oxidation, and vas not etched due to the high risk of oxidation
immediately after being removed from the etchant.
To form ingots, the appropria te constituents vere arc·melted under a
t1 tanium·get tered argon atmosphere. The nominal composi tions of the
1-2 g vere remelted several times, then turned over and remel ted several
more times to ensure homogeneity. Ingots displaying much oxida tion a t
this point vere discarded. The amount of oxida t ion 'Jas determined
quali tatively by the colour of the ingot. Good ingots displayed a clean,
shiny surface vhile ingots displaying a yello'J tint to the surface vere
discarded. The ingots 'Jere then veighed a second Ume; in aIl cases the
mass vas found to differ from the original mass of the consti tuent
elements by less than 0.1% • û
Once rapidly quenched the compos i t ion of the
. samples vas verified against published results for superconduc ting and "
crystallization temperatures, and using a scanning electron beam
microprobe. The results indicate that the nominal compositions vere
correct to vi thin 1%, as vill be discussed in Chapter 3. In aIl cases
samples are refered to by their nominal composi tion.-
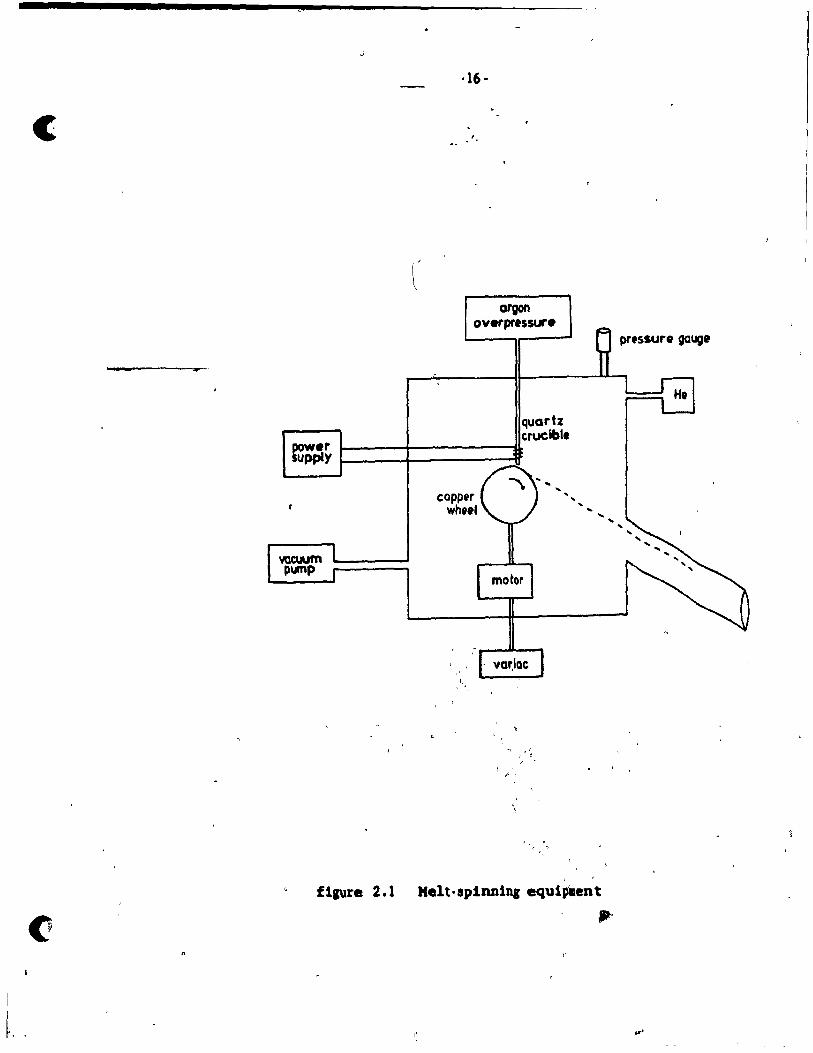
Ribbons vere then spun from the ingots using the melt ·sp1nning
apparatus shown in figure 2.1. The ingot vas placed in a quartz cruclble
and heated by an induction coU povered by a LEPEL 8igh Frequency RF
J
c
l
·16·
.'.
argon overprtssur.
quartz erueibl.
pow.r I---__ I------~ supply ~---+-------ff
wcwm pump
~ " ) . , /',
... ... " ...
f1IUre 2.1 Helt·apinning equ1p'aent
".
prtssure gouge
o
o
- 17-
generator. The molten ingot was then ejected from the crucible through an
orifice, typically of diameter 0.5-1.0 mm, by an overpressure of
approximately 25 KPa (7 in of Hg) of high-puri ty (02 s 3 ppm) argon gas,
on to a highly polished copper wheel, rotating at a tangential velocity of
about 50 mis.
Parameters having an effect on the quality of the glass are the
cooling rate e and the tangential velocity v of the copper wheel. Also
the posi t ion of the sample wi thin the indue t ion coil and the power P used
to heat the ingot affect the temperature to which the ingot is heated
before ejection from the crucible. Each sample was spun using the same
parameters to validate comparison between them on the basis of composition
alone. The tangential velocity v vas held at approximately 50 mis. The
voltage to the induction coil was held at 40-45 V, though the inability to
place the sample in exactly the same place led to variations in heating
rates. The cooli!lg rate can be calculated as follows. The liquid can be
considered striking the surface of the vheel at a temperature T , then ID
remaining in contact vith the wheel over a distance d, vhere the wheel
rotates at a constant tangential velocity v, and then leaving the wheel at
a tempera ture weIl below the glass transi tion tempera t.ure. The
appropria te equa tion is
IlT c = div (2.1 )
The distance d bas been esttmated in the laboratory from sl.Uar quenches
·18·
c using high speed photography. Typically d is about- 2 cm. 1he melt
temperature of the a1loY9 i9 about 1200 K and their glass temperature
about 500 K. . 6
This gives a quench rate of order 1.8xl0 K/s for a
tangential v~1ocity of 50 mis. Ribbons produced were 1-3 m long, 1-2 mm
wide and 20-30 ~ thick. AlI ribbons were extremely ductile at this stage
and none showed any sign of oxidation in the form of suface
disc010uration.
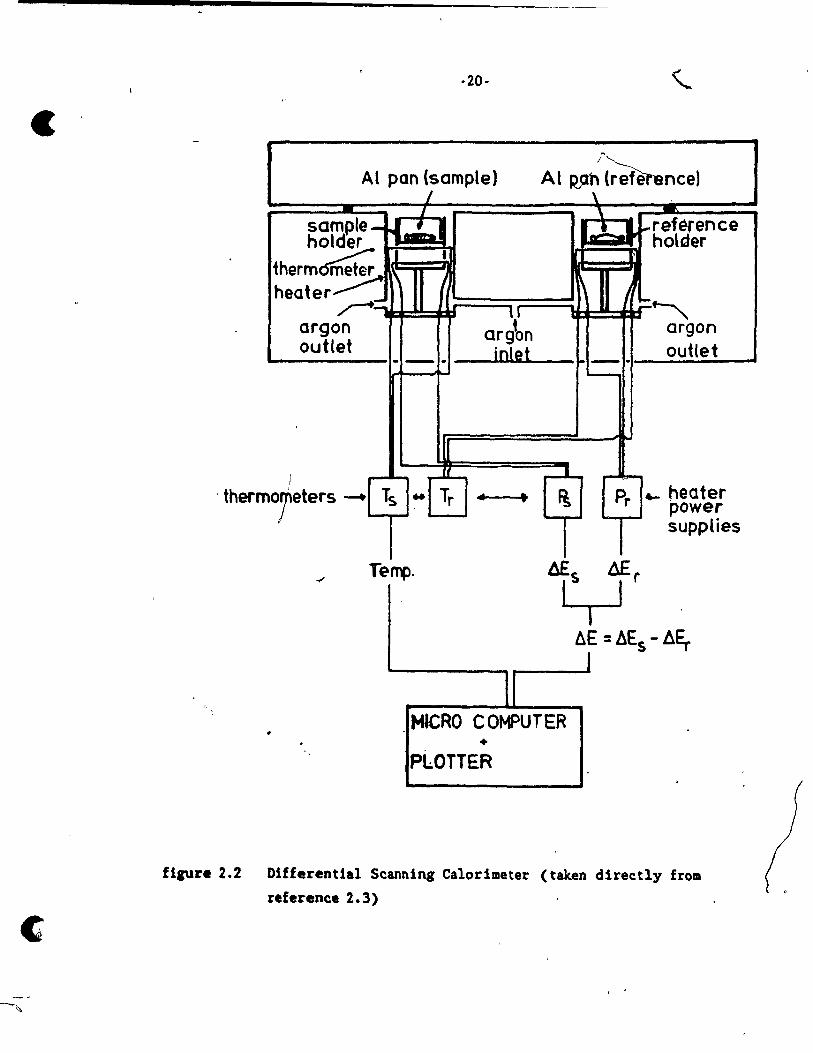
2.2 DifferentiaI Scanning Calorimetry (DSC) and
X·ray Diffraction
Once spun, aIl ribbons were subjected to DifferentiaI Scanning
Calorimetry (OSC) to check the crystallization characteristics. The
instrument used is a Perkin·EImer OSe-2e. A ose measures the rate at
which energy is either emitted or absorbed by a sampIe, as compared to an
empty reference pan. Both the sample and reference have their respective
heaters set to control the desired temperature or heating rate. Such
measurements are use fuI because any changes in structure such as ~
nucleation or crystalli2ation are related to a change in enthaipy of the ,
system, which can be measured by a ose. From analysis of the data we can
de termine the activation energy E , the crystalli2ation temperature T , a x
and thë change in enthalpy &8 of crystalli2ation. Heasuring the change in
enthalpy can be done either as a functlon of temperature for a constant
c

•
-,
o
-19-
rate of increase of temperature (isochronal) or as a function of time for
a constant temperature (isothermal). In the present york aIl DSC
measurements to determine the quality of the glasses vere isoehronal and
T and Evere determined. x a
For DSC measurements samples of roughly 10 mg vere placed in an
aluminum pan of roughly 15 mg and covered vi th an aluminum cover. The
aluminum pan vas placed in a platinum sample holder_ An identical empty
aluminum pan and eover were plaeed in a reference platinum sample holder.
Each sample holder has its own carefully balaneed heating coil and
thermometer. The circuit u~ed is shown in figure 2.2. Results of the
DSC measurements for the as quenehed glasses shoved goôa agreement with ,
previously obtained results for metallic glasses ofothe nominal
compositions(2.1). \1
The present project required the samples to undergo extensive
annealing. After annealing it vas desirable to detect the specifie phases
that crystallized or to check vhether erystallization had oceured. For
this a NICOLET L2 automated powder diffractometer vas used. The
, ~fractometer was capable of resolving 1- 2% erys tal1iza tion. Ineoming
CuK X-rays of 1.542 A wavelength vere diffraeted by the fIat samples. a r
The scattered X-ray beam vas passed through a monochrome ter and detected
by a NaI(Ti) scintillation deteetor, as shown in figure 2.3. The geometry
of the diffractometer i5 that of the standard Bragg-Brentano X-ray povder
diffractometer(2.2). For this part~cular dlffractometer the sample ls
c
c
-20-
Al pan (sample) At ~~~nce) 1 \ '
1 \ sample-~ I~I ~ .1 ,,""refèrence holder holGer
therm~ ,
1'- 1 heater ~_ l' 1 .....
~- \.1 ~ argon argbn argon outlet jnlet outlet --- 1-------
. therm 1
...1.
0jeters --. Ts .. Tr .. • ~ Pr .... heater power
"-- ---r-
1 supplies
11 MICRO COMPUTER
+
PL.OTTER
fil\lre 2.2 Differential Scanning Calorimeter (taken directly from
reference 2. 3)

o
o
, '.
·21·
t \ to d.teetor
\
-\-Il ~C:::::::>/vl J monochromator
~ dettetor slit
\" 28 .1 '.r---.' .
" 1
1
1 -1
\t' sampi. \
X-ray tube
source sUt
anode
figure 2.3 X-Ray Povder Diffractoaeter .bovine the reflection ,eo .. try
·22·
c mounted on a fIat plece of glass and 18 held ln place by some double stick
tape.
2.3 Annea11ng Techniques
\ /
The samples vere anAealed at different temperatures and for dlfferent , 1
perlods of time. Annea1s' for periods of time not exceeding three hours
were performed in the ose using the isotherma1 mode. Vhen on1y one
measurement vas required of a samp1e it vas made tvo cm long, since this
had been chosen as the standard samp1e length for measurement of the
superconducting transition temperature (see below). Vhere many samples
were required to undergo identical short anneals it vas more convenient to
annea1 them together in the DSe using many pieces of 3-5 mm length. To
anneal the samples either one piece of tvo cm or many pieces of 3-5 mm
vere placed in an aluminum pan and covered with an aluminum cover.
Samples of two cm vere vrapped around the inside of the aluminum pan vhile
the smaller samples were placed in the bot tom of the pan. The samples
vere brought up to temperature at a rate of 320·C/min, vere annealed at
the given tempe rature for the specified time and then cooled down to room
temperature again at the same rate.
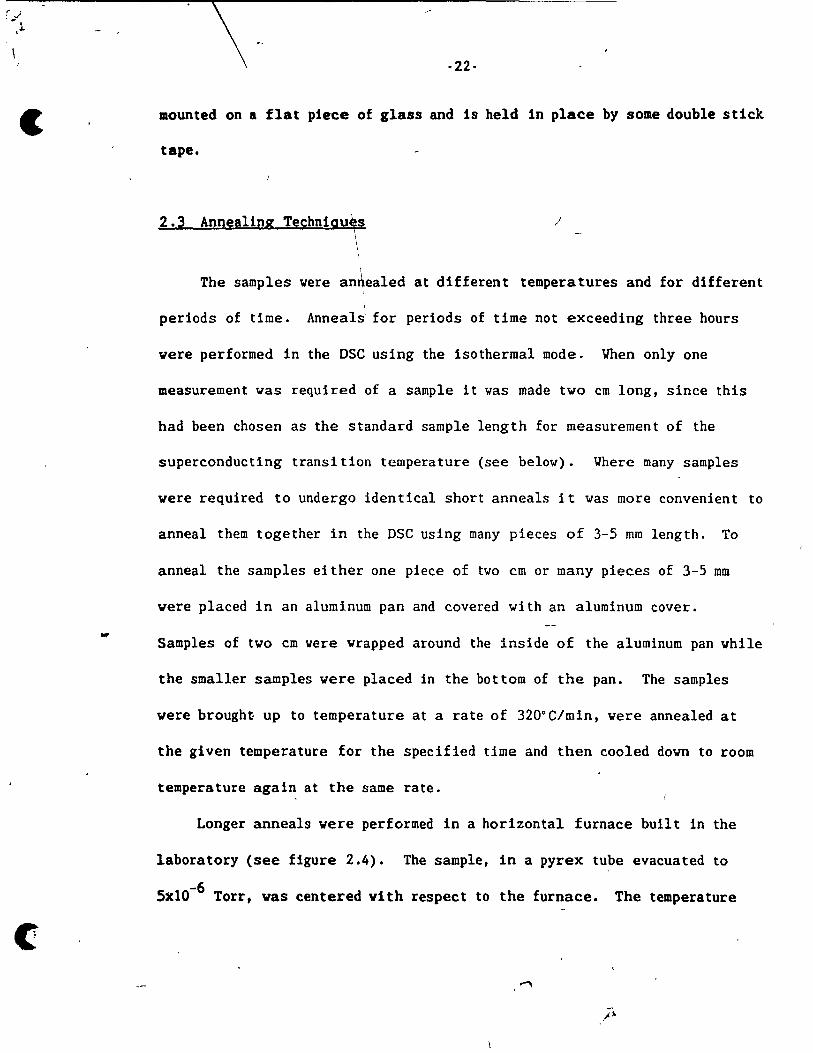
Longer anneals were performed in a horizontal furnace built in the
laboratory (see figure 2.4). The sample, in a pyrex tube evacuated to
-6 5xl0 Torr, was centered with respect to the furnace. The temperature
•
o
ftaure 2.4
o
temperatur. control
l' thermocouple
L:'-'~l====:::::::-=---l1LO h_ dlff.renHal
__ -+-_____ \1 ~,.... VO"llor
power suppl y
iet bath
'--
voltmeter
X-Y r.corder
Horizontal furnace used for annealinr samples for ti_e. 1
exceed1nr three hours
./' 1

•
----
-24-
vas set uslng a Boneywell Pyr-O Vane analog meter, and vas monltored by a
standard thermocouple centered vith respect to the furnace. In this
arrangement it vas found that the average sample temperature vas lO-15°C
colder than the pre-set value. So the sample temperature was measured by
a chromel·alumel thermocouple whose reference junctlon vas placed in an
ice bath. Fluctuations about the Mean of the temperature of the furnace
depended on the power setting. If the power settlng vas too high the
furnace continued to heat up after reaching its upper allovable
temperature; if the power setting was too low the furnace took too long to
reach optimal temperature. Both cases contributed to large error in the
temperature. By adjusting the power setting ft was found possible to
stabilize the furnace temperature to within ~ 3°C.
, \

o
o
,----
·25·
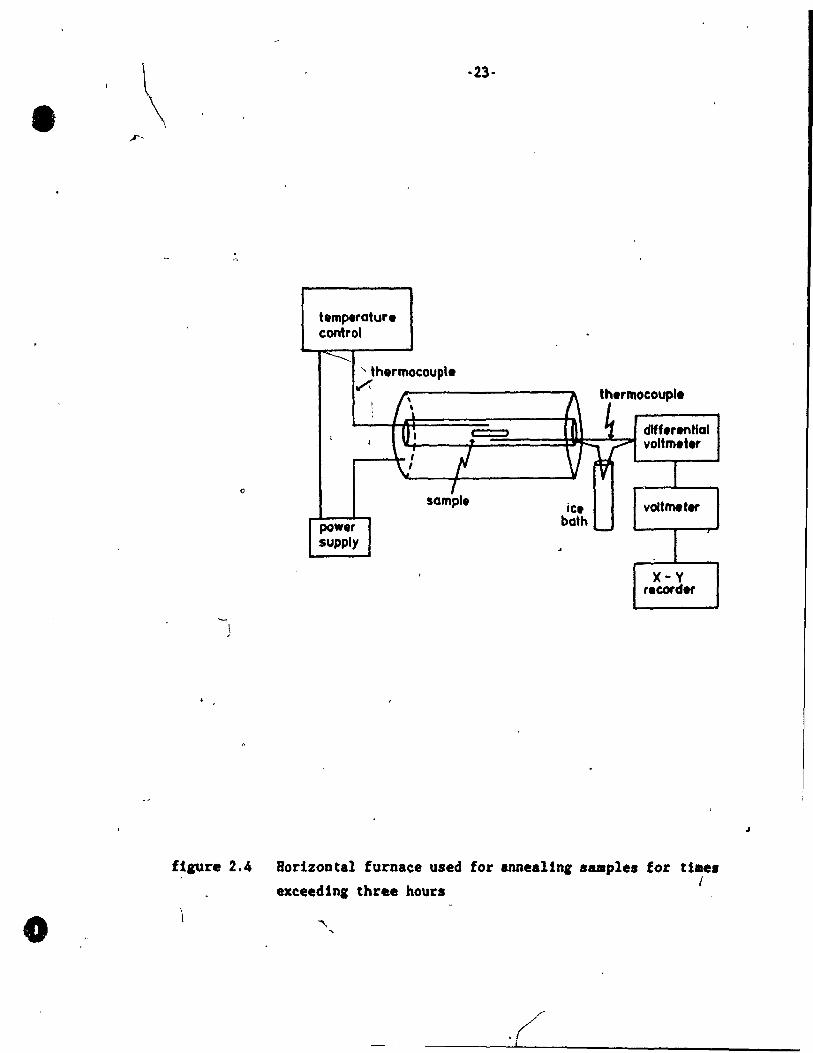
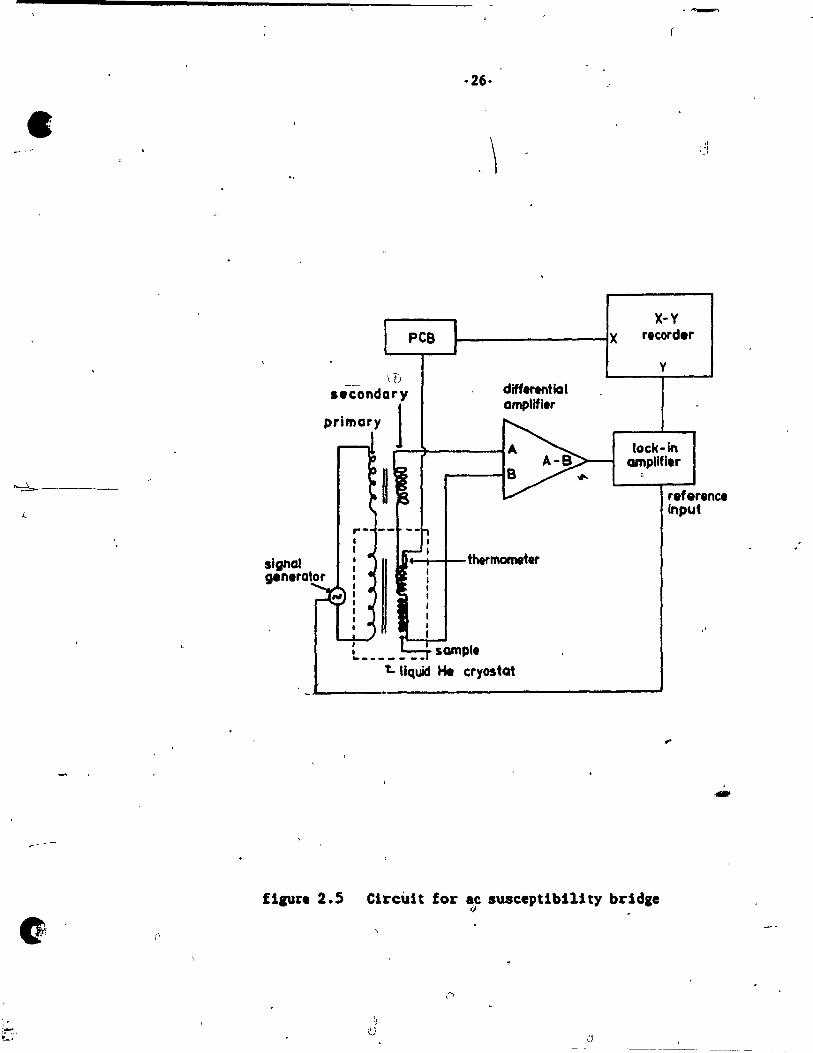
2.4 Superconductlng TransitiQn Temperature (Tc> Heasurements
The superconducting transition temperature T vas measured through c
the Heissner effect using an ac susceptibility bridge as mentioned in
Chapter 1. In this bridge there vas a primary coil surroundlng two
secondary coils (see figure 2.S). The tvo secondaries vere vound as an
astatic pair so that the mutual inductance betveen the primary and
secondaries vas zero in the absence of any sample. The sample vas placed
inside one of the secondaries and held in place at one end vith a dab of
Dow Corning high vacuum grease to ensure consistent positioning of the
sample (see figure 2.6). An ac current vas put through the primary which
induced a magnetic field in both of the.secondary coils. The induction in
the secondary coil containing the sample differed from the empty secondary
by the amount of the sample magnetization. The difference in induced
voltàges VA-Va vas then observed as a function of temperature. Yhen the
sample became scperconducting the magnetic flux originally present vas
ejected from the sample. This made a change in VA-VB vhich vas readily
measurable.
The magnetic field induced by the current in the primary 1s:
H - N l ~
0
and the magnetic induction 1s:
B - ~ H
- ~ N l
•
~-----
f1aure 2.5
~----- --
·~
·26·
, \ " 1:1
X-y
'--------~x r.corder
sampi.
differential amplifier
y
lock-In ampllfl.r ,
refer.nce Input
t.. liquid He cryostat
Circuit for ac susceptlbl1ity bridge Q .

1
1
1
1 •
o
o .--
·27·
.~ ,
pri,!,ory ---.... Ai--'--'---1hermometer
,
secon~ary A --+-01'1--'"
secondary B --01--"-"'-...
.' .......
..
u
sample holder
figure 2.6 Cr08s·seétlon of the pri .. ry and .econdary coli. for the ac ,,'.. .. . s~sc_ptlbl11ty bridle used ,tG .... ur. Te
t"" •
, .
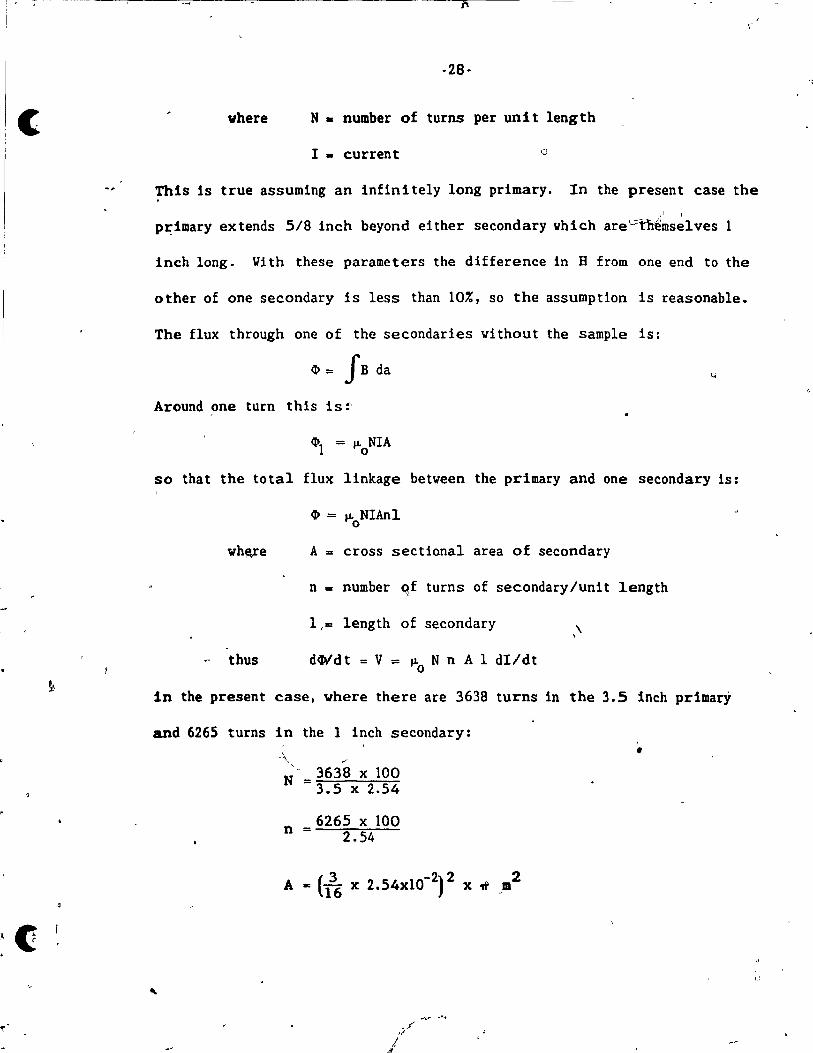
where N - number of turns per uni t length
1 - current
This Is true assumlng an Infini tely long prlmary. In the present case the
,1 1
pz;:lmary ex tends 5/8 inch beyond either secondary which are~mselves 1
inch long. Vi th these parameters the difference ln B from one end to the
other of one secondary is less than 10%, so the assumptlon is reasonable.
The flux through one of the secondaries without the sample is:
~ = fB da
Around one turn this is~'
so that the total flux linkage between the primary and one secondary Is:
~ = .,.. NIAnl o
A "" cross sectional area of secondary
n - number qf turns of secondary funi t length
thus
1,= length of secondary
d.wdt = V = J.L N n A l dl/dt o
\ ,
in the present case, where there are 3638 turns in the 3.5 inch primary
and 6265 turns in the 1 inch secondary: ,
-'\ .-"
N - 3638 x 100 - 3.5 x 2.54
6265 x 100 n = 2.54
•

•
o
A ... 7.12 x 10⁻⁵ m2
1 - 2.54x10⁻² m
-29-
~~ = 1 X 211' X 37 where f III: 37 hz,
The frequency f is chosen to avoid resonance vith other frequencies in the
labora tory. "So vi thou t the sample the expec ted 1nduced voltage acrOS5 one
of the secondaries i5:
v = 5.35 mV/mA
Nov suppose that, due to the Meissner effect,' flux is excluded from a
volume n (the superconductlng sample). The flux then becomes
vhere
(J) = J.I. NIAnl - JL NIA nI o 0 0 0
A l = fi = vol ume of sample 000
for a typical sample,
mass = 2 mg
- 3 densi ty = 7 gl cm
volume - 3 x lO-4cm3
so the sensi tivity 1s
n o (sample) = fi (sample holder)
l' \
(
@
c
c
·30·
AV = 1. 97xl0-4 V
i.e. vith the above assumptions, we should expect a fractional change of
4 voltage across one coil of the astatic pair of about two parts in 10 when
the sample becomes superconducting.
The signal from the tvo secondaries, one with the sample and the
other without, was then connected to the input of a lock·in amplifier.
Because it was not possible to balance the secondaries exactly and because
of the presence of the sample there was always a slight out-of-balance
signal at the output of the 10ck-in. To e1iminate this signal an air-coil
transformer was used to pro~e an additional variable linkage between the
primary and secondary circuits, as shown in figure 2.5. The secondaryof
the air-coil transformer was connected in series with the signal and its
amplitude varied by rotating it with respect to the primary. By this
means a true null (to 5 parts in 1000) was obtained at the input of the
lock-in amplifier. Furthermore since the two primari~s were in series,
fluctuations in current were unimportant to first order. This allowed a
smal! change in VA-VB, the signal ôV, to be detected by the lock-in
amplifier when the magnetic flux origina1ly present in the sample was
ejected due to the sample becoming superconducting.
A fractiona! change of voltage across one coil of the astatic pair of
one part in 104 resulted in the output signal of the lock-in amplifier ôV
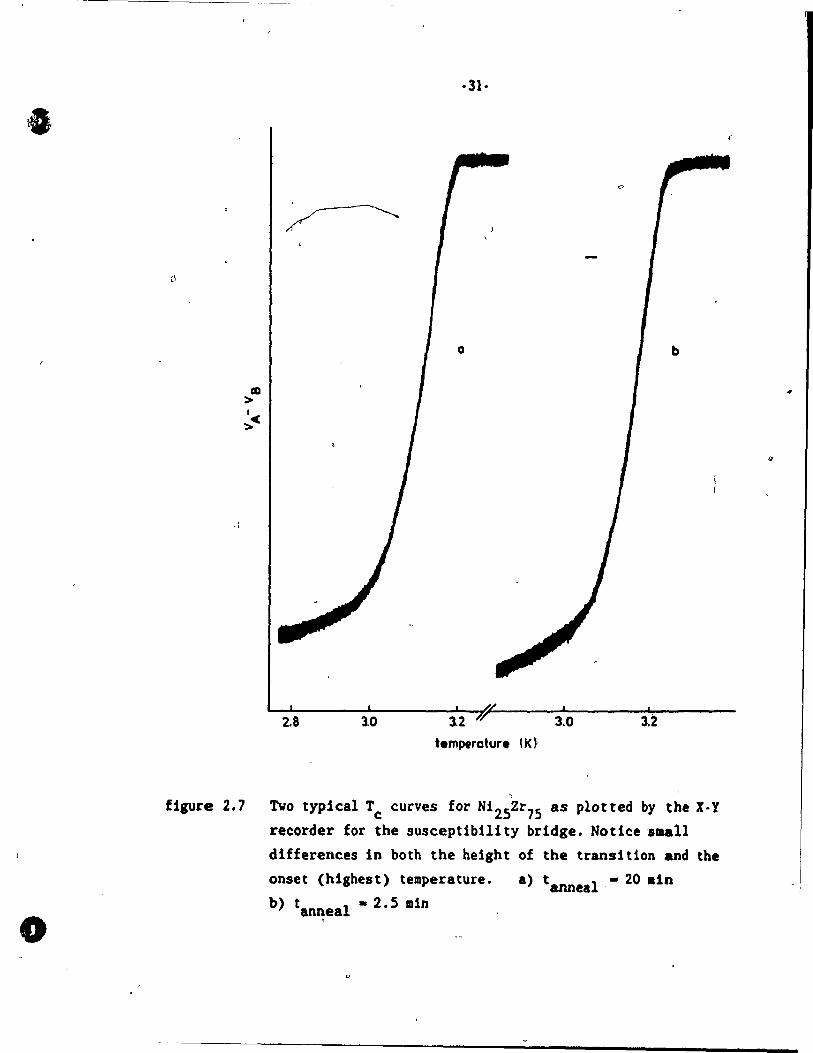
to be of order 2~ times larger than the noise. Tvo characteristic curves
are shown in figure 2.7. The tvo curves shown have slightly different
••
o
2.8 10
·31·
Q
12 V
temperature 00
o
b
3.0
figure 2.7 Tva typ1cal Tc curves for Ni 2SZr75 as plotted by the X· y
recorder for the suscept1bility brIdge. Notice IBaa11
differences in both the he1ght of the transition and the
onset (highest) temperature. a) t anneal ,. 20 .ln
b) t • 2.5 min anneal o
c
c
·32·
helghts for two reasons. The samples for each curve have the same denslty
but sllghtly different mass, so thelr volumes are sl1ghtly d1fferent. As
the signal depends on the volume this is one cause of the difference.
Another 1s that the samples could not be placed in exactly the same
position and they vere not ideal samples in that they were not perfectIy
fIat. Since the flux vas not distributed uniformly through the secondary
and the samples were not placed in identical positions with respect to the
flux a different amount of flux was ejected from each sample. This
resulted in the two samples having slightIy different signal heights.
Because ft was not possible to get an exactly reproducible signal height
for a transition it vas not possible to determine vhether the whole sample
vent superconducting to better ,than about 10%.
The temperature vas measured using a four-terminal germanium
resistance thermometer calibrated against the vapour pressure of helium 1
for temperatures belov 4.265 K using published tables(2.4). The va pour
pressure was measured using tvo highly sensitive mechanical gauges
(Valiace & Tiernan) accurate to 0.01 mm Hg. '~ith this thermometer the --error on the individual Tc measurements was ± O.~ K. The overall
accuracy of the temperature measurements was verifled against the T of c
standard samples of tin, indium, and the lambda point of helium. The
measured T vas consistently 0.02 K above the standard values. c

•
( o
-33-
2.5 Upper Critical Field (Bc2) and Susceptibility (x)
Measurements
Beéause of the unusual behaviour of thèir ~itical temperatures under
annealing, Fe-Zr samples vere further subjected to both upper critical
(dB 2)
field (BeZ) and susceptibility measurements. d~ T vas measured in e
order to find the density of eleetron states of the sample. This vas
measured using a standard four-terminal resistanee measurement inside an
induction magnet. T vas found for a series of fields H, to a maximum of e
. (dB 2) 45 KG, and the graph of Be2 vs Tc yielded d~ T .
e
Suseeptibility measurements vere then performed to determine the
effeet of annealing on the magnetie properties of Fe-Zr. Measurements of
X vere performed using a Faraday force balance using Lewis gradient coils
to generate the necessary field gradient(2.5). The balance vas automated
in the laboratory(2.6) using an IBM Personal C~mputer. A sample of
approximately 30 mg resulted in a Sig(al 4 tlmes larger than the sample
holder, vith an error of 2%.
Both Be2 and X measurements vere performed- on Fe-Zr samples. The
samples vere su~sequently annealed and the measurements repeated. The
same samples vere used so as not to introduce possible inhomogeneities of
the sample into the caleulations. Thus the effect of annealing on sorne
magnetic properties related to superconductivity in Zr based metallic
glasses vere determined.

c
c
-34-
Chapter 3 . Results
3.1 Irreversible Relaxation
The objective of the first part of this york vas to compare the
effects of annealing on the superconducting transition temperature, Tc' of
X25
Zr75 vhere X = Fe, Co, Ni, Cu. 75% zirconium vas chosen because at
that composition the four glasses had T attainable vithin the temperature c
range of pumped liquid helium.
The superconducting transition temperature vas measured using the ac
susceptibility bridge described in Chapter 2. T vas measured for aIl c
as·quenched samples. For Co25Zr75 , Ni 2SZr75 and Cu2SZr7S different pieces k
of the same ribbons vere annealed at 488 K in the Differential Scanning
Calorimeter for varying periods of time not exceeding three hours or in
the horizontal furnace for longer times, and T subsequently measured. c
AlI samples vere tvo cm long. The annealing procedures are describe~ in
more detail in Chapter 2. Different pieces of the ribbons vere used
instead of successively annealing the same piece because the ribbons vere
believed to be fairly homogeneous and T in these samples does not change c
appreciably over small composition changes about 75% zirconium(3.1). This
vas confirmed vhen different pieces of the same ribbon vere measured and
found to have the same Tc, so the procedure vas reasonable.
For Fe2SZr75 this vas not the case. T changes conslderably vith . c
•
•
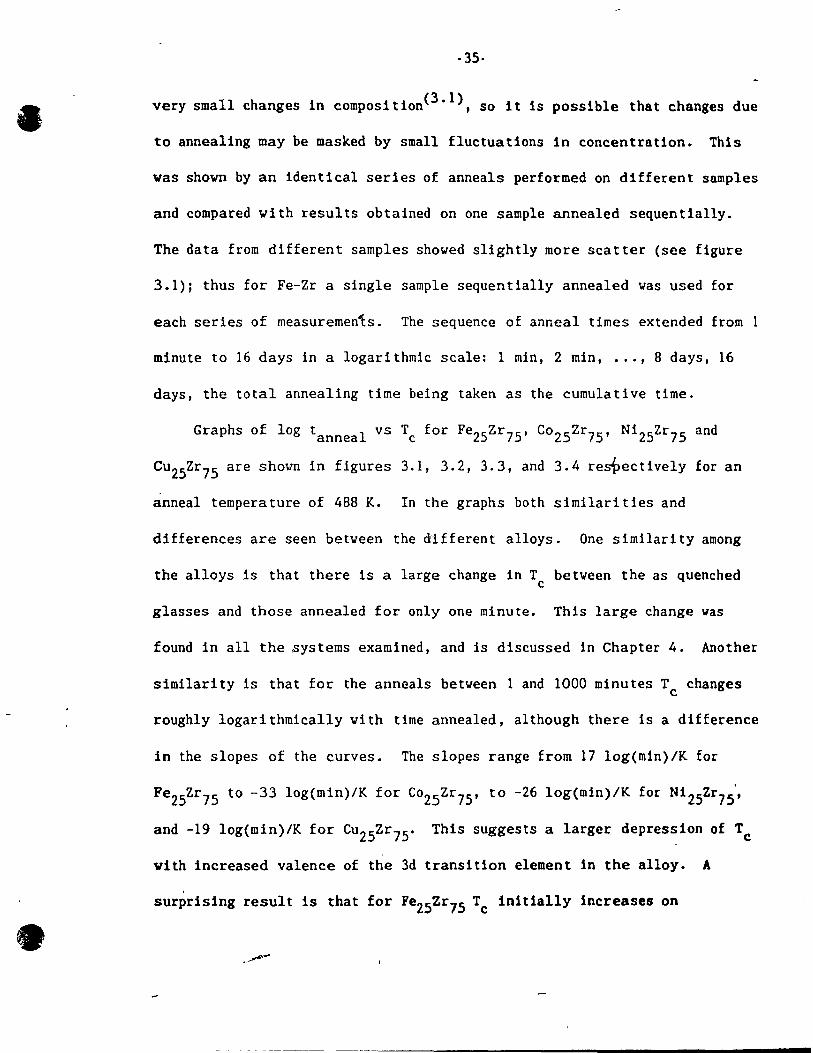
-35-
very small changes in composition(3.1), so it is possible that changes due
to annealing May be masked by small fluctuations in concentration. This
vas shown by an Identical series of anneals performed on different samples
and compared vith results obtalned on one sample annealed sequentlally.
The data from different samples showed slightly more scatter (see figure
3.1); thus for Fe-Zr a single sample sequentially annealed vas used for
each series of measuremen~s. The sequence of anneal times extended from
minute to 16 days ln a logarithmic scale: 1 min, 2 min, •.. , 8 days, 16
days, the total annealing time being taken as the cumulative time.
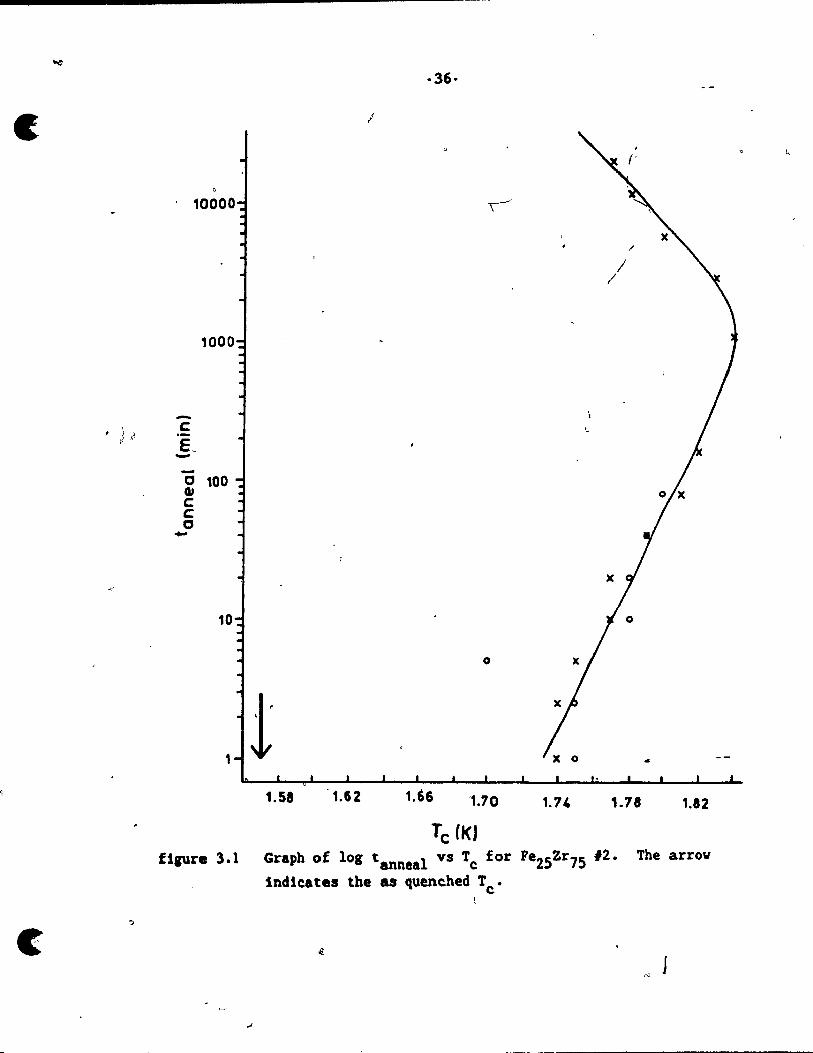
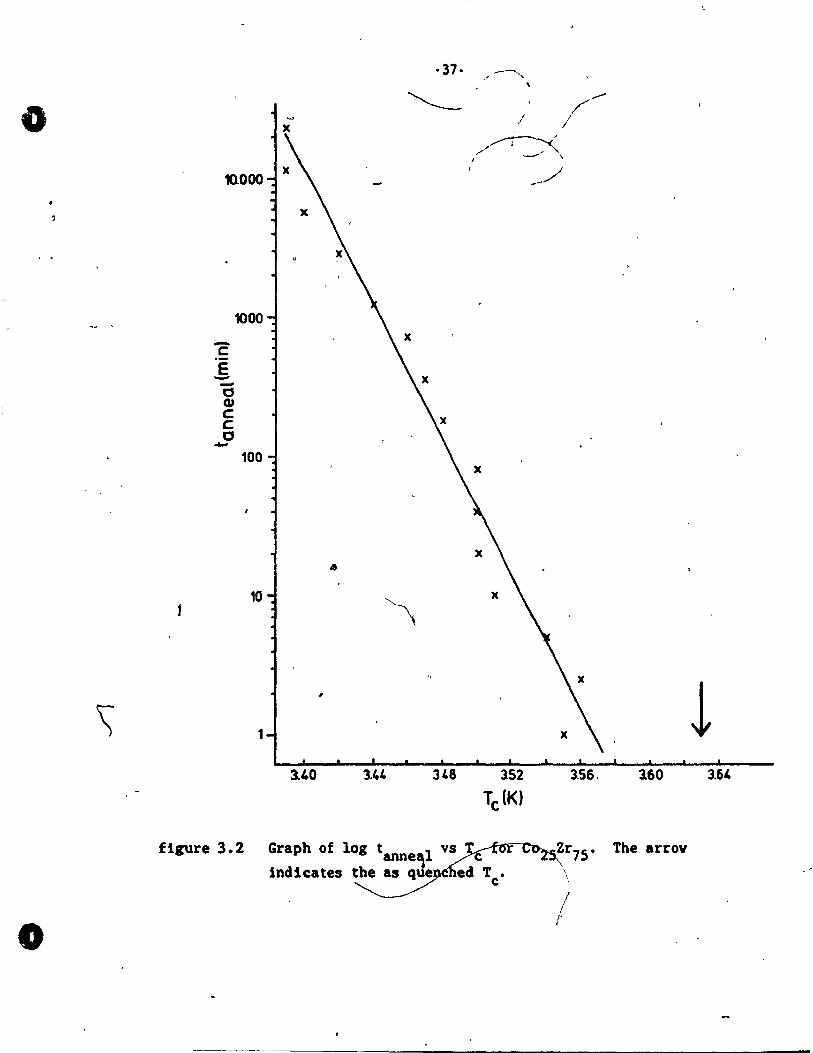
Graphs of log tanneal vs Tc for Fe2SZr7S ' C02SZr75 , Ni2SZr7S and
CU2SZr7S are shown in figures 3.1, 3.2, 3.3, and 3.4 re~ectively for an
anneal temperature of 488 K. In the graphs both similarities and
dlfferences are seen betveen the different alloys. One similarity among
the alloys is that there is a large change in T betveen the as quenched c
glasses and those annealed for only one minute. This large change vas
found in aIl the systems examined, and is discussed in Chapter 4. Another
slmilarity is that for the anneals betveen 1 and 1000 minutes T changes c
roughly logarithmically with time annealed, although there is a difference
in the slopes of the curves. The slopes range from 17 log(min)/K for
Fe2SZr 7S to -33 log(min)/K for C02SZr7S ' to -26 log(min)/K for Ni2Szr75~
and -19 log(min)/K for CU2SZr7S " This suggests a larger depression of Tc
vith increased valence of the 3d transition element in the alloy. A
surprising result is that for Fe2SZr75 Tc initially increases on
c
. ~i I;l -c .-E~ --C ca. 100
C C 0 -
1.58 1.62
·36·
;
o
1.66 '1.70
Tc (f(J
'-
1.14
/ /
/
1.18 1.82
fllUre 3.1 Graph of log tanneal vs Tc for Pe2SZr75 #2. The arrov
indlcates the as quenched Tc.
o
o
nooo
"2 E --C
QJ C C
" -
1000
100
10
1
figure 3.2
·37· /-~ ,
,1 //'---
/~ 1 -- \
--/
x
,
x
3.40 144 348 152 156.
Tc(K)
Graph of log tanne~l vs ~Zr75. indicates ~~d -Tc. --\
, 1
!
160 164
The arrov

1
) .
\
... -~ ~
(r--\
'~
f1pre 3.3
·38-
10000
1000
-c ,Ë --0
Q» C C 0 ... 100
10
"
104 108 112 3~ 320 124 328 132\ 336 140
TC{K) /\~-~ Graph of log tanneal vs Tc for Ni2SZr7S• The arrow indicates the as ~uenched Tc.
l'
) ,
---------~ -~- ~~

o
o
:
-39-
10000 t
c,
r.l \
1000 -c j <
'E ,,' "', c , - ~ - t ~ l k' jf
0 Q) C C 0 -
100
2S6 2.60 2.64 2.6e 212 2.76 2.80 2.84 U8 292 100
TC (KI
, fllUre 3.4 Graph of log t~eal vs Tc f~25Z!'15. The arrov
indicates the as quenched Tc'
l ' c
c
--
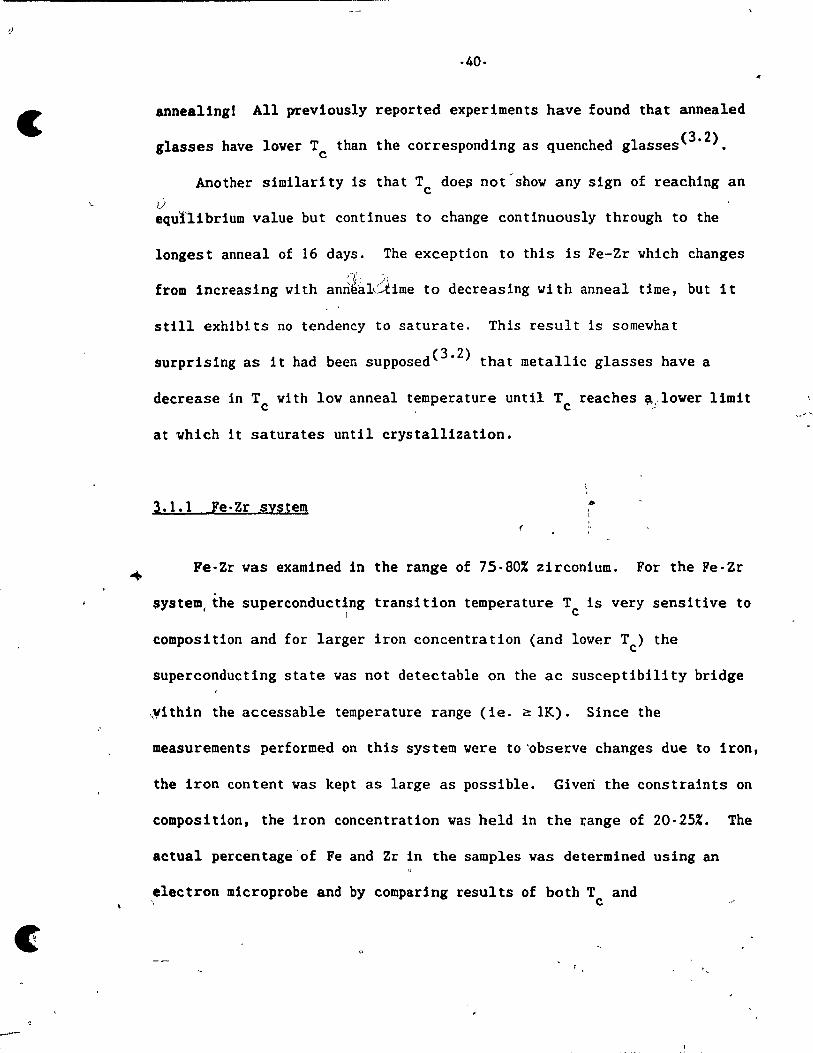
-40-
anneallngl AlI prevlously reported experiments have found that annealed
glass es have lower Tc than the corresponding as quenched glasses(3.2).
Another similarity 1s that T doe~ not"show any sign of reaching an c Ù equÜ,ibrium value but continues to change continuously through to the
longest anneal of 16 days. The except10n to th1s is Fe-Zr which changes
from Increasing wi th anri~'~ldime to decreasing wi th anneal time, but i t
still exhibits no tendency to saturate. This result is somewhat
surprising as it had been supposed(3.2) that metallic glasses have a
decrease in Tc with low anneal temperature until Tc reaches ;;:t,/lower limit
at vhich 1t saturates until crystallization.
3.1.1 Fe-Zr system #Jo , 1
Fe-Zr vas examined in the range of 75-80% zirconium. For the Fe-Zr
system, the superconducting transition temperature T is very sensitive to 1 c
composition and for larger Iron concentration (and lower T ) the c
superconducting state was not detectable on the ac susceptibility bridge
,yithin the accessable tempera ture range (ie _ C!: lK) . Since the
measurements performed on this system were to 'observe changes due to Iron,
the Iron content was kept as large as possible. Given the constraints on
composition, the Iron concentration was held 1n the range of 20-25%. The
actual percentage'of Fe and Zr in the samples was determined using an
electron mlcroprobe and by comparlng results of both T and c
___ J ____ ~
•
\
•
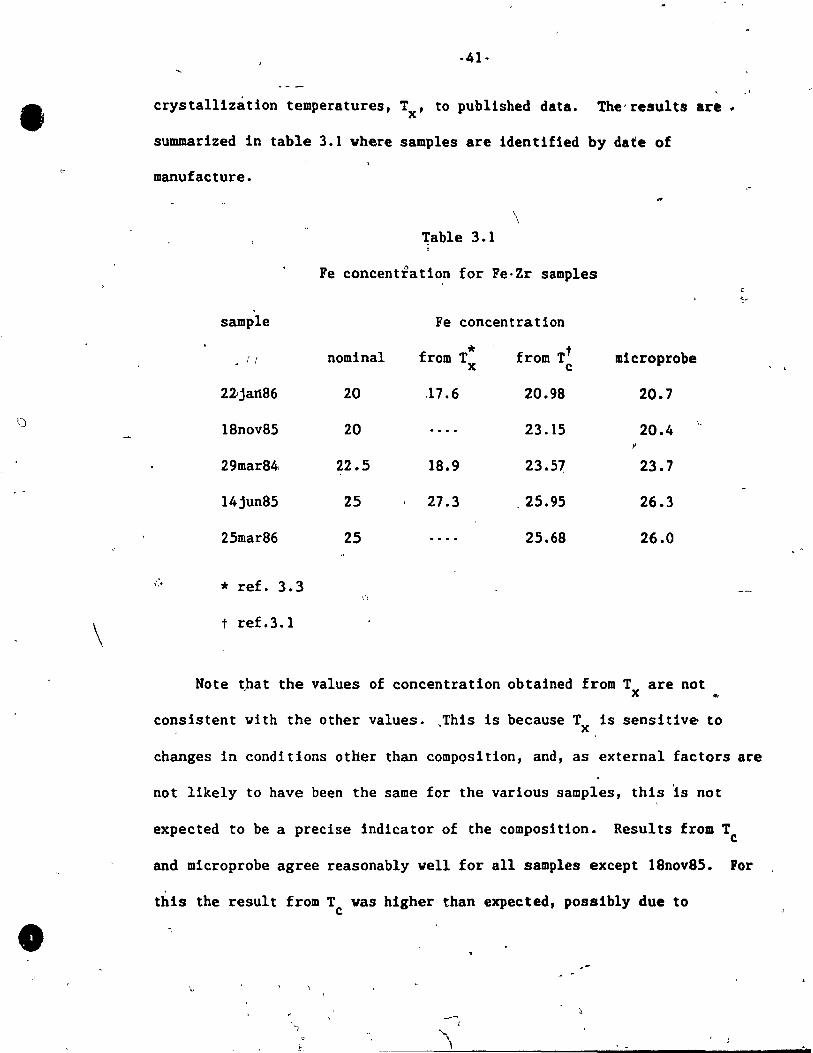
·41·
crystallizâtion temperatures, Tx ' to published data. The'results are ~
summarized in table 3.1 vhere samples are identlfied by date of
manufacture.
sample
; ; . ' ,
2~jan86
l8nov85
29mar84,
l4jun85
25mar86
,,j:~ * ref. 3.3
t ref.3.l
\ 1;able 3.1
8
Fe concentration for Fe·Zr samples
Fe concentration
nominal
20
20
* from T x
.17.6
22.5 18.9
25 27.3
25
"
from Tt c
20.98
23.15
23.57
25.95
25.68
microprobe
20.7
20.4 '-
f
23.7
26.3
26.0
Note ~hat the values of concentration obtained from Tare not x ...
consistent vith the other values. ,This is because Tx is sensitiv~ to
-'
changes in conditions other than composition, and, as external factors are
not l1kely to have been the same for the various samples, this 'ls not
expected to be a precise indicator of the composition. Results from Tc
and microprobe agree reasonably vell for aIl samples except l8nov85. For
this the result from T vas higher than expected, posslbly due to c
-~-
" ,
'.. , ,1.
,
.
c
1
c
-42·
anneallng at the time of manufacture, which is discussed later. Except
for thls sample, the composition is bel1eved to be roughly that indicated
by T measurements. For simplicity the samples are 'tefered to by th.Ür c
nominal composition: 22janS6 ls refered to as Fe20ZrSO Il; lSnov85 as
Fe20ZrSO #2; 29marS4 as Fe22.5Zr77.5 and 25marS6 ls ~refered to as
Fe25Zr75 • Vhère 14jun85 is used i t Is refered to as Fe25Zr75 #2."
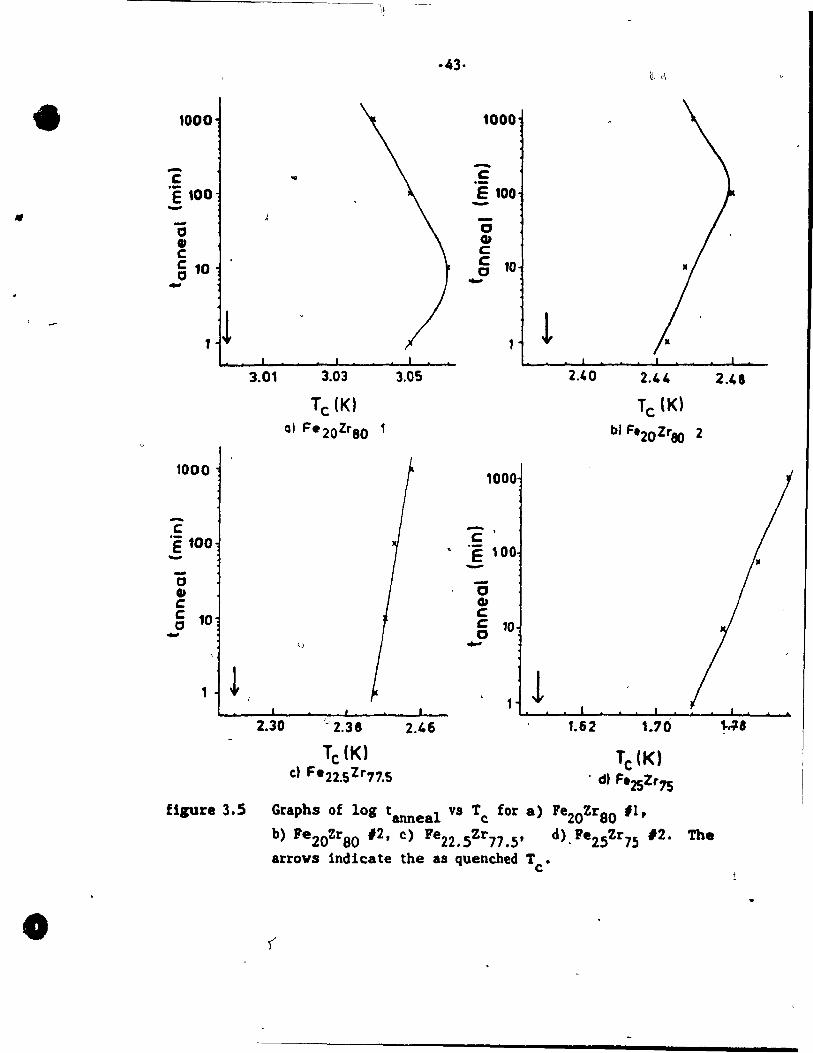
Because of their unusual behaviour on annealing, changes in T of c
annealed samples of the Fe-Zr system vere examined for a fuller
understanding of the processes involved leading to the increase in T . c
Fe25Zr 75 12 are shown in figure 3.5. T in annealed samples rises as much c
as 0.10 K above that of the as quenched samples and reaches a maximum :.
value at betveen 10 and 1000 minutes at an anneal temperature of 488 K.
For longer anneal times T decreases. c
One possible explanation for the abrupt change in slope is that it is
. related to the onset of crystallization. X-ray analysis performed on a
1.56 mg Fe25Zr75 sample that had been annealed at 488 K for a total of 16
,.days, the longest anneal time, did not show any evidence of
crystallizatlon. But ve know that T is a very sensitive characteristic c
of a glass and can be expected to change vith less than 2%
crystallization, the approxima te resolution of the X-ray diffractometer.
It is therefore necessary to predict the corresponding change in T for , c
thls minimum amount of crystallization. 2% crystallization of w-Zr in
-
• "
•
'000
-c .. 'Ë 100 --0 • C
C 10 0 -
1 l 3.01 3.03 3.05
Tc(K)
al F.20Zreo 1
1000
c 'Ë 100 --0
GJ C C 10 0 - \)
1 ! 2.30 'J 2.38 2.46
Tc (K) c) Fe22.SZr71.S
-43·
1000
-c:: .-E 100 --a QI c:: C 10 C -
1000
-, c:
• 'E 100 --a QI c: c: 10 a ...-
~, r~
L 2.40 2.44
Tc (K)
bl F'20Zr80 2
l 1.62
Usure 3.5 Graphs of log tanneal vs Tc for a) Fe20ZraO Il, b) Fe20ZraO 12, c) Fe22•SZr77 .5' d). Fe25Zr75 12. The
arroys 1ndicate the as quenched Tc'
2.48

c
'J
(
·44-
Fe2S
Zr75
, providing that there are no other crtstalliza.tion products,
corresponds to an Increase in Fe concentration ln the remaining amorphous
matrlx of 0.51 at% which, from published data(3.1), corresponds to a drop
in Tc of 0.15 K. After an annea1 of 16 days, the longest anneal
performed, the drop !n Tc vas on1y 0.07 K from the maximum value. This
corresponds to 1.0r. crystallization of w-Zr so, assuming no other
crystalliza tion products, Ve did not expect to be able to detect any
crystallization on the X-ray powder diffractometer. The evidence is
Inconclusive, but, because of other evidence described later, we do not
belleve tha t crysta1lization has occured at this stage.
Besides crysta1lization of w-Zr there cou1d also be sorne
crystallization of FeZr2
or Fezr~3.3). But the time for crystallization
of these can be estimated from the Arrhenius relation tx = toexp(Ea/kT);
the consta'nts t and E are found from D5C measurements of t for a given o a x
T. However, such data predicts crysta11ization occuring on the order of
years, not days, at an anneal temperature of 488 K. 50 crystallization of
FeZr 2 or FeZr 3 ls not likely, and there is no direct evidence of \
'crystallization of w-Zr. Thus we conclude that the change in behaviour is
1
more like1y due to a fundamenta1 change in the glass, as will be discussed
in Chapter 4.
Another point of interest ls the slope of the curves. The slope
ranges from 17 log(min)/K for Fe25Zr75
to -25 log(min}/K for Fe20ZrSO
#1.
Tc Increases upon annea11ng for Fe20ZrSO ' more for Fe22.SZr77.5' and again
',)
.0
o
-45-
more for Fe25Zr75 , suggesting that the increase in Tc upon annealing 19 a
function of Fe concentration. These results are also discussed ln Chapter
4.
Both the susceptibili ty 1< and the upper cr1tical field B 2 vere also 1 c
measured in order to ob tain information about the density of electron
states at the Fermi energy. The relationship betveen these tvo parameters
and the density of states vill be discussed in Chapter 4. The
measurements vere performed in order to determine the interactions
respotlsi ble for the behaviour of T . c
X vas measured several times at room temperature for samples of
approximately 30 mg of each alloy. For a better estimate of the error
Inherent in the measlirements the sample vas removed from the sample holder
and then replaced before being remeasured. The susceptibili ty vas
calculated from ~the sI ope of a curve of M vs H using a linear le as t
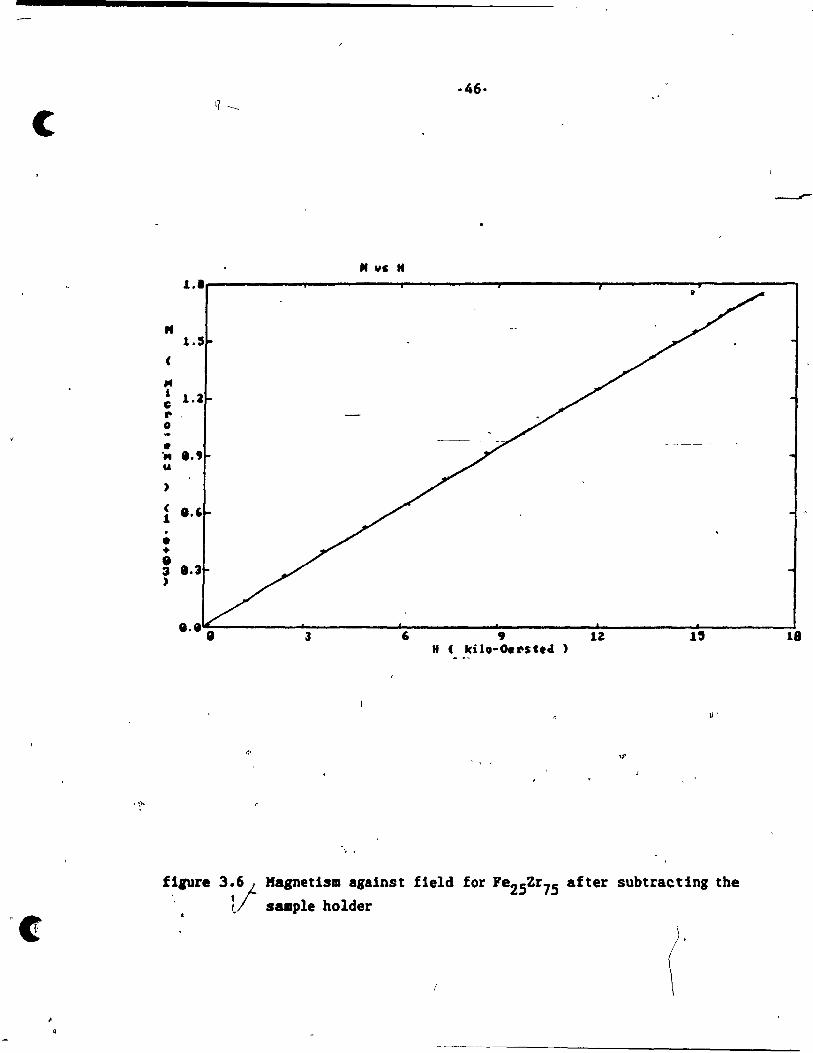
squares fit to 95% confidence. A typical fi t is shown in figure 3.6.
Individual measurements had error less than 4%, and the variation vithln
measurements of the same sample vas less than ::t 2%. Comparing the as
quenched susceptibilities there vas a measureable increase in X vith
-6 increase in Fe concentration, the values of X ranging from 2.13xlO emu/g
-6 for Fe20
ZraO to 2.S3xlO emu/g for Fe2SZr7S . The samples vere annealed
in the furnace described in Chapter 2 at 488 K for 500 minutes and then
l the susceptibili ty vas remeasured. The susceptlbill ty of each sample
.- -6 decreased after anneal1ng to values ranglng from 2.01xlO emu/g for
" (
If l C r, o
• -" u
)
(
1 . • + 8 3 )
-46·
.. '" H
J , 12 H ( ki Io-Oershd )
U'
, .
f1aure 3.6 t Hagnet1sm 8gainst field for Fe2SZr75 after subtraetlng the , . tl sample holder
('
18
•
"-
o
·47-
-6 Fe20Zr ao to 2. 39x10 emu/g for Fe2SZr 7S. This represen ts a decrease in )(
" ranging from 5% for Fe20ZraO #2 to 16% for Fe22.5Zr77.S' ~,~ist of )( for -(
as quenched and annealed samples is given in table 3.2. '~
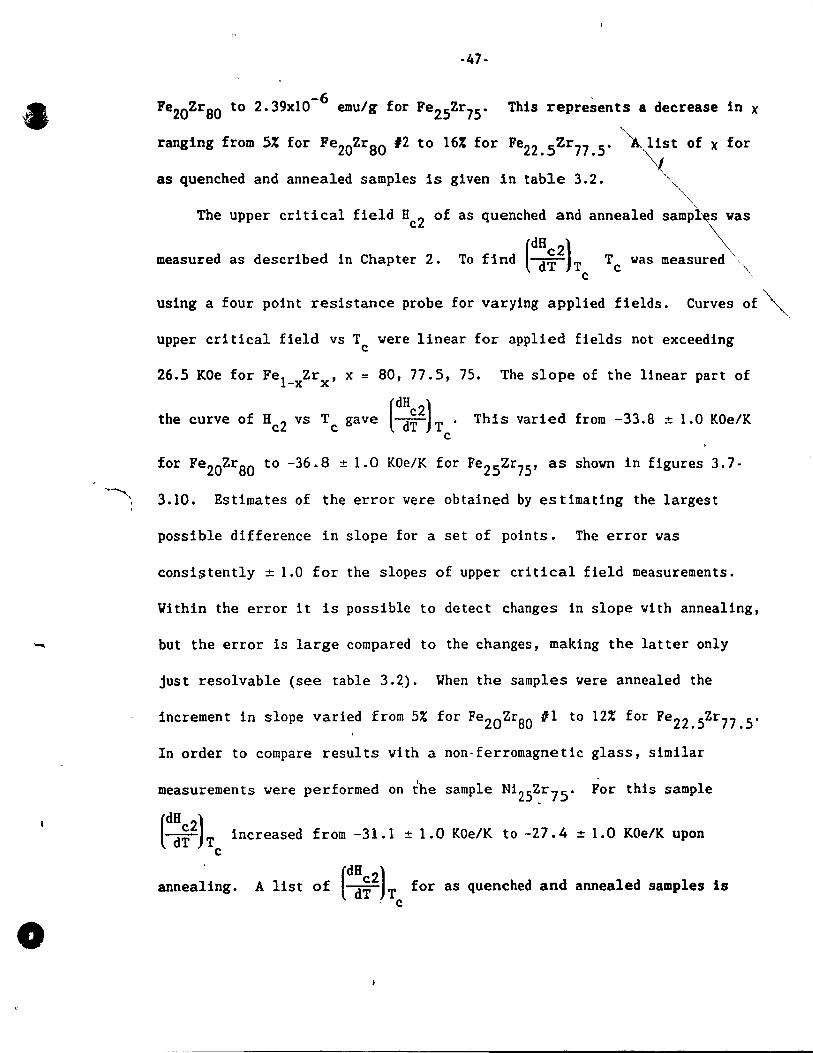
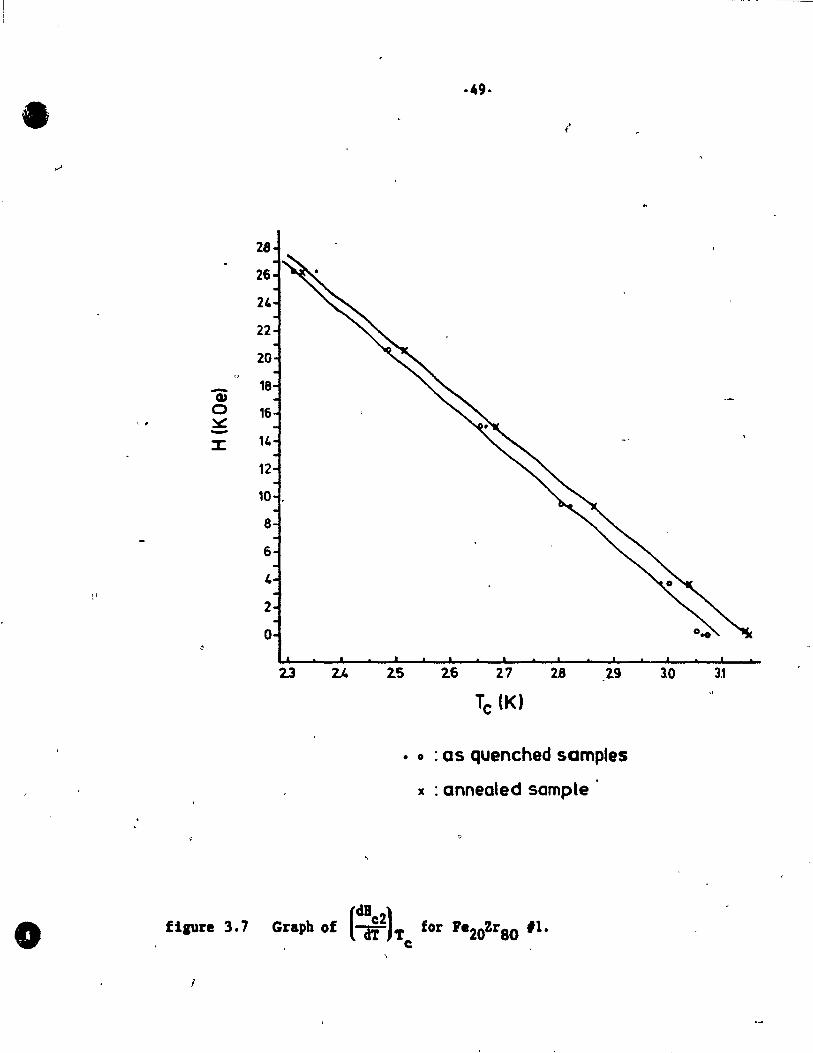
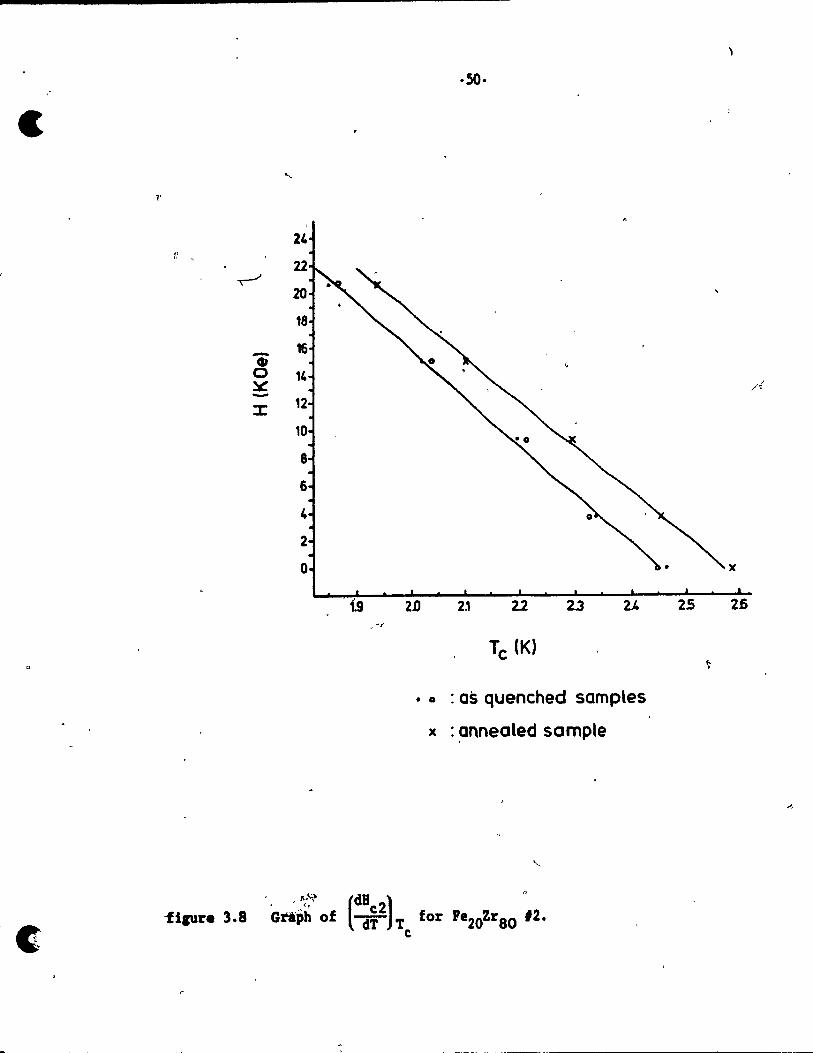
The upper critical field Bc2 of as quenched and annealed samp\~s vas
measured as descrlbed ln Chapter 2. To find (d:~2)Tc Tc vas measur~" using a four point resistance probe for varying applied fields. Curves of ~
upper critical field vs T vere linear for applied fields not exceeding c
26.5 KOe for Fel Zr , x = ao, 77.5, 75. The slope of the linear part of -x x
the curve of H 2 vs T gave (dBc2) This varied from -33.S = 1.0 KOe/K c c d'TT' c
for Fe20ZraO to -36.8 = 1.0 KOe/K for Fe2sZr75 , as shown in figures 3.7·
3.10. Estimates of the error vere obtained by estimating the largest
possible difference in slope for a set of points. The error vas
consl~tently = 1.0 for the slopes of upper critlcal field measurements.
Vithin the error it ls possible to detect changes in slope vith annealing,
but the error is large compared to the changes, making the latter only
just resolvable (see table 3'4)' Vhen the samples vere annealed the
increment in slope varied from S% for Fe20ZrSO Il to 12% for Fe22.SZr77.S'
In order to compare results vith a non·ferromagnetic glass, similar
measurements vere performed on the sample Ni25~r7s' For this sample
(dBC2) dt T increased from -31.1 ± 1.0 KOe/K to -27.4 ± 1.0 KOe/K upon
c
annealing. A list of (d:~2)T for as quenched and annealed sampI es 18 . c

c
sample
Fe20ZrSO Il
Fe20ZrSO 12
Fe22.SZr77.5
P'e25Zr75
•
·48-
Table 3.2
(dBC2)
Measured values of x and dT T for c
as quenched and annealed
samples of Fe·Zr
as quenched annealed
X (dBc2) X dT T
(xlO-6emu/g) c -6 KG/K (xlO emu/g)
2.l3~.1 -33.B:cl.0 2.01 ~.1
2.21 -35.3 2.11
2.47 ·34.6 2.07
2.53 ·36.8 2.39
rBC2) dT Tc
KG/K
-32.1 :cl.0
-32.3
-30.5
-34.2
..
•
, .
;1
o
28
26
24
22
20
- 18 Q)
0 ~
16
-:I: 14
12
10
8
6
4
2
0
23 2.5 2.6
-49-
21
TC (K)
2.8 2.9
• 0 : as quenched somples
Je : annealed sample
(dBC2)
fipre 3.7 Graph of -aT T for re20ZraO Il. e: ,
10 3.1
c
.'
c
·50·
2D 2,' 22 23 2.4
• 0 : as quenched samples
x : ~nnealed semple
x
25 2.6
-~- ------------

•
i !
28
26
24
22
20
- 16 QI 0 ~ 14 -:t: 12
10
8
6
4
2
0
l' 1.8 '
. \ :
.. 51-
1.9 2.0 22 2.3
Tc (K)
• ,0 : as quenched samples
x : annealed sample
"
figure 3.9 Graph of (~;2)T for Pe22.SZr77.S. e
2.4 2.5

c
.....
14
13 1
12
11
10
9
~ 8 0
1 ~ -:J: 6
5
4
,3
2
1
0
-
0
1.4
·52·
15 1.6
Tc (K)
• • : ,as quenched samples
D )( : annealed samples
, .
filUre 3.10 Gr.ph of (~;2)T for 'e2SZr7S• c
1.9

•
o
-53·
given in table 3.2. Using tpese measurements of X and Bc2 1t i9 possible
to deduce the magnitudes of both the electron-phonon and spin·fluctuation .
interactions, as will be discussed in Chapter 4.
3.2 Reve±§1ble Relaxation
The thi~d part of this york involved the revers1ble component of
relaxation. A number of systems, both binary and ternary, vere examined,
specifically the systems X33Zr67 (X - Ni, (OuNi), Cu), X2SZr75 (X - Fe,
Co, Ni), and Ni 24Zr76 .
Each alloy was annealed at 543 K for 1 hour and then annealed
successively at constant Increments of temperature starting at 398 K for
10 minutes at each new anneal temperature. T was measured after each c
anneal using the ac susceptibility bridge described in Chapter 2, and vas
found to vary very little. Above an anneal temperature of 543 K T did c
rise by a small amount for the samples Ni 24Zr76 and X33Zr67 (X = Ni,
(CuNi) , Cu).
figure 3.11.
A typical plot of T vs anneal temperature is shown in c
Because of the temperature increase at this point the anneal
temperatures just before the rise and at the top of the rise were chosen
to test for the reve~sible component of relaxation. Neither Fe2SZr75 nor
Co2SZr7S displayed this behaviour, as shown in figure 3.12 so they were
not tested further for reversible effects. To test for reversible effects
the samples vere annealed sequentially to the higher of the two chosen
;' .. ~
c
f(.,': _
. -
-54-
• ,1
.. 3.315
1310
130S
'3.300
(xl
3.295
• i i , i " i i 54l- ri 400 i soo , i i
550 . , 'L~~ ___ _
4S0
TanneallKl
•
,"filUrl 3.11 Tc apinat t~eal for a series of annea1 temperatures vi th
a representaUve error bar for Ni24zr76, .hoving a alla11
ri •• in Tc for ~nneals above S43'lt •
--
o
1470 ;'1,. i ,
• , i i , , i i i
450
TonneotlJ(l
i , ,
550
flsure 3.12 Tc alalns~ t annea1 for a series of anneal temperatures vith
representaUve error bars" for a) Pe2SZr7S and b) ~o2Y.r7S'
sbovilll no sy.teaaUc change in Tc.

c
\'
1 o "
/
-56-
temperatures, typically 563 K, fo11oved by alternating annea1s at ~he
lover (typically 473 K) and higher temperatures. T v~s measured after c
each anneal. Vhen Ni-Zr and Cu-Zr vere tested ln this manner they showed
!)
signs of reversible relaxation, thoy~h the effect vas on1y Just larger
than the error in Tc' Ni 24Zr76 shoved the largest effect whlle Ni 33Zr67 ,
and Cu33Zr67 showed a very smal! effect and (CuNl)33Zr67 shoved none at
aIl. The results for Ni-, Cu-, and (CuNi)-Zr are shown ln figure 3.13 for .
comparison. These results are discussed ln Chapter 4.
(
;. •
o
•
Ll
•
2.52 -~ -2.51
2.50
()
\ \ \ \ \
·S7-
-~
2.00 1.99
1.SU 1.97 1.9& -.... U 1.95 1.94
583 583 583
-~ -
473 473
Tanneal (K)
a)
2.175
(
2.170
2.165
2.160
563 563 563 413 0 473
Tanneal (K)
c)
\
5&3 5&3 563. 498 498
Tanneaf (KI
b)
figure 3.13 Tc ,against ,tanneal for a series of anneal teaaperatur •• vith
o representative error Ibars for a) Ni33Zr67 , b) Cu33Zr67 , and
c) (CuNi)33Zr67
, ,
c
c
Chapter 4 . Discussion
"
'.
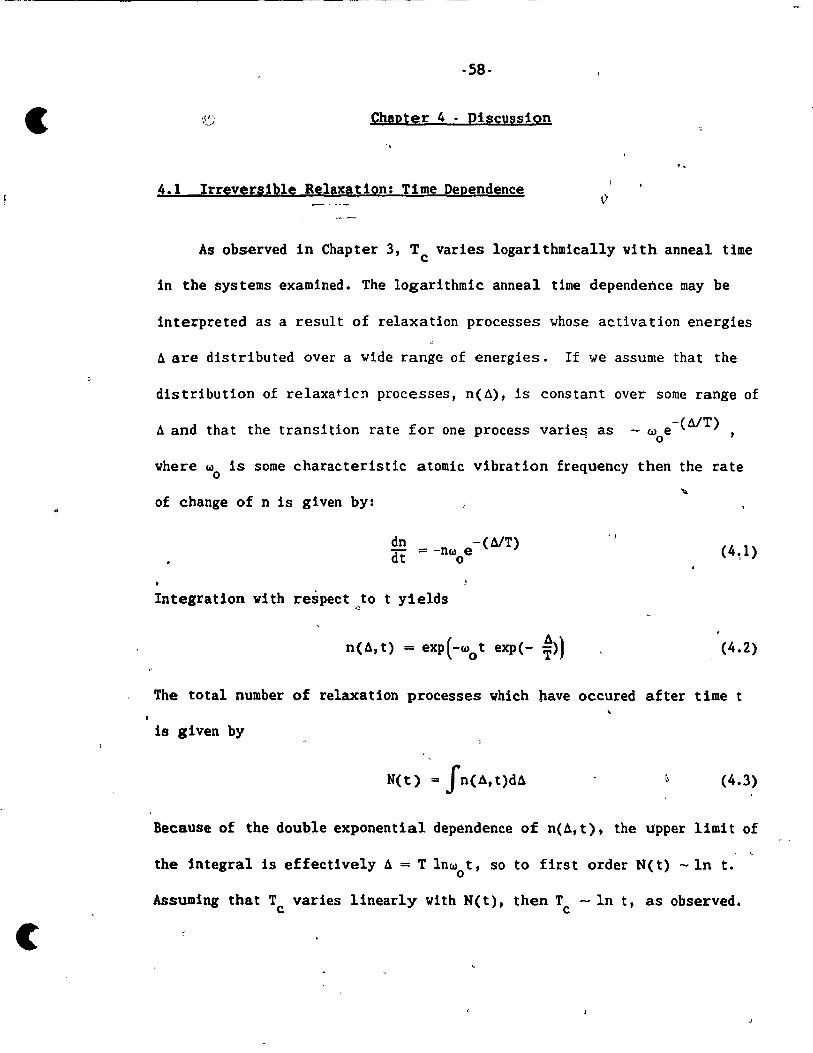
4.1 Irrevérsible Relaxation: T1me Dependence
As observed in Chapter 3, Tc varies logar1thmically with anneal time
in the sys tems examined. The logari thmic anneal Ume dependence may be
interpreted as a result of relaxation pro cesses whose activation energies
Il are distributed over a vide range of energies. If ve assume that the
dis tribution of relaxaticn processes, n(Â), is constant over sorne range of
Il and that the transition rate for one process varies, as -(MT) -we , o
where w is some characteristic atomic vibration frequency then the rate o
of change of n is given by:
dn = -nw e -(MT) dt 0
,)
(4,1)
Integration with respect to t yields
n(ll,t) = exp(-wot exp(- ~) (4.2)
The total number of relaxation processes which have occured after time t
19 given by
N(t) = fn{Â,t)d (4.3)
Because of the dou~le exponential dependence of n(ll, t), the upper 11mi t of
the Integral is effectively Il = T lnw t,50 to first order N(t) -ln t. o
Assuming that Tc varies linearly with N(t), then Tc - ln t, as observed.
•
•
-59·
A similarity among the X2SZr7S (X • Fe, Co, Ni, Cu) a1loys 15, as
discussed in Chapter 3, that there ls a large change in T betveen as c
quenched glasses and those annealed for one minute. This large change vas
found in aIl systems examined. Assuming that the curve of log t l vs annea
TC continues to be linear at smaller anneal times then we find that Tc for
the as 'quenched samp1es corresponds ta an anneal time on the arder of 10-3,
-4 ta 10 minutes, which is on the order of the time scale of the quench
,time. The time scale of relaxation is thus such that while the samples
are being quenched from the melt they undergo preliminary relaxation. The
relevance of this calculated time scale could be verified by looking for
changes in as quenched alloys for various quench rates and when flash·
annealed for times on the arder of a fev milliseconds. It certainly
indicates that preliminary changes in the atomic order occur within the
samples on a time scale much smaller that 1 minute.
The fact that T for Fe-Zr changes logarithmically vith anneal time c
is further support for the dominant process to be relaxation, as opposed
ta crystallization, since changes in T due to crystallization should not " c
be linear on a logarithmic time scale(4.1). The specifie features of the
f curves of anneal Ume vs Tare discussed later. c
c
.' .
c
- 60-
4.2 Irre~ersible Relaxation: Changes in Parameters of
Superconductivity
Huch work has been done to examine a variety of parameters relating
to the superconducting transition temperature T for various metallic c
glasses.
Previous studies have examined the compositional dependence of T • c
Specifie alloys examined include Cu_Zr(4.2)(4.3), Ni_Zr(4.4)(4.5),
co_Zr(4.S), and ~e_zr(4.4). T has been examined by both 10w temperature c
specifie heat and resistance measurements. -In aIl of the alloys there is
a signlficant drop in T with a decrease in the concentration of c • 1)
zirconium. The decrease in Tc with concentration varies regular1y with
the 3d element; this ls 1l1ustrated by the fact that in Fe-Zr
superconducti vi ty disappears below - 70 at% Zr whi1e in Cu-Zr i t only
disappears be10w - 35 at% Zr(4.6).
The compositiona1 dependent trend has been interpreted as due to
chan~es in the bare density of states at the Fermi energy Nb(0)(4.7>.
This ls supported by ultraviolet photoelectron spectroscopy (UPS)
measurements and band structure calculations(4.8). The binding energy of 1
the d band is related qual1 tativily to the late transition meta1; whlle
the Zr 4d contribution to Nb(Q) ls found to be roughly constant, the late
transition metal contribution Increases on golng from Cu- to Ni- to Co- to
Fe-Zr.
•
•
·61·
Analysis of the results in the above work vas done using the HcHillan
equation described in Chapter 1. Bowever results from Fe-Zr (and perhaps
Co-Zr) can not be interpreted in such a simple manner. Bere T falls much c
faster with composition than in Cu-Zr or Ni-Zr, while the density of
states does not(4.6). This 1s interpreted as be1ng due to magnetic
effects(4.7), e1ther localized magnetic moments or spiq·fluctuations.
Localized magnetic ~oments can be ruled out because of an upper bound
imposed by temperature dependent susceptibility. By estimating an upper
bound to the slope of X vith temperature and treating the system as
Curie·Veiss we get a generous upper bound of the number of localized
magnetic moments of the system. For Fe2SZr7S ' where the effect should be
the largest of the systems measured, temperature dependent susceptib11ity
measurements(4.9) lead to an estimate of an upper bound of less than 5 ppm
,10ca11zed magnetic moments, ie. fewer than the resolut1on of the test.
This leads to the conclusion that localized magnetic moments are not
responsible.
On the other hand clear evidence for spin· fluctuations in amorphous
Fe-Zr has been seen on examining temperature dependent resistivity(4.10).
The authors find that at higher concentrations of 1ron the low·temperature
resistivity behaves differently from that of other materials. Vith
increase of temperature the resistivity first increases before decreasing
as expected. The authors show clearly that the resistivity
Ap(T) = peT) - p(4.2) can be fit to the c)rve of Ap(T) vs T due to spin·
c -62-
fluctuations(4.11). , "
Before turnlng to the effects of relaxation It ls worth re~arking -~-~-=~~-' ~
that the effects in Co-Zr, as one would expect, lie between Fe-Zr and Ni-
and Cu-Zr, and the extent to which spin-fluctuations are important is
debatab1e. However at the zirconium compositions of interest in the
present work aIl authors agree that magnetic effects are sma11(4.6)(4.7).
If the difference in behaviour of T in Fe-Zr described above is due c
to spin-fluctuations then one may expect in this system a different
sensitivity to thermal annealing. Annealing a samp1e at temperatures we1l
be10w the crysta11ization temperature induces smal1 structural changes in
the glass. The effects of sma11 structural changes can thus be examined
without the added complication of changes in composition. Many' workers in
the field have examined the effects of annea1ing, both for reversib1e and
irreversib1e changes in structure. Reversible relaxation is discussed in
section 4.3.
York done to de termIne the effect of lov temperature annea1ing
Inc1udes systems such as Zr-based glasses(4.12)(4.13). Zirconium-rich
a110ys have been used and T , measured resistIve1y, measured to monitor c
changes in the a11oys •. Upon long time annea1ing of t~e al10ys for very
low annea1 temperatures, T was found to saturate. Differences in the c '
tendencles to satura te are ascribed to differences in crysta11ization at
" this stage. The present work does not support this Interpretation as in
the presênt work there ls no evldeh~e of any crysta111zation for such
•
•
-63·
short periods of annealing.
Ve now present a brief summary of the influence of spin-fluctuations
on superconductivity. The effect of spin-fluctuations is simple: whereas
the attracti~e electron interaction is phonon mediated and works between
pairs of electrons vith anti-parallel spins, spin-fluctuations arise from
an electron-electron intra-band interaction. A second electron of t'
opposite spin i5 attracted to a tirst electron via phonons. Near the
first electron there is a large number of electrons with parallel spins
and this hinders the second electron from following the first electron.
The two electrons then have a smaller effective attraction. Thus the
electron-phonon interaction is effectively decreased, depressing
superconductivity. Because this interaction is most effective where
electron spins can allgn ferromagnetically it has its greatest effect for
strongl~ enhanced paramagnets.
The spin-fluqtuation interaction for transition metals ~as introduced
numerically(4.14) into the HcHillan e·quation (equation 1.5). This
approach proved useful for some materials, as evidence~ by the fact that
the electron-phonon interaction parame ter now varied regularly vith
valence for the transition metals, vhich, although ex~ected, vas not
possible with the simpler expression.
4 15 ' It vas later shown(' ) that the effect of spin-fluctuations could
be included analytically in the HcHillan equation by renormalizing the ~
electron-phonon (mass-enhancement),interaction parameter ~ep by a spin-
v
r 1
c
c
-64-
fluctuation mass enhancement parame~er ksf (see below). In the model kep
kep * 18 renormallzed to - and ~ is enhanced and renormalized to 1+ ksf
* fi. + ksf . 1+ k • * Substituting these new forms for ~ and ~ into equation (1.5) »ep
sf
results ln the modified HcMillan expression:
Tc = 1 ~5 exp [- _l_+_Àe~p,,--+_k~S~!l kep - Àsf-fJ.
/ ( 4.4)
In the HcHillan expression the top line in the exponential is the electron
mass-enhancement factor which is now enhanced further by ksf ' the spin-
fluctuation mass enhancement parameter; the bot tom I1ne con tains the -
effective coupling which is reduced by ksf' It should be noted that this
simple expression has been critisized by Leavens and HacDonald(4.16) who
point out that more information about the spin-fluctuations is required
(e.g. a characteristic frequency)_ Thus equation 4.4 must be regarded as
an approximation.
ksf
is given by(4.17)(4.l8):
9 - [ p~ Ï 1 >. s f = ï I ln 1 + 12 (1-1) ( 4.5)
Pl Is the momentum cu:off factor for spin-fluctuations, the upper limit to
the momentum of spin-fluctuations expressed as a fraction of~. Ï is the
5toner enhancement factor for the valence (Pauli) magnetic susceptibility

•
o
•
-65-
which results from the Intra-band exchange interaction. The enhanced ... valence susceptibility can be wrltten as:
(.4.6)
Here Nb(Q) is the bare denslty of electron states in units of states at erg mole
(~2 the Fermi energy RF' and ~, the Bohr Magneton, is in units of -C-' .
'~ Nb(Q) can not easily be measured directly except by electron tunneling.
However the mass enhancement densi ty of states N~'(O) = Nb(O){ 1 + À + À f) ep s
can be measured by specifie heat or, as in the present case, by measuring
the upper critical field as a function of temperature. Since amorphous
superconductors are type II, as discussed in Chapter 1, to extract NÀ(O)
, (4 19) one must use the following equations' which aré valid for
superconductors in the 'dirty' limit:
-10 H (dHc2) NÀ(O) = -(9 ',451xlO ) pd dT T
b N~(O) N (0) = ~--:---.;,..,t. __ -:-
(1+ X + X f) ep s
c (4.7)
(4.8)
states ln units of V t ' where H • molecular weight; the resistivity p is \ e a om \
3 measured at 4.2 K in o-cm; d = density in g/cm . A value for the valence
susceptibility (Xv) can be found by measuring the total susceptibi11ty X
and using
\ X - Xv + xcore + Xvv (4.9)
c -66-
.~
Contributions to total susceptibllity are as follovs: the valence
susceptibility xv; xcore is the diamagnetic core, or Larmor,
susceptibility, vhich Is due to the filled shells of electrons; and Xvv
vhich 15 the Van Vleck paramagnetic susceptibility, t~e correction to the
core susceptibility for atoms vith unfilled electron shells_
By manipulating the formulae above, it is possible to ob tain values
(dHC2)
Thus, knoving Tc, X, and ~ T ' it is c
possible to estimate the magnitude of the electron·phonon and spin-
fluctuation parameters. These equations vere used by Altounian and
Strom-Olsen(4.6)(4.20) in their analysis of the comp~sition dependence of
T in Cu-Zr, Ni-Zr, Co-Zr, and Fe-Zr. These authors used the folloving c
values of the unknown parameters. * ~ , as ls usually done for
zirconium(4.21) systems vas approximated by the constant 0.13. Note that
the constant 0.13 is not an experimentally known quantity, but rather is
consistent for aIl 4d superconducting systems. The momentum cutoff factor
2 for spin-fluctuaUons vas taken as Pl = 1/6. Again, this is not an
experimentally known quantity, but, chosen as 1/6, leads to consistènt
analyses for zirconium-based systems(4.22). The diam~gnetic core, or
Larmor, susceptibility, is typically = -20 x 10-6 emu/mole for Zr and
-6 , - -29 x 10 emu/mol~ for Fe,vhl1e the most consistent
results(4.20)(4.23) for the Van Vleck susceptibillty Indlcate that the
latter ls typically -6 = 115 x 10 emu/mole for Zr and negligible for Fe
----~-- ~~-------------
1
•
-67-
for lov Fe concentrations.
V,~lues for the Van Vleck term are not obvious, ainee this term can
cr--~~t ~e) measured di rec tly • The cited values vere obtained from analysb of
data of the Knight shift in amorphous Cu-Zr, measured by NHR. Since the
values are difficult to obtain and can not easlly be verified they are
probably inaccurate. Small errors in xcore and Xvv are not important in
the present york because ye look at changes vith annealing and there is no
evidence ta suggest that either-x or Xvv changes' significantly upon \ core .
annealing. An error in these values vould induce an offset in the results
but yould not upset the trends in results. If these values do change
significantly upon annealing then the analysls presented here for annealed
samples would have to be modifled for more meaningful results.
Table 4.1 shoys the values for Nb(O), Ï, ~ ,and Àsf for zirconiumep
rich Fe-Zr. Values quoted are for as quenched samples and for those ~
annealed at 488 K for 500 minutes. The anneal time vas chosen to be
before the break in the curve of Tc vs tanneal for ~e22.SZr77.S and
Fe2SZr75 samples and after the break for both Fe20ZrSO Il and 12.
Ni2SZr7S is included for comparlson. (dHC2)
Values of Tc' x, and crr- Tare c
taken from the data.presented in Chapter 3. It should be noted, hovever,
" that the values obtained are not exact since a number of approximations
were made to arrive at the equations. The calculations show that for each
sample the values of Nb(O), Àsf ' and perhaps Àep' presented in table 4.1,

"
c
sample
as quenched ,
Pe20~rSO #1 pe20ZrSO #2
.,--Pe22.5~rn_5 . Pe25Zr75 Ni25Zr75
annealed
Pe20ZrSO #1
Pe20ZrSO #2
- Fe22.5Zrn.5 Pe2SZr75 ,
N125Zr75
• (
-.
·68-
Table 4.1
Calculated values b -of N , l,
_Nb ( statesml l eV-ato r-'
, \ /
1.413::!O.œ 'Q.581:!O.015 ---1.,462 0.592
1.291 .0.699
1.395 0.688
1.359 0.2~7
.,
1.362 0.554
1.346 0.595
- 1.210 0.628
1.355 0.666
.1.418 0.224
/'
•
• A. ep' and Xsf
\
Xep ).. sf \
0.61S:!O.01 0.050+-0.005
0'.591 0.053 '
0.661 0.100
0.603 0.093
0.551 0.006
0.61'0 0.à43 ,';"
0.600 0.054
0.613 . 0.066
0.598 0.082
0.53S .0.004
._""" , ,.
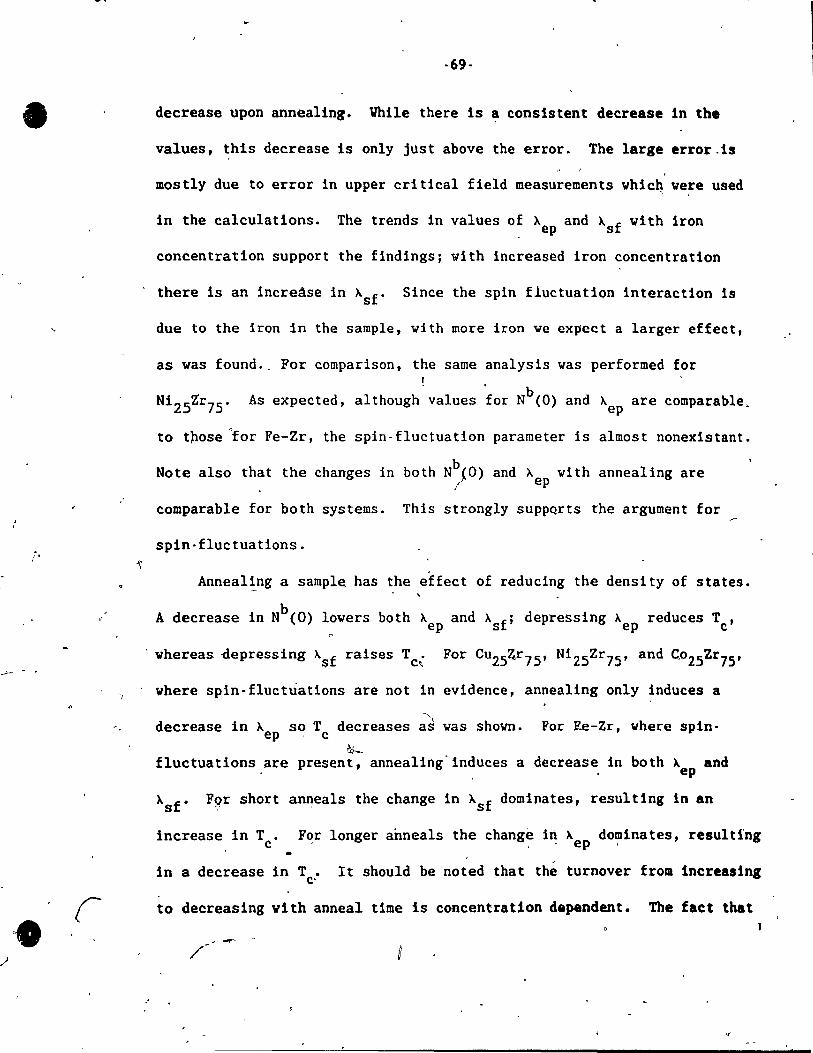
•
Î
• "
-69-
decrease upon annealing. Vhlle there IS a consistent decrease in the
values, this decrease is only just ab ove the error. The large error.la
mostly due to error in upper critical field measurements whic~ were used
in the calculations. The trends in values of x and X f with Iron . ep s
concentration support the findings; vith increased Iron concentration
there is an increâse in Xsf ' Since the spin fluctuation interaction is
due to the iron in the sample, vith more iron ve expect a larger effect,
as was found .. For comparison, the same analysis was performed for / . . b
As expected, although values for N (0) and À are comparable. ep
to those for Fe-Zr, the spin-fluctuation parame ter is almost nonexistant.
Note also that the changes in both Nb(O) and À vith annealing are / ep
comparable for both systems. This strongly sUPPQrts the argument for
spin-fluctuations.
Anneal!ng a sampl~ has the effect of reducing the density of states.
A decrease in Nb(O) lowers both Àep and Àsf ; depressing Àep reduces Tc'
whereas ~epressing Àsf raises Tc; For CU2S4r7S' Ni 2SZr75 , and C02SZr75 ,
where spin-fluctuations are not in evidence, annealing only induces a
" decrease in À so T decreases as was shown. ep . c &-..
fluctuations are present, annealing'lnduces a
For ~e-Zr, where spin-
decrease in both À and ep
Àsf ' F~r short anneals the change in Àsf dominates, resultlng ln an
increase in T. For longer anneals the change iri, À dominates, resultIng c ep .
in a decrease in T. It should be noted that the turnover from Increasing c'
to decreasing vith anneal time is concentration depandent. The fact that
/

c 1
-. 1 \ .
..
·70-
this turnover point occurs at much shorter annea1 t1mes for the lover
concentrations of Iron Ind1cates thaot-' the turnover 1s caused by a
saturation of Àsf ' so at the longer annea! tlmes on1y Àep ls affected and, ,
Tc decreases.
Spin-fluctuations a1so explain the break in the trend of increasing
quenched --8110ys • The increase in T vith decrease in valence of the 3d c
e1ement is due to an Increase ln the electronic denslty of states vIth a
subsequent Increase ln Àep ; the decrease seen in Fe2SZr75 ls due to the
added enhancement of Àsf and the su~sequent depresslon of
superconductivity.
1)
o
•
·71-
4.3 Reversible Relaxation
Besides the irreversible interactions descrlbe~ above, experiments
have been performed to provide inslght into the reverslble component of
structural relaxation. It has been demonstrated unequlvocally that there
ls a small reversible relaxation effect(4.24). Research has been done to
understand the nature of this reversible process but so far there has been
no satisfactory explanation.
The idea that the reversible relaxation is controlled by changes in
chemical short range order (CSRO) has been promoted(4.25). CSRO desribes
the situation where the chemical composition around the atoms of each
alloying element is.different from the random average. It has been
suggested(4.25) that changes in CSRO could occur by small cooperative
rearrangement of atoms. In the model of CSRO 1t ls assumed that in most
cases only the nearest neighbour shell contributes tô changes in observed
properties due to CSRO.
An al ternate mechanism for the reversible process to occur ls that
the reversible effect could occur by diffusive jumps(4.26) vhich are
governed by defects moving ln a siml1ar manner to vacancies in crystals.
Analysls suggests that consecutive atomic 'jumps occur on a mean time of -
lO minutes and that the diffusIon coefficient is consistent vith the
kinetics of CSRO.
A third proposal(4.27) makes use of a simplified energy functton dU
• 0
c
c
·72-
.a and assumes that the relaxation b~haviour of an amorphous material can be
described qual1tatively in terms of energy barrlers. llhen a sample ls at
a low temperature it could be exp~cted to lie at a local minimum of dU.
If energy is imparted to the system it could be expected to overcome an
energy barrier, moving to a different energy level'1 and, if rapidly
quenched, vould remain at the other energy level. In this way a sample
\
cou1d be annealed reversibly betveen energy levels. A possible mechanism
1
for this process c6uld be the diffusion jumps mentioned above. The
authors(4.27) investigate the reversible relaxation behaviour of Ni24
Zr76
'using the superconducting transi tion temperature T as a moni tor of c
relaxation _ The behaviour is examined in much the same way as in the
present work and a reversib1e component to the relaxation is found.
The above discussion leads to"an ana1ysis of our results for c,
reversible relaxation. The resul ts obtained demons tra te tha t in the
systems examined vherf! there was any reversib1e relaxation at aIl i t vas
not a very large effect. In fac t it was on1y just seen above the noise
Inherent in the experiment. Other workers(4.13) have monitored reversible
relaxation using the superconducting transition temperature and also
noticed that it is not great1y affected, being small compared to the
i rreversi hIe componen t •
The" a110ys N133Zr67 , Cu33Zr67 , and (CuNi)33Zr67 were first examined.
This vas done simllarly to the method used by other vorkers(4.27) and is
descrlbed, in Chapter 3. \le found upon annealing cyclically between two
)

--------- -----
o
•
-73-
li,
temperatures after an initial serie_s of anneals that' in both Ni33
Zr67
and
Cu33Zr67 there vas a smaH reversible component of relaxation, only just
ab ove the resolution of the exper~ents; in (CuNi)33Zr67 none vas
detected. It is possible that the reversible component of (CuNi)33Zr67'
if present, vent undetected because of the uncertainty in the
measurements. If (CUNi)33Zr67 has a reversible component of relaxation,
hovever, it must be smaller than that of ei ther cu33Zr67
or Ni33
Zr67
,
This finding is contrary to vhat one vould expect from the CSRO model
vhich indicates that tvo similar elements in a glass vould lead to greater
~~}
changes in CSRO vi th annealing than glasses vi th only one of the elemen ts,
Instead of CSRO i t is possible to consider the reversible 'relaxation
in terms of diffusion of one or tvo elemen ts into the other elemen t. A c'
comparison of diffusion rates of Cu, Ni, Co, and Fe in amorphous Zr vas
not possible. If ve look at their diffusion rates in a_zr(4,28) ve find
tha t a t - 830 0 C they are roughly the same. If one vere to conjec ture hov
<J1J their diffusion rates vould compare in amorphous Zr one vou Id guess that
again they are on the same order but that perhaps the diffusion rates
increase slightly on going from Fe and Co, to Ni and Cu because Ni and Cu
have closed d-sheHs in amorphous zirconium glasses" v~ereas Co and Fe have
open d-shells; so one vou Id expect Ni and Cu to in terac t less vi th, 'and "
therefore have a greater mobillty in, amorphous Zr. If this vere the
origin of reversible relaxati~n then one would not expect (CuNi)33Zr67 to
have a greater reversible component than ei ther Cu33Zr67 or Ni33Zr67'
---------------------------------------------------------..
c
t
\
-74·
~
reversible relaxation and the results compared. It vas found that 1
although Ni24Zr76 had a large reversible component relative to that of
Ni33Zr67 , neither Co2SZr75 nor Fe2Szr75 displayed any signs of one. The
effect seen 1n Ni24~r76 vas somewhat smaller than reported in reference
4.27. In light of the diffusion argument, presented above, it is not
surprlsing that Ni~4Zr76 displayed signs of reversibillty vhile neither
o
•
o
• ,\
·15-
ChaD ter 5 . Conclusion [
) ",
,1 1
The effects of annealing on 'tl1e superconducting transition
temperature, Tc' of X-Zr (X a Fe, Co, Ni, Cu) metallic glasses at close to
15 at% Zr has been examined. It was found that while T in Cu-, Ni-, and c
Co-Zr, as is usual, decreased on annealing, in Fe-Zr T increased for c
short annea1 times, the first time that such an effect has been seen. AlI
,,\
,\ systems showed a logarithmic dependence on anneal Ume and none exhibited
any tendency for T to saturate. In the three systems vhere T decreased c c ( "
·cJ
on annealing, the greatest effect vas observed in Cu-Zr and the least in
Co-Zr.
A more detailed examination vas made in Ni 25Zr75 and several samples
of Fe-Zr between 15 and 80 at% Zr. Changes in T vere analyzed through c
the McMillan equation, suitably modified to take account of spin-
fluctuations via a spin-fluctuation mass enhancement parame ter ~sf' It
vas found that in both systems the electron-phonon coupling decreases but
that in Fe-Zr this decrease i$ more than offset by a corresponding
decrease in Asf which effectively enhances superconduct~vity. Inclusion~'
of a spin-fluctuation term in the HcHillan equation for T adequately . c
described the behaviour of Fe-Zr in the compositions studied.
Besides this Irreversible component of relaxation a reversible
component was sought. Vhile a small reversible change in Tc vas found for
both Ni-Zr and Cu-Zr, none vas found in the simllar ternary glass
:e (CuNi)-Zr. Also no reversible change vas found in either Co-Zr or Fe-Zr. , .
1
The -results-, although not conclusive,- ind1cate that the reversf61e
component of relaxation 1s not due to chemical short range order (CSRO),
but rather due to differences in diffusion rates of the 3d element in
amorphous Zirconium.~
'.
,;
,)
, c
-
<l.
11
"
n -
·77· " o
Reference§
1.1 J. Ktamer, Ann.Phys. 12., 37 ('1934); J. Kramer, ~.Phys. .lQ§., 675 J
(1937)
1.2 V. Klement Jr., R.B. Villens, P. Duvez, Naturé"ill, 869 (19-60) )
1.3 T. Egami, Mater.Res.Bull. 11, 557 (1978)
1.4 A.C. Anderson, C.C. Koch, J.O.ScarbrQugh, Phys.Rev.B Z&, 1156
(1982)
1.50
T. Egami, Amorphous Metallic Alloys, ed. F.E. Luborsky, Ch.7,
Buttervorths, London, 1983. '.,
1.6 B.S. Berry, V.C. Pritchet, Phys.Rev.Lett. 34, 1022 (1975);
V.Chambron, A. Chamberod, Solid State Commun. 12, 61 (1980) \
1.7 D.M. Kroeger, C.C. Koch, J.O. Scar~rough, C.G. McKamey, Phys.Rev.a :,
29, 1199 (1984)
1.8 L.P. Gor'kov, Zh.Eksperim.i.Theor.Fiz. 36, 1918 (1959). Eng.
transI.: Soviet Phys •. JETP 2" 1364 (1959)
1.9 E. Domb, V:L. Johnson, J.Low Tem,p.Phys. 33, 29 (1978);
R. Koepke, G. Bergmann, Solid State Commun. ~, 435 (1976)
1.10 N.V. Ashcroft, N.D. Mermin, Solid State Physics, Ch.17, Saunders
College, PhIladelphia, 1976 >,<11
1.11 J., Bardeen, L.N. Cooper, J.R. Schrieffer, Phys.Rev. lQ§., 162
(1957); 108, 1175 (1957)
1.12 ,\
G.M. Eliashberg, Zh.Ek.spe~l1Jl 1. Teor. Fiz • .Jj!, 966 (1960);' 12., 1437 (1960). Eng. transI.: Soviet Phys" . JETP ll~ 696 (1960); li, 1 ~OO (1961);
A.B. H1gdal, Zh.Eksperim. 1. Teor. Fiz. li, 1438 (1958) Eng.
transI.: Soviet Phys •. JETP l, 996 (1958)
()
1 1
,)
-c
·78·
1.13 V.L.HcHillan, Phys.Rev. l[l, 331 (1968)
-~-------
Z. Altounian, private communication
2.2 B.P. Klug, L.E. Alexander, X-Ray Diffraction Procedures, Ch.5,
Viley Int~~science, New York, 1974
, 2.3
2.4
2.5
R. Richter, H.Sc. Thes!s, HcG!ll University, Montreal, 1984
G.R. Vhite, Experimental Techn.lgues in Low·Temperature':Physics,
pp.104-105, Oxford Universi ty Press, London, 1959
C.J~ ~'Connor, Progress in Inorganic Chem1stry, ed. S.J. Lippard,
12" pp.216-218, Vlley Interscience, New York, 1982
2.6 A. Cambron, M.Sc. Thesis, McGill University, Montreal, 1986
3.1 Z. Altounian, J.O. Strom:Olsen, Phys.Rev.B 27, 4149 (1983)
3.2 S.J! Poon, Phys.Rev.B~27, 5519 (1983)
3.3 Z. Altounian, C.A. Volkèrt, J.O. Strom·Olsen, J.Appl.Phys. 57,
1777 (1985)
4.1 see ref. 3.3
\'
':'4.2 K. Samwer, B.v. Lohneysen, Phys.Rev.B 26, 107 (1982); "
G. von Minnigerode, K. Samwer, Physica B 108, 1217 (1981)
4.3 Z. Altounian, Tu G}J0 ... hua,' J. o. Str?m-Olsen, Solid State Commun.
!Q, 221 ( 1981 ) 1
4.4-:- D.'G. Onn, L.O. Yang, Y. Obi, K. Fukamichi, J .N~n·Crystal.So1.
.§l&§l., 1149 (1984); 1
D.G. Onn, 1;,,0. Yang, K. Fuk.amichi, SoUd State Commun. 47, 479
(1983)
4.5 H.G. Karkut, R.R. Bake, Phys.~ev.B 28, 1396 (1983)
4.6 see ref. 3.1 .
,,'
o
o )
-79-
4.7 M. Tenhover, V.L. Johnson, Physica B lQi, 1221 (1981)
4.8 V.L. Horuzzi, ~. Oelhafen, A.R. Villiams, R. Lapka, B.-J.
4.9
Güntherodt, J. Kûbler, Phys.Rev.B ZI, 2049 (1983);
P. Oèlhafen, Glassy Metals II, ed. B. Bech, B.-J. Güntherodt,
Ch.9, Springer-Verlag, Berlin, 1983
D.V. Baxter, private communication
4.10 J.O. Strom-Olsen, Z. Altounian, R.V. Cochrane, A.B. Kaiser,
Phys.Rev.B 11, 6116 (1985)
4.11 A.B. Kaiser, S. Doniach, lnt.J.Magn. l, Il (1970)
4.12 see ref. 3.2
4.13 S.J. Poon, Amorphous Mp,tallic Alloys, ed. F.E. Luborsky, Ch.22,
Butterworths, London, 1983
4~14 ,N.F. Berk, J.R. Schrieffer, P~ys.Rev.Lett. ll, 433 (1966);
M.A. Jensen, K. Andres, Phys.Rev. 165, 545 (1968)
4.15 J.M. Daams, B. Hitrovic, J.P. Carbotte, Phys.Rev.Lett. ~, 65
(1981)
4.16 ,C.R. Leavens, A.B. MacDonald, Phys.Rev.B 27, 2812 (1983);
see also D.M. Burnell, John Zasadzinski, R.J. Noer, R.L. Volf, G.B.
Arnold, SoI id State Commun. !l, 637 (1982)
4.17 T.P. Orlando, M.R. Beasley, Phys.Rev.Lett. 46, 1598 (1981);
J.R. Schrieffer, J.Appl.Phys. ~,642 (1968)
4.18 S. Doniach, S. Engelsberg, Phys.Rev.Lett. lI, 750 (1966)
4.19 Equations of the Ginzburg-Landau-Abrikosov-Gor'kov theory, as
presented by T.P. Orlando, E.J. MeNiff Jr., S. Foner, H.R. Beasley,
Phys.Rev.B lî, 4545 (1979)
4.20 E. Batalla, Z. Altounlan, J.O. Strom-Olsen, Phy~.Rev.B 11, 577
(1985)

..
"
c
l.
-----80-
4.21 B. Rietschel, B. V1nter, PhY$.Rev.Lett. !l, 1256 (1979): ':1>-~B. Rietschel, B. V1nter, V. Reichardt, Phys.Rev.B l!, 4284 (1980);
ref. 4.7
4.22 see ref. 2.1
4.23 B.-J. Bifert, B. Blséhner, K.B.J. Buschov, Phys.Rev.B'Z2, 7441
(1982)
4.24 see ref. 1.3 1 4.25 see ref. 1.5
4.26 A.L. Greer, J.Non-Crystal.Sol. ~&~ 737 (1984)
4.27' see ref. 1.4
4.28 G.H.Bood, R.J. Schultz, Acta Hetal. 22, 459 (1974)
\
\, ,
~ ,