Embed Size (px)
Citation preview
PANOECONOMICUS, 2013, 2, Special Issue, pp. 179-202 Received: 28 June 2012; Accepted: 25 October 2012.
UDC 336.748:330.55DOI: 10.2298/PAN1302179M
Original scientific paper
Zorica Mladenović
Faculty of Economics Belgrade, University of Belgrade, Serbia
Kosta Josifidis
Department of European Economics and Business, Faculty of Economics Subotica, University of Novi Sad, Serbia
Slađana Srdić
Department of European Economics and Business, Faculty of Economics Subotica, University of Novi Sad, Serbia
The Purchasing Power Parity in Emerging Europe: Empirical Results Based on Two-Break Analysis
Summary: The purpose of the paper is to evaluate the validity of purchasingpower parity (PPP) for eight countries from the Emerging Europe: Hungary,Czech Republic, Poland, Romania, Lithuania, Latvia, Serbia and Turkey.Monthly data for euro and U.S. dollar based real exchange rate time series areconsidered covering the period: January, 2000 - August, 2011. Given signifi-cant changes in these economies in this sample it seems plausible to assume that real exchange time series are characterized by more than one time struc-tural break. In order to endogenously determine the number and type of breakswhile testing for the presence of unit roots we applied the Lee-Strazicich ap-proach. For two euro based real exchange rate time series (in Hungary andTurkey) the unit root hypothesis has been rejected. For the U.S. dollar basedreal exchange rate time series in Poland, Romania and Turkey the presence ofunit root has been rejected. To assess the adjustment dynamics of those realexchange rates that were detected to be stationary with two breaks, the im-pulse response function is calculated and half-life is estimated. Our overall conclusion is that the persistence of real exchange rate in Emerging Europe is still substantially high. The lack of strong empirical support for PPP suggeststhat careful policy actions are needed in this region to prevent serious ex-change rate misalignment. Key words: Purchasing power parity, Real exchange rate, Unit root test, Structural breaks, Emerging economies.
JEL: C22, F30, F41.
It is widely accepted in the literature that changes in the real exchange rate during a period of time can be seen from the viewpoint of the purchasing power parity (PPP) theory. This theory suggests that the exchange rate is adjusted in the direction of neu-tralizing the differential inflation rate among the countries acting as trading partners, so any change in the real exchange rate can be interpreted in relation to the equilib-rium level, in terms of deviations from the equilibrium. It is clear that adjusting ex-change rate actually reflects macroeconomic imbalances in the observed economies, as well as certain monetary failures, creating significant impact on the level of infla-tion and manufacturing. The absolute version of the PPP theory implies the equality of prices of identical baskets of goods denominated in national currencies. Therefore, the key principle this approach rests upon is based on the law of one price, i.e. the equality of currency purchasing power in all countries. On the other hand, the rela-
180 Zorica Mladenović, Kosta Josifidis and Slađana Srdić
PANOECONOMICUS, 2013, 2, Special Issue, pp. 179-202
tive version of this theory endorses the view that the percentage change in the value of one currency for the purpose of equalizing the value of the selected basket of goods should respect the differences in the inflation rates between those two coun-tries. The sustainability of the PPP theory can be observed from the short-term and the long-term aspect. The most important determinants of the exchange rate devia-tions in short-term are: differences in consumption patterns and transaction costs, the implemented model of monetary policy, as well as the dynamics of adjustments to the price changes.
From the viewpoint of the trend regime applied, the selected European emerg-ing economies can be classified into three groups. The first group includes the Czech Republic, Poland and Hungary, i.e. countries which favoured a gradual approach in changing the implemented regime, considering the fact that they practiced central arrangements during the transition from fixed to flexible currency policy. The second group are the EU member states which have remained consistent in the implementa-tion of the selected regime, where on one hand we single out Latvia and Lithuania, which have favoured rigid regimes, while Romania has focused on higher and lower levels of flexibility. Countries which are not part of the European Union, Serbia and Turkey, belong to the third group and their orientation focused on flexible currency forms, while preserving the sequential approach. It is evident that the managed float in the regime of inflation targeting is the dominant currency strategy in the selected economies. Looking at the correlation between monetary and exchange rate regimes, Kosta Josifidis, Jean-Pierre Allegret, and Emilija Beker Pucar (2009) emphasize that the inflation changes, the degree of economic openness and the level of foreign re-serves are the most important determinants of the exchange rate in the period from 2000-2009.
In the process of abandoning the fixed and moving to more flexible currency regimes, the selected European economies are specific in certain aspects, while bear-ing in mind the numerous institutional and structural changes during the 1990s events. At the very beginning of the transition period, all countries were character-ized by macroeconomic distortions, which were mostly manifested in high rates of inflation and the enormous decrease in production. Fixing the exchange rate was considered to be suitable in the initial years of the stabilization program, since tight macroeconomic policies had a positive impact on the reduction of the inflation ex-pectations. However, when the direction of reforms was clearly determined, followed by the price and trade liberalization, stabilization of inflation and net capital inflows, some countries changed their orientation regarding the choice of exchange arrange-ments. In other words, as opposed to the role of the exchange rate as a psychological anchor, the priority was given to more liberal currency strategies.
The aim of this paper is to analyze the validity of the PPP theory for the fol-lowing eight European emerging economies: the Czech Republic, Latvia, Lithuania, Hungary, Poland, Romania, Serbia and Turkey. Our analysis covers monthly data for the period from January 2000 to August 2011. The uniqueness of this research is primarily reflected in the selected sample and the observation period in terms of strong economic turbulence, monetary and real shocks during the transition period, as well as in focusing on countries with different currency strategies in the process of
181 The Purchasing Power Parity in Emerging Europe: Empirical Results Based on Two-Break Analysis
PANOECONOMICUS, 2013, 2, Special Issue, pp. 179-202
evaluation of the sustainability of the PPP theory. Furthermore, the three-dimensional importance of structural breaks, which can be divided into: (i) tendency of the movement of the time series in the long run; (ii) increasing the degree of accuracy assessment; (iii) the credibility of the results, has also influenced the choice of an appropriate econometric research technique. Tests which are designed for the analy-sis with the existence of one and (or) two structural breaks, are used in order to test the stationarity of the euro and U.S. dollar based time series of the real exchange rate. In order to additionally verify the obtained results, we also calculated the period of time that needs to pass so the deviations from the equilibrium decrease in half. Unit root tests that account for breaks to evaluate the validity of PPP are often employed in empirical studies. If the null of unit-root is rejected in favour of stationarity with breaks then real exchange rate is reverting to a mean that is a subject to occasional structural changes. This is relevant for policy decisions and forecasts based on PPP value as the long-run equilibrium value for the real exchange rate because the preci-sion of these forecasts relies on correctly estimating the long-run equilibrium values (Charles Engel 2000).
The paper is divided into four sections. After the introduction, Section 1, “Lit-erature Survey”, describes the dominant attitudes in the sources about the sustainabil-ity of the PPP theory. Section 2, “Data and Methodology”, presents the sample and the period of observation, a brief overview of the most important tests in this area, and a description of the econometric techniques applied in the research. Section 3, “Empirical Results”, contains the most important results of the implemented tests, while the last section presents concluding remarks and final findings about the valid-ity of the PPP theory in the selected economies. In the Appendix we provided addi-tional information on the empirical analysis with two structural breaks. 1. Literature Survey
Different approaches to testing the validity of the PPP theory can be classified into two groups, depending on the tests used: (1) testing the stationarity of time series of the real exchange rate; (2) identifying the cointegration relationship between the nominal exchange rate and the relative prices. Variations in the results are often based on the application of the appropriate econometric methodology, the character-istics of the selected sample, the length of the observation period and the frequency of the data used.
Saadet Kasman, Adnan Kasman, and Duygu Ayhan (2010) test the validity of the PPP theory on a sample of eleven countries of Central and Eastern Europe and three market economies, for the period from the early 1990s until September 2006. The results of the LM unit root tests that include one and two structural breaks in the analysis of the U.S. dollar based real exchange rate indicate the acceptance of the alternative hypothesis only in the cases of Romania and Turkey. On the other hand, observing the time series of Deutsche mark based real exchange rate, stationarity was found in seven of the fourteen countries. In the second part, the half-life test was ap-plied, where the estimated parameters indicated that on average, 1.9 years need to pass for the deviations from long-term balance to be diminished by 50%. Similar findings were obtained in research of Ali Acaravci and Ilhan Ozturk (2010), where
182 Zorica Mladenović, Kosta Josifidis and Slađana Srdić
PANOECONOMICUS, 2013, 2, Special Issue, pp. 179-202
the validity of the PPP theory was disproved in six out of eight transition countries in the period from January 1992 - January 2009. The results of applying the tests which take into account the presence of structural breaks in the analysis indicate that only the time series of Romania and Bulgaria accepted the alternative hypothesis and long-term accordance with purchasing power parity, while the theory itself remains a controversial issue. The paper Minoas Koukouritakis (2009) analyzed the long-term equilibrium relationship between the nominal exchange rate, the domestic and for-eign prices for ten countries that joined the European Union during the historic enlargement in 2004, as well as for Bulgaria and Romania. The results of the applica-tion of the Johansen cointegration methodology in the presence of a structural break in the analysis indicate the viability of the PPP hypothesis only for Romania, Bul-garia, Slovenia and Cyprus. Marked non-stationarity of time series real exchange rate in the Czech Republic, Hungary and Slovenia in the period 1992-2006 is featured in the work of Jani Beko and Darja Boršić (2007), and further analysis revealed the un-sustainability of the PPP theory for the above economies. On the other hand, Guven E. Solakogu (2006) supports the PPP theory on a selected sample of 21 countries using a panel approach, from the beginning of the 1990s to 2003. Noting that the half-life parameters for all time series related to the period of about one year, he came to the conclusion that the convergence is prominent in more than in less open economies.
The results of the research in the work of Dimitrios Sideris (2005) support the PPP theory in the long run on a sample of seventeen transition countries during the period from the early 1990s to the end of 2004. However, the calculated cointegra-tion vector suggests a change in symmetry and proportionality, where the main causes of deviations from the long-term stand-level are considered to be frequent interventions in the foreign exchange market. Similarly, Atanas Christev and Abbas Noorbakhsh (2000), in a sample of six countries in Central and Eastern Europe, using the cointegration method, support the PPP hypothesis and point out that the cointe-gration vector indicates a certain degree of distortion of symmetry and proportional-ity. Despite the short-term dynamics, they conclude that there is a long-term equilib-rium adjustment between cointegrated series of exchange rate and price level. The empirical results of the application of unit root tests in the work Athanasios Papado-poulos and Nikolaos Giannellis (2006) indicate the acceptance of the PPP theory in four selected economies (Hungary, Poland, Czech Republic and Slovakia). The de-termined stationarity of euro based time series exchange rate is interpreted in terms of the developed trade relations and removing trade barriers in the exchange in the Euro area.
What is specific in the research work of David Barlow (2003) is the analysis of sustainability of the PPP theory between two transition countries (Poland and the Czech Republic) and Romania, as examples of economies with reforms which were implemented later. The conclusion is interesting as it supports the viability of the hypothesis by looking at two more advanced transition countries, but it also justifies the analysis that involves Poland and the Czech Republic on one side and Romania on the other. This finding is explained by the fact that the exchange rate played a central role in the strategy of reducing the inflation in Poland and the Czech Repub-
183 The Purchasing Power Parity in Emerging Europe: Empirical Results Based on Two-Break Analysis
PANOECONOMICUS, 2013, 2, Special Issue, pp. 179-202
lic, unlike Romania, which in the beginning of the transition period has remained consistent in implementing the fluctuating currency arrangement.
Verification of the application of unit root tests which include structural breaks in the analysis is featured in the work of Štefan Lyocsa, Eduard Baumöhl, and Tomáš Vyrost (2011). Looking at the key macroeconomic indicators of the Czech Republic, Poland, Hungary and Slovakia in the period 1990-2009, there was a sig-nificantly higher level of stationarity after the implementation of tests with one and two structural breaks, while emphasizing the validity of the model which involves changes in the level and trend (Model C).
Rajmund Mirdala (2009) points out the non-stationarity of time series that de-pict the movement of selected macroeconomic indicators of Poland, the Czech Re-public, Hungary and Slovakia in the period 1998-2008, and additionally, he presents the reactions to monetary shocks in these countries with the impulse response func-tion. Selahattin Diboogly and Ali M. Kutan (2001) present similar empirical results, in the sense that nominal shocks had a dominant influence on the movement of the real exchange rate in Poland, while for Hungary the real changes had more prominent effect.
2. Data and Methodology
We estimated the acceptability and viability of the PPP theory for the following countries: the Czech Republic, Latvia, Lithuania, Hungary, Poland, Romania, Serbia and Turkey. We used monthly, log data about: euro based nominal exchange rate, U.S. dollar based nominal exchange rate, the harmonised consumer price index (CPI) in individual countries, the CPI index in the Euro area and the CPI index in the U.S. market, for the period January 2000 - August 2011. Taking into account the theoreti-cal knowledge about nominal and real dimensions in economics, real exchange rate series are formed by adjusting the nominal price level of a country and a per se CPI index:
rert = et - pt* + pt,
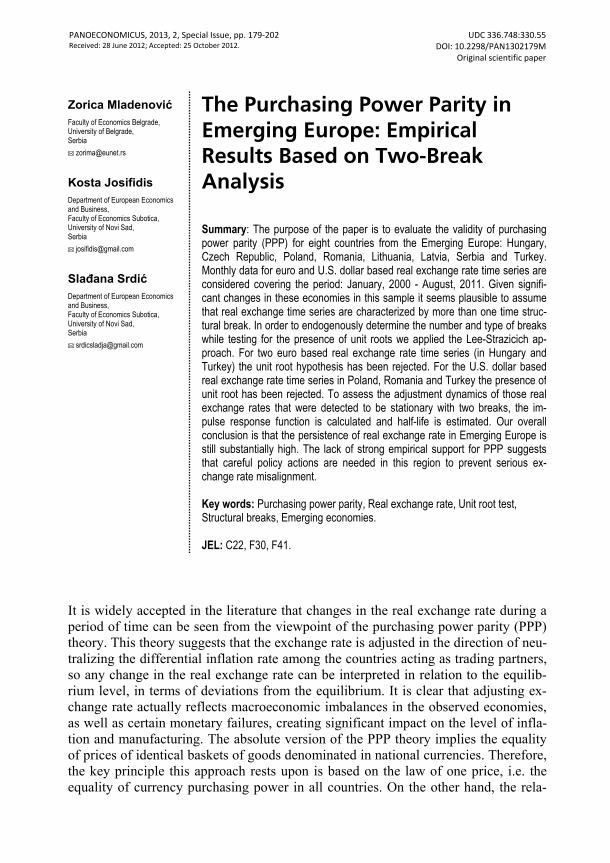
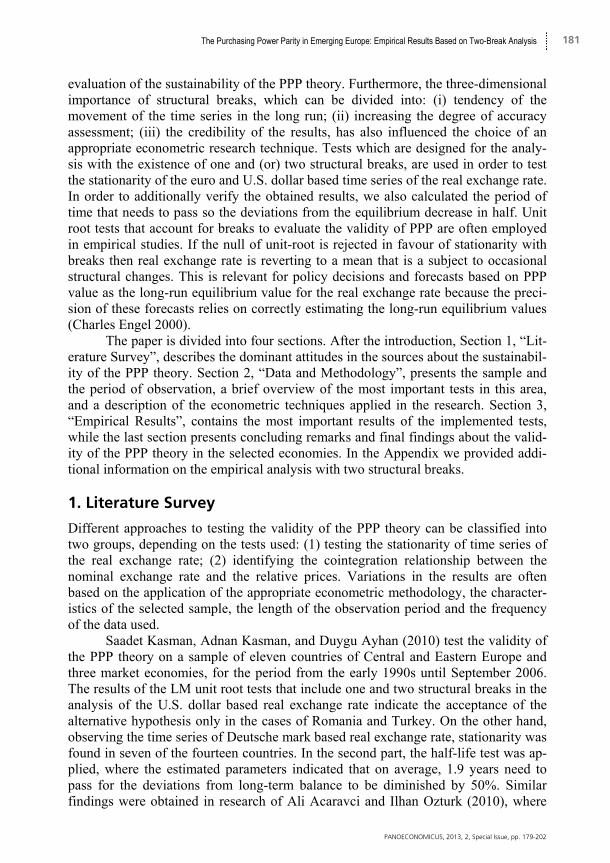
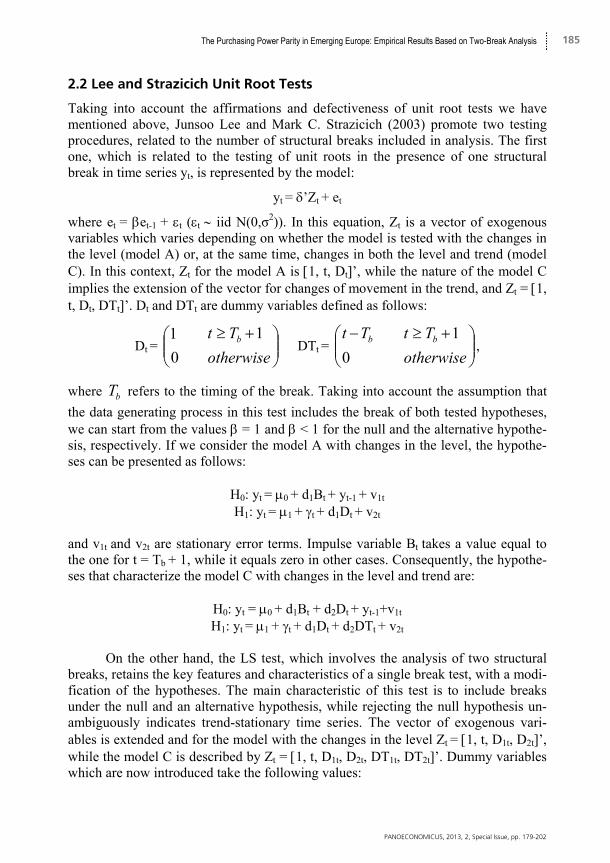
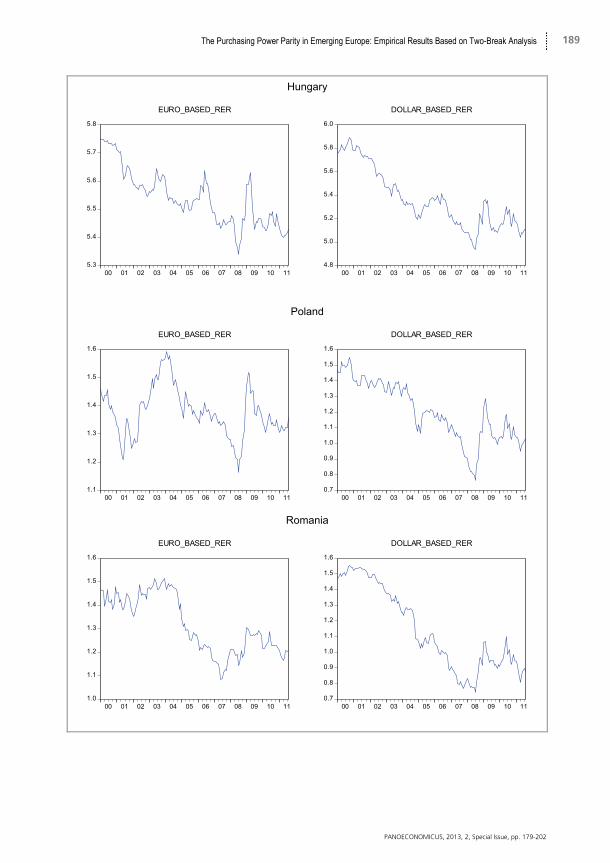
where rert is the real exchange rate, et is the logarithm of the nominal exchange rate, while pt* and pt denote logarithm of the data about the CPI index within individual countries and in the Euro area or the U.S. market, respectively. In order to obtain the initial insights into the movement of time series in terms of stationarity, we applied traditional ADF, KPSS and DF-GLS tests at the beginning, and after that, we imple-mented Lee-Strazicich tests with structural breaks in the analysis. Then, based on the modified forms of autoregressive model, we calculated half-life parameters and formed the corresponding confidence intervals. Finally, impulse response function is estimated for each real exchange rate time series that is derived from adequate ARIMA representation. The data in this paper are taken from the website of the Vi-enna Institute for International Economic Studies and analyzed using the software package E-Views 6.0 and RATS 6.20. The data about the euro and U.S. dollar based real exchange rate by individual countries are presented in Figure 1.
184 Zorica Mladenović, Kosta Josifidis and Slađana Srdić
PANOECONOMICUS, 2013, 2, Special Issue, pp. 179-202
2.1 Unit Root Tests and Structural Break
The traditional standpoint related to unit root tests was based on the assumption that the shocks only have a momentary effect and that they do not correlate with long-term time-series movement tendency. On the other hand, Pierre Perron (1989) points to the limited power of the standard ADF test, advocating the view that the series are adjusted to the deterministic trend after small and frequent shocks, while the persis-tence of the unit root increases with the presence of fewer and unexpected external variations.
Namely, when taking into account the approach which upon the inherent un-predictability of shocks and their impact on the path of macroeconomic series in the long run, the main goal of modelling structural breaks refers to the examination of their statistical significance and the exact date when they appear.
From the point of the historical genesis of the unit root tests with one struc-tural break, Perron (1989) developed a modified version of the Dickey-Fuller test, with test procedure which involves the presence of a break in both hypotheses, while the period of the break is fixed and is determined independently of the data. Recog-nizing criticism and conflicting opinions regarding the a priori determination of the point of the break, Perron (1990) developed a variant of the test where the period of the break is not predefined. Skepticism regarding the exogenous inclusion of the break into the analysis is also reflected in the work of Eric Zivot and Donald W. K. Andrews (1992), who developed a procedure of unit-root testing under the null, while the inclusion of the break in the trend function was observed under the alterna-tive hypothesis. It is evident that the rejection of H0 does not necessarily mean the absence of unit roots, but it certainly suggests the exclusion of the prediction of the existence of a unit root without a break. In the unit root tests with endogenous im-plementation of structural breaks in the analysis, the date of the break was deter-mined on the basis of t-statistics test of the unit root, with respect to the criteria of minimum values. The results of research work in Luis C. Nunes, Paul Newbold, and Ching-Ming Kuan (1997) basically provided the justification of the previous ideas and attitudes of 1992, by introducing some modifications in terms of including the break in both hypotheses and the application of sequential testing process.
In order to further improve and increase the level of implementation of unit root tests, Robin L. Lumsdaine and David H. Papell (1997) point to their sensitivity with respect to the number of structural breaks that are included into the analysis. Considering the limitations when including only one break, they promoted an ap-proach in which two structural breaks are included in the process of testing the sta-tionarity of time series. In relation to the findings of Perron (1989, 1990) and Zivot and Andrews (1992), there is noticeably more frequent rejection of the null hypothe-sis on the existence of unit roots, as well as less sensitivity in determining the date of the occurrence of shocks in relation to the presumption on their number. In addition, Natalie D. Hegwood and Papell (1998) argued that the half-life estimation of real exchange rate can be estimated with upward bias if breaks are neglected.
185 The Purchasing Power Parity in Emerging Europe: Empirical Results Based on Two-Break Analysis
PANOECONOMICUS, 2013, 2, Special Issue, pp. 179-202
2.2 Lee and Strazicich Unit Root Tests
Taking into account the affirmations and defectiveness of unit root tests we have mentioned above, Junsoo Lee and Mark C. Strazicich (2003) promote two testing procedures, related to the number of structural breaks included in analysis. The first one, which is related to the testing of unit roots in the presence of one structural break in time series yt, is represented by the model:
yt = ’Zt + et
where et = et-1 + t (t iid N(0,σ2)). In this equation, Zt is a vector of exogenous variables which varies depending on whether the model is tested with the changes in the level (model A) or, at the same time, changes in both the level and trend (model C). In this context, Zt for the model A is 1, t, Dt’, while the nature of the model C implies the extension of the vector for changes of movement in the trend, and Zt = 1, t, Dt, DTt’. Dt and DTt are dummy variables defined as follows:
Dt =
0
1
otherwise
Tt b 1 DTt =
0
bTt
otherwise
Tt b 1,
where bT refers to the timing of the break. Taking into account the assumption that
the data generating process in this test includes the break of both tested hypotheses, we can start from the values = 1 and < 1 for the null and the alternative hypothe-sis, respectively. If we consider the model A with changes in the level, the hypothe-ses can be presented as follows:
H0: yt = 0 + d1Bt + yt-1 + v1t
H1: yt = 1 + t + d1Dt + v2t
and v1t and v2t are stationary error terms. Impulse variable Bt takes a value equal to the one for t = Tb + 1, while it equals zero in other cases. Consequently, the hypothe-ses that characterize the model C with changes in the level and trend are:
H0: yt = 0 + d1Bt + d2Dt + yt-1+v1t
H1: yt = 1 + t + d1Dt + d2DTt + v2t
On the other hand, the LS test, which involves the analysis of two structural breaks, retains the key features and characteristics of a single break test, with a modi-fication of the hypotheses. The main characteristic of this test is to include breaks under the null and an alternative hypothesis, while rejecting the null hypothesis un-ambiguously indicates trend-stationary time series. The vector of exogenous vari-ables is extended and for the model with the changes in the level Zt = 1, t, D1t, D2t’, while the model C is described by Zt = 1, t, D1t, D2t, DT1t, DT2t’. Dummy variables which are now introduced take the following values:
186 Zorica Mladenović, Kosta Josifidis and Slađana Srdić
PANOECONOMICUS, 2013, 2, Special Issue, pp. 179-202
Djt =
0
1
otherwise
,1bjTt
2,1j DTjt =
0
bjTt
otherwise
1bjTt,
where Tbj, j = 1,2, denotes the date when the break appeared. Now for the model A, the next set of hypotheses is valid:
H0: yt = 0 + d1B1t + d2B2t + yt-1 + v1t
H1: yt = 1 + t + d1D1t + d2D2t + v2t
and Bjt = 1 for t = Tbj + 1, j = 1,2, and 0 otherwise.
Similarly, the hypotheses in the model C are expanded with Djt and DTjt com-ponents:
H0: yt = 0 + d1B1t + d2B2t + d3D1t + d4D2t + yt-1 + v1t
H1: yt = 1 + t + d1D1t + d2D2t + d3DT1t + d4DT2t + v2t
The test statistics of LM unit root test can be represented by the following regression:
yt = ’Zt + S~
t-1 + ut, S~
t = yt - ~ x - Zt~
, t = 2,...,T
~ - coefficients in the regression of yt on Zt and is the first difference operator ~ x - is given by y1 - Z1 (y1 and Z1 denote the first observations of yt and Zt, respec-
tively)1. LM t-test statistics of unit root null hypothesis when = 0 is denoted by , while LM unit root test is defined as: LM =
inf , where denotes the location of
the break ( = Tb / T). It is determined on the basis of the minimum t-statistics of the unit root test calculated for any potential breaks in the time series, with excluding the top and bottom 10% of observation. Table 1 presents the critical values for the mod-els A and C for both versions of the LS test, as guidelines in the acceptance or rejec-tion of the null and alternative hypotheses. These values refer to the sample T = 100 and they are derived by the authors of the test. Table 1 Critical Values of LS Tests for Models A and C
Level of significance One break Two breaks
C (model A) C/T (model C) C (model A) C/T (model C) 5% -3.57 From -4.45 to -4.50 -3.84 -5.29
10% -3.21 From -4.17 to -4.20 -3.50 -4.99
Source: Lee and Strazicich (2003, 2004).
1 There is a priori exclusion of deterministic components from the model (constant and trend, S
~t = yt -
~ x - Zt~
) with the idea that the test becomes robust to the size of the breaks. Test involves the use of
Zt. For the version of the test with one break Zt = 1, Bt ’ for model A, while in the model C, Zt addi-tionally includes component Dt,, where: Bt = Dt and Dt = DTt (Lee and Strazicich 2004). Under the version of the test with two breaks Zt = 1, B1t, B2t’ for model A and Zt = 1, B1t, B2t, D1t, D2t’ for model C (Lee and Strazicich 2003).
187 The Purchasing Power Parity in Emerging Europe: Empirical Results Based on Two-Break Analysis
PANOECONOMICUS, 2013, 2, Special Issue, pp. 179-202
In respect to applying unit-root tests that take care of structural breaks on real exchange rate, the result of stationarity with break in the deterministic function is in fact the case of quasi-PPP as named by Hegwood and Papell (1988) and later dis-cussed for developing countries in Mohsen Bahmani-Oskooee and Taggert J. Brooks (2006). Namely, changing mean and trend may help in capturing the impact of pro-ductivity differentials and thus reduce the length of time for the remaining shocks persistence2. 2.3 Half-Life Estimation
Unlike the previous research in this area, Barbara Rossi (2005) developed a method-ology for the half-life test which is acceptable for the AR(p) processes in general, as well as an appropriate approach for calculating the corresponding confidence inter-val. The estimated parameters are interpreted through the number of periods which are required for the real exchange rate deviations from equilibrium levels, which oc-cur as a response to shocks to the unit-level time series, to be reduced by 50%.
According to the formula for calculating the half-life:
cˆln
).ln(h
50
corresponding confidence interval with probability of 95% is:
250961
cc
ˆˆln)ˆ/).(ln(cˆ.h
where cˆ ˆ is an estimate of the standard deviation of c (Rossi 2005). c de-
notes the estimation of an autoregressive parameter defined earlier but from the model that is used to derive DF-GLS unit-root test statistics (Kasman, Kasman, and Ayhan 2010)3. 3. Empirical Results
The first part of this section presents euro and U.S. dollar based time series of real exchange rates, after which we outlined the results of unit root tests that do not in-volve structural breaks in the analysis.
2 Cf. Bahmani-Oskooee and Brooks (2006). 3 The DF-GLS test is based on the following regression:
errorrercrercrerc jtL
jjt
ct
11
where rerct is the GLS-demeaned/detrended real exchange rate (Graham Ellioth, Thomas J. Rothenberg, and James H. Stock 1996). Number L is usually chosen according to different information criteria given that autocorrelation is absent.
188 Zorica Mladenović, Kosta Josifidis and Slađana Srdić
PANOECONOMICUS, 2013, 2, Special Issue, pp. 179-202
Czech Republic
Latvia
Lithuania
3.1
3.2
3.3
3.4
3.5
3.6
00 01 02 03 04 05 06 07 08 09 10 11
EURO_BASED_RER
2.6
2.8
3.0
3.2
3.4
3.6
3.8
00 01 02 03 04 05 06 07 08 09 10 11
DOLLAR_BASED_RER
-.65
-.60
-.55
-.50
-.45
-.40
-.35
-.30
00 01 02 03 04 05 06 07 08 09 10 11
EURO_BASED_RER
-1.1
-1.0
-0.9
-0.8
-0.7
-0.6
-0.5
-0.4
-0.3
00 01 02 03 04 05 06 07 08 09 10 11
DOLLAR_BASED_RER
1.05
1.10
1.15
1.20
1.25
1.30
00 01 02 03 04 05 06 07 08 09 10 11
EURO_BASED_RER
0.6
0.7
0.8
0.9
1.0
1.1
1.2
1.3
1.4
00 01 02 03 04 05 06 07 08 09 10 11
DOLLAR_BASED_RER
189 The Purchasing Power Parity in Emerging Europe: Empirical Results Based on Two-Break Analysis
PANOECONOMICUS, 2013, 2, Special Issue, pp. 179-202
Hungary
Poland
Romania
5.3
5.4
5.5
5.6
5.7
5.8
00 01 02 03 04 05 06 07 08 09 10 11
EURO_BASED_RER
4.8
5.0
5.2
5.4
5.6
5.8
6.0
00 01 02 03 04 05 06 07 08 09 10 11
DOLLAR_BASED_RER
1.1
1.2
1.3
1.4
1.5
1.6
00 01 02 03 04 05 06 07 08 09 10 11
EURO_BASED_RER
0.7
0.8
0.9
1.0
1.1
1.2
1.3
1.4
1.5
1.6
00 01 02 03 04 05 06 07 08 09 10 11
DOLLAR_BASED_RER
1.0
1.1
1.2
1.3
1.4
1.5
1.6
00 01 02 03 04 05 06 07 08 09 10 11
EURO_BASED_RER
0.7
0.8
0.9
1.0
1.1
1.2
1.3
1.4
1.5
1.6
00 01 02 03 04 05 06 07 08 09 10 11
DOLLAR_BASED_RER
190 Zorica Mladenović, Kosta Josifidis and Slađana Srdić
PANOECONOMICUS, 2013, 2, Special Issue, pp. 179-202
Serbia
Turkey
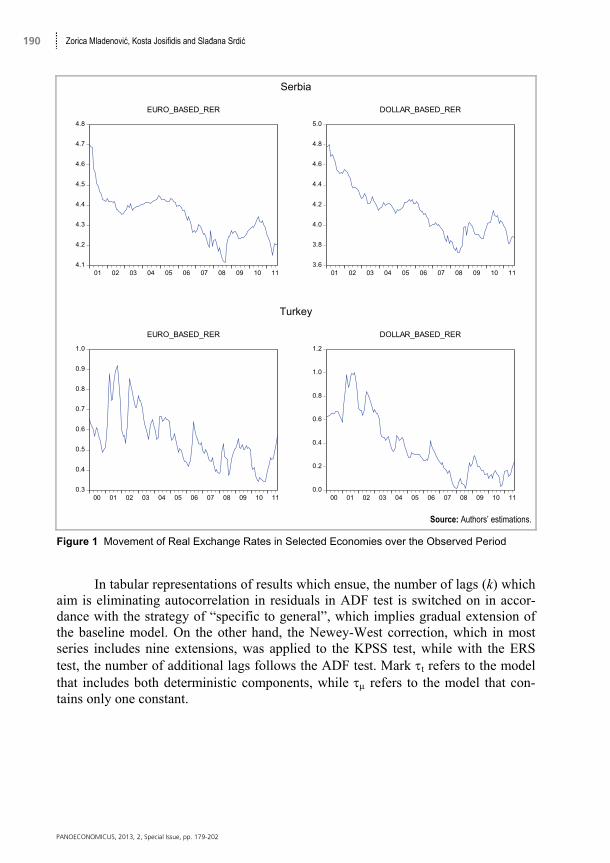
Source: Authors’ estimations.
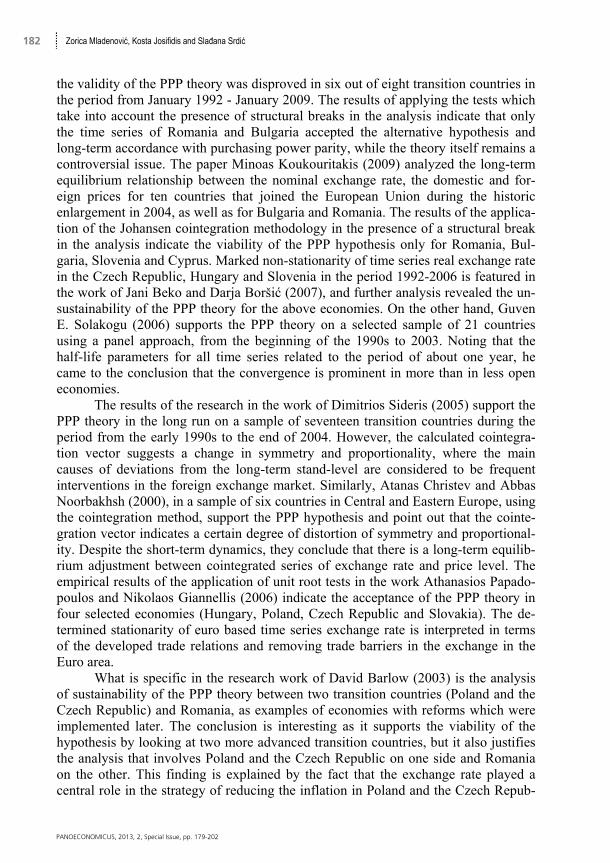
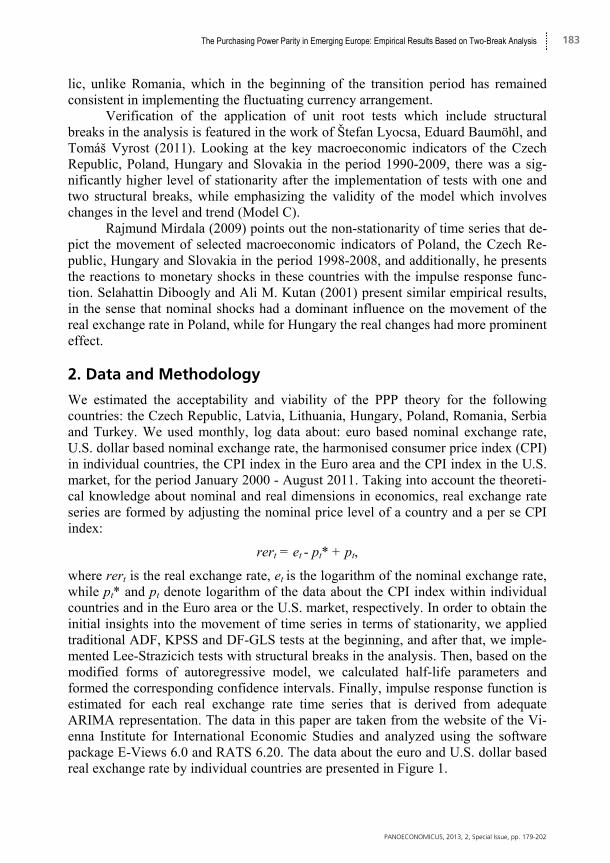
Figure 1 Movement of Real Exchange Rates in Selected Economies over the Observed Period
In tabular representations of results which ensue, the number of lags (k) which
aim is eliminating autocorrelation in residuals in ADF test is switched on in accor-dance with the strategy of “specific to general”, which implies gradual extension of the baseline model. On the other hand, the Newey-West correction, which in most series includes nine extensions, was applied to the KPSS test, while with the ERS test, the number of additional lags follows the ADF test. Mark t refers to the model that includes both deterministic components, while refers to the model that con-tains only one constant.
4.1
4.2
4.3
4.4
4.5
4.6
4.7
4.8
01 02 03 04 05 06 07 08 09 10 11
EURO_BASED_RER
3.6
3.8
4.0
4.2
4.4
4.6
4.8
5.0
01 02 03 04 05 06 07 08 09 10 11
DOLLAR_BASED_RER
0.3
0.4
0.5
0.6
0.7
0.8
0.9
1.0
00 01 02 03 04 05 06 07 08 09 10 11
EURO_BASED_RER
0.0
0.2
0.4
0.6
0.8
1.0
1.2
00 01 02 03 04 05 06 07 08 09 10 11
DOLLAR_BASED_RER
191 The Purchasing Power Parity in Emerging Europe: Empirical Results Based on Two-Break Analysis
PANOECONOMICUS, 2013, 2, Special Issue, pp. 179-202
Table 2 Unit Root Tests without Structural Break euro based real exchange rate
Selected economies: k DF-ADF KPSS DF-GLS Czech Republic 0 -2.58 (t) 0.09 -2.59
Latvia 1 -0.65 (μ) 0.65 -0.61
Lithuania 77
-1.34 (t) 0.22 (μ)
0.301.14
-0.59 1.25
Hungary 9 -2.14 (μ) 1.24 0.33 Poland 1 -2.64 (μ) 0.24 -2.07
Romania 5 -1.08 (μ) 1.07 -0.08 Turkey 1 -2.98 (μ) 1.07 -2.57 Serbia 11 -2.25 (t) 0.10 -2.08
Note: In the model which includes both deterministic components, the critical values are: -3.44, 0.146, -2.99 for the ADF, KPSS and DF-GLS tests respectively, while the determination of stationarity about nonzero mean values is calculated by using the following values: -2.88, 0.46 and -1.94. These critical values are available from the EViews output.
Source: Authors’ calculations.
Table 3 Unit Root Tests without Structural Break U.S. dollar based real exchange rate
Selected economies: k DF KPSS DF-GLS Czech Republic 0 -2.46 (t) 0.20 -2.43
Latvia 7 -0.85 (μ) 1.25 0.02 Lithuania 0 -2.45 (t) 0.13 -2.40 Hungary 8 -1.87 (μ) 1.26 0.08 Poland 0 -1.56 (μ) 1.26 -0.49
Romania 0 -0.96 (μ) 1.20 0.23 Turkey 2 -1.34 (μ) 1.26 -0.79 Serbia 7 -2.09 (t) 0.20 -1.23
Source: Authors’ calculations.
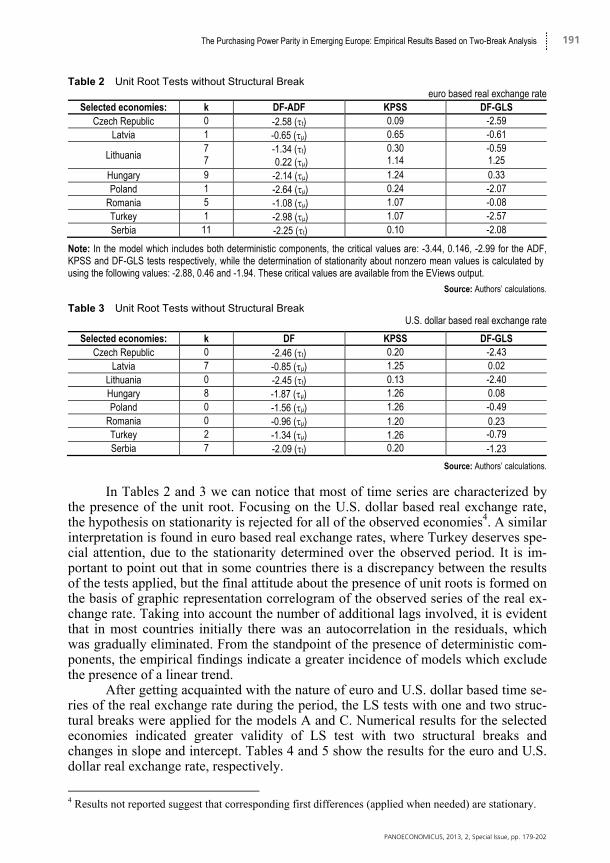
In Tables 2 and 3 we can notice that most of time series are characterized by the presence of the unit root. Focusing on the U.S. dollar based real exchange rate, the hypothesis on stationarity is rejected for all of the observed economies4. A similar interpretation is found in euro based real exchange rates, where Turkey deserves spe-cial attention, due to the stationarity determined over the observed period. It is im-portant to point out that in some countries there is a discrepancy between the results of the tests applied, but the final attitude about the presence of unit roots is formed on the basis of graphic representation correlogram of the observed series of the real ex-change rate. Taking into account the number of additional lags involved, it is evident that in most countries initially there was an autocorrelation in the residuals, which was gradually eliminated. From the standpoint of the presence of deterministic com-ponents, the empirical findings indicate a greater incidence of models which exclude the presence of a linear trend.
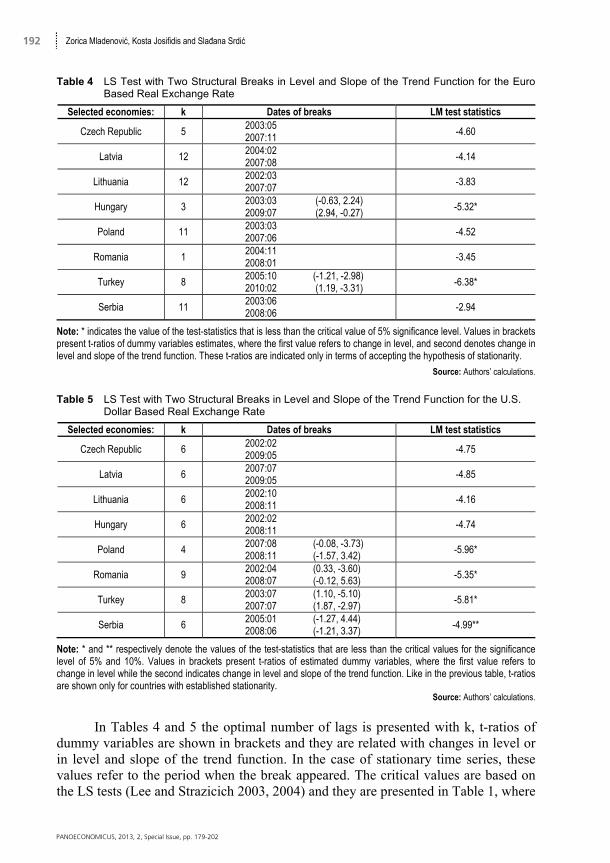
After getting acquainted with the nature of euro and U.S. dollar based time se-ries of the real exchange rate during the period, the LS tests with one and two struc-tural breaks were applied for the models A and C. Numerical results for the selected economies indicated greater validity of LS test with two structural breaks and changes in slope and intercept. Tables 4 and 5 show the results for the euro and U.S. dollar real exchange rate, respectively.
4 Results not reported suggest that corresponding first differences (applied when needed) are stationary.
192 Zorica Mladenović, Kosta Josifidis and Slađana Srdić
PANOECONOMICUS, 2013, 2, Special Issue, pp. 179-202
Table 4 LS Test with Two Structural Breaks in Level and Slope of the Trend Function for the Euro Based Real Exchange Rate
Selected economies: k Dates of breaks LM test statistics
Czech Republic 5 2003:05 2007:11 -4.60
Latvia 12 2004:02 2007:08
-4.14
Lithuania 12 2002:03 2007:07 -3.83
Hungary 3 2003:03 (-0.63, 2.24)2009:07 (2.94, -0.27) -5.32*
Poland 11 2003:03 2007:06
-4.52
Romania 1 2004:11 2008:01 -3.45
Turkey 8 2005:10 (-1.21, -2.98)2010:02 (1.19, -3.31) -6.38*
Serbia 11 2003:06 2008:06
-2.94
Note: * indicates the value of the test-statistics that is less than the critical value of 5% significance level. Values in brackets present t-ratios of dummy variables estimates, where the first value refers to change in level, and second denotes change in level and slope of the trend function. These t-ratios are indicated only in terms of accepting the hypothesis of stationarity.
Source: Authors’ calculations.
Table 5 LS Test with Two Structural Breaks in Level and Slope of the Trend Function for the U.S.
Dollar Based Real Exchange Rate
Selected economies: k Dates of breaks LM test statistics
Czech Republic 6 2002:02 2009:05
-4.75
Latvia 6 2007:07 2009:05
-4.85
Lithuania 6 2002:10 2008:11 -4.16
Hungary 6 2002:02 2008:11
-4.74
Poland 4 2007:08 (-0.08, -3.73)2008:11 (-1.57, 3.42)
-5.96*
Romania 9 2002:04 (0.33, -3.60)2008:07 (-0.12, 5.63) -5.35*
Turkey 8 2003:07 (1.10, -5.10)2007:07 (1.87, -2.97)
-5.81*
Serbia 6 2005:01 (-1.27, 4.44)2008:06 (-1.21, 3.37)
-4.99**
Note: * and ** respectively denote the values of the test-statistics that are less than the critical values for the significance level of 5% and 10%. Values in brackets present t-ratios of estimated dummy variables, where the first value refers to change in level while the second indicates change in level and slope of the trend function. Like in the previous table, t-ratios are shown only for countries with established stationarity.
Source: Authors’ calculations.
In Tables 4 and 5 the optimal number of lags is presented with k, t-ratios of
dummy variables are shown in brackets and they are related with changes in level or in level and slope of the trend function. In the case of stationary time series, these values refer to the period when the break appeared. The critical values are based on the LS tests (Lee and Strazicich 2003, 2004) and they are presented in Table 1, where
193 The Purchasing Power Parity in Emerging Europe: Empirical Results Based on Two-Break Analysis
PANOECONOMICUS, 2013, 2, Special Issue, pp. 179-202
* and ** indicate statistical significance for rejecting the null hypothesis at 5% and 10%, respectively.
The results which are presented in Table 4 indicate trend-stationary euro based time series of real exchange rate in Hungary and Turkey, while in other countries, we adhere to the decision on the existence of stochastic components. On the other hand, the numerical values in Table 5 indicate a higher level of stationarity for U.S. dollar based real exchange rate with respect to euro, given that on the 5% level of statistical significance, the alternative hypothesis of stationarity is adopted in Poland, Romania and Turkey. Results for Serbia also suggest stationarity around a deterministic trend, but only for the 10% level of significance. Detected break points are presented in Appendix with a short explanation of its key causes in the selected economies.
As we can observe from the graphic representation of the time series of the euro and U.S. dollar based real exchange rate, all countries are characterized by sig-nificant turbulence and changes in analyzed period (especially during the crisis). The set of factors that cause differences in the results among some countries in the euro or U.S. dollar based real exchange rate includes the Federal Reserve System and European Central Bank interest rate policy during the observed period, inflation dif-ferentials in the US economy and Euro zone, and consequent movements of the U.S. dollar and euro based exchange rate, heterogeneity of the exchange rate regime and monetary policies and different inflation rates in the observed economies, capital mobility dynamics, influence of speculative tendencies on currency markets, trade conditionality with the EU or with the American economy (balance of payments deficits), i.e. the degrees of euroization and dollarization.
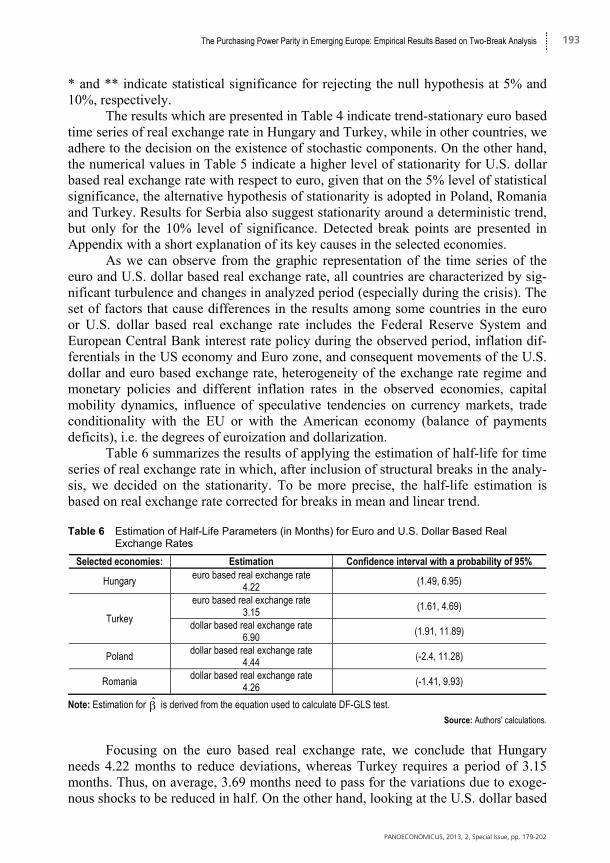
Table 6 summarizes the results of applying the estimation of half-life for time series of real exchange rate in which, after inclusion of structural breaks in the analy-sis, we decided on the stationarity. To be more precise, the half-life estimation is based on real exchange rate corrected for breaks in mean and linear trend.
Table 6 Estimation of Half-Life Parameters (in Months) for Euro and U.S. Dollar Based Real
Exchange Rates
Selected economies: Estimation Confidence interval with a probability of 95%
Hungary euro based real exchange rate4.22
(1.49, 6.95)
Turkey
euro based real exchange rate3.15 (1.61, 4.69)
dollar based real exchange rate6.90
(1.91, 11.89)
Poland dollar based real exchange rate4.44
(-2.4, 11.28)
Romania dollar based real exchange rate
4.26 (-1.41, 9.93)
Note: Estimation for is derived from the equation used to calculate DF-GLS test. Source: Authors’ calculations.
Focusing on the euro based real exchange rate, we conclude that Hungary
needs 4.22 months to reduce deviations, whereas Turkey requires a period of 3.15 months. Thus, on average, 3.69 months need to pass for the variations due to exoge-nous shocks to be reduced in half. On the other hand, looking at the U.S. dollar based
194 Zorica Mladenović, Kosta Josifidis and Slađana Srdić
PANOECONOMICUS, 2013, 2, Special Issue, pp. 179-202
real exchange rate, we can notice that estimated half-life parameters range from 4.26 in Romania over 4.44 in Poland, to 6.90 in Turkey, which gives the average of 5.2 months. Interval estimates of half-lives are much wider for dollar based real ex-change rates.
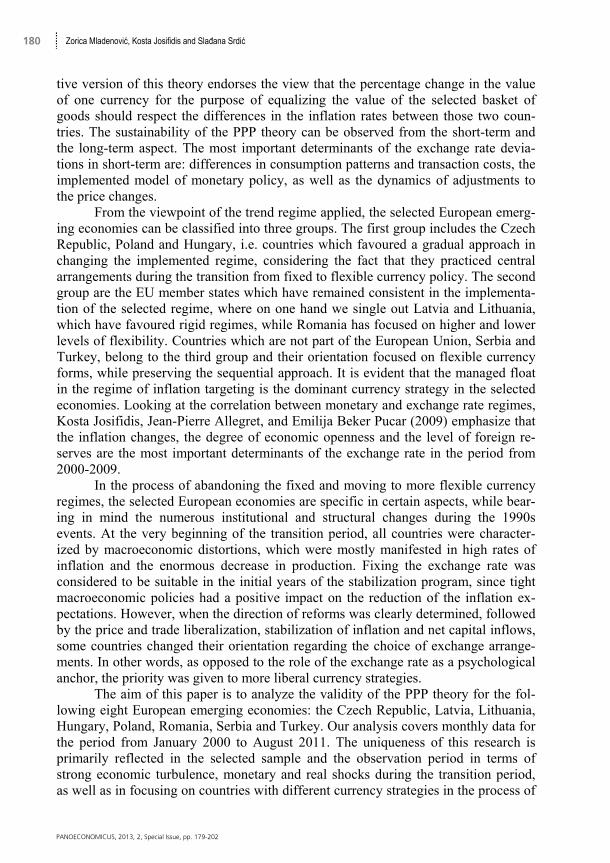
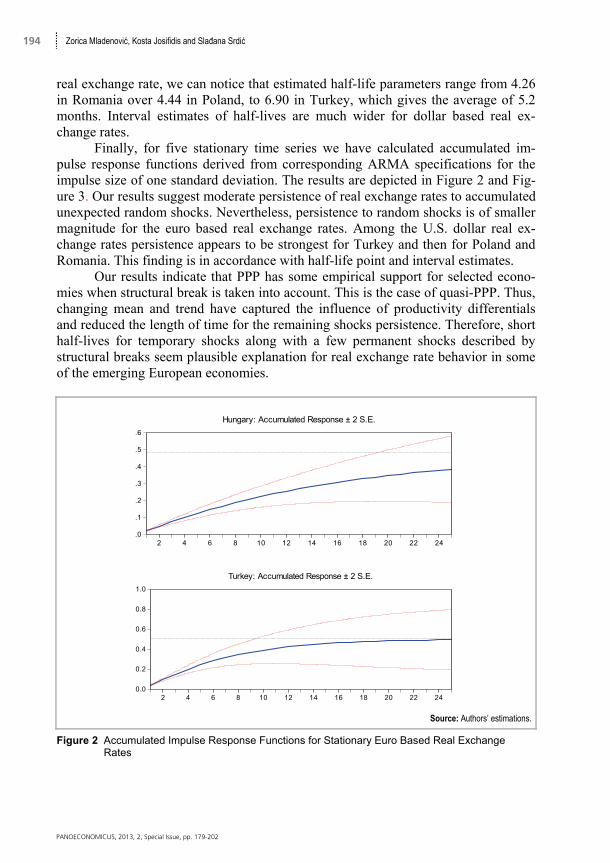
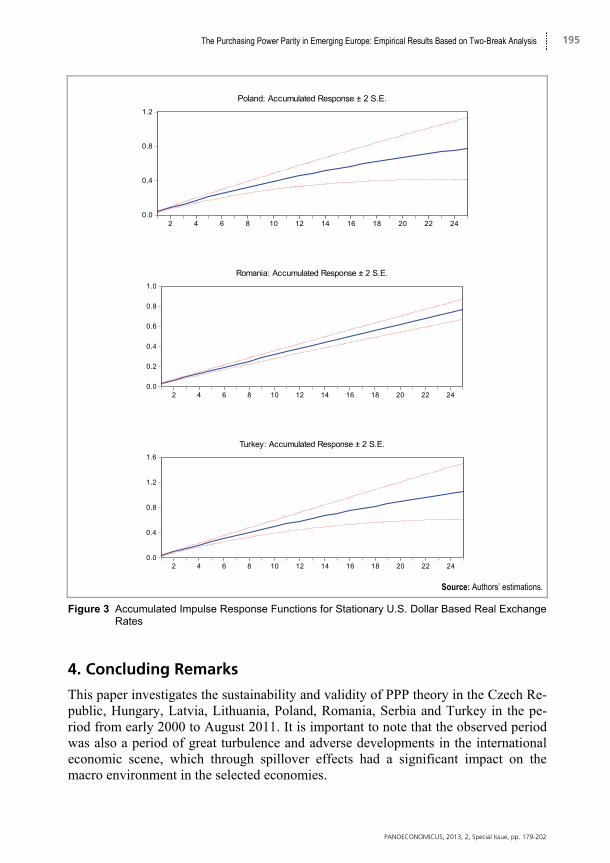
Finally, for five stationary time series we have calculated accumulated im-pulse response functions derived from corresponding ARMA specifications for the impulse size of one standard deviation. The results are depicted in Figure 2 and Fig-ure 3. Our results suggest moderate persistence of real exchange rates to accumulated unexpected random shocks. Nevertheless, persistence to random shocks is of smaller magnitude for the euro based real exchange rates. Among the U.S. dollar real ex-change rates persistence appears to be strongest for Turkey and then for Poland and Romania. This finding is in accordance with half-life point and interval estimates.
Our results indicate that PPP has some empirical support for selected econo-mies when structural break is taken into account. This is the case of quasi-PPP. Thus, changing mean and trend have captured the influence of productivity differentials and reduced the length of time for the remaining shocks persistence. Therefore, short half-lives for temporary shocks along with a few permanent shocks described by structural breaks seem plausible explanation for real exchange rate behavior in some of the emerging European economies.
Source: Authors’ estimations.
Figure 2 Accumulated Impulse Response Functions for Stationary Euro Based Real Exchange Rates
.0
.1
.2
.3
.4
.5
.6
2 4 6 8 10 12 14 16 18 20 22 24
Hungary: Accumulated Response ± 2 S.E.
0.0
0.2
0.4
0.6
0.8
1.0
2 4 6 8 10 12 14 16 18 20 22 24
Turkey: Accumulated Response ± 2 S.E.
195 The Purchasing Power Parity in Emerging Europe: Empirical Results Based on Two-Break Analysis
PANOECONOMICUS, 2013, 2, Special Issue, pp. 179-202
Source: Authors’ estimations.
Figure 3 Accumulated Impulse Response Functions for Stationary U.S. Dollar Based Real Exchange Rates
4. Concluding Remarks
This paper investigates the sustainability and validity of PPP theory in the Czech Re-public, Hungary, Latvia, Lithuania, Poland, Romania, Serbia and Turkey in the pe-riod from early 2000 to August 2011. It is important to note that the observed period was also a period of great turbulence and adverse developments in the international economic scene, which through spillover effects had a significant impact on the macro environment in the selected economies.
0.0
0.4
0.8
1.2
2 4 6 8 10 12 14 16 18 20 22 24
Poland: Accumulated Response ± 2 S.E.
0.0
0.2
0.4
0.6
0.8
1.0
2 4 6 8 10 12 14 16 18 20 22 24
Romania: Accumulated Response ± 2 S.E.
0.0
0.4
0.8
1.2
1.6
2 4 6 8 10 12 14 16 18 20 22 24
Turkey: Accumulated Response ± 2 S.E.
196 Zorica Mladenović, Kosta Josifidis and Slađana Srdić
PANOECONOMICUS, 2013, 2, Special Issue, pp. 179-202
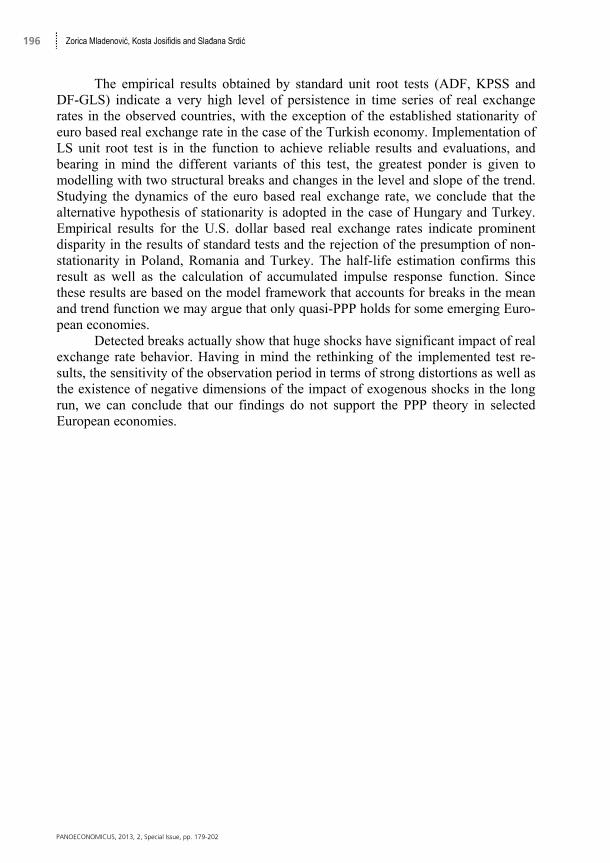
The empirical results obtained by standard unit root tests (ADF, KPSS and DF-GLS) indicate a very high level of persistence in time series of real exchange rates in the observed countries, with the exception of the established stationarity of euro based real exchange rate in the case of the Turkish economy. Implementation of LS unit root test is in the function to achieve reliable results and evaluations, and bearing in mind the different variants of this test, the greatest ponder is given to modelling with two structural breaks and changes in the level and slope of the trend. Studying the dynamics of the euro based real exchange rate, we conclude that the alternative hypothesis of stationarity is adopted in the case of Hungary and Turkey. Empirical results for the U.S. dollar based real exchange rates indicate prominent disparity in the results of standard tests and the rejection of the presumption of non-stationarity in Poland, Romania and Turkey. The half-life estimation confirms this result as well as the calculation of accumulated impulse response function. Since these results are based on the model framework that accounts for breaks in the mean and trend function we may argue that only quasi-PPP holds for some emerging Euro-pean economies.
Detected breaks actually show that huge shocks have significant impact of real exchange rate behavior. Having in mind the rethinking of the implemented test re-sults, the sensitivity of the observation period in terms of strong distortions as well as the existence of negative dimensions of the impact of exogenous shocks in the long run, we can conclude that our findings do not support the PPP theory in selected European economies.
197 The Purchasing Power Parity in Emerging Europe: Empirical Results Based on Two-Break Analysis
PANOECONOMICUS, 2013, 2, Special Issue, pp. 179-202
References
Acaravci, Ali, and Ilhan Ozturk. 2010. “Testing Purchasing Power Parity in Transitional Countries: Evidence from Structural Breaks.” Economic Interferences, XII(27): 190-198.
Bahmani-Oskoee, Mohsen, and Taggert J. Brooks. 2006. “The Purchasing Power Parity Puzzle in Developing Countries.” In International Macroeconomics: Recent Developments, ed. Amalia Morales-Zumaqero, 53-61. New York: Nova Science Publishers.
Barlow, David. 2003. “Purchasing Power Parity in Three Transition Economies.” Economics of Planning, 36(3): 201-221.
Beko, Jani, and Darja Boršić. 2007. “Purchasing Power Parity in Transition Economies: Does it Hold in the Czech Republic, Hungary and Slovenia?” Post-Comunist Economies, 19(4): 417-431.
Cheung, Yin-Wong, and Kon S. Lai. 2000. “On the Purchasing Power Parity Puzzle.” Journal of International Economics, 52(2): 321-330.
Christev, Atanas, and Abbas Noorbakhsh. 2000. “Long-Run Purchasing Power Parity, Prices and Exchange Rate in Transition. The Case of Six Central and East European Countries.” Global Finance Journal, 11: 87-108.
Diboogly, Selahattin, and Ali M. Kutan. 2001. “Sources of Real Exchange Rate Fluctuations in Transition Economies: The Case of Poland and Hungary.” Journal of Comparative Economics, 29(2): 257-275.
Ellioth, Graham, Thomas J. Rothenberg, and James H. Stock. 1996. “Efficient Tests for an Autoregressive Unit Root.” Econometrica, 64(4): 813-836.
Engel, Charles. 2000. “Long-Run PPP May Not Hold After All.” Journal of International Economics, 51(2): 243-273.
Hegwood, Natalie D., and David H. Papell. 1998. “Quasi Purchasing Power Parity.” International Journal of Finance and Economics, 3(4): 279-289.
Josifidis, Kosta, Jean-Pierre Allegret, and Emilija Beker Pucar. 2009. “Monetary and Exchange Rate Regime Changes: The Cases of Poland, Czech Republic, Slovakia and Republic of Serbia.” Panoeconomicus, 56(2): 199-226.
Kasman, Saadet, Adnan Kasman, and Duygu Ayhan. 2010. “Testing for Purchasing Power Parity Hypothesis for the New Member and Candidate Countries of the European Union: Evidence from Lagrange Multiplier Unit Root Tests with Structural Breaks.” Emerging Markets Finance & Trade, 46(2): 53-65.
Koukouritakis, Minoas. 2009. “Testing the Purchasing Power Parity: Evidence from the New EU Countries.” Applied Economic Letters, 16(1): 39-44.
Lee, Junsoo, and Mark C. Strazicich. 2003. “Minimum Lagrange Multiplier Unit Root Test with Two Structural Breaks.” The Review of Economics and Statistics, 85(4): 1082-1089.
Lee, Junsoo, and Mark C. Strazicich. 2004. “Minimum LM Unit Root Test with One Structural Break.” Appalachian State University Working Papers 04-17.
Lumsdaine, Robin L., and David H. Papell. 1997. “Multiple Trend Breaks and the Unit Root Hypothesis.” Review of Economics and Statistics, 79(2): 212-218.
Lyoocsa, Štefan, Baumöhl Eduard, and Vyrost Tomáš. 2011. “Volatility Regimes in Macroeconomic Time Series: The Case of the Visegrad Group.” Czech Journal of Economics and Finance, 61(6): 530-544.
198 Zorica Mladenović, Kosta Josifidis and Slađana Srdić
PANOECONOMICUS, 2013, 2, Special Issue, pp. 179-202
Mirdala, Rajmund. 2009. “Interest Rate Transmission Mechanism of Monetary Policy in the Selected EMU Candidate Countries.” Panoeconomicus, 56(3): 359-377.
Nunes, Luis C., Paul Newbold, and Chung-Ming Kuan. 1997. “Testing for Unit Roots with Breaks: Evidence on the Great Crash and the Unit Root Hypothesis Reconsidered.” Oxford Bulletin of Economics and Statistics, 59(4): 435-448.
Papadopoulos, Athanasios, and Nikolaos Giannellis. 2006. “Purchasing Power Parity among Developing Countries and Their Trade-Partners. Evidence from Selected CEECs and Implications for Their Membership of EU.” University of Crete Working Paper 0716.
Perron, Pierre. 1989. “The Great Crash, the Oil Price Shock, and the Unit Root Hypothesis.” Econometrica, 57(6): 1361-1401.
Perron, Pierre. 1990. “Further Evidence on Breaking Trend Functions in Macroeconomic Variables.” Princeton University Economic Research Program Working Paper 350.
Rogoff, Kenneth S. 1996. “The Purchasing Power Parity Puzzle.” Journal of Economic Literature, 34(2): 647-668.
Rossi, Barbara. 2005. “Confidence Intervals for Half-Life Deviations from Purchasing Power Parity.” Journal of Business & Economic Statistics, 23(4): 432-442.
Sideris, Dimitrios. 2005. “Purchasing Power Parity in Economies in Transition: Evidence from Central and East European Countries.” http://citeseerx.ist.psu.edu/viewdoc/summary?doi=10.1.1.116.841.
Solakogly, Guven E. 2006. “Testing Purchasing Power Parity Hypothesis for Transition Economies.” Applied Financial Economics, 16: 561-568.
Zivot, Eric, and Donald W. K. Andrews. 1992. “Further Evidence on the Great Crash, the Oil-Price Shock, and the Unit-Root Hypothesis.” Journal of Business & Economic Statistics, 10(3): 251-270.
199 The Purchasing Power Parity in Emerging Europe: Empirical Results Based on Two-Break Analysis
PANOECONOMICUS, 2013, 2, Special Issue, pp. 179-202
Appendix
Hungary (Euro Based Real Exchange Rate) Poland (U.S. Dollar Based Real Exchange Rate)
Romania (U.S. Dollar Based Real Exchange Rate)
Turkey (U.S. Dollar Based Real Exchange Rate)
Turkey (Euro Based Real Exchange Rate)
Source: Authors’ estimations.
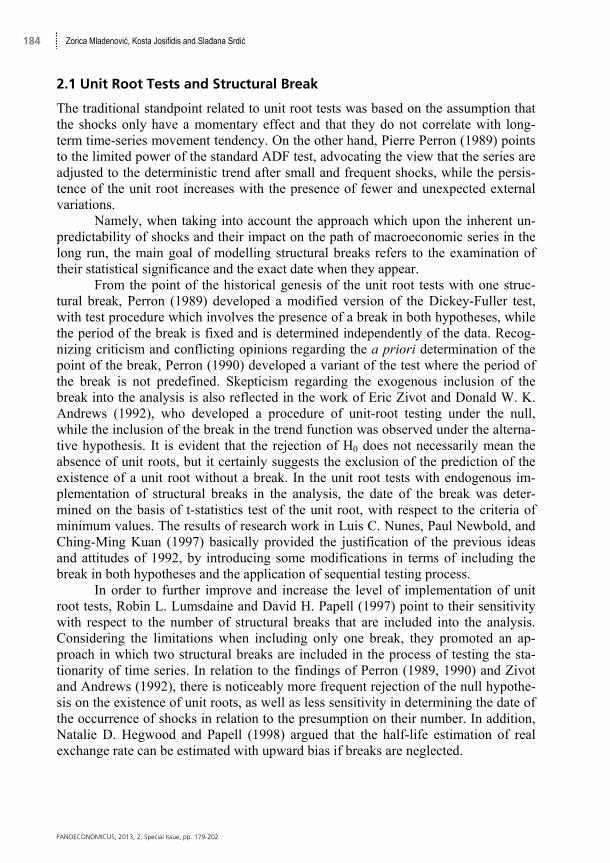
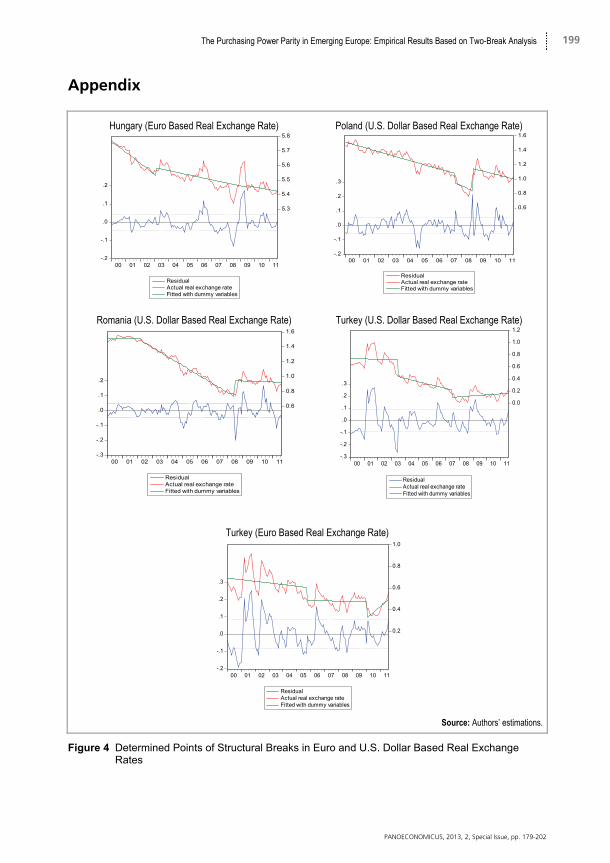
Figure 4 Determined Points of Structural Breaks in Euro and U.S. Dollar Based Real Exchange Rates
-.2
-.1
.0
.1
.2
5.3
5.4
5.5
5.6
5.7
5.8
00 01 02 03 04 05 06 07 08 09 10 11
ResidualActual real exchange rateFitted with dummy variables
-.2
-.1
.0
.1
.2
.3
0.6
0.8
1.0
1.2
1.4
1.6
00 01 02 03 04 05 06 07 08 09 10 11
ResidualActual real exchange rateFitted with dummy variables
-.3
-.2
-.1
.0
.1
.2
0.6
0.8
1.0
1.2
1.4
1.6
00 01 02 03 04 05 06 07 08 09 10 11
ResidualActual real exchange rateFitted with dummy variables
-.3
-.2
-.1
.0
.1
.2
.3
0.0
0.2
0.4
0.6
0.8
1.0
1.2
00 01 02 03 04 05 06 07 08 09 10 11
ResidualActual real exchange rateFitted with dummy variables
-.2
-.1
.0
.1
.2
.3
0.2
0.4
0.6
0.8
1.0
00 01 02 03 04 05 06 07 08 09 10 11
ResidualActual real exchange rateFitted with dummy variables
200 Zorica Mladenović, Kosta Josifidis and Slađana Srdić
PANOECONOMICUS, 2013, 2, Special Issue, pp. 179-202
Hungary
Observing at the euro based real exchange rate in Hungary, the structural break which occurred in March 2003, can be brought in correlation with falling growth rates of GDP and the worsening of the current account deficit, since the mentioned negative trends were expressed at the end of 2002 and early 2003. Political changes and elections in 2002 when there was shift in the ruling coalition and the opposition Socialist Party coming to power, certainly influenced the entire economic system of the country and the mentioned break in 2003.
On the other hand, unfavorable distortions in the macroeconomic environ-ment, reflected primarily in the weakening of the forint, the fall in domestic con-sumption and liquidity of the economy, suggest that the Hungarian economy suffered great loss due to the debt crisis euros. Bearing in mind tremendous sacrifices evolv-ing circumstances, the government has made official stand-by arrangement with the IMF in which the overall package of loans totaled $ 25 billion in the late 2008. The objectives were preventing the collapse of the financial system and helping the eco-nomic factors in general to restore elementary liquidity. By this, total debt is enorm-ously increased, which reflected to the turbulence in the real exchange rate move-ments and the appearance of a structural break in mid-2009. That same year, there were elections for the European Parliament, when it almost became clear that there will be a change in the political arena of this country, as the conservative party Fi-desz won two-thirds majority in parliament. By numerous reforms in tax and banking sectors, which have been taken after 2010, as well as the refurbishment of the entire public finance system is trying to re-establishment of Hungary as economically and politically sustainable country.
After the determination and exclusion of identified breaks from analysis, the LS test at the level of 5% reject the null hypothesis for euro based real exchange rate, while in the case of the U.S. dollar based real exchange rate confirms the presence of stochastic component. Poland
When we analyze the U.S. dollar based real exchange rate in Poland, we can con-clude that the breaks in 2007 and 2008 that occurred after the outbreak of the global economic recession had a long-term impact on the movement of the series, because the LS test at the level of 5% adopted an alternative hypothesis of stationarity around a trend with a break. It is important to mention that in 2007 there was achieved con-siderable inflow of foreign direct investment, which has significantly increased living standards and wealth of the country. Thanks to implementation of flexible economic and financial policy, Poland is considered a rare economy of the European Union which has managed to avoid a recession after the crisis in 2008. The central bank has invested a record amount in the purchase of government bonds, while foreign inves-tors, making sure in the effectiveness of local governments, have increased invest-ment in the economy. Also, tax cuts and increased government spending stimulated further economic growth, due to the fact that the GDP growth rate was 5.1% in 2008, in which Poland certainly leads in comparison to the observed economy. However, a
201 The Purchasing Power Parity in Emerging Europe: Empirical Results Based on Two-Break Analysis
PANOECONOMICUS, 2013, 2, Special Issue, pp. 179-202
very smooth fiscal policy has resulted in increasing of national debt and budget defi-cit, so the growth rate was 1.6% and decreases drastically in 2009. On the other hand and according to the latest official data, the Polish economy corroborated on an an-nual basis of 3.5% in the first quarter of 2012, which is one of the largest growth rates in the European Union.
Focused on the euro based real exchange rate in Poland, results of the imple-mented methodology, which include structural breaks in the analysis, confirmed the findings obtained by the traditional tests about the existence of unit root. Romania
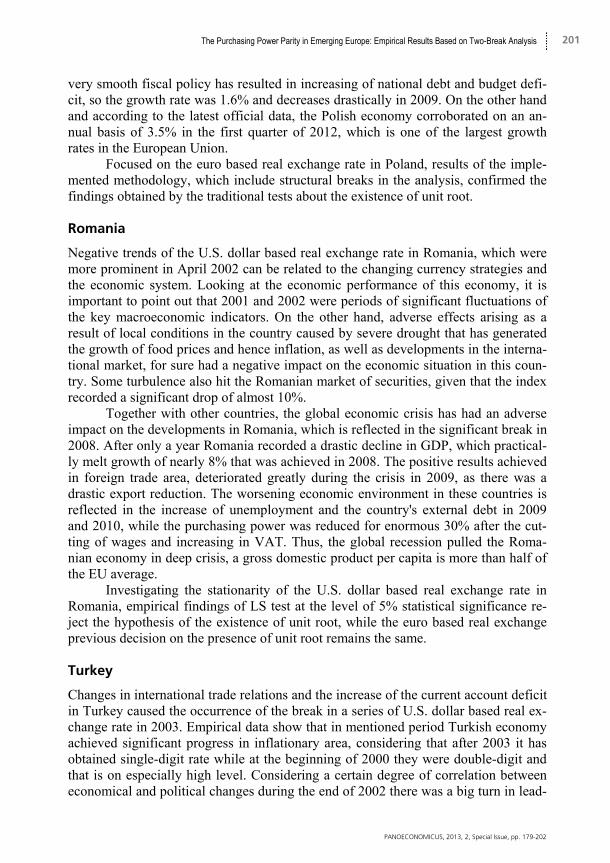
Negative trends of the U.S. dollar based real exchange rate in Romania, which were more prominent in April 2002 can be related to the changing currency strategies and the economic system. Looking at the economic performance of this economy, it is important to point out that 2001 and 2002 were periods of significant fluctuations of the key macroeconomic indicators. On the other hand, adverse effects arising as a result of local conditions in the country caused by severe drought that has generated the growth of food prices and hence inflation, as well as developments in the interna-tional market, for sure had a negative impact on the economic situation in this coun-try. Some turbulence also hit the Romanian market of securities, given that the index recorded a significant drop of almost 10%.
Together with other countries, the global economic crisis has had an adverse impact on the developments in Romania, which is reflected in the significant break in 2008. After only a year Romania recorded a drastic decline in GDP, which practical-ly melt growth of nearly 8% that was achieved in 2008. The positive results achieved in foreign trade area, deteriorated greatly during the crisis in 2009, as there was a drastic export reduction. The worsening economic environment in these countries is reflected in the increase of unemployment and the country's external debt in 2009 and 2010, while the purchasing power was reduced for enormous 30% after the cut-ting of wages and increasing in VAT. Thus, the global recession pulled the Roma-nian economy in deep crisis, a gross domestic product per capita is more than half of the EU average.
Investigating the stationarity of the U.S. dollar based real exchange rate in Romania, empirical findings of LS test at the level of 5% statistical significance re-ject the hypothesis of the existence of unit root, while the euro based real exchange previous decision on the presence of unit root remains the same. Turkey
Changes in international trade relations and the increase of the current account deficit in Turkey caused the occurrence of the break in a series of U.S. dollar based real ex-change rate in 2003. Empirical data show that in mentioned period Turkish economy achieved significant progress in inflationary area, considering that after 2003 it has obtained single-digit rate while at the beginning of 2000 they were double-digit and that is on especially high level. Considering a certain degree of correlation between economical and political changes during the end of 2002 there was a big turn in lead-
202 Zorica Mladenović, Kosta Josifidis and Slađana Srdić
PANOECONOMICUS, 2013, 2, Special Issue, pp. 179-202
ing the country because for the first time after forty years, Turkey chose the two-party system. Also, parliamentary elections of 2007 such as local elections of 2009 influenced the whole economical atmosphere of this country.
Observing the euro based real exchange rate in Turkey we can notice that strong economic progress and high growth rate of 9.4% which Turkish economy achieved in 2004, as well as significant fluctuations in the import and export had a destabilizing effect, which was manifested in the appearance of the break in October, 2005.
On the other hand, the decline in global economic activity and the spillover ef-fects of the recession, are manifested in break in 2007. Turkish economy recovered from global crisis by the incredible speed considering that it achieved a growth of 8.9% in 2010 and significantly increased export which could be seen on series of real exchange rate and appearance of structural break in 2010. Numerical data about cru-cial macroeconomic indicators show the best the dramatic turn over in country which was on the edge due to its debts, it had huge unemployment and galloping inflation and it grew into a relatively successful economy with record economical growth dur-ing one decade period. If we look at the speed and level of economical progress of Turkish economy together with its growing importance as regional, European and world factor, we can see that proposals appeared about including Turkey in levels of slogan BRIC in 2011, which is a synonym for the fast growing and the biggest econ-omies among the developing countries.
The findings of applied LS tests suggest that detected breaks affected the movement of real exchange rate in the long run. The derived conclusion is reflected in the rejection of the hypothesis of non-stationarity at the level of 5% significance in the time series of euro and U.S. dollar based real exchange rate.