Embed Size (px)
DESCRIPTION
Test of Zoom H4 recorder.
Citation preview

1
SUITABILITY OF A CONSUMER DIGITAL RECORDER FOR USE IN ACOUSTICAL MEASUREMENTS
Federico Miyara; Ernesto Accolti; Vivian Pasch; Susana Cabanellas; Marta Yanitelli; Pablo Miechi; Fernando A. Marengo Rodriguez; Ezequiel Mignini
Affiliation: Grupo Ruido, Laboratorio de Acústica y Electroacústica, Universidad Nacional de Rosario, Riobamba 220 bis, 2000 Rosario, Argentina
e-mail: {[email protected]; [email protected]; [email protected]; [email protected]; [email protected]; [email protected];
[email protected]; [email protected]}
Abstract Signal acquisition in acoustical metrology is an increasing need in research and fieldwork. Many specialists think that new indicators should be introduced to describe effects of noise arising from features such as spectrum, semantic content and psychoacoustic properties of noise, all of which require a knowledge of the time history of signal. While there are several instrumentation grade recorders (some of which are optional upgrades for recent models of sound meters), they are usually expensive. The possibility of using a relatively inexpensive digital recorder (Zoom H4) in combination with the calibrated output signal of a precision sound level meter is explored. The major concern arises from the high frequency effects of the antialiasing filter of the analog to digital converter. Three units of the same model of digital recorder were extensively tested as regards frequency response, noise, distortion and transient response at two sampling rates, 44100 Hz and 96000 Hz. Electrical signals applied at the recorder input were monitored with a volt meter and an oscilloscope, while the recorded digital signal was transferred to a computer for software analysis. Tests reveal that the recorder is suitable for use as part of a measurement setup.
Keywords: Noise measurement, digital recording, standards.
1 Introduction Signal acquisition in acoustical metrology is an increasing need in research and fieldwork. Many specialists think that new indicators should be introduced to describe effects of noise arising from features such as spectrum, semantic content and psychoacoustic properties of noise, all of which require a knowledge of the time history of signal. Other applications

INTERNOISE 2010 │ JUNE 13-16 │ LISBON │ PORTUGAL
include experimentation in the effects of noise using natural sounds, aural simulation of environments and soundscapes, and product sound improvement. Traditionally, audio acquisition has been possible through the use of instrumentation grade audio recorders, for instance Digital Audio Tape (DAT) recorders. Several consumer digital audio recording equipment, such as portable DAT, MiniDisc (MD) and hard disk (HD) recorders, have been studied earlier as regards their suitability for the same use ([1], [2]). DAT and HD have been found adequate for virtually all applications, while the MD has shown a somewhat irregular frequency response at high and low frequencies, as well as a reduced effective dynamic range for the recovery of pure tones in a narrow spectral well. Recently, a new technology has emerged that uses removable solid state flash memory as the recording medium. Examples are SD, HCSD or CF memory cards. Low power and storage capacities in excess of 8 Gb allow continuous recording for more than 12 h, making this technology ideal for long field recording sessions. As these recorders do not use any mechanical part, their operation is completely noiseless, making them ideal for recording at very low noise environments. While there are sound level meters that allow digital recording, this feature increases considerably instrument cost, even if the option is only a software upgrade. For instance, the sound recording license for the Brüel & Kjaer Type 2250 sound level meter has a cost of more than U$S 2000, while the Zoom H4 two-channel digital recorder is priced at about U$S 600 (these prices correspond to the Argentinian market). In a previous paper ([3]), we presented a study of spectral analysis algorithms designed to replace costly hardware analyzers. However, legitimate concern as regards whether or not the quality of the digital signal is sufficient to comply with standards must be addressed. International standards such as ISO 1996-2:2007 specify that in order for a piece of equipment to be suitable for measurement purposes, the complete instrumentation system including it should fully comply with the sound level meter standard IEC 61672 ([4], [5]). In particular, this means that the tolerance limits for frequency response are very stringent. Other conditions include self-generated noise, linearity and transient response. The purpose of this work is to report tests performed on the Zoom H4 digital recorder in order to validate its use as part of the instrumentation system.
2 Specifications of the digital recorder The Zoom H4 digital recorder allows the use of three sampling rates: 44,1 kHz, 48 kHz, and 96 kHz, and two bit resolutions: 16 bit and 24 bit. While sampling at 96 kHz may improve the frequency response, in most cases the use of a 24 bit resolution is unnecessary and will only increase file size. Recording format may be .WAV or .MP3. The latter is not recommended because it uses lossy audio compression which might remove meaningful spectral components. Line input signal level is specified as −10 dBm. Surprisingly, no information is provided as regards signal to noise ratio and distortion ([6]). The recorder has two combined (coaxial) XLR balanced and 1/4” unbalanced jack inputs. It has also two microphones mounted in an X-Y configuration. However, there is no way to calibrate them and no warranty is provided as to frequency response and long-term stability, so their use is not recommended for measurement purposes.
3 Tests Several tests have been performed on the recorder, such as frequency response, transient response, noise performance and linearity.
2
INTERNOISE 2010 │ JUNE 13-16 │ LISBON │ PORTUGAL
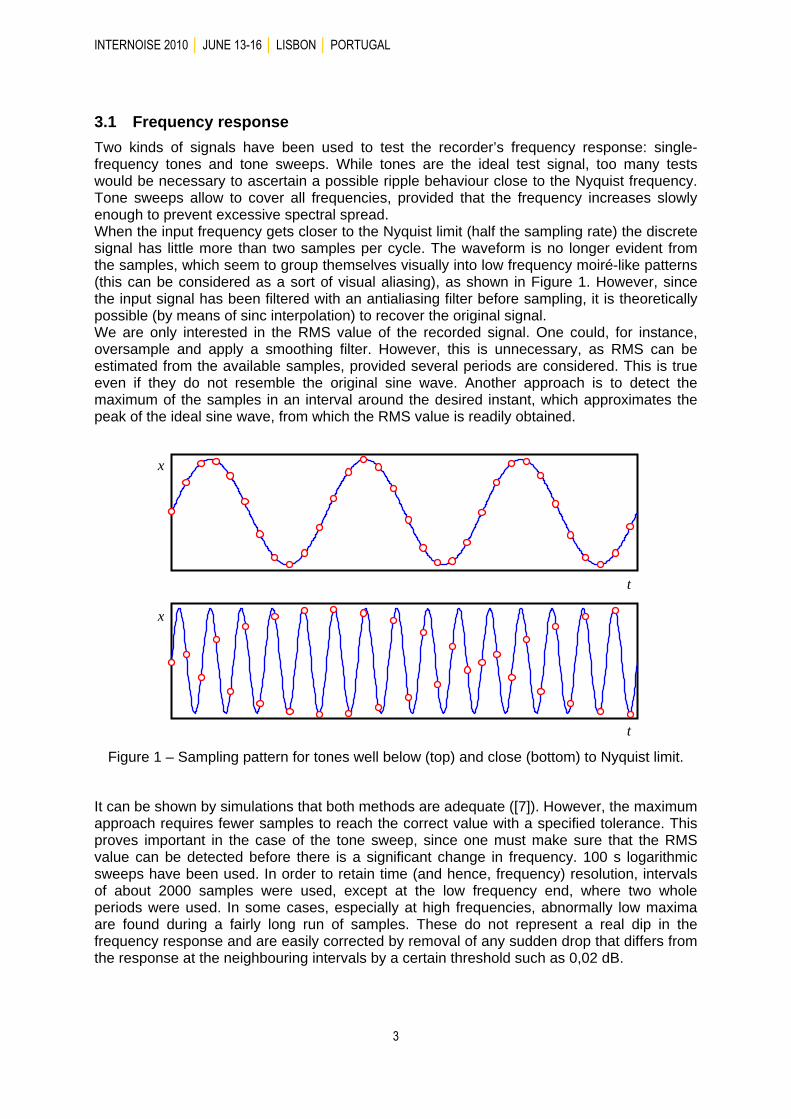
3.1 Frequency response Two kinds of signals have been used to test the recorder’s frequency response: single-frequency tones and tone sweeps. While tones are the ideal test signal, too many tests would be necessary to ascertain a possible ripple behaviour close to the Nyquist frequency. Tone sweeps allow to cover all frequencies, provided that the frequency increases slowly enough to prevent excessive spectral spread. When the input frequency gets closer to the Nyquist limit (half the sampling rate) the discrete signal has little more than two samples per cycle. The waveform is no longer evident from the samples, which seem to group themselves visually into low frequency moiré-like patterns (this can be considered as a sort of visual aliasing), as shown in Figure 1. However, since the input signal has been filtered with an antialiasing filter before sampling, it is theoretically possible (by means of sinc interpolation) to recover the original signal. We are only interested in the RMS value of the recorded signal. One could, for instance, oversample and apply a smoothing filter. However, this is unnecessary, as RMS can be estimated from the available samples, provided several periods are considered. This is true even if they do not resemble the original sine wave. Another approach is to detect the maximum of the samples in an interval around the desired instant, which approximates the peak of the ideal sine wave, from which the RMS value is readily obtained.
x
t
x
t
Figure 1 – Sampling pattern for tones well below (top) and close (bottom) to Nyquist limit.
It can be shown by simulations that both methods are adequate ([7]). However, the maximum approach requires fewer samples to reach the correct value with a specified tolerance. This proves important in the case of the tone sweep, since one must make sure that the RMS value can be detected before there is a significant change in frequency. 100 s logarithmic sweeps have been used. In order to retain time (and hence, frequency) resolution, intervals of about 2000 samples were used, except at the low frequency end, where two whole periods were used. In some cases, especially at high frequencies, abnormally low maxima are found during a fairly long run of samples. These do not represent a real dip in the frequency response and are easily corrected by removal of any sudden drop that differs from the response at the neighbouring intervals by a certain threshold such as 0,02 dB.
3
INTERNOISE 2010 │ JUNE 13-16 │ LISBON │ PORTUGAL
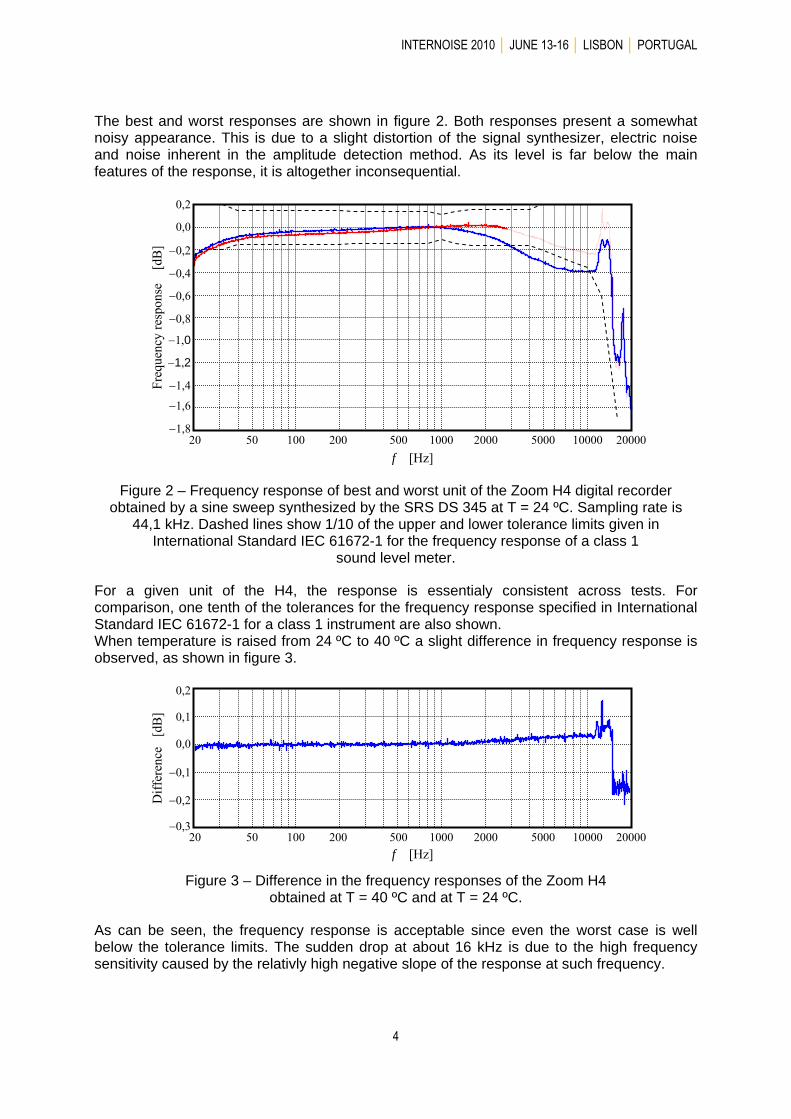
The best and worst responses are shown in figure 2. Both responses present a somewhat noisy appearance. This is due to a slight distortion of the signal synthesizer, electric noise and noise inherent in the amplitude detection method. As its level is far below the main features of the response, it is altogether inconsequential. 0,2
0,0
−0,2
−0,4
−0,6
−0,8
−1,0
−1,2
−1,4
−1,6
−1,8
Freq
uenc
y re
spon
se
[dB
]
10000 20000 50002000200 500 1000100 20 50
f [Hz]
Figure 2 – Frequency response of best and worst unit of the Zoom H4 digital recorder obtained by a sine sweep synthesized by the SRS DS 345 at T = 24 ºC. Sampling rate is
44,1 kHz. Dashed lines show 1/10 of the upper and lower tolerance limits given in International Standard IEC 61672-1 for the frequency response of a class 1
sound level meter.
For a given unit of the H4, the response is essentialy consistent across tests. For comparison, one tenth of the tolerances for the frequency response specified in International Standard IEC 61672-1 for a class 1 instrument are also shown. When temperature is raised from 24 ºC to 40 ºC a slight difference in frequency response is observed, as shown in figure 3.
−0,2
−0,1
0,0
0,1
0,2
10000 20000 50002000200 500 1000100 20 −0,3
50
Diff
eren
ce
[dB
]
f [Hz] Figure 3 – Difference in the frequency responses of the Zoom H4
obtained at T = 40 ºC and at T = 24 ºC.
As can be seen, the frequency response is acceptable since even the worst case is well below the tolerance limits. The sudden drop at about 16 kHz is due to the high frequency sensitivity caused by the relativly high negative slope of the response at such frequency.
4

INTERNOISE 2010 │ JUNE 13-16 │ LISBON │ PORTUGAL
3.2 Noise Internal noise comprise analog noise (miscellaneous sources such as thermal noise and 1/f shot noise) and digital noise, including discretization and dithering. In order to measure the internal noise the input has been short-circuited and recorded. Then RMS and Fast Fourier Transform (FFT) analysis is performed on the .WAV file by computer software. Noise signal is also A-weighted by computer software. Figure 4 depicts the spectral density of the noise detected in the noisiest H4 unit, with a sampling rate of 44,1 kHz and a 16 bit resolution. While there are differences across units, sampling rates or resolutions, these seem to be random and no significant effect is detected due to any single factor.
−170
−160
−150
−140
−130
−120
−110
−180
Spec
tral l
evel
[d
B]
0 2 4 6 8 18 20 10
f [Hz] 12 14 16
Figure 4 – Worst-case example of spectral level of Zoom H4 noise referenced to maximum digital output. Signal was recorded with short-circuited input and 16 bit.
The worst-case unweighted signal-to-noise ratio has been found to be 91,7 dB, while the A-weighted signal to noise ratio has been 95,9 dBA, in both cases referred to a full scale undistorted sine wave. This means that if a 94,0 dB calibration tone is recorded at full scale amplitude, then signals down to about 20 dB can be safely recorded with an error less than 0,1 dB. Most sound level meters have inherent noise floors of the order of 20 dB.
3.3 Linearity Linearity is tested in two different ways. First, by comparing its effect on the recorded signal for several input levels. This is the standard test specified in IEC 61672. Second, by computing the total harmonic distortion (THD) for a range of levels. Both tests have been performed using a tone modulated by a slowly-varying exponential decay (duration T = 20 s; time constant τ = 8,69 s; dynamic range: 80 dB). In the first case (figure 5) the energy envelope has been computed with a first-order digital filter with τ = 0,05 s and compared in a logarithmic scale to the theoretical, undistorted amplitude response. It has been expressed as the difference between the real response and the ideal one. In the second case (figure 6) the fundamental and the remaining harmonics have been isolated by means of a higly selective multi-band FFT filter in order to reduce the effect of wide band residual noise. Then both RMS values have been computed and compared. As it can be seen, harmonics 2, 3, ... decrease more quickly than the fundamental, that is why THD decreases slightly to about 0,02 %. As signal level falls down, THD starts to increase again due to digital distortion at very low levels. At −73 dB (referred to the maximum digital level), THD is around 5 %, which is equivalent to an error of 0,42 dB. An unexpected phenomenon can be observed close to −32 dB. There is an abrupt change in the error of about 0,2 dB. This does not affect the compliance with the IEC standard, since
5

INTERNOISE 2010 │ JUNE 13-16 │ LISBON │ PORTUGAL
the maximum difference after a change of level between 1 dB and 10 dB should be less than ± 0,6 dB. Once more, for levels below −70 dB the THD increases quickly as a consequence of digital distorsion. Besides, there is a spurious effect of inherent noise.
0-100 -90
5
Rea
l res
pons
e −
Idea
l res
pons
e [
dB]
4
3 2
1 -80 -70 -50 -60 -40
Signal level [dB] -30 -20 -10 0
Figure 5 – Real response minus ideal linear respose, 20 log(VRMS-real / VRMS-ideal)
0.5
-100 -90 -80 -70 -60 -50 -40 -30 -20 -10 0 0
0.1
0.2
0.3
0.4
Signal level [dB]
5
4
3
2
1
0
-100 -1
-90 -80 -70 -60 -50 -40 -30 -20 -10
V 1,
200∑
V k
[V]
THD
[%
]
0 Signal level [dB]
Figure 6 – Linearity Analysis. Top: First harmonic (blue) and remaining harmonics (red) multiplied by a factor of 200 for better comparability. Bottom: Total harmonic distortion. In both cases the frequency was 1 kHz. Digital audio reference is maximum digital signal.
6

INTERNOISE 2010 │ JUNE 13-16 │ LISBON │ PORTUGAL
3.4 Transient response In order to test the transient response a square wave has been used. It has been found that the high frequency response is not exactly the same across units of model H4, but an upper bound for the 5 % settling time can be found. Responses are oscillating only for a sampling rate of 44,1 kHz, as shown in figure 7. Settling times were found to be at most 104 µs for 96 kHz and for 136 µs for 44,1 kHz.
0.02
0-0.08
0.5 1 1.5 2t [ms]
2.5 3 3.5
-0.07 -0.06 -0.05 -0.04 -0.03 -0.02 -0.01
0 0.01
Am
plitu
de [A
U]
Figure 7 – Step response for 44,1 kHz (blue) and 96 kHz (magenta). In red the 5 % limits
4 Uncertainty In order to conform to the IEC 61672 Standard, the recorder should exhibit an uncertainty of at most 0,1 dB. Test signals have been generated using a Stanford Research Systems DS 345 synthesised function generator. According to the specifications ([8]), the sine wave accuracy is only ±0,4 dB. Since the use of the recorder requires the recording of a calibrated signal, this would be unimportant as long as the frequency response is sufficiently flat. However, no specification is provided regarding frequency response flatness, so it was checked using a Hewlett-Packard HP 974A digital multimeter ([9]), whose true RMS total accuracy is given in Table 1 (including percentage of reading + counts). As shown in Figure 2, deviation of the DS 345 generator from flat response spans at most ±0,045 dB (96 % confidence), that combined with the HP 974A accuracy yields a 0,103 dB uncertainty. This uncertainty can be reduced to 0,095 dB taking into account the systematic deviation of the DS 345 at each frequency. The distortion of the DS345 is specified as −55 dBc. This represents a maximum error of 20 lg(1+10−55/20) = 0,015 dB when the peaks of harmonics are in phase with the main signal.
Table 1 – True RMS AC accuracy of the HP 974A multimeter. Frequency range (Hz) Accuracy (dB)
20 - 50 ±0,092 50 - 10 000 ±0,049
10 000 - 20 000 ±0,093
7

INTERNOISE 2010 │ JUNE 13-16 │ LISBON │ PORTUGAL
0,02
−0,06 −0,05
−0,08 20
−0,07
−0,04 −0,03 −0,02 −0,01
0,000,01
D
evia
tion
[dB
]
50 100 1000 10000 5000 500 200 2000 f [Hz]
Figure 2 – Deviation from flat frequency response of the SRS DS345 generator. 96 % confidence intervals (±2σ) are also shown. Exact calibration at 1 kHz is assumed.
5 Conclusion Most parameters reveal that the tested units of model H4 are suitable for recording audio signals with measurement purposes. There is not significant difference between the various recording formats. For instance, noise seems to have a lower bound conditioned by analog noise. The model exhibits some distortion which causes, at the high frequency end (over 10 kHz), some noticeable aliasing. It is recom mended to adjust the maximum recording level at about −20 dB in order to minimise distortion.
Acknowledgments This reserch has been carried out with grant Nº 38109 of the National Agency for the Scientific and Technological Promotion (ANPCyT), Argentina.
References
[1] 1. Miyara, F. ¿Ruido o señal? La otra información. En defensa del registro digital del ruido urbano. Cuarta Jornada Regional sobre Ruido Urbano, Montevideo, Uruguay, July 14, 2001. In CD-ROM. http://www.fceia.unr.edu.ar/acustica/biblio/reg-dig.pdf
[2] Miyara, F. Grabación digital: ¿DAT o MiniDisc?. Tecnopolitan. Año 2 Nº 15. Nov-Dic. 2001. http://www.fceia.unr.edu.ar/acustica/biblio/md-vs-dat.pdf
[3] Miyara, F.; Pasch, V.; Yanitelli, M.; Accolti, E.; Cabanellas, S., Miechi, P. Contrastación de algoritmos de análisis de espectro con un instrumento normalizado. Actas de las Primeras Jornadas Regionales de Acústica AdAA 2009, Rosario, Argentina, Nov 19-20, 2009. http://www.fceia.unr.edu.ar/acustica/biblio/ A032%20(Miyara)%20Contraste%20algoritmos%20analizador%20normalizado.pdf
[4] ISO 1996-2: Acoustics - Description, measurement and assessment of environmental noise - Part 2: Determination of environmental noise levels. Geneve, Switzerland, 2007
8

INTERNOISE 2010 │ JUNE 13-16 │ LISBON │ PORTUGAL
[5] IEC 61672-1 Electroacoustics - Sound level meters - Part 1: Specifications. Geneve, Switzerland, 2002
[6] Zoom Corporation. Handy Recorder H4 Operation Manual. (Unspecified date)
[7] Miyara, F.; Accolti, E.; Marengo Rodriguez, F. Issues in tone and tone sweep testing of digital audio equipment. Unpublished.
[8] Stanford Research Systems. Synthesized Function Generators - DS345 Specifications.
[9] Hewlett-Packard Company. HP 974A Multimeter User’s Guide. 1995
9