Embed Size (px)
Citation preview

=
rkfsbopfqv=lc=jf`efd^k=
=
Working Paper ==
Zone Overlap and Collaboration in Academic Biomedicine: A
Functional Proximity Approach to Socio-Spatial Network Analysis
Felichism Kabo
Institute for Social Research University of Michigan
Yongha Hwang Taubman College of Architecture and Urban Planning
University of Michigan
Margaret Levenstein Stephen M. Ross School of Business
University of Michigan
Jason Owen-Smith LSA Sociology
University of Michigan
Ross School of Business Working Paper Working Paper No. 1184
January 2013
This work cannot be used without the author's permission. This paper can be downloaded without charge from the
Social Sciences Research Network Electronic Paper Collection: ÜííéWLLëëêåKÅçãL~Äëíê~ÅíZONVVRTM=

1
Zone Overlap and Collaboration in Academic Biomedicine: A Functional Proximity Approach to Socio-Spatial Network
Analysis
Felichism Kabo1, Yongha Hwang1, Margaret Levenstein1, Jason Owen-Smith1
1University of Michigan
Keywords
physical proximity, social networks, scientific collaboration, functional distance, relationship formation
Felichism Kabo Institute for Social Research University of Michigan 426 Thompson St. Ann Arbor, MI 48106-1248 [email protected]
Yongha Hwang Taubman College of Architecture and Urban Planning University of Michigan 2000 Bonisteel Boulevard Ann Arbor, MI 48109-2069 [email protected]
Margaret Levenstein Business Economics Stephen M. Ross School of Business University of Michigan 701 Tappan Avenue. Ann Arbor, MI 48109-1234 [email protected]
Jason Owen-Smith (corresponding author) LSA Sociology University of Michigan 500 S. State St. #3001 Ann Arbor, MI 48109-1382 [email protected]

2
Acknowledgements
The authors wish to acknowledge Natalie Cotton for her invaluable research assistance, especially with SQL database management. We are indebted to our colleagues Rick Price and Jerry Davis for their insightful, stimulating comments and constructive feedback at every phase of this research. Funding for this project was provided by the following units at the University of Michigan: the Office of the Vice-President for Research (OVPR), the Social Science Annual Institute (SSAI), the Institute for Research on Labor, Employment, and the Economy (IRLEE), the Institute for Social Research (ISR), and the North Campus Research Complex (NCRC).
3
Abstract
Spatial layouts can have significant influences on the formation and outcomes of social relationships. Physical
proximity is thus essential to understanding the elemental building blocks of social networks, dyads. Situating
relationships in space is instrumental to formulating better models of collaboration and information-sharing in
organizations and more robust theories of networks and their effects. We propose, develop, and test a concept,
the functional zone, which effectively captures Festinger et al’s (1950) classic description of ‘functional distance’ as
pertains to social interactions. We operationalize our functional zone concept with measures of path and areal
zone overlap. At two biomedical research buildings with different layouts (compact versus linear), regression
analyses of collaboration rates show that increasing path overlap increases collaboration in both buildings. In
contrast more traditional distance measures only influence collaboration in the more linear building. The functional
zone concept improves our ability to understand relationships and their attendant organizational outcomes.
Introduction
Social relationships shape the activities of organizations, teams and individuals in complicated ways (Burt,
2004; Hansen, 1999; W. W. Powell, Koput, & Smith-Doerr, 1996), but social scientists are only beginning to
systematically explore how the arrangement of physical spaces influences workplace interactions and outcomes.
People work and interact in the built environment (Grannis, 2011; Hua, Loftness, Heerwagen, & Powell, 2011), thus
research that disregards space or that analytically divorces social phenomena from their locations and contexts is
likely to result in impoverished theories, biased findings, and misspecified models (Kono, Palmer, Friedland, &
Zafonte, 1998). Many of the processes and outcomes that are the focus of organizational analysis depend upon social
networks, and the most relevant level of analysis for understanding those based on information sharing,
collaboration, or teamwork, may be the dyad (Mizruchi & Marquis, 2006).
Despite the importance of dyads, little work has explicitly emphasized spatial effects on relationship
formation among pairs of co-workers. We believe that a full understanding of the formation and effects of social
networks requires attention to space. Spatial effects have not been robustly incorporated in such social science
models because we currently lack spatial measures that are nuanced enough to operationalize key concepts. This
4
paper takes initial steps toward more fully integrating spatial and social explanations for the formation of
collaborative relationships at work by developing a new measure of physical proximity that more effectively
captures classic concepts relating the effects of space on the likelihood of interaction (Festinger, Schachter, & Back,
1950). We then demonstrate that our measure, zone overlap or the extent to which a pair of individuals share
common physical spaces, explains rates of collaboration formation among interdisciplinary life scientists working in
two research buildings on the campus of a large public research university. The explanatory power of this measure is
distinct from the effects of more traditional physical distance variables including the metric measures of Euclidean
and walking distances and the topological measure of turn distance.
Most contemporary efforts to understand spatial effects in organizational settings employ physical distance
as a fairly blunt proxy for the subtle ways in which proximity enables or hinders interaction (Cowgill, Wolfers, &
Zitzewitz, 2009; Liu, 2010; Sailer & McCulloh, 2012). Physical distance is not discriminating enough to capture the
powerful but subtle relational and topological effects of space that we refer to as functional proximity.
Unfortunately, physical distance is the only tool that has thus far been available to most researchers interested in
relational organizational phenomena such as collaboration. We draw on classic work examining spatial influences
on interaction (Festinger et al., 1950) and pioneering efforts to capture the relational aspects of the built environment
(Hillier & Hanson, 1984) to propose a new conceptualization of space, the functional zone, which captures
individual spheres of operation in the workplace. From the functional zone concept we develop measures of zone
overlap. Path and areal zone overlaps between individuals capture key aspects of space that increase or decrease the
likelihood of dyadic interaction. Zone overlap measures offer continuous, quantitative indices of proximity that are
robust across spatial layouts and thus offer the possibility of application and generalization across multiple
organizational settings.
Space is the platform on which face-to-face social interactions and the networks that result from them are
enacted. Nevertheless, efforts to develop systematic socio-spatial organizational research have languished since
seminal, but largely descriptive analyses by Festinger and colleagues (1950) and Allen (1977). Festinger, Schacter
and Back’s study of interactions among residents in a new campus community for World War II veterans returning
to university under the GI bill offer particularly valuable insights that have been little developed. This study drew a
distinction between two critical mechanisms through which space shapes interaction. The first is physical distance
5
which captures the costs (in time and effort) of interaction for a particular dyad. Here, the assumption is that greater
distances between people make it more difficult to initiate and sustain face to face interactions.
The second mechanism, which was dubbed functional distance, focused more explicitly on the relational
aspect of physical layouts by emphasizing, for instance, the ease and difficulty of movement among spaces. The
implications of functional distance for social and organizational research have eluded careful consideration and
measurement. This paper operationalizes functional distances in terms of overlapping zones of activity and then
compares those measures to metric and topological characterizations of physical distance.
We test the assertion that the arrangement of physical space exerts significant effects on collaboration.
However, we begin with the assumption that spatial effects are probabilistic and contingent rather than deterministic
and universal (Robert D. Sack, 1993). For example, someone whose workspace is located next door to a popular
coffee bar, favorite break space or even much visited rest room (Pfeffer, 1992) might forgo the increased
opportunities for interaction offered by her location through the simple expedient of shutting a door or wearing large
noise cancelling headphones. Proximity need not beget interaction. Likewise the actual costs imposed by physical
distance may vary with the overall topology of the building where interactions happen. In what follows, we pursue
the latter insight by proposing that the effects of physical distance on interactions will vary across different building
designs while more socio-spatial and nuanced functional distance measures will exert more stable effects.
Collaboration and Space
Festinger et al noted that brief passive or unscripted contacts constitute the foundation for new tie
formation. A determinant of these chance encounters is what they referred to as specific required paths, such as the
one that an individual must take from their apartment to the bus stop. Potential dyad members are more likely to
initiate contact to the extent that their required paths cross or overlap. Yet the absolute spatial or physical distance
between individuals’ spaces is a poor predictor of their potential path overlaps. Path overlap is better predicted by
the relative positions of the multiple spaces which people routinely use and navigate in. In other words, if the overall
configuration of a physical space and the distribution of commonly visited locations within it requires individuals to
encounter one another more often in the course of their daily activities, they will be more likely to interact, share
information, and develop social or collaborative relationships.
6
The most notable contemporary method for configurational, system level, analysis of buildings is space
syntax. Space syntax techniques highlight the relational nature of space by converting physical layouts into networks
that represent proximities among rooms and passageways in relational terms (Hillier & Hanson, 1984; Wineman,
Kabo, & Davis, 2009). Like social networks, spatial networks can be used at multiple levels of analysis, for
example, buildings, campuses, and cities. At the level of buildings, the analytic techniques and measures associated
with spatial networks closely mirror their social counterparts as they allow for analysis of spatial relationships that
correspond to egocentric, dyadic, and structural levels of social network analysis. This paper seeks to expand our
understanding of the socio-spatial dynamics of collaboration networks at the dyadic level. But it is precisely at the
dyadic level of analysis that space syntax’s contributions to the development of a socio-spatial science start to
diminish.
Dyadic topological distance measures derived from space syntax are more likely to be highly correlated
with metric distance at the micro level of buildings as opposed to the more macro level of cities and regions,
especially when the analysis is within- rather than between-floors. In this paper we compare our functional measure
of zone overlap concept to metric and topological distance measures with respect to capturing the potential for
dyadic and unplanned face-to-face encounters. We propose that zone overlap better captures the real effects of space
on collaboration dynamics than do physical distance measures that index costs of planned interactions (Owen-Smith,
Kabo, Levenstein, Price, & Davis, 2012).
Measuring Functional Proximity
Following Festinger et al, efforts to acknowledge the impact of space in intra- and inter-organizational
processes were rather coarse-grained. In fact, the incorporation of space in these studies was mostly limited to
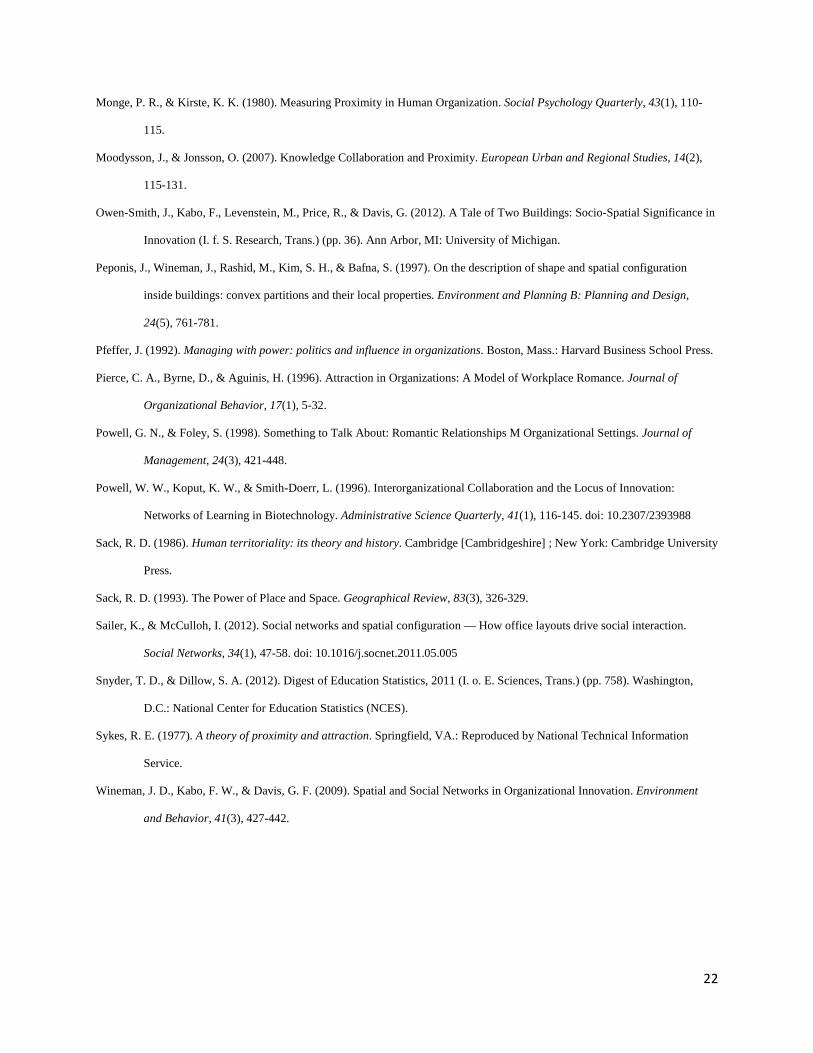
physical distance, with some researchers even using Euclidean or “as the crow flies” distance (Monge & Kirste,
1980). A simple schematic example illustrates the challenges of applying Euclidean distances to the analysis of real
physical spaces. In Figure 1, where each arc has a unit length, the actual or walking distance between individuals A
and B is two units while the Euclidean distance is 1.414 units. The disparity between walking (five units) and
Euclidean (one unit) distances is even greater for individuals A and C. For reasons beyond the scope of this study,
7
practical conceptualization of functional distance or relational aspects of space lagged the use of physical distance.
Functional distance better captures the latent interactions between actors in a specific spatial environment.
Festinger et al defined functional distance in terms of the “positional relationships and features of design”
(p.35) that make it more or less likely that two individuals will have unscripted encounters or interactions (Festinger
et al., 1950, pp. 34-36). This implies that the “distance” in this term refers to the topological relationships between
spatial elements, and given this relational turn in the term we propose to substitute proximity for distance. Not only
is proximity understood to be the antonym of distance(Merriam-Webster, 2003), but it also encompasses the broader
dimensions of adjacency and contiguity. Therefore, from this point on, we will refer to functional proximity
whenever we mean to invoke the functional distance of Festinger et al as our interest is in the passing or unplanned
contacts that are the wellsprings of relationships. In accord with previous usage of the term “functional proximity,”
our concept shares the connotation of accessibility between actors engendering interactions between people
(Mainiero, 1989; Moodysson & Jonsson, 2007; Pierce, Byrne, & Aguinis, 1996; G. N. Powell & Foley, 1998).
However, our construct is conceptually more focused and analytically more precise, lending itself to application
both in empirical and comparative studies.
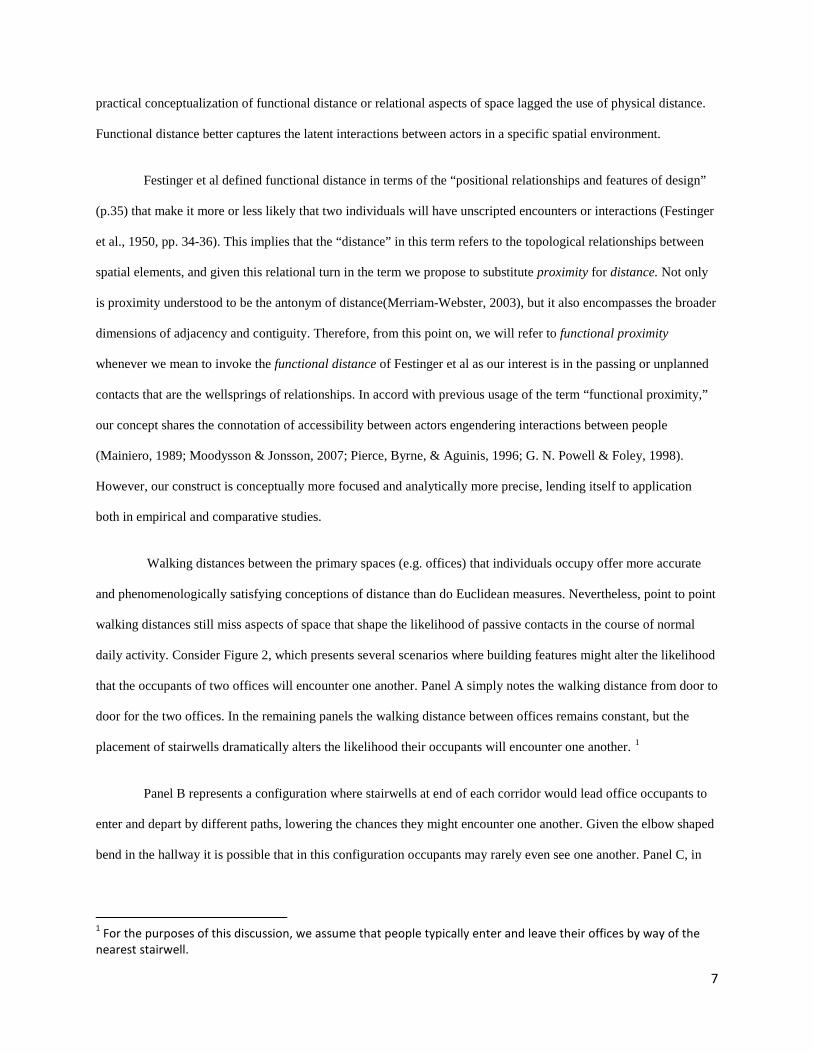
Walking distances between the primary spaces (e.g. offices) that individuals occupy offer more accurate
and phenomenologically satisfying conceptions of distance than do Euclidean measures. Nevertheless, point to point
walking distances still miss aspects of space that shape the likelihood of passive contacts in the course of normal
daily activity. Consider Figure 2, which presents several scenarios where building features might alter the likelihood
that the occupants of two offices will encounter one another. Panel A simply notes the walking distance from door to
door for the two offices. In the remaining panels the walking distance between offices remains constant, but the
placement of stairwells dramatically alters the likelihood their occupants will encounter one another. 1
Panel B represents a configuration where stairwells at end of each corridor would lead office occupants to
enter and depart by different paths, lowering the chances they might encounter one another. Given the elbow shaped
bend in the hallway it is possible that in this configuration occupants may rarely even see one another. Panel C, in
1 For the purposes of this discussion, we assume that people typically enter and leave their offices by way of the nearest stairwell.

8
contrast, places a single stairwell equidistant from the two offices. In this situation, office occupants are likely to
encounter each other at the stairwell, but soon part ways as they head to their separate spaces.
Panel D suggests an even greater likelihood of passive contacts. Here occupants may meet at the stairwell
and might sometimes walk together briefly as their paths overlap. In addition, one person’s path to the stairwell will
lead them to pass the other’s office door. In this configuration, then, the possibility of passive contact does not
depend entirely on coordinated comings and goings via the stairwell. Finally, consider Panel E, which seems to us to
offer the greatest possibility for passive contact between the occupants of these offices. Panel E features a shared
stairwell, a passed door, and a longer walking path overlap than in Panel D. In the terms we use above, the walking
distance between offices remains constant but their occupants’ functional zones vary dramatically in ways that
introduce greater or lesser possibilities for unplanned, face-to-face encounters in the course of daily interaction.
To say that two individuals are proximate is to infer a degree of nearness or closeness between them on the
basis of contiguity in a specific dimension. Individuals in the workplace have more or less established spheres of
operation. An individual might always take the same elevator or stairway to their office, use one restroom over
another (assuming the existence of more than one), and even prefer to take breaks in a specific area of the building.
We define the individual’s sphere of operation as the functional zone and note that it is an aggregate function of the
spaces that are the sites of task performance or personal movement in the workplace.
For the biomedical research buildings analyzed in this study, we propose four main types of spaces:
individuals’ workspaces (offices, labs), public or shared spaces (restrooms), circulation spaces (elevators, stairways),
and connectors (hallways). Of course one could draw up a different typology of spaces for these buildings, and it is
also inconceivable that in buildings supporting other kinds of work, such as engineering production or software
research, employees’ functional zones will not consist of alternative sets of spaces. In other words, our typology is
not necessarily exhaustive or general enough to apply in its entirety across different building types or usages. Using
the four types of spaces, we consider each individual’s functional zone to be bound by their individual workspaces,
most proximate restrooms, and the closest elevators, and threaded together by the connector spaces. Our definition
of the individual’s functional zone is therefore quantifiable and provides metrics that allow for the capture of spatial
use patterns at the individual level; depending on the outcome in question, the functional zone could be expressed in
9
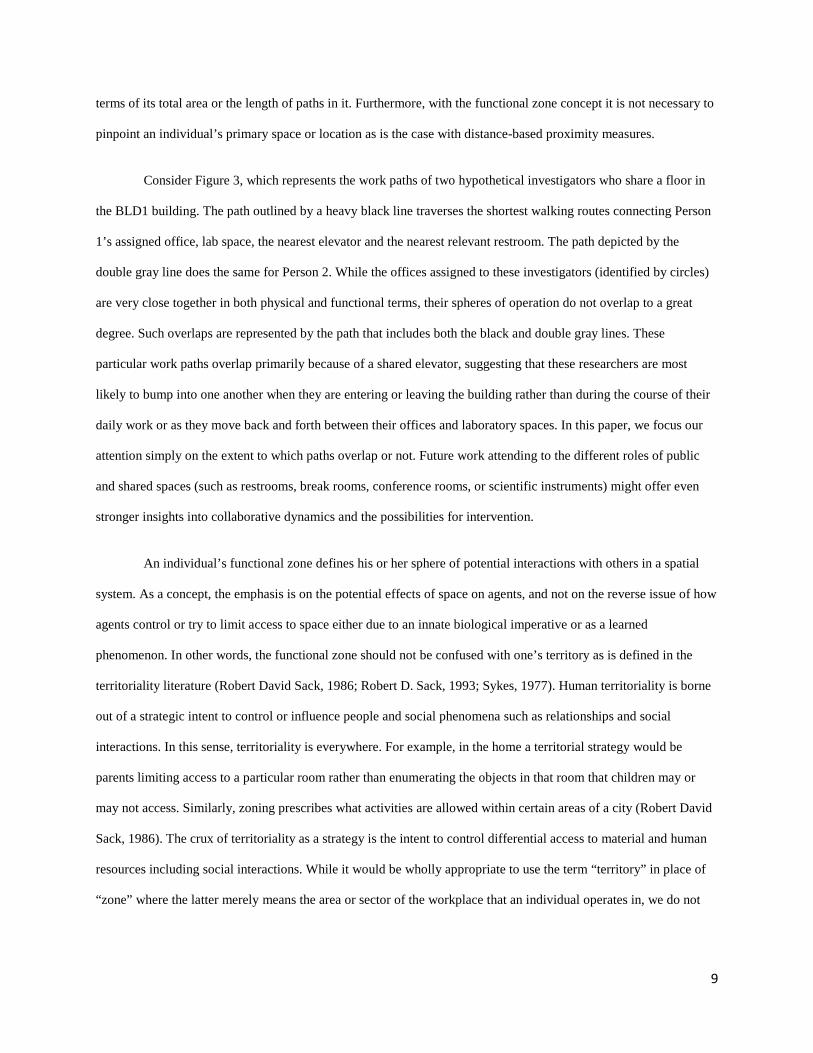
terms of its total area or the length of paths in it. Furthermore, with the functional zone concept it is not necessary to
pinpoint an individual’s primary space or location as is the case with distance-based proximity measures.
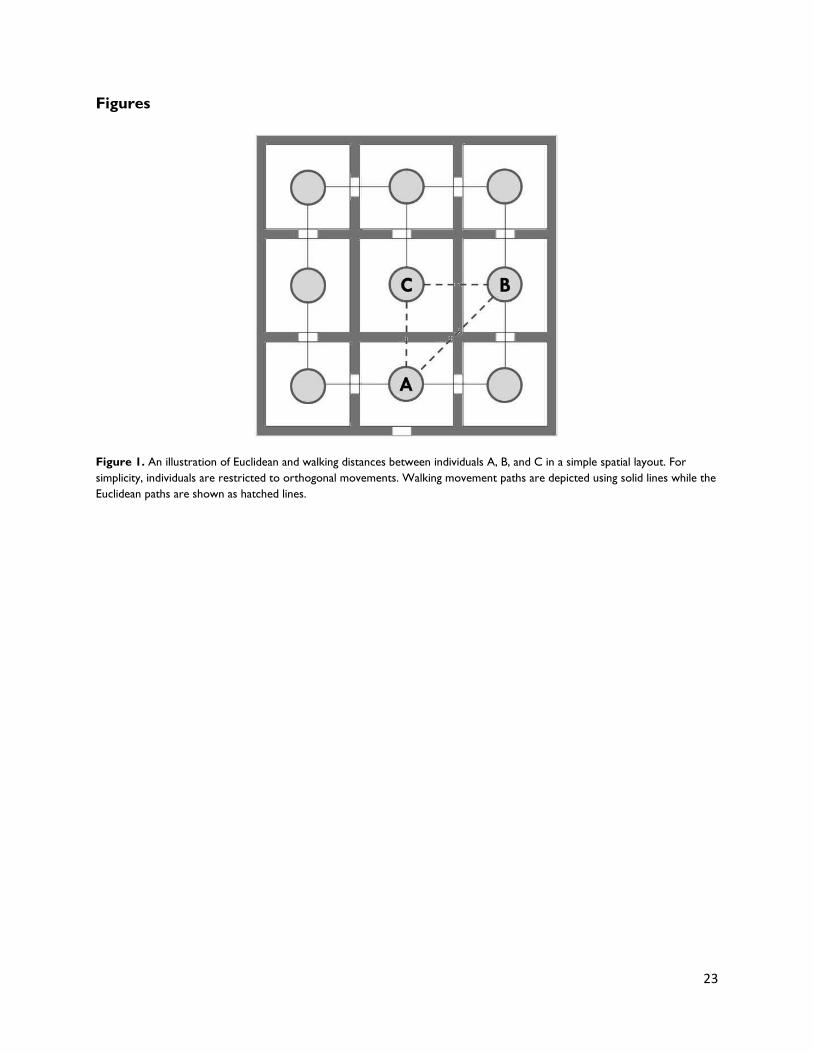
Consider Figure 3, which represents the work paths of two hypothetical investigators who share a floor in
the BLD1 building. The path outlined by a heavy black line traverses the shortest walking routes connecting Person
1’s assigned office, lab space, the nearest elevator and the nearest relevant restroom. The path depicted by the
double gray line does the same for Person 2. While the offices assigned to these investigators (identified by circles)
are very close together in both physical and functional terms, their spheres of operation do not overlap to a great
degree. Such overlaps are represented by the path that includes both the black and double gray lines. These
particular work paths overlap primarily because of a shared elevator, suggesting that these researchers are most
likely to bump into one another when they are entering or leaving the building rather than during the course of their
daily work or as they move back and forth between their offices and laboratory spaces. In this paper, we focus our
attention simply on the extent to which paths overlap or not. Future work attending to the different roles of public
and shared spaces (such as restrooms, break rooms, conference rooms, or scientific instruments) might offer even
stronger insights into collaborative dynamics and the possibilities for intervention.
An individual’s functional zone defines his or her sphere of potential interactions with others in a spatial
system. As a concept, the emphasis is on the potential effects of space on agents, and not on the reverse issue of how
agents control or try to limit access to space either due to an innate biological imperative or as a learned
phenomenon. In other words, the functional zone should not be confused with one’s territory as is defined in the
territoriality literature (Robert David Sack, 1986; Robert D. Sack, 1993; Sykes, 1977). Human territoriality is borne
out of a strategic intent to control or influence people and social phenomena such as relationships and social
interactions. In this sense, territoriality is everywhere. For example, in the home a territorial strategy would be
parents limiting access to a particular room rather than enumerating the objects in that room that children may or
may not access. Similarly, zoning prescribes what activities are allowed within certain areas of a city (Robert David
Sack, 1986). The crux of territoriality as a strategy is the intent to control differential access to material and human
resources including social interactions. While it would be wholly appropriate to use the term “territory” in place of
“zone” where the latter merely means the area or sector of the workplace that an individual operates in, we do not

10
use this term in order to avoid confounding the impact of control over space with the probabilistic effects of simply
being present in space on dyadic processes such as relationship formation.
Functional zone is an individual level measure that facilitates the development of dyadic and potentially
group-level spatial measures that are not replications of physical distance. The dyadic measure we propose is the
zone overlap between individuals, which could be path or areal overlaps. Path measures of overlap correspond to
the critical paths in individuals’ functional zones while areal measures rely on the total size of the spaces in an
individual’s functional zone. Whether path or areal, measures of zone overlap allow for dyadic and higher level
analyses of critical issues that are often examined using aggregate individual level data. As such this fully relational
conception of proximity in space enables new possibilities for analyzing the dynamics and outcomes of interactions
in their socio-spatial contexts.
Hypotheses
Our central claim is that space matters for the dynamics and outcomes of workplace interactions because
proximity increases the likelihood of unplanned face-to-face contact while decreasing the costs of planned meetings.
Moreover distance is by itself a poor proxy for the significance of space in social interactions and relations. Space
also acts through adjacencies and contiguities, or rather, functional proximity.
Linear measures of physical distance are sensitive to topology or configuration effects. For example, while
consideration of distance is important in many building types, it is one of the fundamental elements of the design
brief for airport terminal buildings. An important criterion in the design of airport terminals is the minimization of
walking distances (De Neufville, 1995; de Neufville, de Barros, & Belin, 2002). Beyond the rarefied air of aviation
buildings, other examples abound of contexts where the consideration of walking distances is a major design factor.
Judicial facilities come to mind, where there is an interest in minimizing the distances walked by prisoners and
judiciary staff. This is typically achieved by the use of compact floor plans (AIA, 2011).
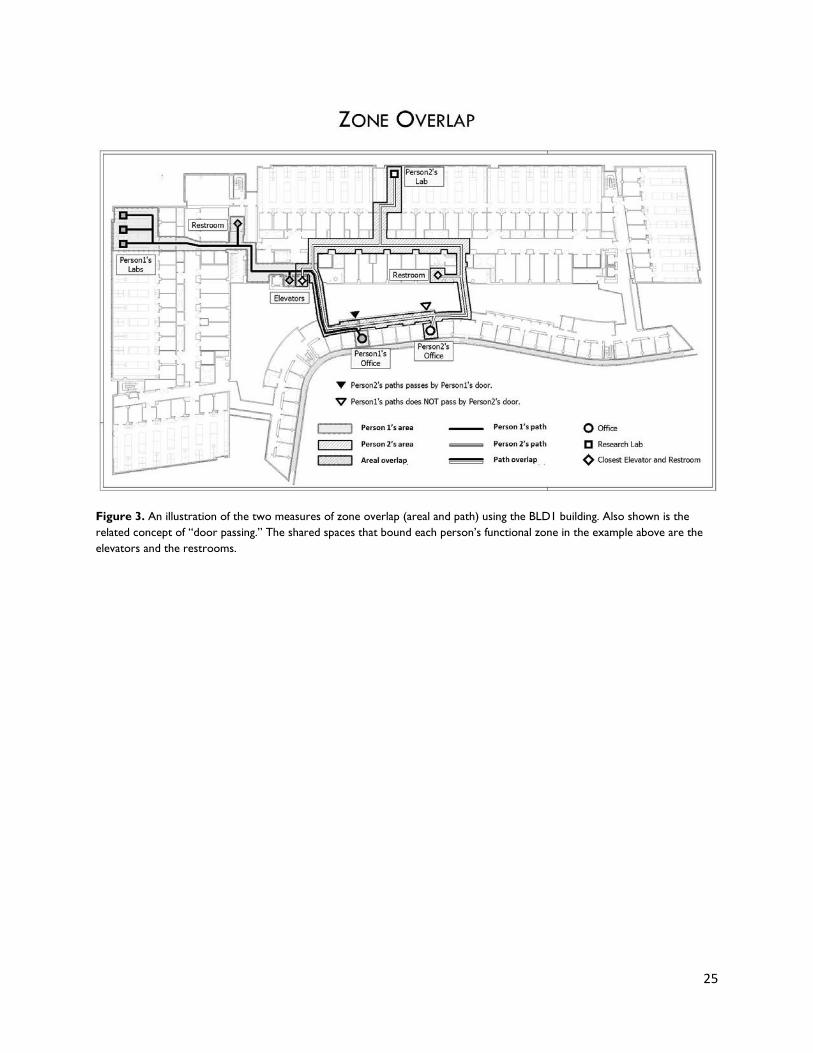
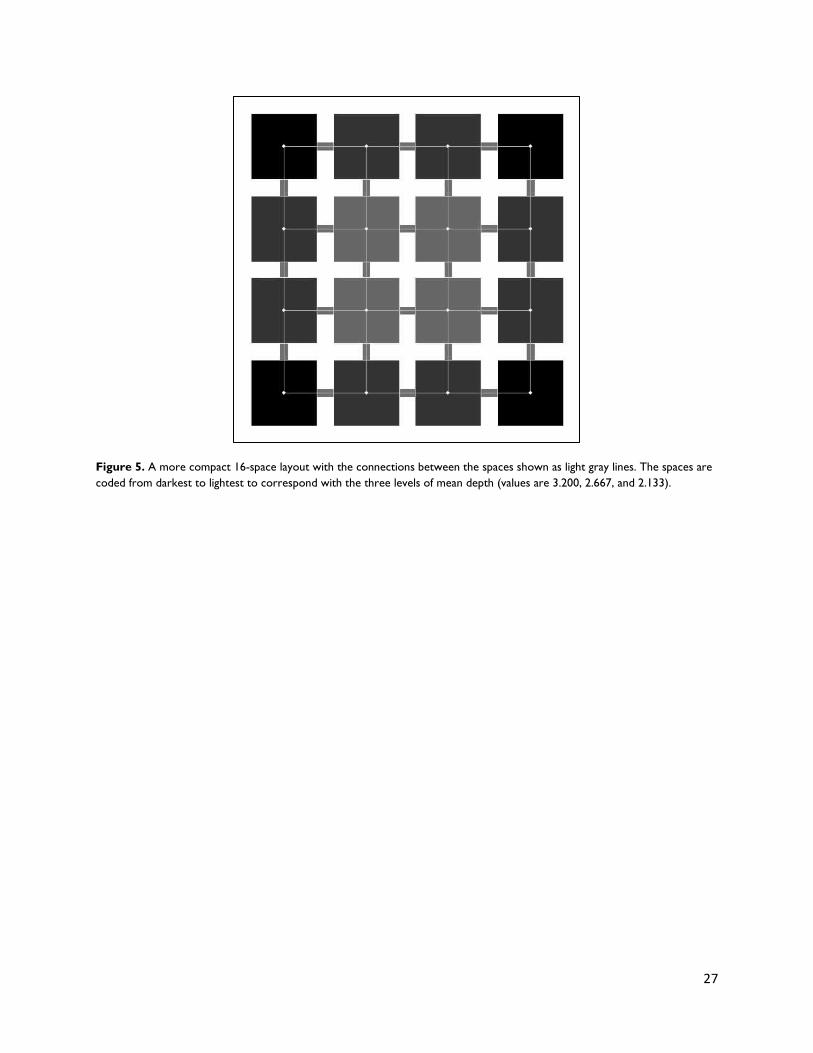
For further illustration, consider Figures 4 and 5 which show two different 16-space layouts, the former
linear and rectilinear and the latter square and compact, and where each space is a 4-unit square. Calculation of the
11
mean depth values shows that the spaces in Figure 4 (mean = 3.333, SD = 0.611) are generally at greater distances
from each other than are the spaces in Figure 5 (mean = 2.667, SD = 0.377). Even with the shortcomings of a two-
unit sample comparison, it is clearly suggestive that the average linear distance between spaces is susceptible to the
overall layout of the building or spatial system. Thus,
H1: the greater the physical distance between two people the lower the potential for knowledge transfer
between them and the lower their dyadic research collaboration index; this effect should be more significant for
linear layouts relative to more compact layouts.
While functional proximity (zone overlap) is dependent to some degree on the physical distance between
individuals, it is more relational and functional in that it emphasizes the relative locations and walking paths of
individuals in a potential or actualized dyad. To paraphrase Festinger et al, interaction in dyads may depend more on
the frequency or magnitude of the intersections of common paths than on the physical distance between primary
spaces. In other words, we expect functional proximity to be both predictive of dyadic interactions and to have
greater utility to the extent that it is more robust to layout effects. Therefore,
H2: the greater the zone overlap between two individuals the higher the potential for knowledge transfer
between them and the higher their dyadic research collaboration index; this effect should be robust to building
layouts and therefore significant both for linear and compact layouts.
Methods
Participants and Research Sites
We test our hypotheses using data from a sample of researchers working at a large public university
medical school in the US in the period from 2006-2010. We analyze data for researchers resident as of the end of
2006 in the BLD2 (n = 94) and BLD1 (n = 166) biomedical research buildings which were opened or initially
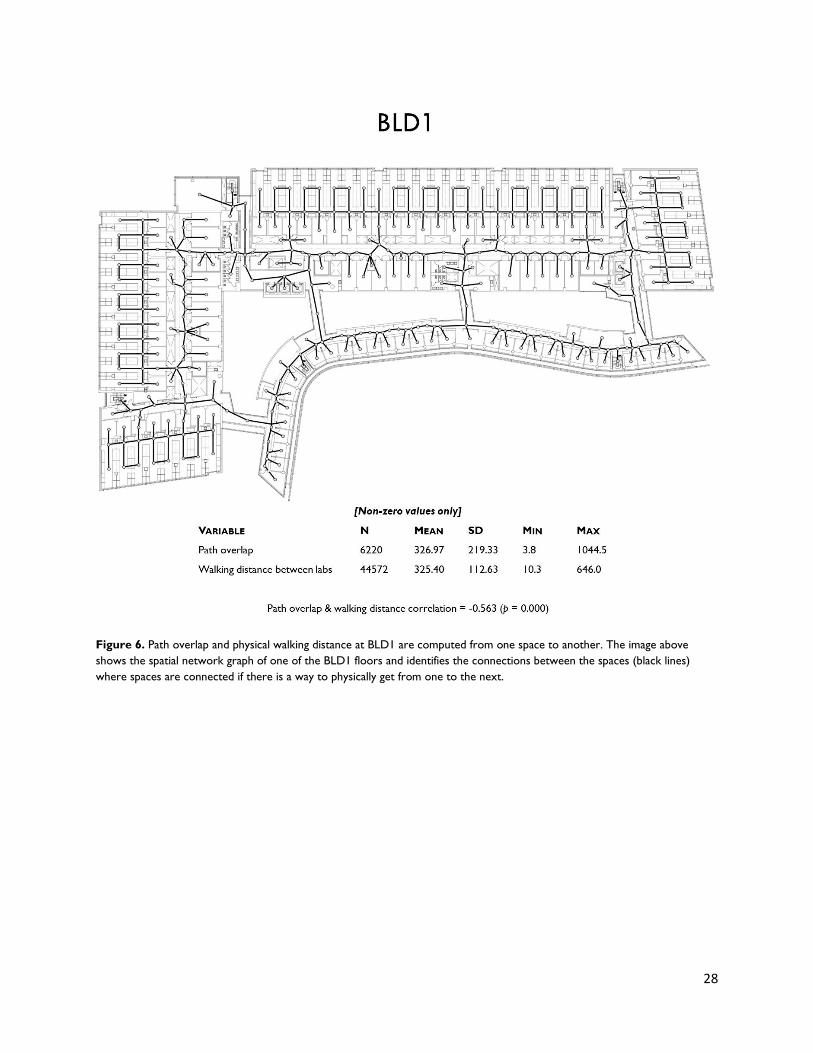
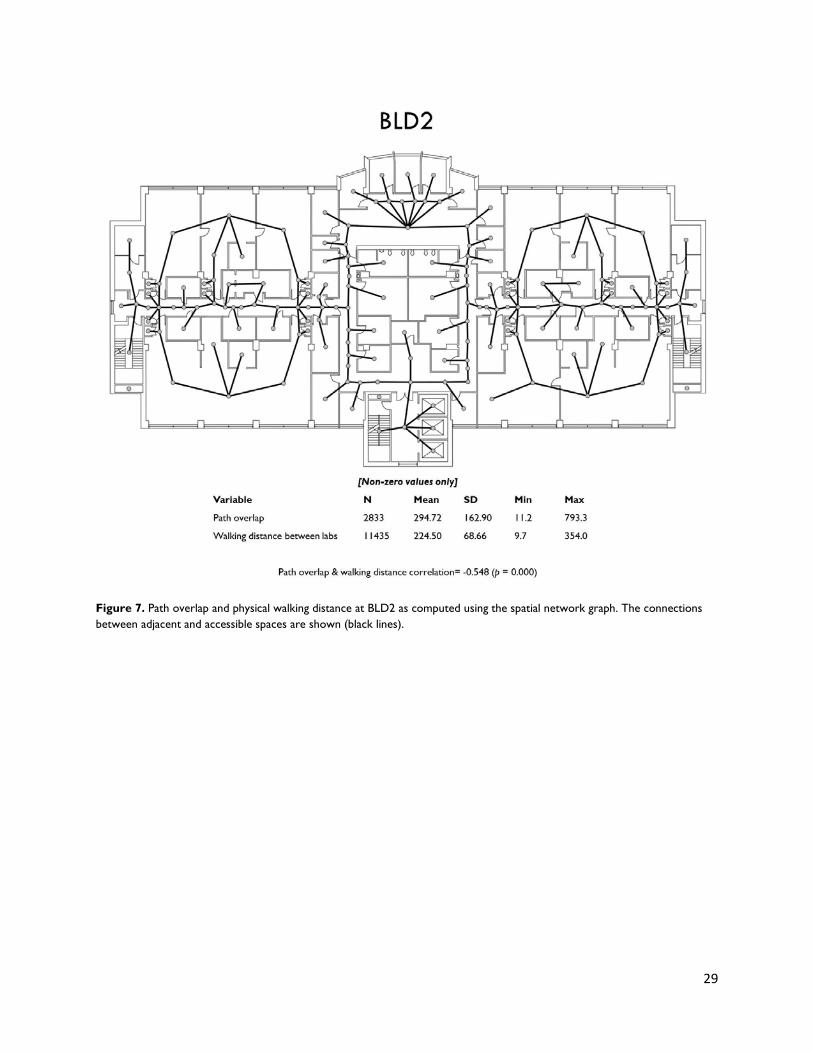
occupied in 1997 and 2006 respectively. Figures 6 and 7 show that the two buildings have different layouts; one is
more linear while the other is more compact. The BLD1 building has an internal atrium that separates the labs and

12
offices and it is also more linear in relation to the BLD2 building. The single largest contiguous part of the BLD1
building (the northern wing) is 428’ long by 86’ wide, giving a length-to-width ratio close to 5. In contrast, the
BLD2 building, which has a compact central service core instead of an internal atrium, is 223’ long by 117’ wide
giving a ratio roughly equal to 2. The BLD1 building is therefore more linear in its topology, and longer in terms of
actual physical dimensions. The two populations were similar in terms of their status and other demographic factors,
the main difference between them being that one of the populations had moved at the beginning of the study period
while the other had not moved. Prior to the move in 2006, BLD1’s researchers were spread out over several
buildings at the medical campus.
Spatial Mapping
The first step in the mapping of individuals in space was to ascertain which offices and labs were assigned
to them. We obtained data on the Medical School’s regular – that is, non-temporary – faculty from the university’s
data warehouse with supplements as needed from the Medical School for the time period 2006-2010. With the help
of the Medical School staff, we retrieved data on: human resource and financial information including job code,
department, gender, education; applications to institutional review boards (IRBs); submitted animal research
protocols; successful and unsuccessful grant applications to external sponsors, and space utilization and location
information. We linked the space location data to work addresses in the human resource dataset to build a
comprehensive picture of where researchers were spatially located. Lastly, we worked with the Medical School, the
university, and the hospital’s facilities administration office to procure ArcGIS and AutoCAD files for the Medical
School campus in addition to finer-grained layouts for the BLD1 and the BLD2 buildings.
Next we converted electronic BLD1 and BLD2 layouts into spatial networks. We used a hybrid approach
where individual, public, and circulation spaces – offices, labs, break rooms, restrooms, elevators, stairways – were
treated as discrete elements while the connectors were decomposed into convex spaces, or the ‘fattest’ spaces where
any point within the spatial boundary is visible from any other point (Hillier & Hanson, 1984; Peponis, Wineman,
Rashid, Kim, & Bafna, 1997). These elements or spaces constituted a spatial network where the nodes were
connected on the basis of accessibility and adjacency (see Figures 6 and 7).
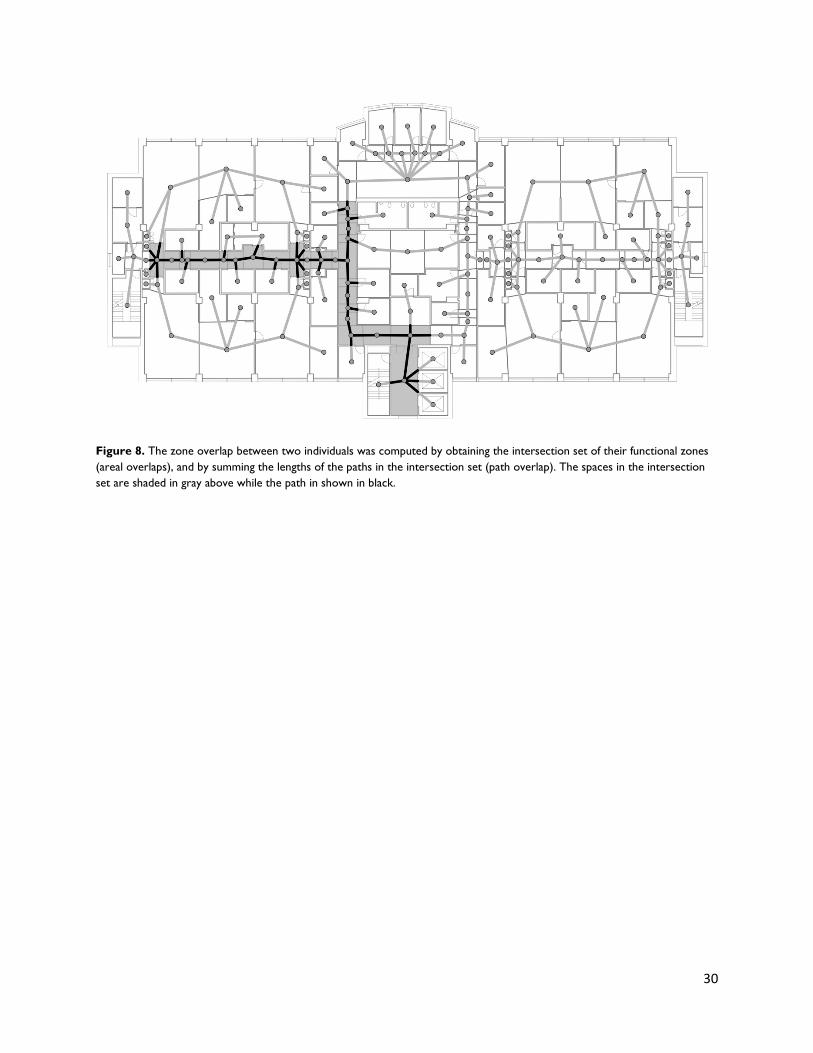
Calculating Zone Overlap

13
After generating the spatial network we used the space location dataset to map the individuals in our
sample, define individuals’ functional zones, and calculate the zone overlaps between individuals. There are three
major steps in the calculation of the zone overlap between the individuals in a dyad. First, as outlined above, the
floorplan is decomposed into spatial nodes. The distance between two nodes is computed using their centroids as a
reference, provided the nodes satisfy the dual requirements of adjacency or contiguity and direct physical
accessibility from one node to the other.
Second, individuals’ functional zones are defined. In this study the zones were bounded by the following
nodes: their workspaces (offices and labs), nearest public spaces (restrooms), closest circulation spaces (elevators
and stairways), and all of the connector spaces that link them. Each person’s zone is stored in a database as a set of
nodes with unique numerical identifiers. Third, the zone overlap between any pair of individuals is derived from the
intersection of the sets of nodes in their respective functional zones. For example, if A’s functional zone is the set of
nodes [1, 3, 5, 34, 36, 45, 68, 73, 98] and B’s functional zone is the set [1, 3, 5 11, 16, 25, 34, 36] then the zone
overlap between them is the set [1, 3, 5, 34, 36]. We can then obtain measures of areal overlap or the sum of the area
of the nodes in the intersection set, and path overlap or the sum of the total length of edges (node to node links) in
the intersection (Figure 8).
Using the centroids of their assigned spaces as reference points we also applied Dijkstra’s algorithm to
calculate the minimum physical distances between individuals (Dijkstra, 1959). The zone overlap and physical
distance measures (walking and turn) were treated as independent variables in our models. In Table 1 we show the
variables that we used in our regression models and analysis.
Dependent Variable
Collaboration Index. For any given year from 2006-2010, we created a composite index of research
collaboration, the extent to which a given dyad produced collaborative outputs relating to the early stages of a
project, by merging the following outcomes for each dyad: applications to institutional review boards, animal
research protocols, and grant applications to external sponsors. The resultant count dependent variable,
“collaboration index,” is overdispersed and has a left-skewed distribution.

14
Independent Variables
Path Overlap. Having computed the zone overlaps as previously discussed, we applied “path overlap”
(measured in feet) in our regression models as it lent itself to a comparison with physical distance in addition to
being more intuitive to interpret. Moreover, both measures of zone overlap were highly correlated (r = .986) and this
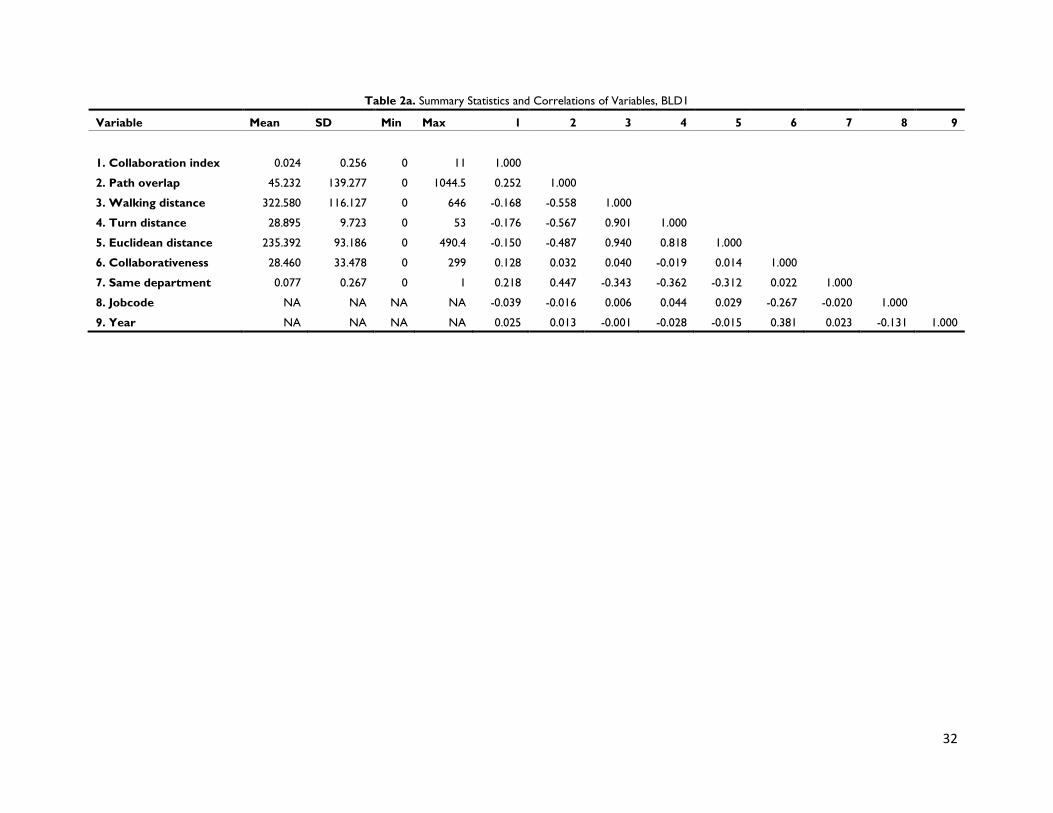
gave us the confidence to use any of them in isolation as an expression of the zone overlap concept. From Tables 2a
and 2b we also see that the correlations between measures of physical distance and path overlap are negative and
low, suggesting that they capture complementary aspects of space.
Physical Distance. Two measures were generated to capture physical distance in feet: the first was metric and
captured walking distance (“walking”), and the second topological or relational distance (“turn”). For each measure,
the distance between individuals was calculated as the distance between the centroids of their primary space with the
order of precedence being labs then offices. For individuals who had both labs and offices or labs only (typically
junior researchers or staff), their designated primary space was the lab. However, for those whom we were able to
map only onto an office space, then this was presumed to be their primary space. Walking distance was computed as
the actual distance between these centroids therefore taking into account walls and other barriers as well as whether
there was a physical connection between spaces. Topological distance was calculated as the minimum number of
turns it took to get from one space to another. Walking and topological distances are highly correlated (r = .911). A
third measure of physical metric distance, Euclidean distance, was generated for the logit equation predicting the
incidence of dyadic collaborations (discussed in the next section). Euclidean distance was computed as the distance
between centroids of spaces without consideration of barriers and physical accessibility or connections between
these spaces.
Control Variables
Collaborativeness. We considered a collaboration to exist whenever two people appeared together on IRB
applications, animal research protocols, and grant proposals to external sponsors. In order to control for the extant
overall levels of and propensities for collaboration for the two people in the dyad, we coded all collaborations that
the dyad had with all other people in their respective sample including the dyad itself. The resultant count variable
was named “collaborativeness.”
15
Same Department. Previous research has shown that affiliation, such as being in the same department,
encourages and reflects homophily and, subsequently, higher levels of interaction (Agneessens & Wittek, 2012;
Kossinets & Watts, 2006; Wineman et al., 2009). We created and included a binary variable coded as one if the two
people in a dyad were in the same department at any point in that particular year, and zero otherwise.
Jobcode. For academic settings the primary distinction in faculty or research appointments is between those
who are tenure-track or tenured and those who are in other types of positions. In order to account for the fact that
differences in job types may be a determinant of interactions and collaborations in a potential dyad, we used the
human resources dataset to code each individual’s position on the basis of whether it was: tenured or tenure track,
coded as “academic,” and research track or clinical, coded as “other.” At the dyadic level, a three-level categorical
measure was created and coded zero if both dyad members had “academic” positions, one if only one dyad member
had an academic position, and two if both dyad members had “other” positions.
Year. We created a categorical variable for years, with each level in the variable corresponding to each of
the years in the period from 2006-2010 because the space use and utilization data only dates back to 2006, making
this the cutoff for the regression analysis and models.
Statistical Analysis and Model Specification
The class of Poisson regression models is the best suited for count dependent variables such as our index of
research collaboration. However, one of the assumptions of Poisson regression is that the mean and variance are
equal. The dependent variable here is overdispersed because the variance is greater than the mean (Tables 2a and
2b), a more appropriate model would be a negative binomial regression, which corrects for overdispersion. Even so,
a major reason for the overdispersion is the large number of zero counts for the dependent variable. The zero counts
reflect the fact that many potential dyads have never formed and thus there is no likelihood of there being any
research collaboration between the two people in the unconsummated relation. A model that corrects for
overdispersion and accounts for the large number of zero counts is the zero-inflated negative binomial regression
(Karazsia & van Dulmen, 2008; Long & Freese, 2006). The zero-inflated negative binomial regression actually has
16
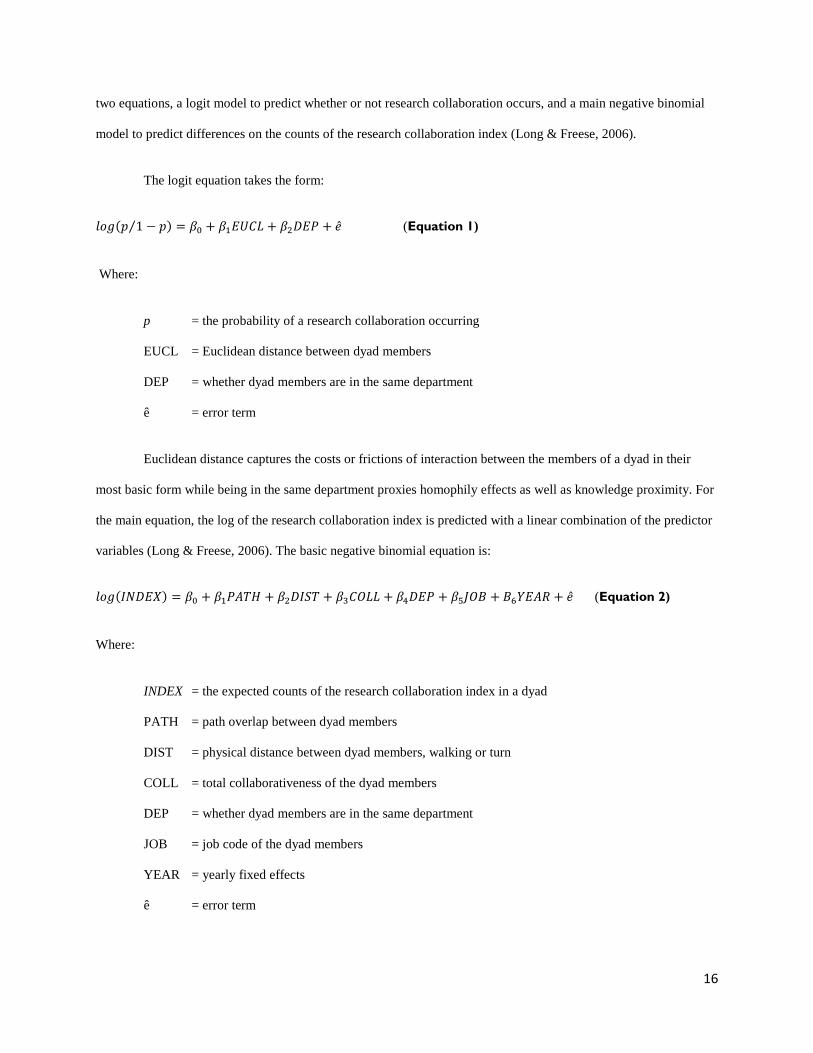
two equations, a logit model to predict whether or not research collaboration occurs, and a main negative binomial
model to predict differences on the counts of the research collaboration index (Long & Freese, 2006).
The logit equation takes the form:
𝑙𝑜𝑔(𝑝 1 − 𝑝⁄ ) = 𝛽0 + 𝛽1𝐸𝑈𝐶𝐿 + 𝛽2𝐷𝐸𝑃 + �̂� (Equation 1)
Where:
p = the probability of a research collaboration occurring
EUCL = Euclidean distance between dyad members
DEP = whether dyad members are in the same department
ê = error term
Euclidean distance captures the costs or frictions of interaction between the members of a dyad in their
most basic form while being in the same department proxies homophily effects as well as knowledge proximity. For
the main equation, the log of the research collaboration index is predicted with a linear combination of the predictor
variables (Long & Freese, 2006). The basic negative binomial equation is:
𝑙𝑜𝑔(𝐼𝑁𝐷𝐸𝑋) = 𝛽0 + 𝛽1𝑃𝐴𝑇𝐻 + 𝛽2𝐷𝐼𝑆𝑇 + 𝛽3𝐶𝑂𝐿𝐿 + 𝛽4𝐷𝐸𝑃 + 𝛽5𝐽𝑂𝐵 + 𝐵6𝑌𝐸𝐴𝑅 + �̂� (Equation 2)
Where:
INDEX = the expected counts of the research collaboration index in a dyad
PATH = path overlap between dyad members
DIST = physical distance between dyad members, walking or turn
COLL = total collaborativeness of the dyad members
DEP = whether dyad members are in the same department
JOB = job code of the dyad members
YEAR = yearly fixed effects
ê = error term
17
We created two different zero-inflated negative binomial regression models corresponding to each of the
buildings in order to account for differences in spatial layout; the first model focuses solely upon researchers who
had moved to BLD1 by the end of 2006; and the second only examines researchers resident in BLD2 as of the end
of 2006. In other words, even though we run models for the period 2006-2010, there are no new individuals in the
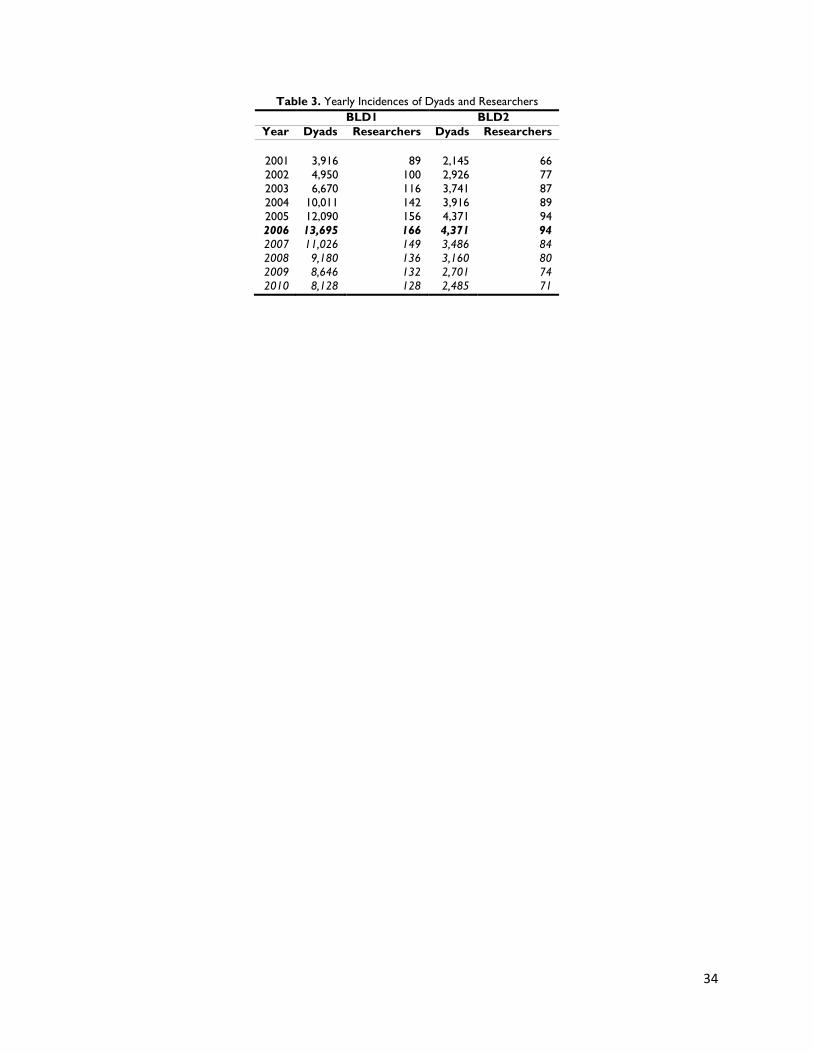
two samples post-2006 (Table 3). However, there is attrition so the sample gets progressively smaller over time as
people either leave the university or relocate to other buildings within the university. There were 4,371 BLD2 dyads
in 2006 but only 2,485 by 2010. Similarly, there were 13,695 BLD1 dyads in 2006 and 8,128 dyads by 2010.
In summary, our regression models focus on inter-dyad variations while controlling for year to year
variations (such as changes in NIH funding levels) that will affect all dyads in the sample. In these models a
significant and positive effect of zone overlap, for instance, would suggest that collaborators with more shared
pathways will be more productive than collaborator's with less functional overlap. We test the effectiveness of the
path overlap measure as a predictor of the dyadic collaboration index relative to metric and topological measures of
physical distance for two samples of biomedical researchers in the period from 2006-2010. The two samples work in
different buildings, and the differences in layout between these two spaces allow us to speak to the measure’s
robustness across building designs. This point is important because we believe that physical distance is susceptible
to layout effects, and that any measure of functional proximity or dyadic spatial effects should be robust to layout
effects in order to facilitate cross-comparisons of different buildings.
Results
The results of the regression models are shown in Tables 4a and 4b. Our analysis and interpretation of the
results will concentrate on the full models (4, 5, 9, and 10). Though not shown here, the logit or zero-inflation
models confirm that affiliation (being in the same department) and interactions costs or frictions (Euclidean
distance) had significant effects on the likelihood of the existence of a dyadic collaboration.
Across the two buildings, path overlap has a significant and positive effect even controlling for the physical
distance between dyad members, thus confirming H2. In BLD1, a 100-foot increase in path overlap in a dyad leads
18
to a 14.6% increase in the expected counts of the research collaboration index when controlling for walking
distance, and a 15.9% increase if controlling for turn distance (models 4 and 5). Path overlap has an even larger
effect in BLD2; a 100-foot increase in path overlap results in 19.4% and 29.2% increases in expected counts of the
research collaboration index when controlling for walking and turn distances respectively (models 9 and 10). In
other words, across the two buildings, a 100-foot increase in path overlap results in significantly higher outputs of
IRB applications, animal research protocols, and grant applications to external sponsors.
Physical distance has a negative and significant effect on the collaboration index in BLD1 and no
significant effect in BLD2, confirming H1. In the more linear BLD1, controlling for path overlap, increasing the
walking distance by 100 feet or the turn distance by 10 turns leads to 35.4% and 30.8% decreases respectively in
expected counts of the dyadic research collaboration index. In contrast, in the more compact BLD2, physical
distance has no significant effect when controlling for path overlap. These findings highlight the limited utility of
physical distance as a proxy for the effects of spatial proximity, especially when the focal building has a more
compact footprint.
The control variables performed as expected, but there were some differences between the two buildings in
the “year” and “same department” variables. In both BLD1 and BLD2, the overall “collaborativeness” of the
members of a potential dyad was a significant and positive predictor of their dyadic research collaboration index. An
increase of 10 units in dyadic “collaborativeness” of (IRB applications, animal research protocols, grant applications
to external sponsors) results in 21-22% and 5-6% increases in counts of the collaboration index at BLD1 and BLD2
respectively.
Being in the “same department” had a positive and significant effect in BLD1 and no significant effect in
BLD2. At BLD1, departmental affiliation leads to a 84-102% increase in collaboration index counts. The “jobcode”
variable shows that, despite the general trend of a steady decline in tenured and tenure-track faculty in academic
institutions (Ehrenberg & Zhang, 2005; Snyder & Dillow, 2012), researchers fitting this description are still more
likely to form or initiate new collaboration dyads relative to those in nontenure-track positions. In BLD1 all “other”
dyads face 41-44% decreases in expected counts of the collaboration index. The corresponding numbers for BLD2,
47-51% decreases in expected counts, are even larger. Lastly, the year dummies had no significant effect on the
19
collaboration index, with the exception of the year 2010 in BLD1. With 2006 as the reference level for the year
dummies, in the year 2010 there was a roughly 38% decrease in the expected collaboration index counts.
Discussion
Our analyses offered strong support for the hypotheses H1 and H2. Regarding H2, path overlap has a
significant effect on the research collaboration index and its influence is similar across buildings. These effects are
both substantively and statistically significant, lending credence to the utility of this dyadic spatial measure of
functional proximity. Within building micro-level differences in proximity clearly influence the collaboration index
of dyads. While more research is needed to test the zone overlap concept in other settings, our analysis suggests that
a dyadic spatial measure such as ours would contribute significantly to research on relational organizational
processes.
In contrast, with respect to H1, physical distance was a significant predictor of the dyadic collaboration
index only in the more linear BLD1. We suspect that these differences result from the characteristics of the building
layouts. We conjecture that distances matter more in BLD1 both because the occupants are relatively new to the
space and because of differences in the spatial topologies of the BLD1 and BLD2 buildings (Figures 6 and 7), and
especially the fact that BLD1 is more linear than BLD2. Despite its ease of interpretation and calculation, physical
distance clearly has its limits.
Future analysis of research collaboration in academic settings should address the roles that formal
affiliation and job types play in fostering and maintaining collaborative efforts. Investigators are more likely to have
non-zero counts of the dyadic collaboration index with within- rather than between-department dyads. Moreover,
our results suggest skewed relations between tenured or tenure-track, and nontenure-track researchers. Dyads
composed of tenured and tenure-track researchers are more likely to have non-zero research collaboration counts
than are dyads comprised of nontenure-track peers, who would include those with research track, clinical, adjunct,
and visiting positions.

20
Shifting the focus of spatial analysis away from measures of distance and toward conceptions of functional
zones and their overlap also suggests interesting future directions. Similarly, attention to zones and overlaps at
multiple levels of analysis could shift the emphasis of both design and space allocation processes in support of
research or other organizational outcomes in subtle but important ways. The most important area for future research
is the examination of how people define, occupy, and traverse functional zones. We conceptualize such zones in
fairly simple terms, but it may be the case that other public spaces should be included in the definition. By the same
token, all types of zone overlaps may not be created equal. For instance, paths that overlap as people move to and
from tasks (for example, between labs and offices) may have different effects than overlaps that happen on the way
to and from the restrooms or as investigators enter and leave the building.
Finally, this approach suggests new ways to consider the global impacts of small design changes. If
bathrooms, for instance, are important markers of functional zones, then buildings that separate male and female
facilities at opposite ends of long hallways will systematically increase zone overlaps between same sex pairs while
diminishing them for mixed sex pairs. In that case, our findings strongly suggest that such a design will increase
rates of same sex collaborations while decreasing the incidence of mixed sex collaborations. This possibility hints at
some of the subtle mechanisms by which decisions about the design and allocation of space serve to create, sustain,
or ameliorate significant workplace differentials. Conceptualizing and measuring proximity effects in terms of
flexible, overlapping zones of activity that take into account the contingent ways individuals occupy and make their
way through buildings offers dramatic new possibilities for research that develops class theoretical ideas while
having immediate relevance for policy and design.
References
Agneessens, F., & Wittek, R. (2012). Where do intra-organizational advice relations come from? The role of informal status and
social capital in social exchange. Social Networks, 34(3), 333-345. doi: 10.1016/j.socnet.2011.04.002
AIA. (2011). JFR11: Justice Facilities Review (A. o. A. f. Justice, Trans.). Washington, D.C.: American Institute of Architects.
Burt, Ronald S. (2004). Structural Holes and Good Ideas. American Journal of Sociology, 110(2), 349-399.
Cowgill, B., Wolfers, J., & Zitzewitz, E. (2009). Using Prediction Markets to Track Information Flows: Evidence from Google.
Working paper. Dartmouth College.

21
De Neufville, R. (1995). Designing Airport Passenger Buildings For The 21st Century. Proceedings of the Institution of Civil
Engineers - Transport, 111(2), 97-104.
de Neufville, R., de Barros, A., & Belin, S. (2002). Optimal Configuration of Airport Passenger Buildings for Travelers. Journal
of Transportation Engineering, 128(3), 211-217. doi: 10.1061/(asce)0733-947x(2002)128:3(211)
Dijkstra, E. W. (1959). A note on two problems in connexion with graphs. Numerische mathematik, 1(1), 269-271.
Ehrenberg, R. G., & Zhang, L. (2005). Do Tenured and Tenure-Track Faculty Matter? The Journal of Human Resources, 40(3),
647-659.
Festinger, L., Schachter, S., & Back, K. W. (1950). Social pressures in informal groups; a study of human factors in housing
([1st ed.). New York: Harper.
Grannis, R. (2011). From the Ground Up : Translating Geography into Community through Neighbor Networks. Princeton, NJ,
USA: Princeton University Press.
Hansen, M. T. (1999). The Search-Transfer Problem: The Role of Weak Ties in Sharing Knowledge across Organization
Subunits. Administrative Science Quarterly, 44(1), 82-111. doi: 10.2307/2667032
Hillier, B., & Hanson, J. (1984). The Social Logic of Space. Cambridge, UK: Cambridge University Press.
Hua, Y., Loftness, V., Heerwagen, J. H., & Powell, K. M. (2011). Relationship Between Workplace Spatial Settings and
Occupant-Perceived Support for Collaboration. Environment and Behavior, 43(6), 807-826.
Karazsia, B. T., & van Dulmen, M. H. M. (2008). Regression Models for Count Data: Illustrations using Longitudinal Predictors
of Childhood Injury. Journal of Pediatric Psychology, 33(10), 1076-1084.
Kono, C., Palmer, D., Friedland, R., & Zafonte, M. (1998). Lost in Space: The Geography of Corporate Interlocking Directorates.
The American Journal of Sociology, 103(4), 863-911.
Kossinets, G., & Watts, D. J. (2006). Empirical Analysis of an Evolving Social Network. Science, 311(5757), 88-90. doi:
10.1126/science.1116869
Liu, C. C. (2010). A SPATIAL ECOLOGY OF STRUCTURAL HOLES: SCIENTISTS AND COMMUNICATION AT A
BIOTECHNOLOGY FIRM. [Article]. Academy of Management Annual Meeting Proceedings, 1-6. doi:
10.5465/ambpp.2010.54497844
Long, J. S., & Freese, J. (2006). Regression models for categorical dependent variables using Stata (2nd ed.). College Station,
Tex.: StataCorp LP.
Mainiero, L. A. (1989). Office romance: love, power, and sex in the workplace: Rawson Associates.
Merriam-Webster, I. (2003). Merriam-Webster's collegiate dictionary. Springfield, Mass.: Merriam-Webster, Inc.
Mizruchi, M. S., & Marquis, C. (2006). Egocentric, sociocentric, or dyadic?: Identifying the appropriate level of analysis in the
study of organizational networks. Social Networks, 28(3), 187-208. doi: 10.1016/j.socnet.2005.06.002
22
Monge, P. R., & Kirste, K. K. (1980). Measuring Proximity in Human Organization. Social Psychology Quarterly, 43(1), 110-
115.
Moodysson, J., & Jonsson, O. (2007). Knowledge Collaboration and Proximity. European Urban and Regional Studies, 14(2),
115-131.
Owen-Smith, J., Kabo, F., Levenstein, M., Price, R., & Davis, G. (2012). A Tale of Two Buildings: Socio-Spatial Significance in
Innovation (I. f. S. Research, Trans.) (pp. 36). Ann Arbor, MI: University of Michigan.
Peponis, J., Wineman, J., Rashid, M., Kim, S. H., & Bafna, S. (1997). On the description of shape and spatial configuration
inside buildings: convex partitions and their local properties. Environment and Planning B: Planning and Design,
24(5), 761-781.
Pfeffer, J. (1992). Managing with power: politics and influence in organizations. Boston, Mass.: Harvard Business School Press.
Pierce, C. A., Byrne, D., & Aguinis, H. (1996). Attraction in Organizations: A Model of Workplace Romance. Journal of
Organizational Behavior, 17(1), 5-32.
Powell, G. N., & Foley, S. (1998). Something to Talk About: Romantic Relationships M Organizational Settings. Journal of
Management, 24(3), 421-448.
Powell, W. W., Koput, K. W., & Smith-Doerr, L. (1996). Interorganizational Collaboration and the Locus of Innovation:
Networks of Learning in Biotechnology. Administrative Science Quarterly, 41(1), 116-145. doi: 10.2307/2393988
Sack, R. D. (1986). Human territoriality: its theory and history. Cambridge [Cambridgeshire] ; New York: Cambridge University
Press.
Sack, R. D. (1993). The Power of Place and Space. Geographical Review, 83(3), 326-329.
Sailer, K., & McCulloh, I. (2012). Social networks and spatial configuration — How office layouts drive social interaction.
Social Networks, 34(1), 47-58. doi: 10.1016/j.socnet.2011.05.005
Snyder, T. D., & Dillow, S. A. (2012). Digest of Education Statistics, 2011 (I. o. E. Sciences, Trans.) (pp. 758). Washington,
D.C.: National Center for Education Statistics (NCES).
Sykes, R. E. (1977). A theory of proximity and attraction. Springfield, VA.: Reproduced by National Technical Information
Service.
Wineman, J. D., Kabo, F. W., & Davis, G. F. (2009). Spatial and Social Networks in Organizational Innovation. Environment
and Behavior, 41(3), 427-442.
23
Figures
Figure 1. An illustration of Euclidean and walking distances between individuals A, B, and C in a simple spatial layout. For simplicity, individuals are restricted to orthogonal movements. Walking movement paths are depicted using solid lines while the Euclidean paths are shown as hatched lines.

24
Figure 2. Further demonstration of the limitations of physical distance as a robust proxy for the finer-grained effects of spatial proximity. The physical distance is held constant, and the changes in the relative locations of the individuals in the latent dyad lead to dramatic differences in the expected likelihood of encounters or interactions between them.
25
Figure 3. An illustration of the two measures of zone overlap (areal and path) using the BLD1 building. Also shown is the related concept of “door passing.” The shared spaces that bound each person’s functional zone in the example above are the elevators and the restrooms.
26
Figure 4. A more linear 16-space layout with the links between the spaces shown as light gray lines. From darkest to lightest, the spaces are coded according to their mean depth. The four values of mean depth are 4.267, 3.467, 2.933, and 2.667.
27
Figure 5. A more compact 16-space layout with the connections between the spaces shown as light gray lines. The spaces are coded from darkest to lightest to correspond with the three levels of mean depth (values are 3.200, 2.667, and 2.133).
28
Figure 6. Path overlap and physical walking distance at BLD1 are computed from one space to another. The image above shows the spatial network graph of one of the BLD1 floors and identifies the connections between the spaces (black lines) where spaces are connected if there is a way to physically get from one to the next.
29
Figure 7. Path overlap and physical walking distance at BLD2 as computed using the spatial network graph. The connections between adjacent and accessible spaces are shown (black lines).
30
Figure 8. The zone overlap between two individuals was computed by obtaining the intersection set of their functional zones (areal overlaps), and by summing the lengths of the paths in the intersection set (path overlap). The spaces in the intersection set are shaded in gray above while the path in shown in black.

31
Tables Table 1. Descriptions of Variables
Variable Type Description Collaboration index Count Yearly combination of applications to institutional review boards,
animal research protocols, and grant applications to external sponsors
Path overlap Continuous The length of the overlap in feet of the paths in the functional zones of the two people in the dyad
Walking distance Continuous The actual distance in feet between the labs of the two people in the dyad
Turn distance Count The number of 90-degree turns between the labs of the dyad members
Euclidean distance Continuous The straight-line distance in feet between the labs of the two people in the dyad
Collaborativeness Count The sum of the number of collaborations both people in the dyad have with all other people in their respective building samples including the dyad itself
Same department Dummy Coded as 1 if the two people in a dyad were in the same department that year
Jobcode Categorical The variable captures whether both people in the dyad had academic or tenured/tenure-track positions (coded 0), whether one person only or half of the dyad had an academic position (coded 1), or whether both people in the dyad did not have academic positions (coded 2)
Year Categorical The variable has a value for each of the five years in the period 2006-2010
32
Table 2a. Summary Statistics and Correlations of Variables, BLD1
Variable Mean SD Min Max 1 2 3 4 5 6 7 8 9
1. Collaboration index 0.024 0.256 0 11 1.000 2. Path overlap 45.232 139.277 0 1044.5 0.252 1.000
3. Walking distance 322.580 116.127 0 646 -0.168 -0.558 1.000 4. Turn distance 28.895 9.723 0 53 -0.176 -0.567 0.901 1.000
5. Euclidean distance 235.392 93.186 0 490.4 -0.150 -0.487 0.940 0.818 1.000 6. Collaborativeness 28.460 33.478 0 299 0.128 0.032 0.040 -0.019 0.014 1.000
7. Same department 0.077 0.267 0 1 0.218 0.447 -0.343 -0.362 -0.312 0.022 1.000 8. Jobcode NA NA NA NA -0.039 -0.016 0.006 0.044 0.029 -0.267 -0.020 1.000
9. Year NA NA NA NA 0.025 0.013 -0.001 -0.028 -0.015 0.381 0.023 -0.131 1.000

33
Table 2b. Summary Statistics and Correlations of Variables, BLD2
Variable Mean SD Min Max 1 2 3 4 5 6 7 8 9
1. Collaboration index 0.083 0.557 0 15 1.000 2. Path overlap 71.412 149.588 0 793.3 0.203 1.000
3. Walking distance 219.561 75.460 0 354 -0.187 -0.727 1.000 4. Turn distance 19.927 7.775 0 36 -0.145 -0.578 0.887 1.000
5. Euclidean distance 158.807 53.301 0 264.1 -0.165 -0.637 0.895 0.805 1.000 6. Collaborativeness 68.168 79.901 0 622 0.205 0.040 -0.037 -0.023 0.003 1.000
7. Same department 0.176 0.381 0 1 0.215 0.152 -0.169 -0.133 -0.165 0.262 1.000 8. Jobcode NA NA NA NA -0.104 -0.030 -0.020 -0.031 -0.051 -0.368 -0.051 1.000
9. Year NA NA NA NA 0.057 0.006 -0.050 -0.027 -0.041 0.384 0.066 -0.128 1.000
34
Table 3. Yearly Incidences of Dyads and Researchers
BLD1 BLD2
Year Dyads Researchers Dyads Researchers 2001 3,916 89 2,145 66 2002 4,950 100 2,926 77 2003 6,670 116 3,741 87 2004 10,011 142 3,916 89 2005 12,090 156 4,371 94 2006 13,695 166 4,371 94 2007 11,026 149 3,486 84 2008 9,180 136 3,160 80 2009 8,646 132 2,701 74 2010 8,128 128 2,485 71
35
Table 4a. Effects of Functional Proximity and Physical Distance on Dyadic Collaboration Index, BLD1 DEP. VAR. = COLLABORATION INDEX (1) (2) (3) (4) (5)
VARIABLES
Path overlap 0.00208***
0.00136*** 0.00147***
(0.000327)
(0.000352) (0.000353)
Walking distance
-0.00654***
-0.00438**
(0.00134)
(0.00145)
Turn distance
-0.0593***
-0.0368***
(0.00963)
(0.0110)
Collaborativeness 0.0189*** 0.0202*** 0.0200*** 0.0196*** 0.0194***
(0.00125) (0.00123) (0.00125) (0.00119) (0.00120)
Same department 1.063*** 0.566+ 0.667* 0.612+ 0.705*
(0.309) (0.314) (0.310) (0.336) (0.330)
jobcode_Academic-Academic (reference) jobcode_Academic-Other -0.0904 -0.174 -0.143 -0.133 -0.109
(0.147) (0.147) (0.148) (0.142) (0.144)
jobcode_Other-Other -0.524* -0.603** -0.551** -0.571** -0.534**
(0.205) (0.198) (0.200) (0.199) (0.200)
year_2006 (reference) year_2007 0.192+ 0.210* 0.189+ 0.209* 0.193+
(0.101) (0.0981) (0.0978) (0.101) (0.101)
year_2008 -0.182 -0.189 -0.193 -0.189 -0.193
(0.139) (0.127) (0.127) (0.132) (0.132)
year_2009 0.00661 -0.0109 -0.0155 -0.00153 -0.00463
(0.129) (0.120) (0.120) (0.125) (0.125)
year_2010 -0.486** -0.468** -0.469** -0.477** -0.481**
(0.162) (0.149) (0.149) (0.157) (0.158)
Constant -3.837*** -1.982*** -2.094*** -2.837*** -3.008***
(0.287) (0.300) (0.310) (0.404) (0.407)
Observations 44,962 44,962 44,962 44,962 44,962 Robust standard errors in parentheses *** p<0.001, ** p<0.01, * p<0.05, + p<0.1

36
Table 4b. Effects of Functional Proximity and Physical Distance on Dyadic Collaboration Index, BLD2 DEP. VAR. = COLLABORATION INDEX (6) (7) (8) (9) (10)
VARIABLES
Path overlap 0.00252***
0.00177*** 0.00256***
(0.000386)
(0.000518) (0.000450)
Walking distance
-0.00619***
-0.00261
(0.00177)
(0.00177)
Turn distance
-0.0402***
0.00133
(0.00947)
(0.0128)
Collaborativeness 0.00535*** 0.00537*** 0.00540*** 0.00540*** 0.00534***
(0.000796) (0.000823) (0.000749) (0.000815) (0.000771)
Same department 0.496 0.404 0.637+ 0.392 0.501
(0.383) (0.427) (0.366) (0.420) (0.397)
jobcode_Academic-Academic (reference) jobcode_Academic-Other -0.274 -0.376+ -0.304 -0.319 -0.273
(0.205) (0.217) (0.205) (0.212) (0.206)
jobcode_Other-Other -0.640* -0.819** -0.728* -0.713* -0.637*
(0.283) (0.291) (0.284) (0.291) (0.289)
year_2006 (reference) year_2007 0.0775 0.0425 -0.0139 0.0791 0.0778
(0.123) (0.130) (0.122) (0.127) (0.122)
year_2008 0.139 0.111 0.0896 0.125 0.140
(0.146) (0.152) (0.148) (0.149) (0.145)
year_2009 -0.127 -0.196 -0.219 -0.152 -0.125
(0.168) (0.168) (0.166) (0.169) (0.166)
year_2010 0.0666 -0.00799 0.0122 0.0252 0.0698
(0.156) (0.166) (0.159) (0.165) (0.158)
Constant -2.430*** -0.938+ -1.313** -1.856** -2.458***
(0.402) (0.494) (0.482) (0.606) (0.544)
Observations 11,692 11,692 11,692 11,692 11,692 Robust standard errors in parentheses
*** p<0.001, ** p<0.01, * p<0.05, + p<0.1