Embed Size (px)
Citation preview

1
ZOETIS: THE WORLD LEADER IN
ANIMAL HEALTH JUAN RAMÓN ALAIX – CHIEF EXECUTIVE OFFICER
WILLIAM BLAIR 35TH ANNUAL GROWTH STOCK CONFERENCE JUNE 10, 2015

2
FORWARD-LOOKING STATEMENTS
NON-GAAP FINANCIAL INFORMATION
This presentation contains forward-looking statements, which reflect the current views of Zoetis with respect to business
plans or prospects, future operating or financial performance, expectations regarding products, future use of cash and
dividend payments, and other future events. These statements are not guarantees of future performance or actions.
Forward-looking statements are subject to risks and uncertainties. If one or more of these risks or uncertainties
materialize, or if management's underlying assumptions prove to be incorrect, actual results may differ materially from
those contemplated by a forward-looking statement. Forward-looking statements speak only as of the date on which they
are made. Zoetis expressly disclaims any obligation to update or revise any forward-looking statement, whether as a
result of new information, future events or otherwise. A further list and description of risks, uncertainties and other
matters can be found in our Annual Report on Form 10-K for the fiscal year ended December 31, 2014, including in the
sections thereof captioned “Forward-Looking Information and Factors That May Affect Future Results” and “Item 1A. Risk
Factors,” in our Quarterly Reports on Form 10-Q and in our Current Reports on Form 8-K. These filings and subsequent
filings are available online at www.sec.gov, www.zoetis.com, or on request from Zoetis.
We use non-GAAP financial measures, such as adjusted net income and adjusted diluted earnings per share, to assess
and analyze our operational results and trends and to make financial and operational decisions. We believe these non-
GAAP financial measures are also useful to investors because they provide greater transparency regarding our operating
performance. The non-GAAP financial measures included in this presentation should not be considered alternatives to
measurements required by GAAP, such as net income, operating income, and earnings per share, and should not be
considered measures of liquidity. These non-GAAP financial measures are unlikely to be comparable with non-GAAP
information provided by other companies. Reconciliation of non-GAAP financial measures and GAAP financial measures
are included in the tables accompanying our earnings release and are posted on our website at www.zoetis.com.

3
STRONG LONG-TERM
INDUSTRY GROWTH
DRIVERS

4
AT THE CORE OF A $100+ BILLION INDUSTRY
COMPANION ANIMAL
LIVESTOCK
1 Vetnosis Review 2014 2 Vetnosis STORM FORECASTS: 2014-2023
• Pet Supplies
• Vet Services
• Diagnostics
• OTC Health
• Nutrition
• Genetics
• Food Safety
• Herd Health
Management
• Diagnostics
~$24 Billion1
• Medicines
• Vaccines
• Medicated Feed Additives
• Parasiticides
~$24B GLOBAL ANIMAL HEALTH MARKET EXPECTED TO EXCEED $33B BY 20202
ANIMAL HEALTH

5
POWERFUL TRENDS CREATING DEMAND
POPULATION GROWTH
A GROWING MIDDLE CLASS
INCREASING URBANIZATION
PREDICTABLE, SUSTAINABLE AND FUNDAMENTAL ECONOMIC DRIVERS

6
LIMITS ON POPULATION & PRODUCTION DRIVE ANIMAL HEALTH SPEND PROTEIN NEEDS FUEL ANIMAL HEALTH
# OF ANIMALS1 PROTEIN
PRODUCTION1
ANIMAL HEALTH
Beef Cattle
1.4% 1.5% CAGR CAGR
Dairy Cattle
1.2% 1.8% CAGR CAGR
Pigs
1.3% 1.7% CAGR CAGR
Poultry
2.1% 2.5% CAGR CAGR
1-2% 2-3%
6%
TOTAL RANGE
PROJECTED GROWTH BY 2023
CAGR2
GLOBAL
LIVESTOCK
1 OECD-FAO Agricultural Outlook 2014-2023 2 Vetnosis STORM from 2013-2018
7
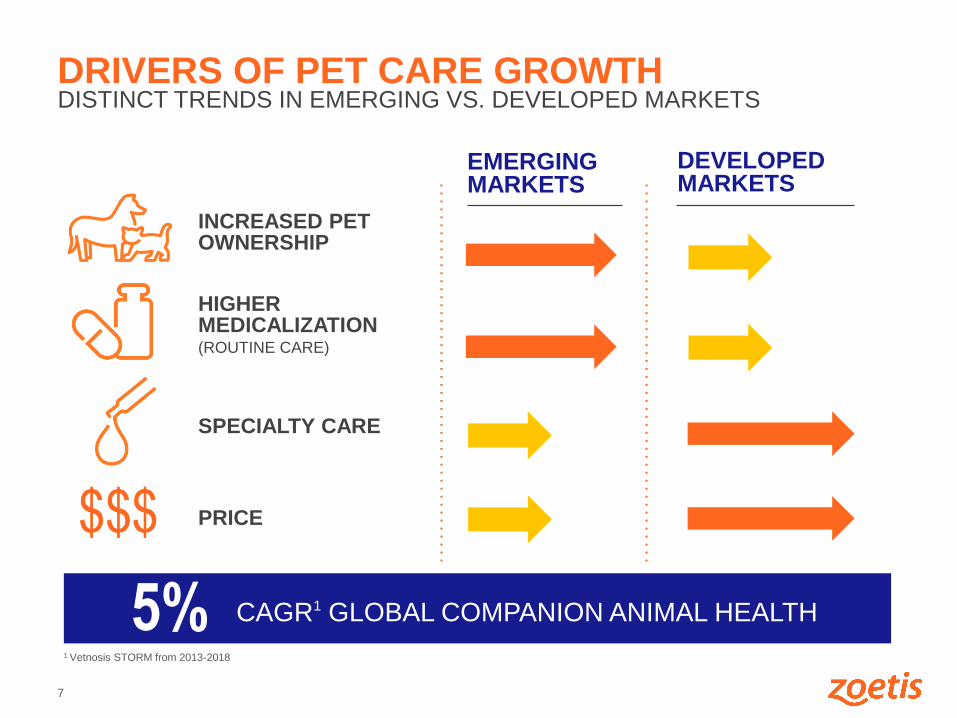
DRIVERS OF PET CARE GROWTH DISTINCT TRENDS IN EMERGING VS. DEVELOPED MARKETS
INCREASED PET OWNERSHIP
HIGHER MEDICALIZATION (ROUTINE CARE)
SPECIALTY CARE
PRICE
EMERGING MARKETS
DEVELOPED MARKETS
5%
CAGR1 GLOBAL COMPANION ANIMAL HEALTH
1 Vetnosis STORM from 2013-2018

8
RESILIENT INDUSTRY REVENUE GROWTH
2006 – 2014
Animal Health Industry
Revenue Growth
2009 Global Recession
Animal Health Industry
Revenue Growth
Low single digits1
(excl. currency)
1 Data calculated from IFAH Annual Report 2006 and Vetnosis Review 2014
5.1% CAGR1
PROTEIN IS A
DIETARY STAPLE
OWNERS PRIORITIZE
THEIR PET SPENDING

9
MARKET LEADERSHIP
AND COMPETITIVE
ADVANTAGES

10
2014 reported performance is the total sales revenue and growth reported by each AH company, which might include Non-Animal Health sales and merger/acquisition activity.
$4,785
$3,454
$2,754
$2,347
$1,748 $1,499
$1,174 $1,026 $1,016
$418
20
14
Re
po
rte
d S
ale
s (
US
$M
)
4.9%
2.7%
4.5%
9.1%
0.8% 5.5%
0.3% 4.9% 22.6%
5.1%
ZOETIS LEADS ANIMAL HEALTH INDUSTRY
Source: Vetnosis Executive’s Guide 2015
2014 AH REPORTED SALES AND % GROWTH (INCLUDING NON-AH SALES)

11
HIGH-QUALITY PRODUCTS DIRECT SALES INNOVATION
THREE INTERCONNECTED CAPABILITIES ESSENTIAL FOUNDATION FOR OUR SUCCESS IN ANIMAL HEALTH
12
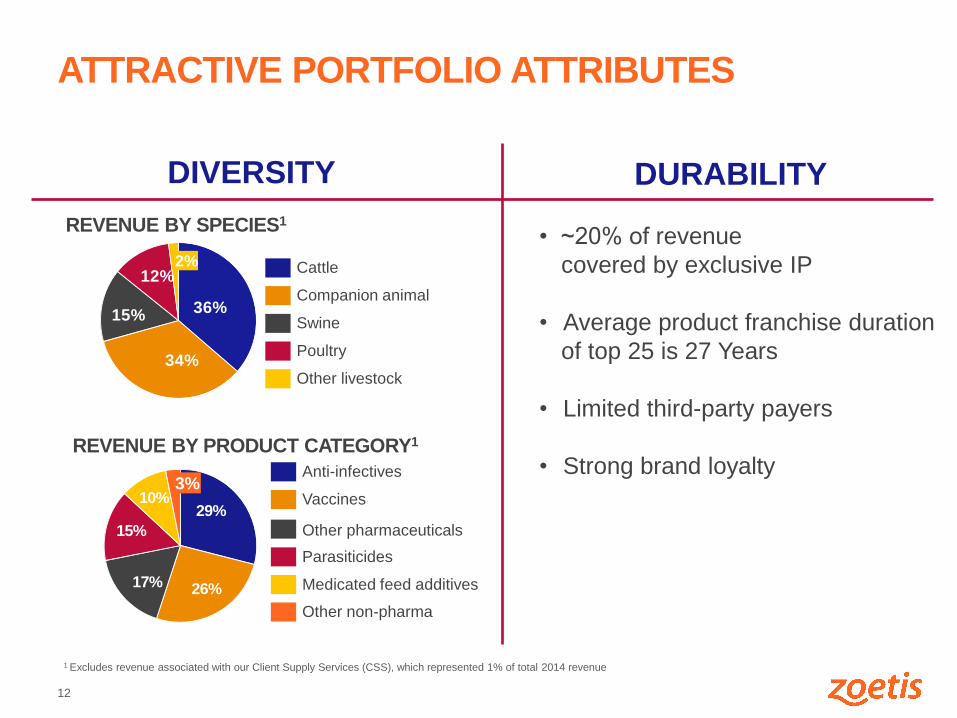
ATTRACTIVE PORTFOLIO ATTRIBUTES
1 Excludes revenue associated with our Client Supply Services (CSS), which represented 1% of total 2014 revenue
DIVERSITY DURABILITY
REVENUE BY SPECIES1
REVENUE BY PRODUCT CATEGORY1
36%
34%
15%
12%
Other livestock
Poultry
Swine
Companion animal
Cattle
29%
26%17%
15%
10%
Other non-pharma
Medicated feed additives
Parasiticides
Other pharmaceuticals
Vaccines
Anti-infectives
2%
3%
• ~20% of revenue
covered by exclusive IP
• Average product franchise duration
of top 25 is 27 Years
• Limited third-party payers
• Strong brand loyalty

13
CONSISTENT REVENUE PERFORMANCE
• We have delivered
consistent performance,
outpacing the industry
• 2014 revenue was $4.8
billion, a 7% increase on
an operational basis
ZTS Annual Revenue Operational
Growth Rates
* Also excludes the impact of incremental revenue from: the acquisition of King Animal Health, acquired by Pfizer on January 31, 2011; the acquisition of Fort
Dodge Animal Health (FDAH), acquired by Pfizer on October 15, 2009; and government–mandated divestitures of legacy FDAH and our legacy products in
connection with the FDAH acquisition
7% 7%
5%
7% 7%
THE RESULT OF OUR MARKET LEADERSHIP, PORTFOLIO, AND LEVERAGING OUR BUSINESS MODEL

14
TRACK RECORD OF
MARGIN EXPANSION

15
SUSTAINABLE MARGIN EXPANSION MARGIN IMPLICATIONS FROM OPERATIONAL EFFICIENCY INITIATIVE
$2,760
$3,582
$4,233 $4,336
$4,561
$4,785 $4,725
$4,725 $4,950
$189
$275
$503 $539
$709 $790
$828
$940
$1,130
Revenue Adjusted Net Income
Actuals Guidance1
• Grow Adjusted EBIT2
margin from 25% in
2014 to approximately
34% in 2017
• Will come from cost
savings of $300
million in 2017, more
than offsetting related
adjusted gross profit2
reduction of $100
million
1Guidance as of May 5, 2015. Revenue and Adjusted Net Income reflect midpoint guidance range. 2Adjusted net income and its components are defined as reported U.S. generally accepted accounting principles (GAAP) net income and its components excluding
purchase accounting adjustments, acquisition-related costs and certain significant items. Adjusted EBIT excludes interest expense net of capitalized interest and
adjusted income taxes.
2
22% 24% 25% 27% 31% 34% Adjusted
EBIT2
Margin 19% 14% 12%
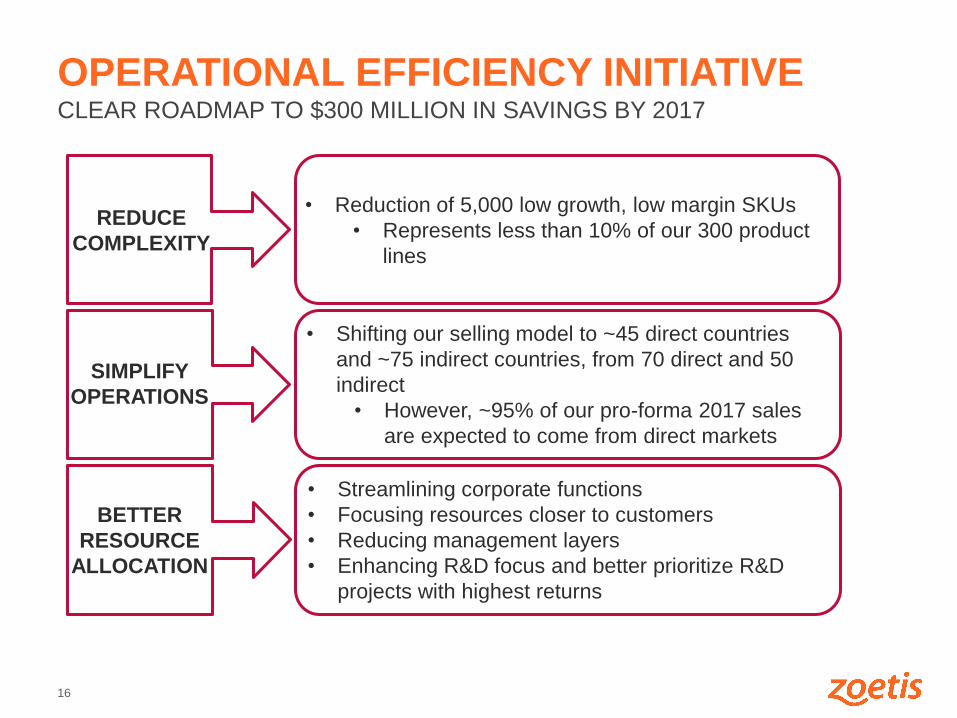
16
OPERATIONAL EFFICIENCY INITIATIVE CLEAR ROADMAP TO $300 MILLION IN SAVINGS BY 2017
REDUCE
COMPLEXITY
• Reduction of 5,000 low growth, low margin SKUs
• Represents less than 10% of our 300 product
lines
SIMPLIFY
OPERATIONS
• Shifting our selling model to ~45 direct countries
and ~75 indirect countries, from 70 direct and 50
indirect
• However, ~95% of our pro-forma 2017 sales
are expected to come from direct markets
BETTER
RESOURCE
ALLOCATION
• Streamlining corporate functions
• Focusing resources closer to customers
• Reducing management layers
• Enhancing R&D focus and better prioritize R&D
projects with highest returns

17
ADDITIONAL OPPORTUNITIES TO ENHANCE
VALUE
R&D
Productivity • 180 product approvals in
2014
• Sarolaner
• IL-31
Supply Network
Strategy • Simplification of internal
plant network
• 200 basis point
improvement to COGS
• Incremental to Operating
Efficiency Initiative
Business
Development • Strategic fit
• Clear synergies
• Financial value
• Anti-trust considerations

18
GROW REVENUE IN LINE WITH OR FASTER
THAN THE MARKET
GROW ADJUSTED NET INCOME1 FASTER
THAN REVENUE
TARGET VALUE-ADDED INVESTMENT
OPPORTUNITIES
CONSISTENT LONG-TERM VALUE PROPOSITION TO SHAREHOLDERS
RETURN EXCESS CAPITAL TO SHAREHOLDERS
1 Adjusted Net Income is a non-GAAP measure and defined as the corresponding reported U.S. generally accepted accounting principles (GAAP) income statement line item,
excluding purchase accounting adjustments, acquisition-related costs and certain significant items. The adjusted net income measure is not, and should not be viewed as, a
substitute for U.S. GAAP reported net income attributable to Zoetis.

APPENDIX

20 |
RECONCILIATION OF GAAP REPORTED TO NON-GAAP ADJUSTED INFORMATION 2015 – 2017 NET INCOME GUIDANCE
in USD millions GAAP Reported Purchase Accounting
Certain Significant
Items & Acquisition-
Related Costs
Non-GAAP
Adjusted1
Full-Year 2015 Net Income Guidance $400 - $515 $40 $290 – $370 $810 - $845
Full-Year 2016 Net Income Guidance $730 - $830 $40 $100 – $140 $910 - $970
Full-Year 2017 Net Income Guidance $995 - $1,085 $40 $40 – $60 $1,095 - $1,165
1 Adjusted Net Income is a non-GAAP measure and defined as the corresponding reported U.S. generally accepted accounting principles (GAAP) income
statement line item, excluding purchase accounting adjustments, acquisition-related costs and certain significant items. The adjusted net income measure
is not, and should not be viewed as, a substitute for U.S. GAAP reported net income attributable to Zoetis.

21 |
RECONCILIATION OF GAAP REPORTED TO NON-GAAP ADJUSTED INFORMATION 2014
in USD millions
GAAP
Reported
Purchase
Accounting
Acquisition
related costs
Certain
Significant
Items
Non-GAAP
Adjusted
Revenue $4,785 $0 $0 $0 $4,785
Cost of Sales 1,717 (4) 0 (33) 1,680
Gross Profit 3,068 4 0 33 3,105
Gross Profit as % of Revenue 64.1% 64.9%
Selling, general and administrative expenses 1,643 0 0 (136) 1,507
Research & Development Expenses 396 (2) 0 (1) 393
Amortization of intangible assets 60 (45) 0 0 15
Total Operating Expenses 2,099 (47) 0 (137) 1,915
Total Operating Expenses as % of Revenue 43.9% 40.0%
Restructuring charges and certain acquisition related costs 25 0 (8) (17) 0
Other (Income) / Expenses 7 0 0 (18) (11)
Income/(loss) before Interest and Taxes 937 51 8 205 1,201
Interest Expense 117 0 0 0 117
Income before provision for taxes on income 820 51 8 205 1,084
Provision for taxes on income 233 17 3 37 290
Income from continuing operations 587 34 5 168 794
Net income attributable to non-controlling interests 4 0 0 0 4
Net income attributable to Zoetis 583 34 5 168 790

22 |
RECONCILIATION OF GAAP REPORTED TO NON-GAAP ADJUSTED INFORMATION 2013
in USD millions
GAAP
Reported
Purchase
Accounting
Acquisition
related costs
Certain
Significant
Items
Non-GAAP
Adjusted
Revenue $4,561 $0 $0 $0 $4,561
Cost of Sales 1,669 (2) 0 (42) 1,625
Gross Profit 2,892 $2 0 $42 2,936
Gross Profit as % of Revenue 63.4% 64.4%
Selling, general and administrative expenses 1,613 1 0 (188) 1,426
Research & Development Expenses 399 (1) 0 (7) 391
Amortization of intangible assets 60 (46) 0 0 14
Total Operating Expenses 2,072 (46) 0 (195) 1,831
Total Operating Expenses as % of Revenue 45.4% 40.1%
Restructuring charges and certain acquisition related costs 26 0 (22) (4) 0
Other (Income) / Expenses (9) 0 0 1 (8)
Income/(loss) before Interest and Taxes 803 48 22 240 1,113
Interest Expense 113 0 0 0 113
Income before provision for taxes on income 690 48 22 240 1,000
Provision for taxes on income 187 16 8 81 292
Income from continuing operations 503 32 14 159 708
Net income attributable to non-controlling interests (1) 0 0 0 (1)
Net income attributable to Zoetis 504 32 14 159 709
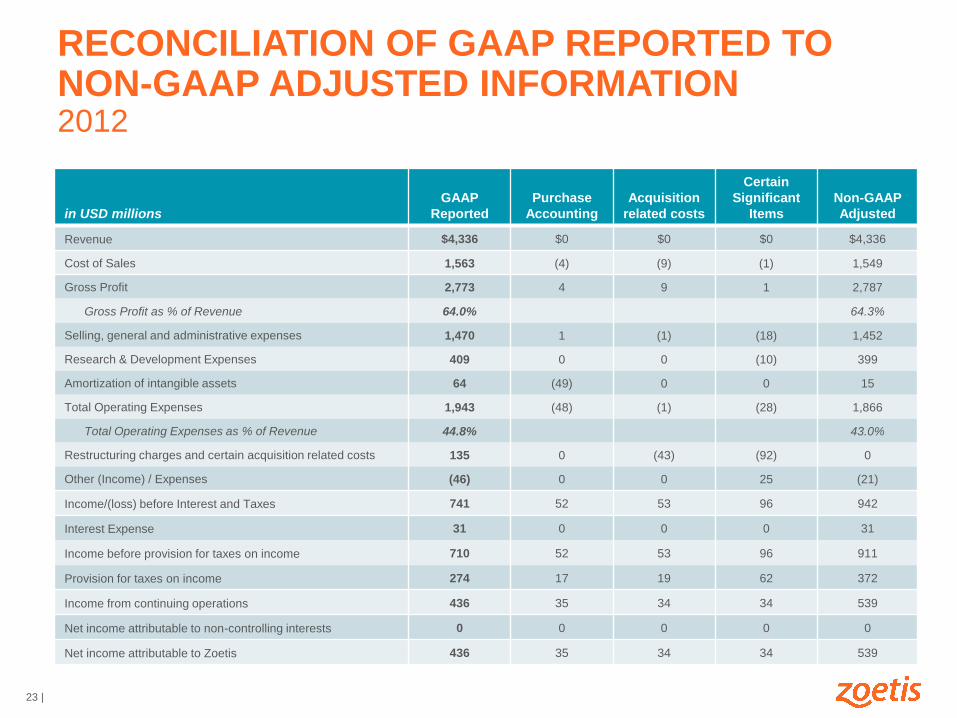
23 |
RECONCILIATION OF GAAP REPORTED TO NON-GAAP ADJUSTED INFORMATION 2012
in USD millions
GAAP
Reported
Purchase
Accounting
Acquisition
related costs
Certain
Significant
Items
Non-GAAP
Adjusted
Revenue $4,336 $0 $0 $0 $4,336
Cost of Sales 1,563 (4) (9) (1) 1,549
Gross Profit 2,773 4 9 1 2,787
Gross Profit as % of Revenue 64.0% 64.3%
Selling, general and administrative expenses 1,470 1 (1) (18) 1,452
Research & Development Expenses 409 0 0 (10) 399
Amortization of intangible assets 64 (49) 0 0 15
Total Operating Expenses 1,943 (48) (1) (28) 1,866
Total Operating Expenses as % of Revenue 44.8% 43.0%
Restructuring charges and certain acquisition related costs 135 0 (43) (92) 0
Other (Income) / Expenses (46) 0 0 25 (21)
Income/(loss) before Interest and Taxes 741 52 53 96 942
Interest Expense 31 0 0 0 31
Income before provision for taxes on income 710 52 53 96 911
Provision for taxes on income 274 17 19 62 372
Income from continuing operations 436 35 34 34 539
Net income attributable to non-controlling interests 0 0 0 0 0
Net income attributable to Zoetis 436 35 34 34 539

24 |
RECONCILIATION OF ADJUSTED NET INCOME TO ADJUSTED EBIT 2011 – 2014
in USD millions 2012 2013 2014
Adjusted Net Income1 $539 $709 $790
Interest Expense2 31 113 117
Interest Income2 (1) (3) (6)
Income Taxes2 372 292 290
Adjusted EBIT3 $941 $1,111 $1,191
% of revenue 21.7% 24.4% 24.9%
1 Adjusted Net Income is a non-GAAP measure and defined as the corresponding reported U.S. generally accepted accounting principles (GAAP) income
statement line item, excluding purchase accounting adjustments, acquisition-related costs and certain significant items. The adjusted net income measure
is not, and should not be viewed as, a substitute for U.S. GAAP reported net income attributable to Zoetis.
2 Interest Expense, Interest Income, and Income Taxes include charges as included in adjusted net income
3 Adjusted Earnings Before Interest and Taxes (EBIT) is calculated before the impact of purchase accounting adjustments, acquisition-
related costs and certain significant items and is a non-GAAP financial measure. Adjusted EBIT excludes interest expense net of capitalized interest and adjusted
income taxes.