Embed Size (px)
Citation preview

MASTER THESIS | L.C.M. VAN DER KEMP
‘It’s a cold hard world’
The subconscious influence of sensory metaphors on consumer
responses
Author: L.C.M. van der Kemp – S1504398
Subject: Master Thesis
Study: Master Communication Studies
Institution: University of Twente

MASTER THESIS | L.C.M. VAN DER KEMP
‘It’s a cold hard world’
The subconscious influence of sensory metaphors on consumer
responses
Master thesis submitted in partial fulfilment of the requirements for the degree of
Master of Science, University of Twente, Enschede, Communication Science.
Author:
L. C. M. van der Kemp
S1504398
Graduation Committee
Dr. T.L.J. Van Rompay
Dr. A. Fenko
Communication Studies – Marketing Communication
Faculty of Behavioural Sciences
University of Twente
Hengelo, December 2015

MASTER THESIS | L.C.M. VAN DER KEMP
Abstract
This study investigates the influence of sensory metaphorical associations of physical warmth
(warmth and coldness) and haptic experiences (softness and hardness), and their combination,
on consumer responses in a retail environment.
Sensory marketing, which is the base of sensory metaphors, is nowadays almost impossible to
imagine in stores: music is being played, scents linger in the air and specific light and colours are
used. The behaviour that retail stores want to engage by making use of sensory marketing is
purchase behaviour. The relatively young specific sub area of sensory marketing, ‘sensory
metaphors’, has shown that even subtle, incidental bodily experiences can unconsciously affect
thoughts, social perception, attitude, inference and judgement. The influence of various sensory
metaphors is already proven in social psychology research, however we believe that sensory
metaphors could influence consumer responses in a retail environment as well.
This study was conducted by means of a 2 (warm vs. cold) x 2 (soft vs. hard) between subjects
experiment. Several important concepts of consumer responses were measured, providing the
dependent variables: the ‘consumers’ general attitude towards the company’, the ‘consumers’
perception of the company’s social orientation’, and the ‘consumers’ purchase intention’. The
experiment was conducted at the University of Twente (N= 119). Warmth and coldness were
manipulated by drinks and hard and soft haptic experiences were manipulated by chairs. Their
subconscious influence on consumer responses was measured by means of a questionnaire
about the brochure of a fictitious green energy company.
When used separately, the warm drink revealed a significant positive influence on the
‘consumers’ general attitude’ and ‘perception of the company’s social orientation’. Furthermore
this study found that the soft chair had a positive influence on all three dependent variables. The
combination of the warm drink and soft chair on the ‘perception of the company’s social
orientation’ and ‘purchase intention’ interacted positively, but not on a significant level.
Additionally, a negative interaction effect occurred for the general attitude construct.
The results of this study indicate that retail owners should place soft chairs in their seating area
and offer warm drinks in order to create at least the best perception of the social orientation of
the company and the highest purchase intention.
Keywords: sensory marketing, grounded cognition, sensory metaphors, physical warmth, haptic
experiences, consumer responses

MASTER THESIS | L.C.M. VAN DER KEMP
Table of content
1. Introduction ............................................................................................................................................. 1
2. Theoretical framework ............................................................................................................................ 3
2.1 An introduction to sensory marketing ............................................................................................ 3
2.2 Grounded cognition – perception that affects cognition ................................................................ 3
2.3 Sensory metaphors and grounded cognition .................................................................................. 5
2.4 Consumer responses ....................................................................................................................... 6
2.5 Manipulating sensory metaphors ................................................................................................... 7
2.5.1 Warmth metaphors ................................................................................................................. 7
2.5.2 Haptic metaphors .................................................................................................................... 9
2.5.3 The connection between the variables; (dis)comfort ........................................................... 10
2.5.4 Effect size ............................................................................................................................... 11
2.6 Connecting the variables: a conceptualized research model ........................................................ 12
3. Methodology and data collection ......................................................................................................... 13
3.1 Participants .................................................................................................................................... 13
3.2 Stimuli ............................................................................................................................................ 14
3.2.1 Manipulated drink temperature ........................................................................................... 14
3.2.2 Manipulated hardness and softness ..................................................................................... 15
3.2.3 The brochure ......................................................................................................................... 15
3.2.4 Introduction ........................................................................................................................... 16
3.3 Measurements .............................................................................................................................. 16
3.3.1 Measurement of dependent variables .................................................................................. 16
3.3.2 Reliability of constructs ......................................................................................................... 18
3.4 Procedure .............................................................................................................................. 19
3.5 Data Analysis ......................................................................................................................... 19
4. Results ................................................................................................................................................... 20
4.1 Effects of physical warmth and haptic experiences on general attitude ...................................... 20
4.2 Effects of physical warmth and haptic experiences on the company’s social orientation ........... 21
4.3 Effects of physical warmth and haptic experiences on purchase intention ................................. 21
5. Conclusions and discussion ................................................................................................................... 23
5.1 Discussion ...................................................................................................................................... 23
5.2 Limitations and future research .................................................................................................... 25
5.3 Practical implications ..................................................................................................................... 27
5.4 Conclusion ..................................................................................................................................... 27

MASTER THESIS | L.C.M. VAN DER KEMP
References ................................................................................................................................................. 29
Appendix A. Stimulus Materials – Drinks and chairs ................................................................................. 33
Appendix B. Research materials - Brochure .............................................................................................. 34
Appendix C. Introduction of questionnaire ............................................................................................... 35
Appendix D. Research materials - Questionnaire...................................................................................... 36

MASTER THESIS | L.C.M. VAN DER KEMP
1
1. Introduction
In today’s stores consumers can get overwhelmed by manipulated sensory experiences. For
instance, music is being played, scents linger in the air and specific light and colours are used
with only one purpose: to trigger purchase behaviour. For example, the well-known brand
Abercrombie & Fitch sprays their own fragrances in their stores, which according to the
brand is congruent with their brand identity; a confident, bold and masculine attitude. The
company also applies loud club music throughout its stores. They argue that younger people
can withstand loud music longer, while older people may run from it, enabling the stores to
maintain a more youthful and a ‘fresher’ image. This form of marketing is called sensory
marketing and is defined as “marketing that engages the consumers' senses and affects their
behaviours” (Krishna 2012, p. 332).
Sensory marketing has drawn a lot of attention during the last decade. Retailers and
manufacturers recognized that multi-sensory brand experiences increase perceived product
value, induce shoppers to stay longer at a store and ultimately to spend more money
(Krishna, 2011). A specific sub area of sensory marketing that has become increasingly
popular nowadays is that of ‘sensory metaphors’. This relatively young research area shows
that even subtle, incidental bodily experiences can unconsciously affect thoughts, social
perception, attitude, inference and judgement. The power of sensory metaphors is
overwhelming: Williams and Bargh (2008) showed that when a subject held a warm drink
instead of a colder one, the subject perceived other people as more warm and caring. This
example shows that experiencing physical warmth subconsciously promotes interpersonal
warmth. Another study has shown that sitting on a soft chair during a sales pitch or
negotiation leads to earlier customer agreements. Furthermore, judges sitting on a hard
chair will impose higher punishments to criminals in a courtroom (Cherkasskiy, Song,
Malahy, & Bargh, 2012).
Since the majority of the sensory metaphor experiments had a social psychology purpose, it
would be interesting to examine whether sensory metaphors can also be applied to
consumer responses in shops and retail stores for marketing purposes. Therefore, the main
research question is: “To what extent do both physical warmth of a drink and the softness of
a chair subconsciously influence consumer responses?”.

MASTER THESIS | L.C.M. VAN DER KEMP
2
The objective of this study is to investigate the influence of the sensory metaphorical
associations of physical warmth (warmth and coldness) and haptic experiences (softness and
hardness), and their combination, on consumer responses in a retail environment. The
practical relevance of this study is to help retailers to enhance the customers’ attitude,
perceived social orientation and purchase intention as parts of consumer responses.

MASTER THESIS | L.C.M. VAN DER KEMP
3
2. Theoretical framework
Understanding the process of sensory metaphors on consumer behaviour starts with the
underlying processes of sensation, perception and grounded cognition: perception that
affects cognition. This paragraph will first clarify the basic concepts of sensory marketing and
will then go deeper into sensory metaphors. Thereafter, the independent and dependent
variables within this experiment will be clarified and hypotheses will be drawn.
2.1 An introduction to sensory marketing
The two main processes that underlie the way how we interpret the world around us are
sensation and perception. Sensation is the stimulation of the senses. Perception is the
process of acquiring, recording, interpreting, selecting and organizing sensory information
(Matlin, 1988). Thus at sensation, the senses react on the stimulation, whereas the
stimulation is interpreted by perception which results in an particular perceptual experience.
According to Krishna (2012), the understanding of perception is essential for sensory
marketing. She defines sensory marketing as “marketing that engages the consumers' senses
and affects their perception, judgment and behaviour” (p. 332).
Sensory marketing is a branch of marketing based on the relationship between the
consumers’ senses (vision, audition, smell, touch and taste) and their behaviour. Several
marketing channels make use of it, e.g. commercials and printed advertising. As mentioned
in the introduction, Abercrombie & Fitch make use of a sensory marketing strategy that
combines specific scents and music in their stores in order to sell more. Actually, almost
every retail store makes use of sensory marketing: specific music is played almost
everywhere. Other types of chains and companies also make use of it; from airlines to hotel
chains and from hospitals to restaurants. The Holiday Inn hotels chain for example uses
‘relaxed’ scents combined with suitable music to keep people in their rooms, lobbies and
bars longer.
2.2 Grounded cognition – perception that affects cognition
We know that the mind can control the body, but that it also occurs vice versa is relatively
new. According to the theory of grounded cognition by Barsalou (2008), all types of memory
are directly related to the senses. Thoughts, feelings, and behaviours are grounded in bodily

MASTER THESIS | L.C.M. VAN DER KEMP
4
interaction with the environment and cognitive activity is grounded in earlier sensory
experience. Barsalou argues that three components constitute grounded cognition, namely:
bodily states, situated actions and mental simulations. Various other scientists in marketing
and psychology research have supported the theory grounded cognition (Labroo & Nielsen,
2010; Mazar & Zhong, 2009; Williams & Bargh, 2008).
Bodily state refers to cognition that is affected by an unmoving physical condition that one is
in. In all these situations, one holds a particular posture which results in certain behaviours
and thought processes. For example, a study by Strack, Martin, & Stepper (1988) showed
that facial activity has affected the funniness ratings of cartoons, by having the subjects hold
a pen in in their mouths a particular way. The subjects’ smile muscles were stimulated by
holding a pen horizontally in the mouth. This example shows that earlier experiences with
smiling were grounded in thought, since smiling means liking, fun and pleasure. Another
example of the effect of bodily states on cognition is that when subjects wore heavy
backpacks, they judged hills as being steeper and distances as longer than when they did not
(Proffitt, Stefanucci, Banton, & Epstein, 2003). In these two examples, one holds a particular
bodily state which results in a certain perception that affects thoughts and behaviour.
Situated actions refer to cognition impacted by movements when some parts of the body
are moved, but not the whole body (as with bodily states). An example of a situated action
that affects cognition is provided by a study by Wells and Petty (1980). They showed that
vertical and horizontal head movements impacted agreement and disagreement by shaking
and nodding heads while listening to the content of a radio broadcast. This example shows
that earlier associations with head nodding and shaking has grounded in thought, since
nodding means disliking and shaking means liking. Another study that illustrates the impact
of situated actions on cognition was conducted by Cacioppo, Priester, and Berntson (1993).
The results of their experiment showed that Chinese ideographs were rated more positively
when participants flexed their arms during evaluation than when they extended their arms.
They argued that when grasping attractive objects, extending the arm is temporally strongly
associated with approach by acquiring or consumption of these objects. On the other hand,
flexing the arm resulted in avoidance. The reason behind the association between extending
the arm and approach on the one hand, and flexing the arm on the other hand is caused by

MASTER THESIS | L.C.M. VAN DER KEMP
5
lifelong experiences with such contingencies. These movements and their associations are
grounded in our cognition.
The third component of grounded cognition is ‘metal simulations’, which suggest that
mental imagery drives cognition. Several studies provided evidence for such mental
simulation, whereby imagening sensory perceptions lead to the activation of corresponding
regions of the brain. For example, a study by Zatorre and Halpern (2005) showed that
imagining to hear a lawn mower leads to the activation of the brains’ auditory cortex.
Additionally, reading words associated with strong smells like ‘vanilla’ or ‘anise’ activates the
brains’ olfactory cortex (González, et al., 2006) and viewing images of an apple pie activates
the brains’ taste cortices (Simmons, Martin, & Barsalou, 2005). Additionally, a study by Elder
and Krishna (2012) showed that different visual depictions of a product (e.g. in a web shop)
can result in less or more mental simulation of using the product which could affect the
purchase intention. For example, a spoon on the right of a soup bowl (versus left) results in a
higher mental simulation and purchase intention for right-handed people than for left-
handed people.
2.3 Sensory metaphors and grounded cognition
The way we think, what we experience and what we do every day is very much a matter of
metaphors. Embodied processes often play an important role within metaphors, where
abstract concepts are described by making use of concrete concepts derived from
perceptual experience (Lakoff, 1980). For example, a bad relationship is often described as a
distant one, whereas a good relationship is described as a ‘close’ one, because we are often
physically near people we like and physically distant from people we dislike. The
combination of bodily states and metaphors figures prominently in poems and songs, for
example “my heart goes boom” and “my feet of the ground”.
A popular specific sub area of sensory marketing based on grounded cognition is ‘sensory
metaphors’. Many studies have provided scientific evidence for the role of metaphors in
human thought. For example, the well-known idiom ‘something smells fishy’ is
metaphorically related to social suspiciousness. People use that metaphor when they
conclude that something feels wrong. Various studies by Lee and Schwarz's (2014) showed
that fishy smells can arouse social in people in a subconscious way. Another example of a

MASTER THESIS | L.C.M. VAN DER KEMP
6
sensory metaphor is verticality. Ostinelli, Luna, and Ringberg (2014) found that upward
movements have a positive effect on one’s self esteem, since upward movements make
people feel better about themselves. From earlier experiences, people have learned that
upward movements are positively related and downward movements are negatively related,
e.g., a thumb up is good and a thumb down is bad. When one is ‘down’, one is more inclined
to look down. Zhong and Liljenquist (2006) found that immoral thoughts increased the urge
of cleansing. They also showed that cleaning one's hands disabling guilt on subsequent
behaviour. Later studies found that the influence of physical cleansings is not limited to
obscene thoughts and behaviours; instead, physical cleansings seem to metaphorically
eliminate various traces from the past. An example of a well-known idiom related to
cleansing is: ‘wash hands of’, e.g. “I washed my hands of it long ago”.
2.4 Consumer responses
The abovementioned examples of sensory metaphors show that even subtle, incidental
physical experiences can unconsciously affect thoughts about metaphorically related targets.
The majority of the conducted sensory metaphor experiments are related to social
psychology, a branch of psychology that deals with social interactions on the individual level
(person to person). It would be interesting to examine whether these sensory metaphors
can also be applied to companies or retail stores. In today’s stores many (sensory) marketing
activities are already being applied: music is played, specific colors and light and sometimes
even scents are used. These sensations will create a certain perception of the environment
of the store. However, we believe that the perception of a store can be enhanced by making
use of sensory metaphors that affect the consumer responses in a subconscious manner.
In order to measure the effect of sensory metaphors on consumer responses, some basic but
important aspects of marketing communication research on consumer responses will have
to be measured. First, we want to examine whether the general attitude of the respondents
will be subconsciously influenced by the metaphorical association of sensory metaphors. The
‘general’ part of this ‘general attitude’ variable refers to the general properties of a company
that will be measured. Since ‘attitude’ is one of the most popular constructs in marketing
communication research, many measurements and scales are available to examine attitudes
(Olson, Zanna, & Mark, 1993). Additionally, we want to examine whether consumers can

MASTER THESIS | L.C.M. VAN DER KEMP
7
perceive a company or store as more social after being influenced by sensory metaphors.
Therefore, the second dependent variable in this experiment is the ‘consumers’ perception
of the company’s social orientation’, abbreviated to ‘company’s social orientation’. The third
and last dependent variable for this experiment is ‘consumer purchase intention’,
abbreviated to ‘purchase intention’. Purchase intention is a frequently used construct in
both consumer behaviour research and marketing research and can be described as an
individual’s conscious plan to make an effort to purchase something (Spears & Singh, 2004).
2.5 Manipulating sensory metaphors
In order to measure the effect of sensory metaphors on the dependent variables, two
sensory metaphors regarding warmth and haptics were selected. These sensory metaphors
were chosen for further examination since their power as sensory metaphors was proven by
other studies. This paragraph will further explain the power and associations of these
sensory metaphors.
2.5.1 Warmth metaphors
A common used metaphor in daily life is that of warmth and cold as a personality trait.
Perceiving someone as warm or cold entails a broad understanding that focuses on a certain
degree of socialilty. We describe people as warm when we perceive them as social, good-
natured, friendly, helpful and trustworthy, and on the other hand as cold when we perceive
them as unsocial, unfriendly, deceitful and unreliable (Rosenberg, Nelson, & Vivekananthan,
1968; Fiske, Cuddy, & Glick, 2008). The power of this metaphor is also demonstrated as a
sensory metaphor by Williams and Bargh (2008). Subjects of their experiment briefly held
either a cup of hot coffee or a cup of iced coffee after which they had to fill in a personality
impression questionnaire. As a result, the subjects who held the warm cup of coffee had a
higher perceived social warmth in other people than the subjects who held the iced coffee.
Another study by Williams and Bargh (2008) concluded that when holding a warm object
instead of a colder one, people will behave in a more socially warm and caring way, for
example by rather choosing a gift for their friends than for themselves. The subjects who
held a cold object were more greedy and in 75% of the cases they chose a gift for
themselves.

MASTER THESIS | L.C.M. VAN DER KEMP
8
The abovementioned studies showed that incidental experiences with physical warmth
turned into social warmth which influences judgments and behaviour toward other people
without one being aware of this influence. How could warm objects produce the same
affective states as a ‘warm’ person? According to Asch (1946), the affective responses are
grounded together in memory and most abstract concepts in psychology are metaphorically
based on concrete physical experiences. The insular cortex is implicated in processing both
the physical and the psychological versions of warmth information in a subconscious
manner. As a result, the feelings of warmth when one holds a hot cup of coffee or takes a
warm bath might activate memories of other feelings associated with warmth (trust and
comfort), because of earlier experiences with caretakers who provided warmth, shelter,
safety, and nourishment. Because of these frequent early life experiences with the
trustworthy caregiver, a close mental association usually develops between the concepts of
physical warmth and psychological warmth.
While experiencing physical warmth makes one more social, physical coldness increases the
longing for sociality. A study on social warmth that highlights the bidirectional relationship
between physical and social warmth was conducted by Zhong and Leonardelli (2008). They
showed that participants experience a room as physically colder after having been socially
rejected. Another study reported that consumers perceived the ambient temperature to be
cooler when eating alone than when eating with a partner (Lee, Rotman, & Perkins, 2014).
Zwebner, Lee, and Goldenberg (2014) studied whether the association of physical and socio-
emotional warmth also extends to products. They found that higher ambient temperatures
are associated with more positive affective responses and lower perceived distance to the
target product, resulting in increased product valuation.
Based on the abovementioned studies and the positive metaphorical associations of
warmth, we expect that consumer responses will also be influenced by experiencing physical
warmth. Therefore we expect that:
H1a. Holding a warm drink has a significant positive effect on ‘general attitude’.
H1b. Holding a warm drink has a significant positive effect on ‘company’s social orientation’.
H1c. Holding a warm drink has a significant positive effect on ‘purchase intention’

MASTER THESIS | L.C.M. VAN DER KEMP
9
2.5.2 Haptic metaphors
Common touch-related metaphors are also frequently used in daily life, e.g. “it was a rough
day”, “thinking about weighty matters” and “she’s my rock”. According to Ackerman, Nocera
and Bargh (2010) are these metaphors also powerful as sensory metaphors. They found that
heavy vs. light clipboards made job candidates appear more important. The metaphorical
association of heaviness and lightness is ‘importance’, which implicates the heavier, the
more important something is (Jostmann, Lakens, Schubert, 2009). Another study by
Ackerman et al. (2010) found that that touching a rough vs. a smooth object made social
interactions more difficult. They argued that the experience of roughness and smoothness is
metaphorically associated with concepts of difficulty and harshness. They also showed that
sensory metaphors regarding to hardness and softness subconsciously affect one’s
judgment. In daily life, we describe someone as soft when we perceive him or her as
vulnerable, emotional, empathetic and sensitive, and we describe someone as hard when
we perceive him or her as invulnerable, unemotional, non-empathetic, rigid and insensitive.
In the experiment of Ackerman et al. (2010), participants either touched a soft blanket or a
hard block of wood. The participants who touched the hard block of wood judged someone
as more rigid and strict than participants who touched the soft blanket. Haptic experiences
with respect to hardness and softness are metaphorically associated with (cognitive)
flexibility, including stability, rigidity and strictness.
The abovementioned studies showed that experiences that are metaphorically related to
haptics subconsciously influence social impression and decision making. The question that
arises is how such basic haptic experiences concerning weight, texture and hardness,
influence our cognitive processing. According to Barsalou (2003) and Mandler (1992) are
sensory experiences stored in our mind since infancy which provides the basis of the
development of complex concepts, also known as conceptual knowledge. When touching
something hard, the brain activates the grounded conceptual knowledge related to
hardness. This conceptual knowledge can also be related to a metaphor, e.g. feeling a rough
stone makes us sensitive to rough textures and may also activate metaphorical roughness.
According to Ackerman et al. (2010), haptic experiences with hardness subconsciously produce
perceptions of strictness, rigidity, stability and reduce change from one’s initial decisions. In
their experiment the participants sat in either a hard wooden chair or a soft cushioned chair
while imagining shopping for a new car. They had to make an offer to the dealer which was

MASTER THESIS | L.C.M. VAN DER KEMP
10
subsequently rejected. Then the participants had to make a second offer. As predicted, the
participants who sat in hard chairs judged the employee to be both more stable and less
emotional. Furthermore, the hard chair indeed produced less change in offer price than soft
cushioned chairs did. Therefore, sitting on a hard chair increases rigidity in bargaining, and
on the other hand, sitting on a soft chair leads to quicker agreement in bargaining. Based on
these results we can assume that the participants in the hard chair have literally more hard
which was expressed in being more strict and less flexible than and the participants on the
soft cushioned chair. Another study among the impact of haptic metaphors was conducted
by Cherkasskiy, Song, Malahy, & Bargh (2012). They proved that courts impose higher
punishments to suspects when sitting on a hard chair than when sitting on a soft chair. Also
for this experiment we can assume that the courts have become literally harder which was
expressed in being more stable, strict and less flexible.
Based on the abovementioned studies and the metaphorical associations of hardness and
softness, we expect that consumer responses will also be influenced by haptic experiences
regarding to hardness and softness. The metaphorical associations with hardness and
softness are less related to social concepts (general attitude and company’s social
orientation), but we expect that the soft chair condition will still have a positive influence on
the general attitude and company’s social orientation compared to the hard chair condition.
We therefore expect that:
H2a. Sitting on a soft chair has a significant positive effect on ‘general attitude’.
H2b. Sitting in a soft chair has a significant positive effect on ‘company’s social orientation’.
H2c. Sitting on a soft chair has a significant positive effect on ‘purchase intention’.
2.5.3 The connection between the variables; (dis)comfort
Both independent variables within this research are linked to each other, because people
use both ‘hard’ and ‘cold’ to explain discomfort, and ‘soft’ and ‘warm’ to explain comfort. An
example of a frequently used statement is: "It is a cold hard world”. This statement clarifies
the negative charge of ‘cold’ and ‘hard’ (Melnick, 1999). The reason why we typically pair
‘cold’ with ‘hard’ and ‘warm’ with ‘soft’, is that associations with ‘cold’ and ‘hard’ are neither
pleasant nor positive. A ‘warm soft mommy’ is a frequently used association for a caring
mother. This example clarifies the pleasant and positive association with ‘warm’ and ‘soft’.

MASTER THESIS | L.C.M. VAN DER KEMP
11
Apart from the two main effects described above, an interaction effect might occur. When
combining both independent variables, ‘physical warmth’ and ‘haptic experience’, with the
dependent variables, we expect that the most ‘positive’ condition (warm and soft) will lead
to the most positive influence on all these variables. We can maintain that, in general, the
positively associated conditions (warm and soft) will automatically lead to a higher mean
score on all constructs compared to the negatively associated conditions (cold and hard). We
expect a significant positive interaction between the warm and soft condition on all three dependent
variables. We therefore expect that:
H3a. Holding a warm drink and sitting on a soft chair has a significant positive effect on
‘general attitude’.
H3b. Holding a warm drink and sitting on a soft chair have a significant positive effect on
‘company’s social orientation’.
H3c. Holding a warm drink and sitting on a soft chair have a significant positive effect on
‘purchase intention’.
2.5.4 Effect size
Apart from the positive and negative associations of the independent variables, we expect a
distinction in the subconscious influence between the constructs regarding to their different
metaphorical associations. Since warmth and coldness are mostly metaphorically associated
with sociality, trustworthiness, helpfulness and friendliness, we expect that the subconscious
influence of the temperature of the drink will be dominant over the type of chair for the
‘company’s social orientation’ and ‘general attitude’ constructs. Conversely, because the
metaphorical associations with haptic experience are more related to (cognitive) flexibility,
stability, rigidity and strictness, we expect that the subconscious influence of the type of
chair will be dominant over the temperature of the drink for the ‘purchase intention’
construct. We therefore expect that:
H4a. The warm drink is a better predictor of the ‘general attitude’ than the soft chair
H4b. The warm drink is a better predictor of the ‘company’s social orientation’ than the soft
chair.
H5. The warm drink is a poorer predictor of the ‘purchase intention’ than the soft chair.

MASTER THESIS | L.C.M. VAN DER KEMP
12
2.6 Connecting the variables: a conceptualized research model
This study aims to identify the subconscious influence of the metaphorical associations of
physical warmth and haptic experience on the participants’ ‘general attitude towards a
company’, ‘perception of the company’s social orientation’ and ‘purchase intention’. The
focus is on whether the manipulated independent variables will result in a different mean
score on the dependent variables. Figure 1 provides an overview of the dependent and
independent variables for the experiment.
Figure 1. Conceptualized research model including independent and dependent variables within a 2x2 between
subjects design.
IV
Physical warmth
Hot vs. cold drink
IV
Haptic experiences
Soft vs. hard chair
DV
Company’s social
orientation
DV General attitude
DV
Purchase
intention

MASTER THESIS | L.C.M. VAN DER KEMP
13
3. Methodology and data collection
As mentioned in the theoretical framework, a 2 (cold drink vs. warm drink) x 2 (hard chair vs.
soft chair) between subjects design was used for the experiment. The experiment was
conducted as a quantitative field experiment at the University of Twente. This section will
further explain the sampling procedure and study design, followed by the clarification of the
manipulated stimuli. Finally, this section will clarify the validity and reliability of the
measures.
3.1 Participants
Since the experiment was conducted at the University of Twente, most of the participants
had an academic background. There was however no restriction in educational background
or age. The only requirement for the participants was to understand the Dutch language,
since the brochure and questionnaire were set up in Dutch. The aim was to gather at least
20 questionnaires for each experimental condition, thus 80 respondents in total, in order to
conduct a reliable experiment. Eventually 119 respondents (62% female, 38% male)
participated in the experiment. As can be seen in Table 1, the participants were almost
equally distributed over the conditions, even as their mean ages. All participants participated
voluntarily in the experiment and completed the questionnaire by answering all questions.
The respondents’ age (n = 119) varied from 18 to 41 years, with an average age of 22.4 (SD =
2.97).
Table 1. Participants Characteristics per Experimental Conditions
Condition:
Cold drink Hard chair
Cold drink Soft chair
Warm drink Hard chair
Warm drink Soft chair
Date of experiment 10-06-15 08-06-15 01-06-15 04-06-15 N 29 31 29 30 Mean age 21.93 21.90 22.41 23.27 Gender % Male Female
31 69
38.7 61.3
34.5 65.5
46.7 55.3
The subjects of the experiment had to fill in a questionnaire about a brochure of the
fictitious green energy company ‘The Green Energy Company’. During the experiment
participants were sitting on a hard wooden chair or a soft office chair, and drinking cold or
warm tea. Every participant was presented with the same brochure and questionnaire about

MASTER THESIS | L.C.M. VAN DER KEMP
14
‘The Green Energy Company’. In order to prevent that the participants would be aware of
the manipulated conditions, four different days were scheduled for conducting the
experiment. Every day had another combination of manipulated variables. Table 1 provides
an overview of the different experiment dates, including the distribution of participants over
the conditions with the mean age and gender percentage.
3.2 Stimuli
In order to conduct a successful, valid and reliable experiment, the purpose of the
experiment had to be unclear to the respondents. The manipulated stimuli were well
considered before conducting the experiment. Consequently, two small pre-tests were
conducted prior to the experiment. This paragraph will further explain why and how the
stimulus materials were chosen and manipulated.
3.2.1 Manipulated drink temperature
Warm and cold drinks were used in order to control the manipulated variable of physical
warmth. The drink itself (e.g. the taste) does not have anything to do with the purpose of the
experiment, since the focus of the experiment is on the warmth or cold that the drink
transmits to the participants. Therefore, the temperature of the drink is the only
manipulated factor in both the warm and cold condition.
In order to find a drink that has the same properties when being warm and cold, a small pre-
test was conducted with 4 people at the researchers’ home. Both warm and cold drinks were
tasted and evaluated on similarities in flavour, colour and substance. After having tasted
various drinks with a warm and cold temperature, hot tea and ice tea were chosen as the
best drinks for both conditions. The only difference between the drinks was the sweetness
between the warm tea and ice tea, since ice tea contains added sugars and regular tea made
from a teabag does not. This issue was solved by adding two teaspoons of sugar per can of
hot tea. Images of the used drinks can be found in appendix D.
In order to measure the effects of physical warmth, the temperature differences between
the drinks were to be as large as possible. It was important that the tea was drinkable from
the start of the experiment, to prevent that subjects would not drink the tea at all. The warm
tea had a temperature of approximately 55 degrees Celsius and the ice tea had a
temperature of approximately 6 degrees Celsius. In order to reach those temperatures,

MASTER THESIS | L.C.M. VAN DER KEMP
15
water was boiled for the warm tea and ice cubes were added to the ice tea to cool the drink.
To regulate the temperature of the drinks, a thermos flask and thermometer were used for
both drinks to keep them at approximately 55 degrees and 6 degrees Celsius. The cups used
for the experiment were simple white plastic disposable cups, which are hygienic and easy to
use. These cups were good temperature conductors, which is important since physical
warmth was the manipulated factor in this experiment.
3.2.2 Manipulated hardness and softness
Within this experiment one hard chair and one soft chair were used to measure the
subconscious effects of the metaphorical associations of hardness and softness. The hard
chair was to be as hard as possible and the soft chair as soft as possible. In order to find two
suitable chairs, a small pre-test was conducted with 3 students of the University of Twente.
Both hard chairs and soft chairs were tested and evaluated and the subjects had to keep in
mind that apart from the hardness or softness, all other dimensions were to be as much as
similar to each other.
The height and depth of the chairs were measured and compared. The hard seats had no
ability to adjust the height or seat of the chair, while the softer chairs had. It was therefore
possible to adjust the soft seat to the dimensions of the hard seat. After testing the chairs,
two chairs were selected, being a soft office chair without arm rests and a hard wooden
chair without arm rests. Images of the used chairs can be found in appendix A.
3.2.3 The brochure
A brochure of the fictitious green energy company ‘The Green Energy Company’ was
composed in order to measure the subconscious influence of metaphorical associations on
the dependent variables. An image of the brochure can be found in appendix B. From this
brochure, the participants had to gain all the information about the company. The main
reason for using a fictitious company is that the participants would not have an opinion
about the company in advance. A benefit for choosing a green energy company is the ability
to scale items related to all three constructs.
For the brochure’s lay out, information was retrieved from other Dutch green energy
companies such as Windunie, Huismerk Energie, Raedthuys Pure Energie, Qurrent and

MASTER THESIS | L.C.M. VAN DER KEMP
16
Greenchoice (Wise, 2014). The brochures of these companies often contained information
about the company and how they produce and deliver their green energy.
3.2.4 Introduction
Before the participants started with the actual experiment, a short introduction was
attached to the questionnaire. Hereby participants were informed about what was expected
from them during the experiment, being providing their attitude to a green drink and a
green energy company. An emphasis was made on that the experiment was actually a small
pre-test. By framing the experiment as a small pre-test, participants would be more easy
going, less critical and purely relying on their sense, without difficulties coming to mind.
Since the participants were all recruited on the University of Twente, it is very likely that
they would have been extra critical when the actual goal of the experiment would have been
mentioned. The introduction that was attached to the questionnaire can be found in
appendix C.
3.3 Measurements
After the participants had read the introduction they could start answering the
questionnaire, by which the dependent variables were measured. In order to measure the
three dependent variables, three different constructs were established with each different
items. In this paragraph, the method of measurement for each dependent variable as well as
the reliability of the used constructs will be further explained.
3.3.1 Measurement of dependent variables
First the respondents had to supply demographic information, consisting of age and gender.
Items on the topic of the drink were included in order to be sure that participants had a
physical experience with warmth or coldness before judging ‘The Green Energy Company’.
This was important since the purpose of offering a drink was to conduct physical warmth or
coldness. The items of the drink, measured on a 7-point-likert-scale, were specifically about
taste and purchase intention. However, in the end, the results of the drink do not count for
the experiment. They functioned as an unobtrusive manner to let the participants
experience physical warmth or coldness before judging ‘The Green Energy Company’. The
reason for using multiple items about the drink is to prevent raising suspicion among the
subjects regarding the research goals. If the drink itself would only have been covered by
one question, the subjects might have concluded that the drink was not of interest to the

MASTER THESIS | L.C.M. VAN DER KEMP
17
researchers, and found out the actual research goals. This could have influenced the
subjects’ answers to the items and thereby the results from the field study.
After the items about the drink, the participants were presented with the items about the
‘general attitude’ construct. Since measuring a complete attitude is far too extensive, only
eight basic attitude-related items were measured. For the creation of the ‘general attitude’
construct, much inspiration has been gained from earlier studies by Mc. Croskey and
Richmond (1989) and Spears and Singh (2004). The items were measured on an eight-item
semantic differential scale (Snider & Osgood, 1969). Example answers for the eight-item
semantic differential scale are: bad / good, convincing / not convincing, not credible /
credible. Today, semantic differential scales are one of the most widely applied scales for the
measurement of attitudes. The bipolar adjective pairs can be used for a wide variety of
subjects (Himmelfarb, 1993).
Seven items regarding the social orientation construct were asked on a 7-point-likert-scale.
This construct was aimed at the social aspects of the company, including customer service,
reliability and commitment. The items used in the questionnaire were based on statements
from a previous study by Gummesson (2005), in which a sample of 1.000 consumers had to
answer, in five to ten words, what first came to mind when thinking of the most important
brand aspects. The study identified the most important consumer-based dimensions of
brands for the U.S. population, divided in: perceived quality, perceived value, brand loyalty,
and sustainability. The social orientation construct contained items regarding the social
aspects of the consumer-based dimensions, hence the name ‘company’s social orientation’.
The construct contained five positively worded items and two negatively worded items. It is
known that varying the direction of questioning minimizes bias produced by the respondents
(Spector, 1992). Examples of used statements are: TGEC seems like a customer-friendly
energy company to me and TGEC seems like a compassionate energy company to me. The
used 7-point-likert-scale ranged from 1=completely disagree to 7=completely agree. It is
known that Likert-scales are especially useful when measuring characteristics of people such
as attitudes, feelings and opinions, and therefore as well for the sociality related consumer-
based dimensions (Likert, 1932).

MASTER THESIS | L.C.M. VAN DER KEMP
18
Finally, another seven items on a 7-point-likert-scale were asked in order to measure the
construct ‘purchase intention’. This experiment is not aimed at measuring a complete
purchase intention as this would create the need to include other dependent variables,
which would make this research too extensive. The construct is adapted and limited to the
circumstances of the experiment and the corresponding opportunities. An example of a
consecutive limitation is therefore that the setup of the experiment does not concern the
existence of a need for a (new) green energy company among the participants. It also does
not provide room for comparing alternatives. The ‘purchase intention’ construct focusses on
the amount of flexibility and compliance of the participants as the result of the metaphorical
associations of the independent variables. The main question is whether participants in the
‘soft chair’ condition will comply faster than respondents in the ‘hard chair’ condition.
Therefore, the items included for this construct are about the willingness to receive
additional information about the company and the compliance regarding listening to the
company’s call centre staff and door to door sales persons. In other words, it is about the
interest in the company and her service(s). A few examples of the used statements are: I
would consider to receive additional information about TGEC at home and I would consider
to switch to TGEC on a short-term, via the free transfer service where they terminate my
current contract. The statements were based on previous research by the world's leading
consumer behaviourists: Dodds, Monroe, and Grewal (1991), Grewal, Monroe and Krishnan
(1998) and Hardesty, Carlson, and Bearden (2002). The scale of the measured items was
ranging from 1=completely disagree to 7=completely agree (Spector, 1992). The
questionnaire can be found in appendix D.
3.3.2 Reliability of constructs
After entering the data in the Statistical Program for Social Sciences (SPSS), the two
negatively worded items were recoded to be able to measure the internal consistency or
reliability of the constructs. As part of the internal consistency calculations a Cronbach’s
Alpha was calculated for the three constructs, being ‘general attitude’ (α= .94), ‘company’s
social orientation’ (α= .88) and ‘purchase intention’ (α= .88). Table 2 provides an overview of
the reliability of the constructs. According to Nunnally (1978), a constructs’ Cronbach’s Alpha
should be at least .70 to achieve a reliable scale. Based on the values of the Cronbach’s
Alpha we can therefore conclude that all three constructs have a reliable scale.

MASTER THESIS | L.C.M. VAN DER KEMP
19
3.4 Procedure
The participants were selected by the researcher at the University of Twente. The subjects
were asked whether they wanted to participate in a small pre-test experiment about green
products which would take only 5 minutes. Subjects who were willing to fill in the
questionnaire were guided to Cubicus room C227 at the University of Twente. The
participants were instructed to first read the introduction attached to the questionnaire.
Thereafter they could start filling in the questionnaire. The first items were about the drink,
therefore the participants were instructed to taste the drink before filling in the items. After
the participants filled in the questionnaire, the researcher asked them for their opinion
about the experiment.
3.5 Data Analysis
Two-way ANOVAs were performed with physical warmth and haptic experiences as
independent variables and the ‘general attitude’, ‘company’s social orientation’, and
‘consumers’ purchase intention’ as dependent variables. Individual characteristics of
respondents (age and gender) were considered as possible moderators. Bonferroni post-hoc
analyses were performed to test the significance differences between the means and the
effect size of the independent variables on the dependent variables.

MASTER THESIS | L.C.M. VAN DER KEMP
20
4. Results
In order to examine whether the conditions over the four groups were equally distributed,
an ANOVA was conducted on age and gender. The ANOVA on age reveals no significant
differences between the four groups (F (3, 115) = 1.392, p = .249). The ANOVA on gender
also reveals no significant differences between the groups (F (3, 115) = .560, p = .642).
Therefore we can conclude that both age and gender can be excluded as possible
moderators within this experiment.
In order to examine whether the two drinks had the same taste, an ANOVA was conducted
on the different items about the drink. Only the perceived freshness was significantly
different for the drinks, which is an expected finding. Actually, the perceived freshness
discrepancy between the drinks is good since the temperature was to be the only noticeable
manipulation.
4.1 Effects of physical warmth and haptic experiences on general attitude
A two-way ANOVA was conducted with physical warmth and haptic experience as the main
factors and general attitude as the dependent variable. Figure 2 provides an overview of the
‘general attitude’ results for both independent variables.
Figure 2. An overview of the subconscious influence of type of drink and type of chair on general attitude.
The results show a significant main effect for the type of drink on general attitude (F (1, 115)
= 96.04, p < .001, partial η2 =.46). The participants who drank the hot tea scored significantly
1
2
3
4
5
6
7
Cold drink Warm drink
Ge
ne
ral a
ttit
ud
e
Type of drink
Hard chair
Soft chair
Type of chair

MASTER THESIS | L.C.M. VAN DER KEMP
21
higher on the variable ‘general attitude’ (M = 4.50, SD = .82) than participants who drank the
ice tea (M = 3.08, SD =.98). In addition, the main effect for the type of chair on attitude is
also significant (F (1, 115) = 6.92, p = .01, partial η2 =.02). The participants who were sitting
on the soft chair scored significantly higher on the variable ‘general attitude’ (M = 3.90, SD =
1.15) than the participants who were sitting on the hard chair (M = 3.68, SD = .90). The
results also indicate a significant negative interaction effect between the type of drink and
type of chair on the attitude towards ‘The Green Energy Company’ (F (1, 115) = 31.28, p
<.001, partial η2 =.21). As can be seen in figure 2, the participants who drank the hot tea
while they sat on the hard chair scored significantly higher than the participants in the other
conditions.
4.2 Effects of physical warmth and haptic experiences on the company’s social
orientation
A two-way ANOVA was conducted with physical warmth and haptic experience as the main
factors and the company’s social orientation as the dependent variable. The results show a
significant main effect for the type of drink on the ‘company’s social orientation’ (F (1, 115) =
21.33, p < .001, partial η2 =.16). This means that participants who drank the hot tea scored
significantly higher on the ‘company’s social orientation’ (M = 5.22, SD = .76) than the
participants who drank the ice tea (M = 4.64, SD = .66). Another main effect occurs for the
type of chair on the ‘company’s social orientation’ (F (1, 115) = 7.26, p = .008, partial η2
=.06). This result indicates that the participants who sat on the soft chair scored significantly
higher on the ‘company’s social orientation’ (M = 5.09, SD = .58), than the participants who
sat on the hard chair (M = 4.75, SD = .90). No interaction effect is found between the type of
drink and type of chair on the ‘company’s social orientation’ (F (1, 115) = .06, p = .82, partial
η2 =.00).
4.3 Effects of physical warmth and haptic experiences on purchase intention
A two-way ANOVA was conducted with physical warmth and haptic experience as the main
factors and purchase intention as the dependent variable. The results show that the
participants who drank the hot tea (M = 3.44, SD = .11) scored higher on purchase intention
than the participants who drank the ice tea (M = 3.32, SD = .11). However, this result was not
significant (F (1, 115) = .60, p = .44, partial η2 =.01). The ANOVA shows a main effect for the

MASTER THESIS | L.C.M. VAN DER KEMP
22
type of chair on purchase intention (F (1, 115) = 4.95, p = .03, partial η2 =.04). This result
indicates that participants who sat on the soft chair scored significantly higher on purchase
intention (M = 3.55, SD = .81) than participants who sat on the hard chair (M = 3.21, SD =
.85). No interaction effect is found between the type of drink and type of chair on the
purchase intention (F (1,115 ) = .02, p = .90, partial η2 =.00).

MASTER THESIS | L.C.M. VAN DER KEMP
23
5. Conclusions and discussion
The aim of this experiment was to find out whether sensory metaphors regarding physical
warmth and haptic experiences could be used to enhance consumer responses in a retail
environment. The main research question was: “To what extent do both physical warmth of
a drink and the softness of a chair subconsciously influence consumer responses?”. The
consumer responses were measured by three constructs, namely: the general attitude, the
company’s social orientation and purchase intention. We both found interesting results that
are in line with the proposed hypotheses, as well as interesting results we did not expect.
5.1 Discussion
We found that the warm drink was more effective in enhancing the participants’ general
attitude and company’s social orientation than the cold drink. These results confirm
hypotheses 1a and 1b. The warm drink was more effective in enhancing the participants’
purchase intention than the cold drink, however it was not significant. Hypothesis 1c can
therefore not be confirmed. A possible explanation for this result could be that the purchase
intention construct contains less socially loaded items than the other two constructs, for
which a main effect did occur. This has probably led to a significant main effect of warmth on
the more social related constructs, but no significant influence on the participants’ purchase
intention. Additionally we found that the soft chair was more effective in enhancing all three
dependent variables than the hard chair. Therefore we can conclude that hypotheses 2a, 2b
and 2c are confirmed by the results.
Due to the high level of comfort and positive metaphorical associations of the warm (drink)
and soft (chair) condition, we expected a positive interaction effect for all three dependent
variables. However, the results did not show a significant positive interaction effect for the
company’s social orientation and purchase intention constructs. In addition, against all
expectations, a negative interaction effect occurred for the general attitude construct. This
result showed that the hard chair and warm drink condition caused the most positive
general attitude of the participants, which contradicts hypothesis 3a. A possible explanation
of this result could be the occurrence of a ‘contrast effect’ between the independent
variables on the general attitude construct. As a result of the contrast effect, the participants
who sat on the hard chair felt the hardness very good, and therefore the warm tea had an

MASTER THESIS | L.C.M. VAN DER KEMP
24
extra influence which resulted in the highest general attitude for these participants. What
also could have contributed to this result is the narrow discrepancy in the softness of the
manipulated chairs. As mentioned before, a small pre-test was conducted in order to find
two chairs that had more or less the same properties and visual appearance, but a large
discrepancy in softness and hardness. During the seats pre-test, it became clear that it was a
difficult to find two chairs that have approximately the same dimensions and visual
appearance, but a significant difference in softness. Often, very soft chairs are very different
in shape and size than hard chairs, which have most likely led to a too narrow discrepancy in
hardness and softness. The hard chair was very hard, because of being a wooden chair, but
the soft chair could have been much softer. Therefore, the hardness of the hard chair could
have been more sensible than the softness of the soft chair. This could have contributed to
the contrast effect. However, this will need to be further examined by future research. What
also could have been contributed to the negative interaction effect is a low construct
validity. As mentioned in the method, measuring a complete attitude would have been too
extensive since an attitude has a very wide domain. Therefore only eight basic attitude-
related items were measured, hence the name ‘general attitude’. As a consequence, a
complete attitude was not measured.
A possible explanation for the insignificant interaction effects for the company’s social
orientation and purchase intention constructs could be that the sensory metaphors
independently influenced the company’s social orientation and purchase intention, as a
result of parallel processing in the brain due to the different metaphorical associations. As
mentioned in the theoretical framework, the metaphorical link between soft and warm is
both more positive than hard and cold, but warm and soft have different associations. A
‘warm’ person is friendly and social, however a soft person is not per se friendly and social.
The metaphorical associations of warmth are related to sociality and friendliness, whereas
the metaphorical associations of softness are more related to the level of flexibility and
compliance gaining. We assume that this is why the expected significant positive interaction
effects did not occur.
What we also expected based on the metaphorical associations between the independent
variables, was a discrepancy in the effect size on the dependent variables. The effect size is
indicated by means of Partial Eta Squared (partial η2). Partial Eta Squared is the variance of a

MASTER THESIS | L.C.M. VAN DER KEMP
25
variable that remains after excluding the variance that may be explained by other
forecasters. In general, a Partial Eta Squared up to .01 is showing a weak effect, a score of
.06 a moderate effect, and a score of .16 a large effect (Brown, 2008). It also means that.
The results showed that effect size for the type of drink (.46) on the general attitude was
higher than the effect size of the type of chair (.02) on the general attitude. This means that
46% of the change in the ‘general attitude’ can be accounted for by the type of drink and 2%
of the change in the ‘general attitude’ can be accounted for by the type of chair. Therefore
we can conclude that the type of drink is a better predictor for the general attitude than the
type of chair. This result confirms H4a. The results also showed that the effect size for the
type of drink (.16) on the company’s social orientation was higher than the effect size of the
type of chair (.06) on the company’s social orientation. This result indicates that the type of
drink is a better predictor for the company’s social orientation than the type of chair, which
confirms H4b. Additionally, the results showed that the effect size for the type of drink (.01)
on purchase intention is lower than the effect size of the type of chair on purchase intention
(.04). In this case the type of chair is a stronger predictor for the general attitude than the
type of drink. This confirms hypothesis 5.
5.2 Limitations and future research
This study has provided insightful findings, however it has certain limitations as well. This
paragraph will discuss the limitations of this study and provide the corresponding
suggestions for future research.
A first limitation of this study was the timeframe when the experiments were conducted. As
mentioned in the method section, the experiment was conducted on four different days in
the late spring, in a two week window. The outside temperatures were around room
temperature and more or less similar on all four days. The results could have been different
when the experiment would have been conducted in the winter, since the participants might
then have preferred a warm drink over a cold drink. On the other hand, the results could
also have been different when the weather would have been very warm and sunny. The
participants of our experiment most likely preferred a cold drink over a warm drink, because
of the weather characteristics when the experiment was carried out. A suggestion for future
research is therefore to conduct the experiment in different seasons in order to exclude bias
of the preference for a drink.

MASTER THESIS | L.C.M. VAN DER KEMP
26
Another limitation was the manipulation of the physical warmth of the drinks. A small pre-
test concluded that hot tea and ice tea were the best drinks, with more or less the same
taste. The only difference between the drinks was the sweetness, since ice tea contains
added sugars and regular tea, made from a teabag, does not. Although the sweetness issue
was solved by adding two teaspoons of sugar per can of hot tea, the results could have been
different when two exactly the same drinks were used, but with different temperatures.
Another limitation of this study was the manipulation of softness and hardness by the chairs.
The aim was to find two chairs with a high discrepancy in hardness or softness. The hard
chair should be as hard as possible and the soft chair should be as soft as possible, however
all other dimensions should be as similar as possible. It proved to be difficult to find two
chairs with approximately the same dimensions, but with a large discrepancy in softness and
hardness. The results could have been different when the discrepancy in softness and
hardness would have been larger. When the soft chair would have been softer, we expect a
higher positive effect between the soft chair and the warm drink that would be more
positive than the current interaction effects on the dependent variables. Moreover, we
expect that the negative interaction effect on the ‘general attitude’ will have become less
significant. A suggestion for future research is therefore to repeat the experiment with two
similar chairs that have a higher discrepancy in hardness and softness.
A final, but nonetheless important limitation of this study was how the ‘general attitude’
construct was measured. This measurement might have been too narrow in terms of the
amount of items for a wide construct as an attitude. As already discussed in the results
discussion, an interaction effect occurred in the opposite direction than predicted for the
general attitude construct. Measuring an incomplete general attitude might have
contributed to this result. Although measuring a complete attitude would have been too
extensive for this study, a few more items could have been added to the construct in order
to increase the construct validity. A suggestion for future research would therefore be to add
several more items to the construct in order to gain a more complete measurement of the
‘general attitude’ construct.

MASTER THESIS | L.C.M. VAN DER KEMP
27
5.3 Practical implications
The findings of this study offer practical guidelines for retailers and organizations to improve
the general attitude, perception of the company’s social orientation and purchase intention
of their consumers. This can be achieved by placing soft chairs or seats in the seating area,
combined with offering warm drinks. As a result of this study, there is now evidence that
physical experiences with warmth and softness have a subconscious positive influence on
consumer behaviour. By applying the theories derived from this study, retailers could both
directly and indirectly achieve higher sales. Directly, since specifically haptic experiences
with softness have contributed to a higher purchase intention. Indirectly, since experiences
with physical warmth have contributed to an enhanced general attitude. According to the
well-known Theory of Planned behaviour by Azjen (1985), the more the attitude is
enhanced, the higher the behavioural intention becomes. Thus, the more the attitude
towards a product or company is enhanced, the higher the purchase intention becomes.
Since little research is conducted on the topic of sensory metaphors, many opportunities are
still available to investigate the subconscious influence of sensory metaphors. Further
research is necessary to provide more insight in the effectiveness of sensory metaphors.
Several interesting directions for further research have come forward through this study. It
would be interesting to examine whether these results are also valuable to other types of
companies, e.g. a hospital or bank waiting room. It would also be interesting to test whether
physical warmth and haptic experiences could be manipulated in other ways, for example
without a drink. It might be possible to create a warm and soft chair as one product.
5.4 Conclusion
Based on the results, the main finding of the experiment is that the warm and the soft chair
separately have contributed to a higher score on the dependent variables than the cold drink
and the hard chair did. Especially the type of drink was a strong predictor for enhancing the
general attitude and the company’s social orientation. When applied together, the warm
drink and the soft chair did not significantly enhance the dependent variables. Nevertheless,
the warm drink and the soft chair together still have contributed to the highest score on the
company’s social orientation and purchase intention. With this conclusion, this study has
contributed to more insight into the sensory metaphors phenomenon. The results of this

MASTER THESIS | L.C.M. VAN DER KEMP
28
study indicate that retail owners should place soft chairs in their seating area and/or offer
warm drinks in order to create at least the best perception of the social orientation of the
company and the highest purchase intention. In a later stage, the results and conclusions of
this study could be extended, interpreted and applied to other settings where one can sit
and drink at the same time, for example in the waiting room of a hospital or at a bank.

MASTER THESIS | L.C.M. VAN DER KEMP
29
References
Ackerman, J. M., Nocera, C. C., & Bargh, J. A. (2010). Incidental Haptic Sensations Influence
Social Judgments and Decisions. Science, 328(5986), 1712-1715. doi:
10.1126/science.1189993.
Asch, S. E. (1946). Forming impressions of personality. The Journal of Abnormal and Social
Psychology, 41(3), 258-290. doi: http://dx.doi.org/10.1037/h0055756.
Azjen, I. (1985). From Intentions to Actions: A Theory of Planned Behavior. In J. Kuhl, & J. B.
(Eds.), Action-control: From cognition to behavior (pp. 11-39). Heidelberg: Springer.
Barsalou, L. W. (2003). Situated simulation in the human conceptual system. Language and
Cognitive Processes, 18 (5-6), 513-562. doi: 10.1080/01690960344000026.
Barsalou, L. W. (2008). Grounded Cognition. The Annual Review of Psychology, 59, 617–45.
Brown, J. D. (2008). Effect size and eta squared. JALT Testing & Evaluation SIG Newsletter,
12(2), 38-43.
Cacioppo, J. T., Priester, J. R., & Berntson, G. G. (1993). Rudimentary determinants of
attitudes: II. Arm flexion and extension have differential effects on attitudes. Journal
of Personality and Social Psychology, 65(1), 5-17. doi:
http://dx.doi.org/10.1037/0022-3514.65.1.5.
Cherkasskiy, L., Song, H., Malahy, S., & Bargh, J. (2012). Soft on crime: Sitting in soft versus
hard chairs produces more lenient recommended sentences. San Diego, CA.
Dodds, W. B., Monroe, K. B., & Grewal, D. (1991). Effects of Price, Brand, and Store
Information on Buyers' Product Evaluations. Journal of Marketing Research, 28(3),
307-319. doi: 10.2307/3172866.
Elder, R., & Krishna, A. (2012). The “Visual Depiction Effect" in advertising: Facilitating
embodied mental simulation through product orientation. Journal of Consumer
Research, 38(6), 988-1003.
Fiske, S., Cuddy, A., & Glick, P. (2007). Universal dimensions of social cognition: warmth and
competence. TRENDS in Cognitive Sciences, 11(2), 77–83.
González, Barros-Loscertales, A., Pulvermüller, F., Meseguer, V., Sanjuán, A., & V. Belloch, e.
a. (2006). Reading cinnamon activates olfactory brain regions. NeuroImage, 32(2),
906–912.
Grewal, D., Monroe, K. B., & Krishnan, R. (1998). The Effects of Price-Comparison Advertising
on Buyers' Perceptions of Acquisition Value, Transaction Value, and Behavioral
Intentions. Journal of Marketing, 62(2), 46-59.

MASTER THESIS | L.C.M. VAN DER KEMP
30
Gummesson, E. (2005). Qualitative Research in Marketing: Road-Map for a Wilderness of
Complexity and Unpredictabilit. European Journal of Marketing, 39(3/4), 309-327.
Hardesty, D. M., Carlson, J. P., & Bearden, W. (2002). Brand Familiarity and Invoice Price
Effects on Consumer Evaluations: The Moderating Role of Skepticism toward
Advertising. Journal of Advertising, 31(2), 1-15. doi:
10.1080/00913367.2002.10673663.
Himmelfarb, S. (1993). The measurement of attitudes. In A. H. Eagly, & S. Chaiken,
Psychology of Attitudes (pp. 23-88). Thomson: Wadsworth.
Jostmann, N. B., Lakens, D., & Schubert, T. W. (2009). Weight as an embodiment of
importance. Psychological Science, 20(9), 1169–1174.
Krishna, A. (2011). Sensory Marketing: Research on the Sensuality of Products. Michigan :
Taylor & Francis Group.
Krishna, A. (2012). An integrative review of sensory marketing: Engaging the senses to affect
perception, judgment and behavior. Journal of Consumer Psychology, 22(3), 332–351.
doi: 10.1016/j.jcps.2011.08.003.
Krishna, A., & Schwarz, N. (2014). Sensory marketing, embodiment, and grounded cognition:
A review and introduction. Journal of Consumer Psychology, 24(2), 159–168.
Labroo, A. A., & Nielsen, J. H. (2010). Half the Thrill Is in the Chase: Twisted Inferences from
Embodied Cognitions and Brand Evaluation. Journal of Consumer Research, 143-158.
doi: http://dx.doi.org/10.1086/649908.
Lakoff, M., & Johnson, M. (1980). Metaphors We Live By. Chicago: Univ. of Chicago Press.
Lee, S. H., Rotman, J. D., & Perkins, A. W. (2014). Embodied cognition and social
consumption: Self-regulating temperature through social products. Journal of
Consumer Psychology, 24(2), 234–240.
Lee, S., & Schwarz, N. (2014). Metaphors in judgment and decision making. In M. J. Landau,
M. D. Robinson, & B. P. Meier (Eds.), The power of metaphor: Examining its influence
on social life, (pp. 85–108).
Likert, R. (1932). A Technique for the Measurement of Attitudes. Archives of Psychology,
140, 1–55.
Mandler, J. M. (1992). How to build a baby: II. Conceptual primitives. Psychological Review,
99(4), 587-604. doi: http://dx.doi.org/10.1037/0033-295X.99.4.587.
Matlin, M. W. (1988). Sensation and perception. Needham, MA, US: Allyn & Bacon .

MASTER THESIS | L.C.M. VAN DER KEMP
31
Mazar, N., & Zhong, C. (2010). Do Green Products Make Us Better People? Psychological
Science, XX(X), 1–5. doi: 10.1177/0956797610363538 .
McCroskey, J. C., & Richmond, V. P. (1989). Bipolar scales. In P. Emmert, & L. L. Barker,
Measurement of communication behaviour (pp. 154-167). White Plains, NY:
Longman.
Melnick, B. (1999, December 9). Cold Hard World \ Warm Soft Mommy: Gender and
Metaphors of Hardness, Softness, Coldness, and Warmth. Opgehaald van PSYART: A
Hyperlink Journal for the Psychological Study of the Arts.:
http://www.psyartjournal.com/article/show/melnick-
cold_hard_world_warm_soft_mommy_gender_a
Nunnally, J. C. (1978). Psychometric Theory. New York: McGraw-Hill.
Olson, M. J., Zanna, & Mark, P. (1993). Attitudes and Attitude Change. Annual Review of
Psychology, 44, 117–54. doi:10.1146/annurev.psych.44.1.117.
Ostinelli, M., Luna, D., & Ringberg, T. (2014). When up brings you down: The effects of
imagined vertical movements on. Journal of Consumer Psychology, 24(2), 271–283.
Proffitt, D. R., Stefanucci, J., Banton, T., & Epstein, W. (2003). The Role of Effort in Perceiving
Distance. Psychological Science, 14(2), 106-112. doi: 10.1111/1467-9280.t01-1-
01427.
Rosenberg, S., Nelson, C., & Vivekananthan, P. S. (1968). A MULTIDIMENSIONAL APPROACH
TO THE STRUCTURE OF PERSONALITY IMPRESSIONS. Journal of Personality and Social
Psychology, 9(4), 283-294. doi: http://dx.doi.org/10.1037/h0026086.
Simmons, W. K., Martin, A., & Barsalou, L. W. (2005). Pictures of Appetizing Foods Activate
Gustatory Cortices for Taste and Reward. Cerebral Cortex, 15(10), 1602-1608. doi:
10.1093/cercor/bhi038.
Snider, J. G., & Osgood, C. E. (1969). Semantic Differential Technique: A Sourcebook. Chicago:
Aldine.
Spears, N., & Singh, S. N. (2004). Measuring Attitude toward the Brand and Purchase
Intentions. Journal of Current Issues & Research in Advertising, 26(2), 53-66. doi:
10.1080/10641734.2004.10505164.
Spector, P. E. (1992). Summated rating scale construction: an introduction. Newbury Park,
CA: SAGE Publications, Inc.
MASTER THESIS | L.C.M. VAN DER KEMP
32
Strack, F., Martin, L. L., & Stepper, S. (1988). Inhibiting and facilitating conditions of the
human smile: A nonobtrusive test of the facial feedback hypothesis. Journal of
Personality and Social Psychology, 54(5), 768-777. doi:
http://dx.doi.org/10.1037/0022-3514.54.5.768.
Wells, G. L., & Petty, R. E. (1980). The Effects of Over Head Movements on Persuasion:
Compatibility and Incompatibility of Responses. Basic and Applied Social Psychology,
1(3), 219-230. doi: 10.1207/s15324834basp0103_2.
Williams, L., & Bargh, J. (2008). Experiencing Physical Warmth Promotes Interpersonal
Warmth. Science Magazine, 322(5901), 606-607. doi: 10.1126/science.1162548.
Wise. (2014, October). Retrieved from: Welke energiebedrijven zijn duurzaam, en wie zijn de
grootste vervuilers? : http://www.wisenederland.nl/groene-stroom/wie-zijn-de-
groenste-en-wie-zijn-de-grootste-vervuilers
Zatorre, R. J., & Halpern, A. R. (2005). Mental Concerts: Musical Imagery and Auditory
Cortex. ScienceDirect, 47(1), 9–12. doi: 10.1016/j.neuron.2005.06.013.
Zhong, C., & Leonardelli, G. J. (2008). Cold and lonely: Does social exclusion literally feel
cold? Psychological Science, 19(9), 838–842.
Zhong, C., & Liljenquist, K. (2006). Washing Away Your Sins: Threatened Morality and
Physical Cleansing. Science, 313(5792), 1451-1452. doi: 10.1126/science.1130726.
Zwebner, Y., Lee, L., & Goldenberg, J. (2014). The temperature premium: Warm
temperatures increase product valuation. Journal of Consumer Psychology, 24(2),
251–259.

MASTER THESIS | L.C.M. VAN DER KEMP
33
Appendix A. Stimulus Materials – Drinks and chairs
A. Cold drink B. Warm drink
C. Hard chair D. Soft chair

MASTER THESIS | L.C.M. VAN DER KEMP
34
Appendix B. Research materials - Brochure

MASTER THESIS | L.C.M. VAN DER KEMP
35
Appendix C. Introduction of questionnaire
Welkom. Alvast hartelijk bedankt voor je deelname aan mijn vooronderzoek over groene
producten. In het kader van het milieu en het milieubewustzijn heb ik twee producten
waarvan ik graag je mening/houding wil weten. De uitkomst van dit vooronderzoek zal ik
gaan gebruiken voor mijn daadwerkelijke onderzoek.
Als eerste krijg je een drankje. Dit drankje is een variant op de bestaande thee dranken. Het
is de bedoeling dat je het drankje proeft. Je mag het natuurlijk ook helemaal opdrinken.
Tijdens het proeven van het drankje krijg je de brochure te zien van de nieuwe
energiemaatschappij 'The Green Energy Company'. Deze energiemaatschappij levert
uitsluitend groene energie die rechtstreeks van de bron komt.
Nadat je het drankje hebt geproefd en de brochure hebt doorgelezen krijg je een vragenlijst
met vragen over deze twee producten. Het invullen van de vragenlijst zal ongeveer 8
minuten in beslag nemen.
Laura van der Kemp, student marketingcommunicatie
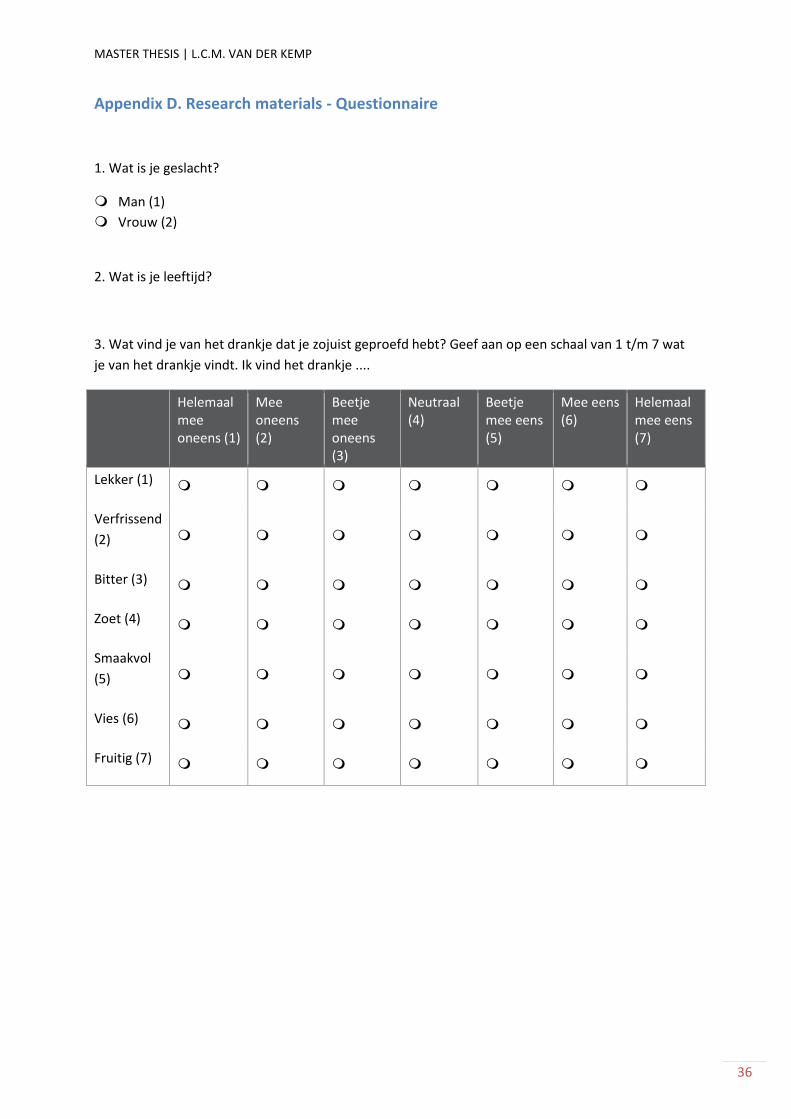
MASTER THESIS | L.C.M. VAN DER KEMP
36
Appendix D. Research materials - Questionnaire
1. Wat is je geslacht?
Man (1)
Vrouw (2)
2. Wat is je leeftijd?
3. Wat vind je van het drankje dat je zojuist geproefd hebt? Geef aan op een schaal van 1 t/m 7 wat
je van het drankje vindt. Ik vind het drankje ....
Helemaal mee oneens (1)
Mee oneens (2)
Beetje mee oneens (3)
Neutraal (4)
Beetje mee eens (5)
Mee eens (6)
Helemaal mee eens (7)
Lekker (1)
Verfrissend
(2)
Bitter (3)
Zoet (4)
Smaakvol
(5)
Vies (6)
Fruitig (7)

MASTER THESIS | L.C.M. VAN DER KEMP
37
4. Geef aan op een schaal van 1 t/m 7 in hoeverre je het eens bent met de volgende stellingen:
Helemaal mee oneens (1)
Mee oneens (2)
Beetje mee oneens (3)
Neutraal (4)
Beetje mee eens (5)
Mee eens (6)
Helemaal mee eens (7)
Ik zou het
drankje
willen kopen
wanneer het
in de
supermarket
verkijgbaar
is (1)
Ik zou
overwegen
dit drankje
bestellen
wanneer het
in de horeca
verkrijgbaar
is (2)

MASTER THESIS | L.C.M. VAN DER KEMP
38
5. Wat is je eerste indruk van de nieuwe groene energiemaatschappij 'The Green Energy Company'
aan de hand van de brochure? Ik vind 'The Green Energy Company' (TGEC):
1 (1) 2 (2) 3 (3) 4 (4) 5 (5) 6 (6) 7 (7)
Niet overtuigend:Overtuigend
(1)
Onorigineel:Origineel (2)
Ongeloofwaardig:Geloofwaardig
(3)
Niet innovatief:Innovatief (4)
Onprofessioneel:Professioneel
(5)
Slecht:Goed (6)
Oninteressant:Interessant (7)
Zwak:Sterk (8)

MASTER THESIS | L.C.M. VAN DER KEMP
39
6. Geef op een schaal van 1 t/m 7 aan in hoeverre je het eens bent met de volgende stellingen:
Helemaal mee oneens (1)
Mee oneens (2)
Beetje mee oneens (3)
Neutraal (4)
Beetje mee eens (5)
Mee eens (6)
Helemaal mee eens (7)
TGEC lijkt mij een
klantvriendelijke
energiemaatschappij
(1)
TGEC lijkt mij een
onbetrouwbare
energiemaatschappij
(2)
TGEC lijkt mij een
meelevende
energiemaatschappij
(3)
TGEC lijkt mij een
onsympathieke
energiemaatschappij
(4)
TGEC lijkt mij een
sociale
energiemaatschappij
(5)
TGEC lijkt mij een
eerlijke
energiemaatschappij
(6)
TGEC lijkt mij een
betrokken
energiemaatschappij
(7)

MASTER THESIS | L.C.M. VAN DER KEMP
40
7. Geef op een schaal van 1 t/m 7 aan in hoeverre je het eens bent met de volgende stellingen:
Helemaal mee oneens (1)
Mee oneens (2)
Beetje mee oneens (3)
Neutraal (4)
Beetje mee eens (5)
Mee eens (6)
Helemaal mee eens (7)
Ik zou het
overwegen om mij
aan te melden voor
de maandelijkse
nieuwsbrief e-mail
van TGEC om op de
hoogte te worden
gehouden van de
laatste
ontwikkelingen. (1)
Wanneer een call-
centre medewerker
mij opbelt over
TGEC ben ik bereid
om aandachtig te
luisteren naar zijn
verhaal (2)
Ik zou overwegen
aanvullende
informatie van TGEC
thuis te ontvangen
(3)
Wanneer een door-
to-door verkoper bij
mij thuis aanbeld
ben ik bereid om
aandachtig te
luisteren naar zijn
verhaal over TGEC
(4)
Wanneer ik nu
moest kiezen voor
een
energiemaatschappij
zou ik overwegen
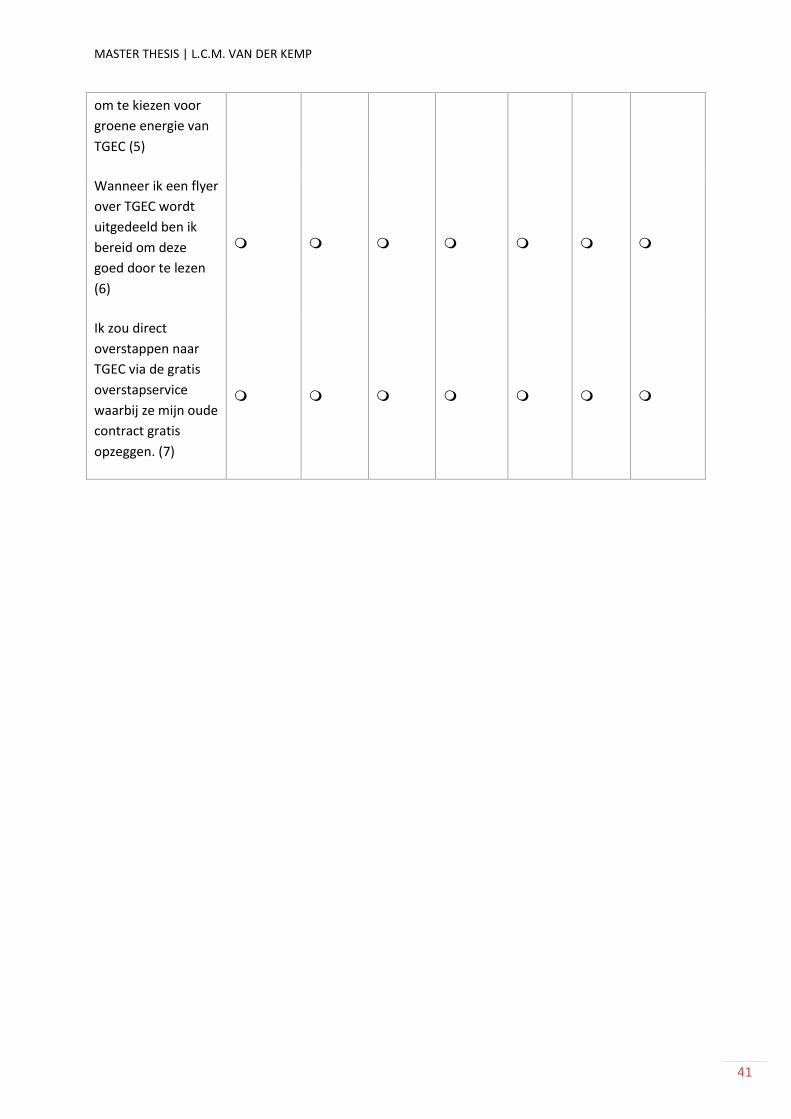
MASTER THESIS | L.C.M. VAN DER KEMP
41
om te kiezen voor
groene energie van
TGEC (5)
Wanneer ik een flyer
over TGEC wordt
uitgedeeld ben ik
bereid om deze
goed door te lezen
(6)
Ik zou direct
overstappen naar
TGEC via de gratis
overstapservice
waarbij ze mijn oude
contract gratis
opzeggen. (7)