Embed Size (px)
Citation preview
HAL Id: hal-00311803https://hal.archives-ouvertes.fr/hal-00311803
Submitted on 21 Aug 2008
HAL is a multi-disciplinary open accessarchive for the deposit and dissemination of sci-entific research documents, whether they are pub-lished or not. The documents may come fromteaching and research institutions in France orabroad, or from public or private research centers.
L’archive ouverte pluridisciplinaire HAL, estdestinée au dépôt et à la diffusion de documentsscientifiques de niveau recherche, publiés ou non,émanant des établissements d’enseignement et derecherche français ou étrangers, des laboratoirespublics ou privés.
Zinc speciation and isotopic exchangeability in soilspolluted with heavy metals
William Diesing, Sokrat Sinaj, Geraldine Sarret, Alain Manceau, T. Flura,Paolo Demaria, A. Siegenthaler, Valérie Sappin-Didier, Emmanuel Frossard
To cite this version:William Diesing, Sokrat Sinaj, Geraldine Sarret, Alain Manceau, T. Flura, et al.. Zinc speciation andisotopic exchangeability in soils polluted with heavy metals. European Journal of Soil Science, Wiley,2008, 59 (4), pp.716-729. �10.1111/j.1365-2389.2008.01032.x�. �hal-00311803�

1
Zn exchangeability in soils 1
2
Zinc speciation and isotopic exchangeability in soils polluted with 3
heavy metals 4
5
6
W.E. DIESING a, S. SINAJa, G. SARRETb, A. MANCEAUb, T. FLURAa, P. DEMARIAa, A. 7
SIEGENTHALERc, V. SAPPIN-DIDIERd & E. FROSSARDa 8
a Swiss Federal Institute of Technology (ETH Zürich), Institute of Plant Sciences, 9
Eschikon 33, CH-8315 Lindau, Switzerland; b Environmental Geochemistry Group, 10
LGIT, University of Grenoble and CNRS, BP 53, 38041, Grenoble Cedex 9, France; 11
c Swiss Federal Office for Agriculture (BLW), Mattenhofstrasse 5, 3003 Bern, 12
Switzerland; and d Institut National de la Recherche Agronomique (INRA), UMR 13
Transfert sol plante et cycle des éléments minéraux dans les écosystèmes cultivés, 14
BP 81, 33883 Villenave d’Ornon Cedex, France 15
16
Correspondence: E. Frossard, E-mail: [email protected] 17
18
19
20
21
22
23
24

2
Summary 25
A correct characterization of heavy metal availability is a prerequisite for the 26
management of polluted soils. Our objective was to describe zinc (Zn) availability in 27
polluted soils by measuring the isotopic exchangeability of Zn in soil/solution (E 28
value) and in soil/plant systems (L value), by assessing the transfer of Zn and 65Zn in 29
the fractions of a six-step selective sequential extraction (SSE) in incubated soils 30
and by identifying Zn forms in soils using extended X-ray absorption fine structure 31
(EXAFS) spectroscopy. We distinguished 3 pools of exchangeable Zn: the pool of 32
Zn exchangeable within 1 minute which is observed in all soils, Zn exchangeable on 33
the medium term, and the slowly and not exchangeable Zn. The amount of Zn 34
present in the 2 first pools was similar to the L value measured with T. caerulescens. 35
The 3 first steps of the SSE solubilized the 1st pool and a fraction of the 2nd pool. 36
Most of the 2nd pool and a fraction of the 3rd pool were extracted in the 4th step of 37
the SSE, while the rest of the 3rd pool was extracted in the final steps of the SSE. 38
The EXAFS study conducted on two soils showed that more than half of the Zn was 39
present in species weakly bound to organic compounds and/or outer sphere 40
inorganic and organic complexes. Other species included strongly sorbed Zn species 41
and Zn species in crystalline minerals. The EXAFS study of selected SSE residues 42
showed that the specificity and the efficiency of the extractions depended on the 43
properties of the soil studied. 44
45
Introduction 46
An accurate assessment of heavy metal availability is essential for the proper 47
management of polluted soils. Young et al. (2006) reviewed the use of selective 48
sequential extractions (SSE) and isotope exchange (IE) techniques to characterize 49

3
heavy metals availability and speciation on the solid phase of soils. They concluded 50
that although sequential extractions are rather easy to implement, their results are 51
flawed because of the lack of specificity of the extractants for given metal species, 52
and/or because of the adsorption or precipitation of metals occurring during the 53
extraction. IE techniques conducted in soil/solution systems allow the quantification 54
of ions located on the solid phase of the soil that can exchange with the same ion 55
present in the soil solution within a given exchange time (E value) (Sinaj et al., 56
1999). Ayoub et al. (2003) and Sinaj et al. (2004) showed that E values measured 57
after a long IE time in acidic soils are identical to the amount of isotopically 58
exchangeable Zn measured in pot experiments with different plant species (L 59
values) demonstrating that Zn that is isotopically exchangeable within a time frame 60
relevant for plant growth is the main source of Zn for plant nutrition. In most studies 61
E values are only measured after a single time of exchange (for instance 24h; Young 62
et al., 2000; Degryse et al., 2003; Nolan et al., 2005) although according to Young 63
et al. (2006) the study of the kinetics of IE has a lot of potential for assessing Zn 64
forms and availability in soils. 65
To assess whether a SSE could deliver relevant results on cadmium (Cd) 66
availability, Ahnstrom and Parker (2001) carried out a sequential extraction on soils 67
that had been labeled with a stable isotope of Cd (111Cd). They measured in all 68
extracts the total Cd content and the abundance of 111Cd and then compared these 69
results with the amount of soil isotopically exchangeable Cd. They concluded that 70
no single fraction of the sequential extraction or a combination of fractions 71
corresponded to the size of the isotopically labile Cd pool. 72
Extended X-ray Absorption Fine Structure (EXAFS) spectroscopy is also 73
used to assess the forms of heavy metals in soils (Manceau et al., 2002). Sarret et al. 74
4
(2004) explained the high proportion of isotopically exchangeable Zn observed in a 75
polluted soil by its high concentration in octahedral Zn weakly bound to organic 76
compounds identified with EXAFS. The sensitivity of EXAFS spectroscopy for 77
exchangeable species (bound to organics or weakly sorbed on minerals) is however 78
relatively weak as compared to precipitated and crystalline phases. On the opposite, 79
chemical extractions allow a better quantification of easily mobilized species as 80
compared to more recalcitrant ones due to non-specific dissolution and possible 81
formation of new species. Therefore, the combination of IE methods, SSE and 82
EXAFS spectroscopy may provide a better picture of exchangeable and non-83
exchangeable metal species (Scheinost et al., 2002; Sarret et al., 2004). 84
We analyzed Zn exchangeability and speciation in six polluted soils with IE 85
methods, both in soil/water systems (E values) and in soil/plant systems (L values), 86
SSE and Zn K-edge EXAFS spectroscopy. Our purpose was to establish 87
relationships between the Zn pools determined by the various techniques, and 88
between these pools and soil parameters such as total Zn content and pH. Moreover, 89
the specificity of SSE steps for extracting real Zn chemical species was tested by 90
comparing the distribution of Zn species determined by EXAFS spectroscopy in the 91
soil and in selected extraction residues. To test whether the extraction steps released 92
Zn species with a specific exchangeability, soils were labeled with 65Zn before the 93
SSE, and the specific activity was measured in each residue. 94
95
Materials and methods 96
Soils 97
We studied six soils that had been polluted with heavy metals. The soil from the 98
Institut National de la Recherche Agronomique (INRA soil) was sampled from a 99

5
field experiment performed near Bordeaux, France (44° 51’ N 00° 32’ W). This soil 100
had received 100 t of municipal digested and dehydrated sewage sludge per hectare 101
every second year between 1974 and 1993. A description of the experiment can be 102
found in Weissenhorn et al. (1995). Two soils from the Institut für Umweltschutz 103
und Landwirtschaft (IUL soils) were collected in a field experiment conducted near 104
Bern, Switzerland (46° 55’ N 07° 25’ E). Aerobically digested and dehydrated 105
sewage sludge had been applied to the IUL SS soil, while pig slurry had been 106
applied to the IUL PS soil. The amendment-loading rate for both soils was 5 t ha-1 107
year-1 from 1976 to 1996. A description of this field experiment is given in 108
Siegenthaler et al. (1999). The three remaining soils were collected in the vicinity of 109
industrial metal smelting facilities located close to Dornach, Switzerland (47° 25’ N 110
07° 35’ E), and in Evin (50° 25’ N 03° 01’ E) and Mortagne (50° 30’ N 03° 27’ E), 111
France. The Dornach soil has accumulated Cd, Cu, Ni and Zn from the deposition of 112
about 700 t dust year-1 from brass smelting that began in 1895 and continued into 113
the 1980s before the installation of emission filters and scrubbers (Geiger et al., 114
1993). The smelting facility in Evin began operations in 1894 and grew to become 115
the largest Pb and Zn ore processing plant in Europe before its closure in 2003. Until 116
1970, the Evin facility emitted approximately 5 t smelter dust day-1 (LASIR, 2000). 117
The Mortagne soil is heavily polluted with metal dust and slag from a Pb and Zn 118
smelter in operation between 1906 and 1968 (Manceau et al., 2000). Thiry et al. 119
(2002) estimate that 15’000 t of metals have been dispersed over 25 hectares 120
surrounding the smelter. 121
Approximately 100 subsamples of the INRA, IUL SS and IUL PS soils were 122
collected at random intervals within the surface horizon (0-20 cm) to obtain a 123
representative sample. For the Evin and Dornach soils, samples were randomly 124

6
taken after having removed the litter layer to obtain the maximum contaminant 125
concentration in the soil. The sample site in Mortagne is the so-called metallicolous 126
meadow. The A horizon was characterized by a distinct layer (5 to 8 cm thick) 127
starting at a 15 to 25 cm depth in which smelter ash and tailings had been spread out 128
and buried at the time the smelter was closed. A representative sampling was 129
obtained by collecting approximately 100 random subsamples between 5 and 40 cm 130
to include the heavily polluted layer. The soil samples were well mixed, air-dried for 131
at least one week and passed through a 2-mm sieve. Remaining plant debris was 132
removed by hand prior to analysis. Relevant soil characteristics are listed in Table 1. 133
134
Isotopic exchange kinetics, compartmental analysis and determination of 135
isotopically exchangeable Zn 136
IE kinetic experiments were carried out using a 1:10 soil solution ratio and 2 mM 137
CaCl2 as described by Sinaj et al. (1999). After shaking the soil solution suspension 138
on an end-over-end shaker for three days, the samples were removed, placed on a 139
magnetic stirring plate and stirred at 300 rpm. The soil suspension samples were 140
spiked with 1.3 to 2.5 kBq of carrier-free 65Zn added as ZnCl2 (NEN Biosciences, 141
Boston, USA; specific activity 2.0 GBq mg-1 Zn). Aliquots of the soil suspension 142
filtered through a 0.2 μm porosity cellulose acetate membrane (Minisart, Sartorius) 143
were removed at 1, 3, 10, 30 and 60 minutes, and at 1, 7 and 14 days. After the first 144
60 minutes of IE the flasks were left on the bench and they were put back on the 145
stirring plate one hour before sampling at 1, 7 and 14 days so as to minimize the 146
dispersion of soil aggregates that would have been caused by a continuous stirring. 147
The concentration of Zn in the solution (CZn) was measured after 60 minutes, 1, 7 148
and 14 days by ion chromatography as proposed by Sinaj et al. (1999). This method 149

7
measures the oxalate complexable Zn in the filtered soil suspension which 150
approximates the concentration of the hydrated and weakly complexed Zn species 151
(Cardellicchio et al., 1999) present in the solution. 65Zn activity in the solution was 152
measured at all sampling times by β liquid scintillation detection (Packard 2500) at 153
an emission energy of 325 keV. We measured the β-counts using 1 ml of filtrate 154
with 5 ml of scintillation liquid (Packard Ultima Gold) and corrected them for 155
quenching effects. 156
The decrease of the fraction of radioactivity remaining in the solution (rt/R 157
where rt is the radioactivity remaining in the solution expressed in Bq after t 158
minutes, and R the total introduced radioactivity expressed in Bq) was analyzed in 159
each soil with a compartmental analysis to assess the number of Zn containing 160
compartments (a compartment is defined as an amount of material that acts as 161
though it is well-mixed and kinetically homogeneous, Cobelli et al. (2000)). We 162
proceeded as proposed by Cobelli et al. (2000). If we consider that for a given soil 163
an apparent isotopic equilibrium is reached before or at 14 days of exchange (i.e. 164
that the fraction of radioactivity remaining in the solution has reached a constant 165
value), we can subtract the fraction of radioactivity remaining at equilibrium from 166
the rt/R values measured at earlier times during the experiment and analyze the 167
resulting curve. If a finite number of compartments can be identified it is possible to 168
separate the obtained curve in a sum of exponential terms that are a function of 169
exchange time. The final equation describing the change of radioactivity in solution 170
with time can then be written as follows: 171
tCN
ii
t ieBARr ×−
−
=∑ ×+=
1
1 (1) 172

8
Where rt/R is the fraction of 65Zn remaining in solution at the time of sampling, A, Bi 173
and Ci are constants, N is the total number of compartments. 174
The theory of the compartmental analysis states that when the system is 175
closed, at a steady-state for the element studied, and when the tracer (here 65Zn) is 176
introduced in one injection within a very short time, then the number of total 177
compartment (N) is equal to the number of exponential terms (N-1) plus 1 (Cobelli 178
et al., 2000). 179
This analysis suggests the presence in all soils of a compartment of Zn 180
exchangeable during the first minute of exchange while other compartments differed 181
from soil to soil in their time limits and/or in their total numbers. To simplify the 182
subsequent analysis of the results we decided to consider only three pools of Zn (a 183
pool being defined as a group of compartments, Cobelli et al., 2000) in the rest of 184
the paper: the pool of Zn exchangeable within 1 minute which is observed in all 185
soils (pool 1), the pool of Zn that is exchangeable between 1 minute and apparent 186
isotopic equilibrium (pool 2) and the pool of Zn that can not be exchanged or that 187
exchanges very slowly (pool 3). The amount of Zn isotopically exchangeable within 188
a given time (Et value, mg kg-1) is calculated using the following equation: 189
tZnt r
RCmvE ×⎥
⎦
⎤⎢⎣
⎡×⎟⎠⎞
⎜⎝⎛= (2) 190
Where v/m is the solution to soil ratio (l kg-1), CZn is the Zn concentration (mg l-1) in 191
solution and rt/R is the fraction of 65Zn remaining in solution at the time t of 192
sampling. The amount of Zn present in the pool 1 (Epool1) is calculated considering 193
an exchange time of 1 minute, the amount of Zn present in the pool 2 (Epool2) is the 194
difference between the amount of Zn that has been exchanged at apparent isotopic 195
equilibrium and the amount of Zn exchangeable within one minute. The amount of 196

9
Zn present in the pool 3 (Epool3) is calculated as the difference between soil total Zn 197
and the amount of Zn that has been exchanged at apparent isotopic equilibrium. 198
199
Pot experiment with Thlaspi caerulescens, calculation of the L value 200
The most readily exchangeable Zn pools were labeled with carrier-free 65Zn (NEN 201
Biosciences, Boston, USA; specific activity: 2.0 GBq mg-1 Zn). De-ionized water, 202
nutrient solution and 65Zn were mixed well in to the soils to bring the soil moisture 203
content to 50% water holding capacity (WHC), to provide basal nutrients and to 204
obtain an activity of 2.4 MBq kg-1 soil. The activity was raised to 4.7 MBq kg-1 soil 205
in the Dornach soil due its high Zn fixing capacity. The nutrient solution provided 206
120 mg K kg-1 dry soil as K2SO4 and KH2PO4, 30 mg Mg kg-1 dry soil as MgSO4, 207
140 mg N kg-1 dry soil as NH4NO3, 60 mg P kg-1 dry soil as KH2PO4 and 58 mg S 208
kg-1 dry soil as K2SO4 and MgSO4. Incubation of the soils for 40 days at 21° C 209
under aerobic conditions was performed to allow the 65Zn to label the most readily 210
exchangeable pools. Each pot was filled with 400 g dry mass soil and the water 211
content was raised to 75% water holding capacity (WHC) before sowing the seeds. 212
The pot experiment consisted of a randomized block design of four 213
replicates. Ten seeds of T. caerulescens (Ganges ecotype) were sown and after 214
germination (~14 days) the plants were thinned to four plants per pot. Pots were 215
watered daily with de-ionized water to maintain 75% soil WHC. The plants were 216
grown under a controlled environment of 16°C /8 h night and 20°C /16 h day, at 217
70% relative humidity and a light intensity of 280 μmol m-2s-1. 218
After 80 days growth, the plants were harvested by cutting shoots at the soil 219
surface. The plant aerial biomass was washed with de-ionized water, dried at 85° C 220
for 24 hours and the dry mass was measured. Plant Zn concentrations were obtained 221

10
by grinding the plant material with an agate ball mill and using a dry-ash digestion 222
method adapted from Chapman and Pratt (1961). The method was performed by 223
incinerating a 1 g sample at 500° C for 8 hours, dissolving the residual ashes with 2 224
ml of 5.8 M analytical grade HCl that was further diluted to 50 ml with de-ionized 225
water before element and isotope measurements. Zn concentrations were determined 226
by ICP-OES (Varian Liberty 220) and 65Zn was measured using high purity Ge 227
bore-hole gamma detector (EAWAG, Dübendorf, Switzerland). All 65Zn 228
measurements were corrected back to the date of soil labeling. 229
Calculation of the L value (mg Zn kg soil-1) was performed with the 230
following equation proposed by Smith (1981): 231
introduced
plant
seedplant
ZnZn
ZnZnL
65
65
)( −= (3) 232
where Znplant (mg Zn plant-1) is the amount of Zn in the aerial parts of the plant, 233
Znseed (mg Zn plant-1) is the amount of Zn in the seed, 65Znplant (Bq plant-1) is the 234
amount of 65Zn in the aerial parts of the plant, and 65Znintroduced the total amount of 235
65Zn introduced to the soil (Bq kg-1 soil). This equation provides the most 236
conservative calculation of L since it assumes that all the seed Zn was redistributed 237
to the aerial portions of the plant. The concentration of Zn present in the seeds 238
(ZnSeed) was 34.0 ng Zn plant-1 (standard error: 0.1 ng Zn plant -1). 239
240
Selective Sequential Extraction and Total Digestion 241
Before conducting the selective sequential extraction (SSE), soils were labeled with 242
65Zn and incubated for 20, 85 and 120 days at 21° C. At the time of labeling, a 243
carrier-free 65Zn solution (NEN Biosciences, Boston, USA; specific activity: 2.0 244

11
GBq mg-1 Zn) was added as ZnCl2 to de-ionized water and mixed well with the soil 245
samples at the rate of 22.5 to 86.0 MBq kg-1 soil. Soils were maintained at 50% 246
water holding capacity and well aerated during the incubation period. 247
The selective sequential extraction used in this study was a six-step 248
procedure (F1-F6) developed by Salbu et al. (1998) and modified using a 1:10 soil 249
to extractant ratio. A description of the analytical grade reagents, procedures and the 250
proposed binding mechanisms are provided in Table 2. The extraction procedure is 251
designed to extract metals in a step-wise fashion first from weak outer sphere bound 252
forms (F1-F3), then from tightly bound outer and inner sphere complexes (F4 and 253
F5) and finally from crystalline metal forms (F6). Prior to performing extractions, 254
the soil samples were ground to a fine powder to homogenize and increase the 255
surface area exposed to the extractants during the extraction process. For each 256
extraction step the samples were shaken on a horizontal shaker at 100 rpm for the 257
times listed in the procedure. Following each extraction, the samples were 258
centrifuged at 11’000 g for 30 minutes, the solution was filtered through a 0.45 µm 259
porosity filter and the filtrate was analyzed for Zn and 65Zn. Measurements for Zn 260
were performed on an ICP-OES (Varian Liberty 220) and 65Zn was measured using 261
high purity Ge bore-hole gamma detector (EAWAG, Dübendorf, Switzerland). All 262
65Zn measurements were corrected back to the date of soil labeling. 263
As a final step (F7), the F6 residue was placed in an open-vessel microwave 264
digester (MX 350 Prolabo, France) and the procedure of Lorentzen and Kingston 265
(1996) was used to extract the residual Zn. After digestion, the sample was cooled to 266
room temperature filtered with a 0.45 µm porosity filter prior to ICP-OES (Varian 267
Liberty 220) analysis. In addition, a single step total digestion was conducted on all 268

12
soils to obtain total Zn and 65Zn quantities as a comparison to the total quantities 269
recovered by the SSE. 270
The fraction of Zn that had undergone isotopic exchange in each fraction of 271
the SSE was assessed by calculating the specific activity (SA) of Zn in each fraction 272
normalized by the quantity of isotopes introduced during labeling (65Znintroduced Bq 273
kg-1 soil) and the total soil Zn (Zntotal mg Zn kg-1 soil) as shown in equation 4. 274
⎟⎟⎠
⎞⎜⎜⎝
⎛
⎟⎟⎠
⎞⎜⎜⎝
⎛
=
total
Fx
introduced
F
ZnZn
ZnZn
SA
X
65
65
(4) 275
In this equation the subscript Fx is the extraction number, 65ZnFx represents the 276
radioisotope concentration (Bq kg-1 soil) in this extract and ZnFx the total Zn 277
concentration (mg Zn kg-1 soil) in the same extract. 278
279
Statistics 280
All soil analyses were conducted in triplicate while the plant analyses were made 281
with four replicates. Mean values are presented with the standard errors. 282
“Statgraphics plus for Windows” was used for both linear and nonlinear regressions. 283
The standard error of estimate (SEE) and the coefficient of determination are given 284
for each regression. The validity of regressions was evaluated by comparing the 285
predicted and experimental values and by looking at the residuals. 286
287
Extended X-ray Absorption Fine Structure (EXAFS) Spectroscopy 288

13
Untreated reference samples of the Dornach and Mortagne soils and residues 289
obtained from the selective sequential extraction were air-dried at 35° C ground and 290
pressed into 5 mm diameter pellets for EXAFS analysis. 291
Experiments were conducted in 2003 at the European Synchrotron Radiation 292
Facility (ESRF, Grenoble, France) on beamline ID-26. The electron storage ring was 293
operating in 16 bunch mode at 6 GeV and current ranging from 70 to 90 mA. The 294
monochromator was a pair of Si(220) flat crystals. Spectra were collected in 295
fluorescence mode using a photo-diode detector and aluminum filters. For each 296
sample 10-20 scans of 40 minutes were averaged. Data extraction was done using 297
WinXAS (version 2.0, Ressler, 2000). 298
Data analysis was done by linear combination fits (LCFs) without principal 299
component analysis since this latter approach is not adapted to small sets of spectra. 300
The LCFs were conducted using a reference Zn K-edge reference spectra library 301
described previously (Manceau et al., 2003; Sarret et al., 2004). The maximum 302
number of components for the fit of the extraction residues and soil spectra was 303
limited to four since the precision of the method does not enable a reliable 304
quantification of more complex mixtures. From these four components, 305
concentrations of Zn species (mg Zn kg-1 soil) in each sample were calculated by 306
multiplying the percentage of each component by the total Zn concentration in the 307
sample. 308
309
Results and discussion 310
Zn concentration in dilute CaCl2 extracts (CZn) 311
We present the average CZn values measured during the IE kinetic experiments for 312
each soil (Table 3). The highest values were observed in the Evin and Mortagne 313
14
soils and the lowest values were observed in the IUL SS soil (Table 3). The 314
logarithm of CZn was highly significantly related to soil pH and to the logarithm of 315
the total soil Zn content of the 6 soils. 316
ln(CZn)=4.81-3.06pH +1.86ln(Zntotal), n=6, R2=0.97, SEE=0.67 (5) 317
This result confirms that CZn increases with Zn inputs and decreases when soil pH 318
increases as noted by Arias et al. (2005). The very low CZn values observed in the 319
IUL SS soil can be explained by its high amorphous iron oxide content (Table 1) 320
acting as a strong sorbent for Zn. The elevated amorphous iron oxide content of this 321
soil is related to the repeated additions of FeCl3 treated sewage sludge in this field 322
experiment. 323
324
Decrease of radioactivity in dilute CaCl2 extracts with time during the isotopic 325
exchange kinetic experiments 326
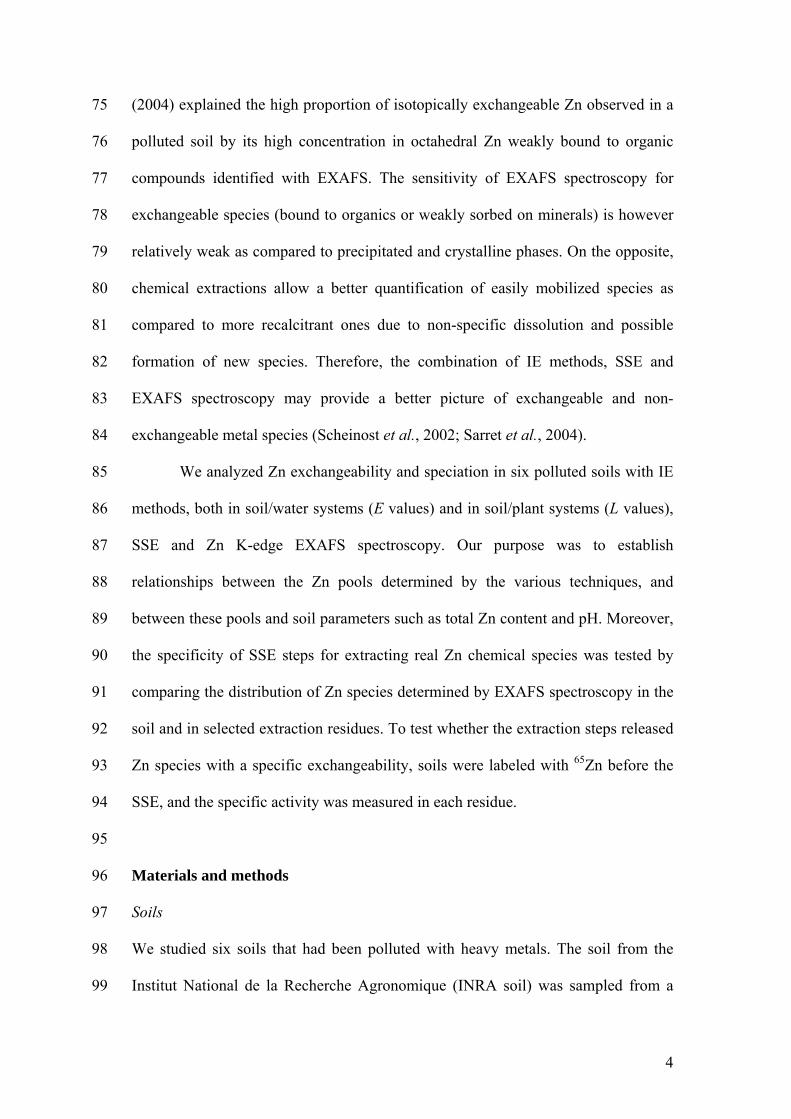
The radioactivity found in the solution at a given time divided by the total amount of 327
radioactivity added to the suspension (rt/R) decreased following the same pattern in 328
all samples (Figure 1). In most soils the 2 last rt/R values were very similar showing 329
that an apparent isotopic equilibrium had been reached after 14 days. Only in the 330
IUL PS and in the Evin soils was the last rt/R value lower than the previous one 331
indicating that the isotopic equilibrium might have not been reached after 14 days of 332
IE. 333
It was possible to fit the curves describing the decrease of rt/R with exchange 334
time by the equation 1 by a sum of two exponential terms and a constant for the 335
Dornach soil and by a sum of three exponential terms and a constant for the other 336
soils (data not shown). These results suggest that the 65Zn added in the solution 337
exchanged with Zn located in 3 compartments in the Dornach soil and in 4 338

15
compartments in the other soils. These compartments corresponded to the following 339
exchange times: 0-1 min, 1-30 min, 30 min-7 days and > 7 days in INRA and IUL 340
SS; 0-1 min, 1-10 min, 10 min to 14 days and >14 days in IUL PS; 0-1 min, 1-30 341
min, 30 min to 14 days and > 14 days in Evin; 0-1 min, 1 min to 1 day and > 1 day 342
in Dornach; and 0-1 min, 1-30 min, 30 min to 7 days and > 7 days in Mortagne. 343
Models with two exponential terms and a constant were tried for all soils but gave a 344
proper fit only for Dornach (results not shown). This analysis suggests the presence 345
in all soils of a compartment of Zn exchangeable during the first minute, while other 346
compartments differed from soil to soil. 347
This compartmental analysis has some limits and its results must be 348
interpreted with caution. More sampling points might have resulted in the 349
determination of more compartments (Fardeau, 1993). Besides, it is extremely 350
difficult to sample the suspension at exchange time shorter than 1 minute (Fardeau, 351
1993). The stochastic approach used by Sinaj et al. (1999) was tested with our soils. 352
This approach allowed modeling the changes of rt/R with time as well as the sum of 353
exponentials for all soils except for IUL PS where it led to negative values of 354
radioactivity as time tended towards the infinity (results not shown). Besides, this 355
stochastic approach does not allow distinguishing compartments of exchangeable 356
elements (Fardeau, 1993). 357
358
Calculation of the amount of isotopically exchangeable Zn (E values) 359
Because of the different number of compartments observed between soils we prefer 360
to summarize the information given by the compartmental analysis by considering 361
only three pools of exchangeable Zn for each soil: the amount of Zn exchangeable 362
within 1 minute which is observed in all soils (pool 1), the amount of Zn 363

16
exchangeable that is exchangeable on the medium term (pool 2), and the amount of 364
Zn that is very slowly or not exchangeable (pool 3). The pool 2 corresponds to the 365
fraction of soil Zn that is exchangeable between 1 minute and apparent isotopic 366
equilibrium, i.e. between 1 minute and 1 day in Dornach, between 1 minute and 7 367
days in INRA, IUL SS and Mortagne, and between 1 minute and 14 days in IUL PS 368
and Evin. The pool 3 corresponds to the amount of Zn that could not be isotopically 369
exchanged within 1 day in Dornach, within 7 days in INRA, IUL SS and Mortagne 370
and within 14 days in Evin and IUL PS. 371
The amounts of Zn present in the 1st, 2nd and 3rd pools (Epool1, Epool2 and 372
Epool3) are presented in Table 3. Soils polluted with organic amendments (INRA, 373
IUL SS, IUL PS) had between 3.5 and 11.9% of the total Zn in the pool 1 and 374
between 68.1 and 78.9% of total Zn in the pool 3. The Evin and Mortagne smelter-375
impacted soils had between 42.3 and 46.8% of the total Zn in the pool 1 and 376
between 39.1 and 39.9% of total Zn in the pool 3. The Dornach smelter-impacted 377
soil showed an intermediate result with 10.7% of Zn in the pool 1 and 67.5% in the 378
pool 3. Highly significant relationships were observed between the logarithm of the 379
Zn content of pool 1 (Epool1) and pool 2 (Epool2) and the logarithm of total Zn and pH 380
(equations 6 and 7). 381
ln(Epool1)=-0.51-1.03pH+1.67ln(Zntotal), n=6, R2=0.98, SEE=0.39 (6) 382
ln(Epool2)=-2.92+0.19pH+1.03ln(Zntotal), n=6, R2=0.98, SEE=0.23 (7) 383
These equations show that the amount of Zn present in the 1st pool increases with Zn 384
inputs and decreases with pH, while the amount of Zn present in the 2nd pool 385
increases with Zn inputs and pH. 386
387
Pot experiment with T. caerulescens, calculation of the L value 388

17
The results are presented in Table 4. The biomass production of T. caerulescens was 389
similar in all soils, but the Zn content in the plant increased with soil total Zn 390
content. The L values varied between 22.2 and 32.9% of the total soil Zn content in 391
the three soils that had been polluted by organic amendments and between 33.4 and 392
56.4% of the total soil Zn content in the three soils that had been polluted by smelter 393
emissions. The L values were numerically very similar to the sum of the Zn content 394
present in the 2 first pools of the isotope exchange kinetic analysis (equations 8 and 395
9). 396
ln(L)=0.13+0.97ln(Epool1+Epool2), n=6, R2=0.99, SEE=0.08 (8) 397
ln(Epool1+Epool2)=-0.12+1.03ln(L), n=6, R2=0.99, SEE=0.08 (9) 398
This result shows that pools 1 and 2 contain the soil Zn that can be accessed by T. 399
caerulescens through diffusion and desorption. 400
401
Selective sequential extraction of 65Zn and Zn from incubated soil 402
No significant shifts in 65Zn concentration between the extracted fractions were 403
noted for all soils between 20, 85 and 120 days of incubation, with the exception of 404
the Evin and Mortagne soils in which 65Zn concentrations significantly decreased in 405
F2 while the concentration of 65Zn increased in F3 and F4. This coincides with the 406
findings of Almås et al. (1999, 2000) in which measurable levels of 65Zn were found 407
among all fractions within 7 days of soil labeling. 408
The normalized specific activities observed for each fraction are presented in 409
Table 6. A monotonous decrease down to null activities was expected from the most 410
exchangeable (F1) to the residual (F7) fraction. However, the specific activities 411
values obtained in F1 were often lower than in F2. We suggest that the relatively 412
low Zn and 65Zn concentrations extracted by the water (F1) and their high variability 413

18
might explain the difficulties in calculating correct specific activities values. If we 414
do not consider F1, a monotonous decrease is observed from F2 to F7, except for the 415
F3 extraction for the Evin and Mortagne soils. The activity is very low in the F6 416
extract and close to 0 in the F7 residual, as expected. This 65Zn tracing of the SSE 417
confirms that the chosen extractants induced a progressive removal of Zn from 418
highly exchangeable to recalcitrant species. 419
The average concentrations of Zn in the different fractions of the SSE are 420
provided in Table 5. The total amount of Zn recovered from this sequential 421
extraction ranged between 90.9 and 116% of the total Zn content measured after 422
direct digestion. Between 41.0 and 49.6% of the total Zn was extracted in the 6th 423
step (F6) in INRA, IUL SS and IUL PS soils while in the Evin and Mortagne soils 424
between 45.4 and 53.6% of the Zn was extracted in the 2nd and 3rd steps (F2-F3 425
fractions). This predominance of exchangeable species is most likely due to the 426
dissolution of smelter-inherited primary minerals (franklinite, sphalerite, willemite) 427
and redistribution in the exchangeable fractions as described by various authors 428
(Juillot et al, 2003, Manceau et al., 2000, Roberts et al., 2002). 429
Comparison between the amounts of Zn recovered in the different fractions 430
of the SSE (Table 5) and the amount of isotopically exchangeable Zn (Table 3), 431
shows that the total amount of Zn extracted during the 3 first steps (ZnF1+F2+F3) is 432
slightly higher than the amount of very rapidly exchangeable Zn (Epool1) (equations 433
10 and 11). 434
ln(ZnF1+F2+F3)=0.78+0.92ln(Epool1), n=6, R2=0.97, SEE= 0.38 (10) 435
ln(Epool1)=-0.68+1.05ln(ZnF1+F2+F3), n=6, R2=0.97, SEE=0.40 (11) 436
This suggests that these 3 first steps have extracted the entire quantity of Zn 437
isotopically exchangeable within 1 minute, and that F3 extracted a fraction of the Zn 438

19
exchangeable on the medium term. Highly significant correlations were also found 439
between ln(ZnF5+F6+F7) and ln(Epool3) (equations 12 and 13). 440
ln(ZnF5+F6+F7)=1.20+0.73ln(Epool3), n=6, R2=0.87, SEE=0.35 (12) 441
ln(Epool3)=-0.65+1.19ln(ZnF5+F6+F7), n=6, R2=0.87, SEE=0.44 (13) 442
The lower amount of Zn recovered in F5+F6+F7 compared to Epool3 suggests that a 443
fraction of very slowly or not exchangeable Zn had already been extracted in F4. 444
Since F1+F2+F3 extracted the Zn present in the pool 1 and some of the Zn present 445
in pool 2 and F5+F6+F7 extracted a fraction of the pool 3, we conclude that the 4th 446
step of the SSE solubilized both moderately and slowly exchangeable forms of Zn, 447
i.e. Zn from pools 2 and 3. 448
449
Zn K-edge EXAFS spectroscopy 450
Zinc K-edge EXAFS analysis was conducted on the Dornach and Mortagne 451
untreated samples and on the F2 and F3 residues for the Mortagne soil, and the F3, 452
F4 and F5 residues for the Dornach soil. 453
Figure 2 shows the Zn K-edge EXAFS spectra for some reference 454
compounds used in the linear combination fits, including franklinite, Zn-sorbed 455
birnessite (Mn oxide), Zn-substituted kerolite as a proxy for Zn-substituted 456
phyllosilicate, Zn/Al hydrotalcite, a zinc-aluminum hydroxycarbonate, Zn-sorbed 457
ferrihydrite, Zn-humic acid complexes (Zn-HA) at high and low Zn loading, and 458
aqueous Zn2+ as a proxy for outer sphere complexes. Franklinite is easily identified 459
by the high amplitude and multiple frequencies of its spectrum. The spectra for Zn-460
kerolite and Zn/Al hydrotalcite present some similarities, which makes their 461
distinction difficult in a mixture (Panfili et al., 2005). In the LCFs, these two 462
compounds and Zn-sorbed hectorite were grouped as "Zn-phyllosilicate”. Similarly, 463

20
the spectra for Zn-HA at low Zn loading and Zn-sorbed ferrihydrite look similar 464
because Zn is 4-fold coordinated to oxygen atoms and the second shell contribution 465
weak in the two references. Zn-HA at low Zn loading is a proxy for strongly bound 466
inner sphere Zn-organic complexes in tetrahedral configuration (Sarret et al., 1997). 467
In the LCFs, the two tetrahedral species were grouped as "tetrahedral Zn-HA and/or 468
Zn-sorbed ferrihydrite”. Another pair of similar spectra is Zn-HA at high Zn loading 469
and aqueous Zn2+ Because Zn is octahedrally coordinated, and the second shell 470
contribution either weak (Zn-HA) or absent (aqueous Zn). These species are 471
considered as representatives for less-strongly to weakly bound inner sphere Zn-472
organic complexes and outer sphere organic and inorganic complexes (Sarret et al., 473
1997). In the LCFs, these species were grouped as "weakly bound octahedral Zn”. 474
Figure 3a shows the EXAFS spectra for the untreated soil from Mortagne 475
and the two residues, and their reconstructions with four component spectra. In the 476
untreated soil (MRef), Zn is distributed as 60 ± 10 % weakly bound octahedral Zn 477
complexes, 17 ± 10 % Zn-phyllosilicate, 16 ± 10 % tetrahedral Zn-HA and/or Zn-478
sorbed ferrihydrite and 7% franklinite (Figure 3b). The detection limit for this last 479
species is less than 10% because its spectrum has a high amplitude. Zn-sorbed 480
goethite and Zn-sorbed hematite spectra were tested, but neither of them are 481
component species to the data. In a previous study on the same soil (Manceau et al., 482
2000), Zn- phyllosilicate, Zn-sorbed birnessite and Zn sorbed on iron oxyhydroxides 483
were identified as the main Zn species. Another study on a tilled soil near the 484
Mortagne area concluded to the presence of Zn outer-sphere complexes, Zn-organic 485
matter inner-sphere complexes, Zn/Al-hydrotalcite, Zn-phyllosilicate, and 486
magnetite-franklinite solid solutions (Juillot et al., 2003). The F2 extraction 487
removed 41 % of the soil Zn, and most of the weakly bound octahedral Zn pool. The 488

21
F3 extraction removed 15% of the initial soil Zn, the rest of the weakly bound pool, 489
and some of the tetrahedral pool. The Zn-phyllosilicate and franklinite pools were 490
marginally affected. The occurrence of 10-14% Zn as franklinite in the MF2 and 491
MF3 samples is attested by the sharpening of the second oscillation centered at 6 Å-492
1. In this soil the F2 and F3 extractions are relatively specific, affecting mostly the 493
weakly bound octahedral Zn pool. 494
In this soil the weakly bound octahedral Zn measured in the untreated 495
sample (784 mg Zn kg -1 soil) was identical to the IE exchangeable Zn (Epool1+Epool2, 496
786 mg Zn kg -1 soil) and to the amount of Zn extracted by the three first steps of the 497
SSE (F1+F2+F3, 729 mg Zn kg -1 soil) (Table 7). These observations suggest that 498
weakly bound octahedral Zn is the main source of available Zn in this soil which is 499
consistent with our previous EXAFS and isotopic exchange study (Sarret et al., 500
2004). 501
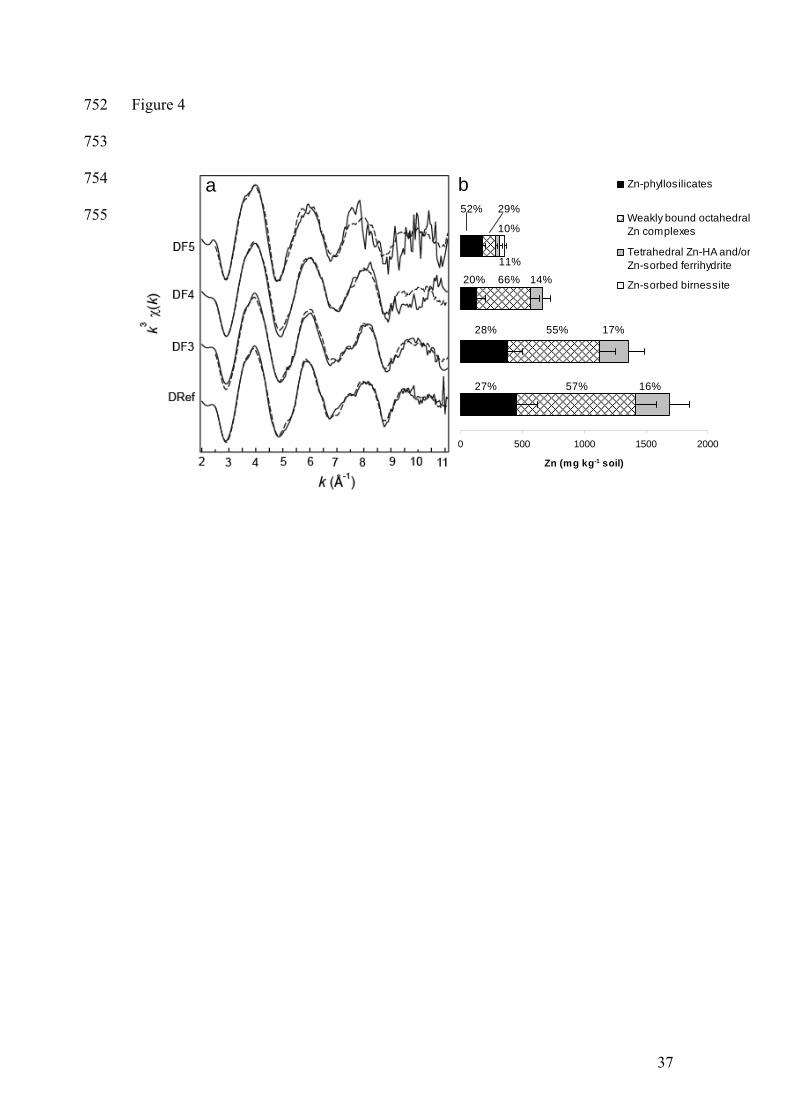
A different behavior is observed for the Dornach soil (Figure 4). Satisfactory 502
fits were obtained with three components for the untreated soil (DRef) and F3 and 503
F4 residues (DF3 and DF4), and with four components for the F5 residue (DF5). 504
The weakly bound octahedral Zn are predominant in the Dornach soil (57 ± 10 %) 505
followed by Zn-phyllosilicate (27 ± 10 %), and tetrahedral Zn-HA and/or Zn-sorbed 506
ferrihydrite (16 ± 10 %). The proportions of Zn species did not change statistically 507
in DF3 and DF4, which suggests that all species were affected to a similar extent by 508
the F3 and F4 treatments (removal of 19 and 41 % of total soil Zn, respectively). 509
The F5 extraction (removal of 19% total soil Zn) targeted preferentially the "weakly 510
bound octahedral Zn" pool. As a consequence, Zn-phyllosilicate was the major 511
species in the DF5 residue. The DF5 spectrum was simulated with Zn-hectorite, 512
whereas DRef, DF3 and DF4 were simulated with Zn-kerolite and/or Zn/Al 513

22
hydrotalcite. Indeed, the third oscillation of the DF5 and Zn-hectorite spectra have 514
the same shape, whereas the shoulder between 7.0 and 7.5 Å-1 in DRef corresponds 515
to a high amplitude feature in Zn-kerolite and/or Zn/Al hydrotalcite spectra (Figures 516
2 and 4a). Therefore, the local environment of Zn seems to have evolved during the 517
selective sequential extraction. A finer description of the nature and structure of 518
these species would require studying the < 2 µm or < 0.2 µm soil fractions by 519
polarized EXAFS (Manceau et al., 2000). A new species is detected in DF5, Zn-520
sorbed birnessite. This species was probably present in the previous samples 521
including those from Mortagne as shown by micro-EXAFS (Manceau et al., 2000), 522
but as a minor component masked by the predominant species. Chemical extractions 523
lacked selectivity in the Dornach soil because the fractional amount of the major 524
species remained unchanged in DF3 and DF4 despite a removal of 19 and 41% of 525
the soil Zn. The weakly bound octahedral Zn complexes which were extracted 526
completely after the third extraction step in Mortagne soil remained predominant in 527
DF3 and DF4. 528
In Dornach the weakly bound octahedral Zn measured in the untreated 529
sample (962 mg Zn kg -1 soil) was similar to the Zn extracted by the four first steps 530
of the SSE (F1+F2+F3+F4, 1023 mg Zn kg -1 soil), but was much higher than the IE 531
exchangeable Zn (Epool1+Epool2, 549 mg Zn kg -1 soil), which itself was also higher 532
than the amount of Zn extracted by the three first steps of the SSE (F1+F2+F3, 326 533
mg Zn kg -1 soil) (Table 7). Although Dornach exhibited a high proportion of 534
weakly bound octahedral Zn, only a small proportion of it was extracted by the 3 535
first extractions of the SSE (22%). We suggest that the IE Zn and the Zn extracted 536
by the 3 first steps of the SSE was indeed present as weakly bound octahedral Zn, 537
but a large fraction of these so-called weakly bound species were neither IE 538

23
exchangeable nor extractable by the three first steps of the SSE. The different 539
behavior of Zn in Dornach and Mortagne may be explained by the difference in soil 540
pH (6.7 for Dornach and 5.1 for Mortagne) and in soil organic matter content (11% 541
for Dornach and 1% for Mortagne) because inner-sphere mineral surface complexes 542
and organically-bound cationic species are more strongly retained at near neutral 543
than at acidic pH. Altogether these results suggest that isotopically exchangeable Zn 544
and therefore available Zn is present as weakly bound octahedral Zn species but that 545
the proportion of weakly bound octahedral Zn that can exchange with Zn2+ in the 546
solution decreases when soil pH and organic matter content increase. 547
548
Conclusion 549
The combination of techniques used in this work (isotopic exchange kinetics, pot 550
experiment with T. caerulescens on soil labeled with 65Zn, selective sequential 551
extraction carried out on 65Zn labeled soils, and EXAFS spectroscopy) gave 552
comprehensive information on the forms and availability of Zn in these heavy metal 553
polluted soils. The main results of this study are summarized in the Table 7. 554
Our results allowed quantifying the number of compartments containing IE 555
Zn in these soils. Three pools were derived from this analysis, the amount of Zn 556
exchangeable within 1 minute (1st pool), the amount of Zn exchangeable between 1 557
minute and apparent isotopic equilibrium (2nd pool) and the amount of Zn that could 558
not be exchanged during the IE kinetic experiment (3rd pool). The experiment 559
conducted with T. caerulescens confirmed that the amount of IE Zn measured in pot 560
experiments was similar to the sum of Zn content present in the 1st and 2nd pools, i.e. 561
that this plant had only access the IE forms of Zn. 562
24
The use of the SSE on 65Zn labeled soils showed that the 3 first extractions 563
(F1, F2 and F3) solubilized the amount of Zn present in the 1st pool and a slight 564
fraction of the Zn present in the 2nd pool. The three last fractions of the SSE (F5, F6 565
and F7) solubilized the Zn from the 3rd pool. We deduced from these observations 566
that the 4th extraction of the SSE solubilized the Zn from the 2nd pool and a fraction 567
of the Zn from the 3rd pool. 568
Finally, EXFAS spectroscopy showed that the 3 first extractions of the SSE 569
solubilized all the weakly bound octahedral Zn in the Mortagne soil, i.e. that the 1st 570
pool was dominated by these Zn species. In Dornach the 5 first extractions of the 571
SSE were necessary to solubilize the weakly bound octahedral Zn. We suggest that 572
in Dornach most of the weakly bound octahedral Zn was not IE nor extractable in 573
the 3 first steps of the SSE. The difference between Mortagne and Dornach could 574
be explained by the highest pH and soil organic matter content of the latter. 575
Altogether these results suggest that isotopically exchangeable Zn and therefore 576
available Zn is present as weakly bound octahedral Zn species but that the 577
proportion of weakly bound octahedral Zn that can exchange with Zn2+ in the 578
solution decreases when soil pH and organic matter content increase. 579
580
Acknowledgements 581
We thank R. Kretzschmar (ETH Zürich) for providing samples of the Dornach and 582
Evin soils, F. van Oort (INRA Versailles) for contributing the Mortagne soil, T. 583
Rösch for her measurements on the ICP, E. Grieder (EAWAG, Dübendorf) for his 584
many hours of gamma measurements, M. Lanson for the preparation of Zn-HA 585
complexes, N. Geoffroy for his help during the EXAFS measurements, the kind 586
support of the staff at beam line ID-26, ESRF (Grenoble) and two anonymous 587
25
reviewers for their constructive remarks. This study was made possible by beam 588
time granted through the European Synchrotron Radiation Facility (ESRF) and 589
funding from the research commission of the ETH, Zürich (TH project n° 8086). 590
591
References 592
Ahnstrom, Z.A.S. & Parker, D.R. 2001. Cadmium reactivity in metal contaminated-593
soils using a coupled stable isotope dilution-sequential extraction procedure. 594
Environmental Science & Technology, 35, 121-126. 595
Almås, Å.R., Salbu, B. & Singh, B.R. 2000. Changes in partitioning of cadmium-596
109 and zinc-65 in soil as affected by organic matter addition and 597
temperature. Soil Science Society of America Journal, 64, 1951-1958. 598
Almås, Å.R., Singh, B.R. & Salbu, B. 1999. Mobility of cadmium-109 and zinc-65 599
in soil influenced by equilibration time, temperature, and organic matter. 600
Journal of Environmental Quality, 28, 1742-1750. 601
Arias, M., Pérez-Novo, C., Osorio, F., Lopez, E. & Soto, B. 2005. Adsorption and 602
desorption of copper and zinc in the surface layer of acid soils. Geoderma, 603
288, 21-29. 604
Ayoub, A.S., McGaw, B.A., Shand, C.A. & Midwood, A.J. 2003. Phytoavailability 605
of Cd and Zn in soil estimated by stable isotope exchange and chemical 606
extraction. Plant and Soil, 252, 291-300. 607
Cardellicchio, N., Cavalli, S., Ragone, P. & Riviello, J.M. 1999. New strategies for 608
determination of transition metals by complexation ion-exchange 609
chromatography and post column reaction. Journal of Chromatography A, 610
847, 251-259. 611
26
Chapman, H. D. & Pratt, P. F. 1961. Methods of analysis for soils, plants, and 612
waters, pp. 169-170. University of California, Division of Agriculture 613
Sciences, Riverside, CA, USA. 614
Cobelli, C., Foster, D. & Toffolo, G. 2000. Tracer Kinetics in Biomedical Research 615
from Data to Model. Kluwer Academic, Plenum Publishers, New York. 616
Degryse, F., Broos, K., Smolders, E. & Merckx, R. 2003. Soil solution 617
concentration of Cd and Zn can be predicted with a CaCl2 soil extract. 618
European Journal of Soil Science, 54, 149-157. 619
FAL, RAC & FAW. 1996. Schweizerische Referenzmethoden der Eidgenössischen 620
Forschungsanstalten, Band 1-4. Eidgenössischen Forschungsanstalten FAL, 621
RAC and FAW, Zürich, Changins, Wädenswil, Switzerland 622
Fardeau, J.C. 1993. Le phosphore assimilable des sols: sa représentation par un 623
modèle fonctionnel à plusieurs compartiments. Agronomie, 13, 317-331. 624
Geiger, G., Federer, P. & Sticher, H. 1993. Reclamation of Heavy-Metal 625
Contaminated Soils - Field Studies and Germination Experiments. Journal of 626
Environmental Quality, 22, 201-207. 627
Juillot, F., Morin, G., Ildefonse, P., Trainor, T.P., Benedetti, M., Galoisy, L., Calas, 628
G. & Brown, G.E. 2003. Occurrence of Zn/Al hydrotalcite in smelter-629
impacted soils from northern France: Evidence from EXAFS spectroscopy 630
and chemical extractions. American Mineralogist, 88, 509-526. 631
Laboratoire de Spectrochimie Infrarouge et Raman (LASIR). 2000. Rapport 632
d'activités 1997-2000. Université des Sciences et Technologies de Lille, 633
Villeneuve d’Ascq, France p57. 634

27
Loeppert, R.L. & Inskeep, W.P. 1996. Iron. In: Methods of soil analysis. Part 3. 635
Chemical Methods (ed. P.J. Sparks), pp. 639-664. SSSA Book Series: 5. 636
SSSA, Madison, Wisconsin. 637
Lorentzen, E.M.L. & Kingston, H.M. 1996. Comparison of microwave-assisted and 638
conventional leaching using EPA method 3050B. Analytical Chemistry, 68, 639
4316-4320. 640
Manceau, A., Marcus, M. A. & Tamura N. 2002. Quantitative speciation of heavy 641
metals in soils and sediments by synchrotron X-ray techniques. In 642
Applications of Synchrotron Radiation in Low-Temperature Geochemistry 643
and Environmental Science, Vol. 49 (eds. P. Fenter, M. Rivers, N. Sturchio, 644
& S. Sutton), pp. 341-428. Reviews in Mineralogy and Geochemistry, 645
Mineralogical Society of America. Washington DC. 646
Manceau, A., Lanson, B., Schlegel, M.L., Harge, J.C., Musso, M., Eybert-Berard, 647
L., Hazemann, J.L., Chateigner, D. & Lamble, G.M. 2000. Quantitative Zn 648
speciation in smelter-contaminated soils by EXAFS spectroscopy. American 649
Journal of Science, 300, 289-343. 650
Manceau, A., Tamura, N., Celestre, R.S., MacDowell, A. A., Geoffroy, N., Sposito, 651
G. & Padmore, H.A. 2003. Molecular-scale speciation of Zn and Ni in soil 652
ferromanganese nodules from loess soils of the Mississippi basin. 653
Environmental Science & Technology, 37, 75-80. 654
Nolan, A.L., Zhang, H. & McLaughlin, M.J. 2005. Prediction of Zinc, Cadmium, 655
Lead, and Copper availability to wheat in contaminated soils using chemical 656
speciation, diffusive gradients in thin films, extraction, and isotopic dilution 657
techniques. Journal of Environmental Quality, 34, 496-507. 658

28
Panfili, F.R., Manceau, A., Sarret, G., Spadini, L., Kirpichtchikova, T., Bert, V., 659
Laboudigue, A., Marcus, M.A., Ahamdach, N. & Libert, M.F. 2005. The 660
effect of phytostabilization on Zn speciation in a dredged contaminated 661
sediment using scanning electron microscopy, X-ray fluorescence, EXAFS 662
spectroscopy, and principal components analysis. Geochimica et 663
Cosmochimica Acta, 69 (9): 2265-2284 664
Ressler, T. 2000. WinXAS version 2.0. Livermore, CA, USA. 665
Roberts, D.R., Scheinost, A.C. & Sparks, D.L. 2002. Zinc speciation in a smelter-666
contaminated soil profile using bulk and microspectroscopic techniques. 667
Environmental Science & Technology, 36, 1742-1750. 668
Salbu, B., Krekling, T. & Oughton, D.H. 1998. Characterisation of radioactive 669
particles in the environment. Analyst, 123, 843-849. 670
Sarret, G., Balesdent, J., Bouziri, L., Garnier, J., Marcus, M., Geoffroy, N., Panfili, 671
F. & Manceau, A. 2004. Zn speciation in the organic horizon of a 672
contaminated soil by micro X-ray fluorescence, micro and powder EXAFS 673
spectroscopy and isotopic dilution. Environmental Science & Technology, 674
38, 2792 -2801. 675
Sarret, G., Manceau, A., Hazemann, J.L., Gomez A. & Mench, M. 1997. EXAFS 676
study of the nature of zinc complexation sites in humic substances as a 677
function of Zn concentration. Journal de Physique iv, 7, 799-802. 678
Scheinost, A.C., Kretzschmar, R. & Pfister, S. 2002. Combining selective sequential 679
extractions, x-ray absorption spectroscopy, and principal component analysis 680
for quantitative zinc speciation in soil. Environmental Science & 681
Technology, 36, 5021-5028. 682

29
Schlegel, M. L., Manceau, A., Charlet, L., Chateigner D. & Hazemann, J. L. 2001. 683
Sorption of metal ions on clay minerals. III. Nucleation and epitaxial growth 684
of Zn phyllosilicate on the edges of hectorite. Geochimica Et Cosmochimica 685
Acta 65 (22), 4155-4170. 686
Schlegel, M.L. & Manceau, A. 2006. Evidence for the nucleation and epitaxial 687
growth of Zn phyllosilicate on montmorillonite. Geochimica Et 688
Cosmochimica Acta, 70, 901-917. 689
Siegenthaler, A., Häni, H. & Stauffer, W. 1999. Effect of high sewage sludge and 690
pig slurry application. Agrarforschung, 6(5), 1-8. 691
Sinaj, S., Mächler, F. & Frossard, E. 1999. Assessment of isotopically exchangeable 692
zinc in polluted and nonpolluted soils. Soil Science Society of America 693
Journal, 63, 1618-1625. 694
Sinaj, S., Dubois, A. & Frossard, E. 2004. Soil isotopically exchangeable zinc: a 695
comparison between E and L values. Plant and Soil, 261, 17-28. 696
Smith, F. W. 1981. Availability of soil phosphate to tropical pasture species. In: 697
Proceedings of XIV International Grassland Congress Lexington, KY USA 698
(ed. by A. J. Smith & V. W. Hays). Westview press, Bolder, CO USA. 699
Thiry, M., Huet-Taillanter, S. & Schmitt, J.M. 2002. The industrial waste land of 700
Mortagne-du-Nord (59) - I - Assesment, composition of the slags, 701
hydrochemistry, hydrology and estimate of the outfluxes. Bulletin de la 702
Société Géologique de France, 173, 369-381. 703
Weissenhorn, I., Mench, M. & Leyval, C. 1995. Bioavailability of Heavy-Metals 704
and Arbuscular Mycorrhiza in a Sewage-Sludge-Amended Sandy Soil. Soil 705
Biology & Biochemistry, 27, 287-296. 706

30
Young, S.D., Tye, A., Carstensen, A., Resende, L. & Crout, N. 2000. Methods for 707
determining labile cadmium and zinc in soil. European Journal of Soil 708
Science, 51 (1), 129-136 709
Young, S.D., Zhang, H., Tye, A.M., Maxted, A., Thums, C. & Thorton, I. 2006. 710
Characterizing the availability of metals in contaminated soils. I. The solid 711
phase: sequential extraction and isotopic dilution. Soil Use and Management, 712
21, 450-458 713
31
Figure Captions 714
Figure 1 Change in the fraction of radioactivity remaining in solution (rt/R) during 715
14 days in six soils that have been polluted with heavy metals (1a INRA soil, 1b 716
IUL SS soil, 1c IUL PS soil, 1d Evin soil, 1e Dornach soil, 1f Mortagne soil). The 717
points represent the experimental data, the solid line the values predicted from the 718
model developed for each soil, and the dotted lines the 80% confidence limits of the 719
model. 720
721
Figure 2 Zn K-edge EXAFS spectra (χ(k) k3, with k: wave number) of reference Zn 722
compounds used to model the spectra for the soils and extraction residues: 723
Franklinite (ZnFe2O4), Zn-sorbed birnessite (adsorption at pH 4, Zn/Mn = 0.134) 724
(Manceau et al., 2000), Zn-substituted phyllosilicate ((Zn, Mg) kerolite 725
Zn2.1Mg0.9Si4O10(OH)2, nH2O, Schlegel and Manceau, 2006 and Zn-substituted 726
hectorite, Schlegel et al., 2001), Zn/Al hydrotalcite (Zn2Al(OH)6(CO3)0.5, n H2O), 727
Zn-sorbed ferrihydrite containing 1500 mg kg-1 Zn (Manceau et al., 2000), Zn-728
humic acid complexes at low (600 mg kg-1 Zn) and high (3.2 % Zn) Zn loading 729
(Sarret et al., 1997), and aqueous Zn (pH 4). 730
731
Figure 3 a) Zn K-edge EXAFS spectra (solid line) and linear combination fit 732
(dashed line) for the Mortagne untreated reference soil (MRef), for the residue left 733
after the second (MF2) and third (MF3) extraction of the SSE. b) Distribution of Zn 734
species derived from the fits. The error bars correspond to 10% of total Zn content. 735
736
Figure 4 a) Zn K-edge EXAFS spectra (solid line) and linear combination fits 737
(dashed line) for the Dornach untreated reference soil (DRef), for the residue left 738

32
after the third (DF3), fourth (DF4) and fifth (DF5) extraction of the SSE. b) 739
Distribution of Zn species derived from the fits. The error bars correspond to 10% of 740
total Zn content. 741

33
Figure 1 742
0.01
0.1
10 5000 10000 15000 20000 25000
minutes
r t /R
Fig 1.a INRA soil
743
0.001
0.01
0.1
10 5000 10000 15000 20000 25000
minutes
r t /R
Fig 1.b IUL SS soil
744
0.1
10 5000 10000 15000 20000 25000
minutes
r t /R
Fig 1.c IUL PS soil
745

34
0.1
10 5000 10000 15000 20000 25000
minutes
r t /R Fig 1.d Evin soil
746
0.001
0.01
0.1
10 5000 10000 15000 20000 25000
minutes
r t /R
Fig 1.e Dornach soil 747
0.1
10 5000 10000 15000 20000 25000
minutes
r t /R
Fig 1.f Mortagne soil 748

35
Figure 2 749
750

36
Figure 3 751
0 500 1000 1500 2000
MRef
MF2
MF3
Zn (mg kg-1 soil)
Franklinite
Zn-phyllosilicates
Weakly bound octahedral ZncomplexesTetrahedral Zn-HA and/or Zn-sorbed ferrihydrite
7% 60% 16%
25%
32% 33%
42%
44%14%
17%
10%
a b
37
Figure 4 752
753
754
755
0 500 1000 1500 2000
Dref
DF3
DF4
DF5
Zn (mg kg-1 soil)
Zn-phyllosilicates
Weakly bound octahedralZn complexes
Tetrahedral Zn-HA and/orZn-sorbed ferrihydrite
Zn-sorbed birnessite
27% 57% 16%
28% 55% 17%
20% 66% 14%
52% 29%
10%
11%
a b

38
Table 1 Selected characteristics of the six soils polluted with heavy metals 756 757
Characteristic INRA IUL SS IUL PS Evin Dornach Mortagne
Soil type Eutric Fluvisol Orthic Luvisol Orthic Luvisol Gleyic Luvisol Calcaric Regosol Dystric Cambisol Pollutant source Sewage Sludge Sewage Sludge Pig Slurry Pb/Zn Smelter Cu/Ni/Zn Smelter Zn Smelter Land use arable Arable Arable forest grassland grassland Sampling depth / cm 0-20 0-20 0-20 2-5 2-5 5-40 Sand / %a 80 57 58 28 15 66 Clay / %a 7 15 15 20 37 7 Organic matter / %b 2 3 2 4 11 1 CaCO3 / %c n.d. n.d. n.d. n.d. 5 n.d. Oxalate extractable Fe / g kg-1 soild 2.14 11.11 5.11 3.17 2.70 1.88 EDTA extractable Zn / mg kg-1 soile 166 15 9 435 349 406 pHf 5.7 6.0 4.6 5.0 6.7 5.1 CEC / mmolc kg-1g 101 164 161 185 432 67 Base saturation / %g 47.8 17.5 45.2 85.6 42.2 18.8 Total Zn / mg kg-1 soili 680 (5.4) 162 (0.5) 87.9 (1.7) 1647 (3.1) 1687 (3.1) 1307 (8.7) n.d. non detectable a Soil texture was measured via sedimentation with (NaPO4)6 as a dispersion agent (FAL, RAC & FAW, 1996). b Organic matter was measured by titration (FAL, RAC & FAW, 1996). c CaCO3 was quantified using concentrated HCl (FAL, RAC & FAW, 1996). d Oxalate extractable Fe was determined according to Loeppert and Inskeep (1996). e EDTA-NH4Ac extractions were performed using 50ml of extractant added to 10g dry soil (FAL, RAC & FAW, 1996). f pH was measured using a 1:2.5 soil solution ratio of 0.01M CaCl2 after 24 hours of gentle shaking. g CEC and base saturation were determined using BaCl2 method (FAL, RAC & FAW, 1996). i Total Zn obtained after direct digestion (n=3) and standard error (in parentheses). 758
39
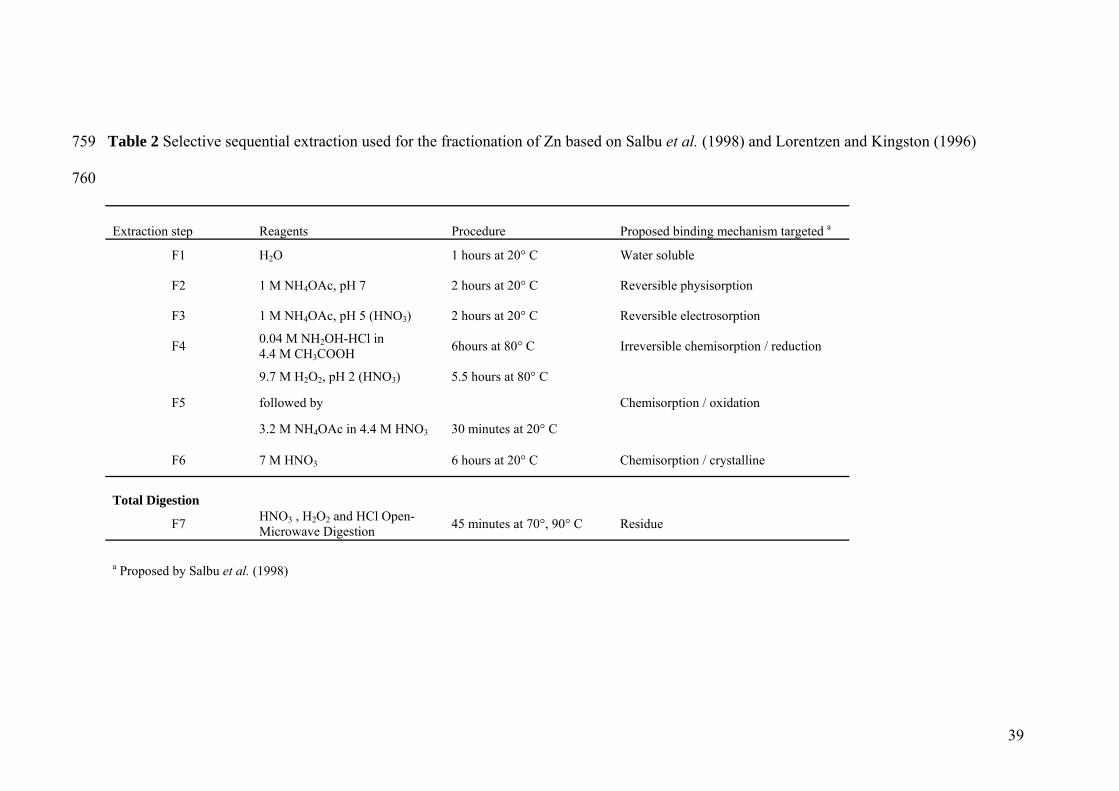
Table 2 Selective sequential extraction used for the fractionation of Zn based on Salbu et al. (1998) and Lorentzen and Kingston (1996) 759
760
Extraction step Reagents Procedure Proposed binding mechanism targeted a
F1 H2O 1 hours at 20° C Water soluble
F2 1 M NH4OAc, pH 7 2 hours at 20° C Reversible physisorption
F3 1 M NH4OAc, pH 5 (HNO3) 2 hours at 20° C Reversible electrosorption
F4 0.04 M NH2OH-HCl in 4.4 M CH3COOH 6hours at 80° C Irreversible chemisorption / reduction
9.7 M H2O2, pH 2 (HNO3) 5.5 hours at 80° C
F5 followed by Chemisorption / oxidation
3.2 M NH4OAc in 4.4 M HNO3 30 minutes at 20° C
F6 7 M HNO3 6 hours at 20° C Chemisorption / crystalline
Total Digestion
F7 HNO3 , H2O2 and HCl Open-Microwave Digestion 45 minutes at 70°, 90° C Residue
a Proposed by Salbu et al. (1998)
40
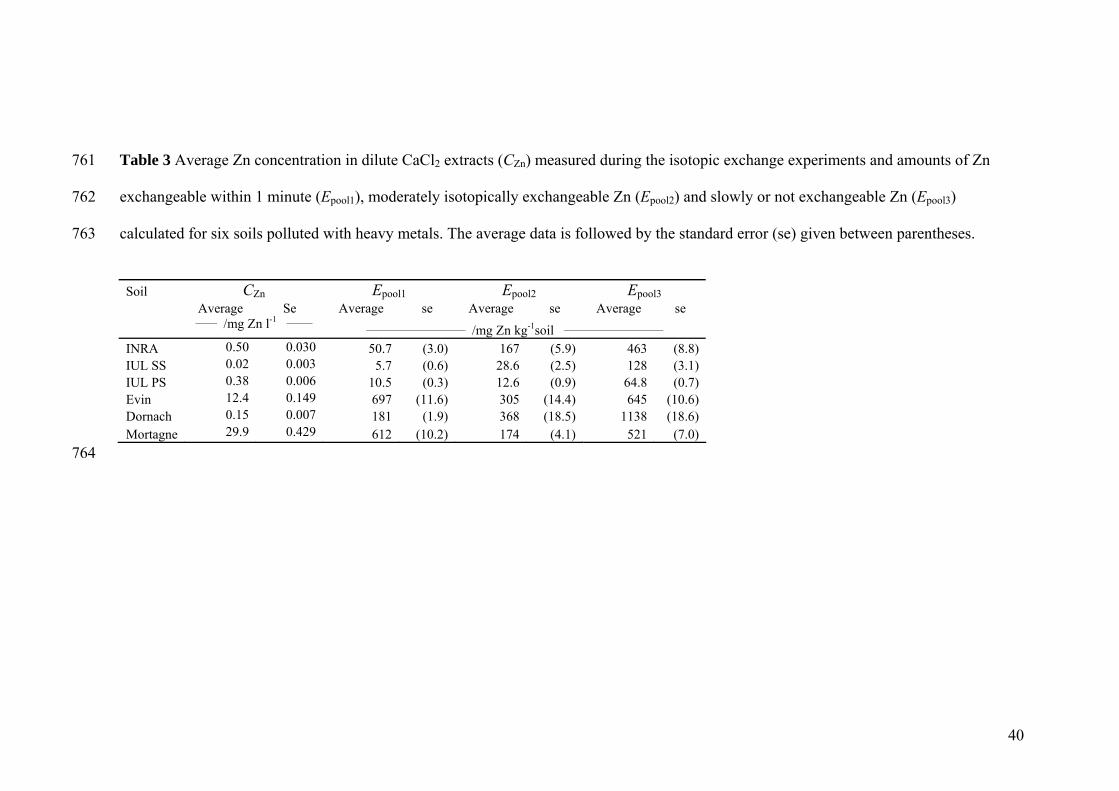
Table 3 Average Zn concentration in dilute CaCl2 extracts (CZn) measured during the isotopic exchange experiments and amounts of Zn 761
exchangeable within 1 minute (Epool1), moderately isotopically exchangeable Zn (Epool2) and slowly or not exchangeable Zn (Epool3) 762
calculated for six soils polluted with heavy metals. The average data is followed by the standard error (se) given between parentheses. 763
Soil CZn Epool1 Epool2 Epool3 Average Se Average se Average se Average se
_____ /mg Zn l-1 ______
_______________________ /mg Zn kg-1soil _______________________ INRA 0.50 0.030 50.7 (3.0) 167 (5.9) 463 (8.8) IUL SS 0.02 0.003 5.7 (0.6) 28.6 (2.5) 128 (3.1) IUL PS 0.38 0.006 10.5 (0.3) 12.6 (0.9) 64.8 (0.7) Evin 12.4 0.149 697 (11.6) 305 (14.4) 645 (10.6) Dornach 0.15 0.007 181 (1.9) 368 (18.5) 1138 (18.6) Mortagne 29.9 0.429 612 (10.2) 174 (4.1) 521 (7.0)
764

41
Table 4 Average values for plant aerial dry matter, Zn content of aerial parts and L value measured with Thlaspi caerulescens in six soils 765
polluted with heavy metals. The standard errors (se) are given between parentheses. 766
767
Soil Yield Plant Zn content L value Average se Average se Average se / g DM kg-1 soil / g kg-1 DM / mg Zn kg-1 soil INRA 16.5 (0.5) 0.4 (0.1) 224 (14.0) IUL SS 23.4 (0.3) 1.2 (0.1) 36 (0.2) IUL PS 20.6 (1.1) 1 (0.1) 22.6 (0.7) Evin 21.7 (0.4) 4 (0.5) 828 (14.1) Dornach 20.4 (0.8) 2.2 (0.5) 564 (0.8) Mortagne 21.7 (0.7) 5.9 (0.3) 737 (4.7)

42
Table 5 Average amount of Zn recovered in the different fractions of the selective sequential extraction after 20, 85 and 120 days of 768
incubation in six soils polluted by heavy metals. The results are expressed in mg Zn kg-1 soil and the standard errors (se) are given between 769
parentheses. 770
771
Fractions INRA IUL SS IUL PS Evin Dornach Mortagne Average se Average se Average se Average se Average se Average se
_____________________________________________________________________ /mg Zn kg-1soil _____________________________________________________________________ F1 2 (0.5) 0.2 (0.1) 1.2 (0.5) 23.7 (6.8) 1.2 (0.5) 28.1 (3.8) F2 26.7 (1.8) 1.8 (0.2) 2.5 (0.2) 499 (27.9) 78.7 (4.2) 505 (26.0) F3 103 (11.7) 10.4 (1.6) 8 (0.9) 248 (2.9) 246 (23.4) 195 (4.8) F4 217 (10.0) 55.1 (3.5) 19.8 (1.0) 362 (22.1) 696 (44.8) 285 (20.1) F5 71.6 (21.5) 24.4 (2.3) 11.2 (1.6) 256 (18.1) 317 (48.9) 64 (11.0) F6 279 (38.6) 74.9 (10.6) 43.6 (4.9) 256 (36.8) 165 (37.6) 101 (11.9) F7 10.1 (2.2) 21.4 (2.7) 12.0 (2.9) 45.0 (10.9) 28.9 (5.1) 26.2 (4.8) Total extracted 709 (19.5) 188 (12.6) 98.2 (6.0) 1690 (42.3) 1533 (64.5) 1205 (51.2)
772
773
774

43
Table 6 Mean specific activities calculated for each fraction of the selective sequential extraction over 120 days for 6 soils polluted with 775
heavy metals. The values for each fraction are normalized by the 65Zn introduced and the total soil Zn. Standard errors (se) are given 776
between parentheses. 777
778
Fraction INRA IUL SS IUL PS Evin Dornach Mortagne Average se Average se Average se Average se Average se Average se F1 1.95 (0.21) 1.15 (0.16) 2.42 (0.86) 1.32 (0.38) 1.22 (0.43) 1.10 (0.16) F2 2.51 (0.05) 4.24 (0.12) 3.54 (0.28) 1.53 (0.12) 2.10 (0.29) 1.25 (0.05) F3 2.26 (0.11) 3.48 (0.26) 3.10 (0.17) 1.65 (0.10) 1.80 (0.06) 1.27 (0.05) F4 1.67 (0.10) 1.89 (0.19) 2.27 (0.17) 1.00 (0.11) 0.70 (0.04) 0.58 (0.08) F5 0.49 (0.06) 0.38 (0.01) 0.47 (0.02) 0.37 (0.06) 0.42 (0.06) 0.17 (0.03) F6 0.01 (0.01) 0.07 (0.02) 0.08 (0.02) 0.12 (0.03) 0.22 (0.08) 0.04 (0.01) F7 0.01 (0.01) 0.02 (0.01) 0.02 (0.01) 0.04 (0.02) 0.08 (0.02) 0.01 0.00)
779

44
Table 7 Comparison of the data obtained by the various techniques 780 781 Soil INRA IUL-SS IUL-PS Evin Dornach Mortagne Total Zn / mg Zn kg soil-1 680 162 87.9 1647 1687 1307
pH 5.7 6.0 4.6 5.0 6.7 5.1 Concentration of Zn in CaCl2; CZn / mg Zn l-1
0.50 0.01 0.38 12.3 0.15 29.9
Epool1/ Epool2 /Epool3 / mg Zn kg soil-1 50.7 / 167 / 463 5.7 / 28.6 / 128 10.5 / 12.6 / 64.8 697 / 305 / 645 181 / 368 / 1138
612 / 174 / 521
L values / mg Zn kg soil-1 224 36 22.6 828 564 737
Extraction steps, by decreasing order of Zn recovery
F6>F4>F3> F5>F2>F7>F1
F6>F4>F5> F7>F3>F2>F1
F6>F4>F7> F5>F3>F2>F1
F2>F4>F6-F5>
F3>F7>F1 F4>F5>F3> F6>F2>F7>F1 F2>F4>F3> F6>F5>F1>F7
Distribution of Zn species in the untreated soil / % a
57% weakly bound octahedral Zn + 27% Zn- phyllosilicates + 16% tetrahedral Zn-HA and/or Zn-sorbed ferrihydrite
60% weakly bound octahedral Zn + 17% Zn- phyllosilicates + 16% tetrahedral Zn-HA and/or Zn-sorbed ferrihydrite + 7% franklinite
Comparison of results obtained by the different methods / mg Zn kg soil-1
F1+F2+F3+F4 (1023) = weakly bound octahedral Zn (962) > Epool1+ Epool2 (549) > F1+F2+F3 (326)
F1+F2+F3+F4 (1014) > weakly bound octahedral Zn (784) = Epool1+ Epool2 (786) = F1+F2+F3 (729)
a Determined only for Dornach and Mortagne soils. 782 783


![V. SPECIATION A. Allopatric Speciation B. Parapatric Speciation (aka Local or Progenitor - Derivative) C. Adaptive Radiation D. Sympatric Speciation [Polyploidy]](https://img.pdfslide.us/doc/110x75/56649d3f5503460f94a186e2/v-speciation-a-allopatric-speciation-b-parapatric-speciation-aka-local.jpg)