Embed Size (px)
Citation preview

8/3/2019 Zigmantas Jankauskas, Vygaudas Kvedaras and Valentinas Zaveckas- Measurement of the bandwidth of Helicon M…
http://slidepdf.com/reader/full/zigmantas-jankauskas-vygaudas-kvedaras-and-valentinas-zaveckas-measurement 1/4
MEASUREMENT SCIENCE REVIEW, Volume 5, Section 3, 2005
63
Measurement of the bandwidth of Helicon Maser
Zigmantas Jankauskas, Vygaudas Kvedaras, Valentinas Zaveckas
Department of Electrical Engineering, Vilnius Gediminas Technical University,
Sauletekio av. 11, LT-10223 Vilnius – 40, Lithuania. Phone 370-5-2744762. E-
mail: [email protected]
Abstract . Radio frequency (RF) magnetoplasmic waves known as helicons will propagatein solid - state plasmas of metals and semiconductors when a strong magnetic field is
applied. In Helicon Maser (HM) the helicons are exited by RFs much higher than the
helicon generation frequency. The higher frequency e/m field may be called a pumping field. In analogy with the usual maser (or laser) the magnetized semiconductor sample
plays the role of active material and the connecting cable – the role of high qualityexternal resonator. The bandwidth of HM is much narrower than in case of isolated
sample (the same situation as in case of laser). The new method of HM bandwidth
measurement is considered. InSb and Ge were used for active materials. The constant magnetic field varied within the interval 0 – 23 Tesla.
Keywords: Helicon Maser; Magnetoplasmic waves; Microwave resonator.
1. Introduction
Helicons are magnetoplasmic waves propagating in semiconductors and metals when a
strong magnetic field is applied. In our paper [1] the construction of Helicon Maser (HM)was described. The generation of helicons in the HM was obtained by the help of maser
effect when the magnetoplasmic waves were excited by radio frequencies (the range 1000
MHz) much higher than the helicon generation frequency (main peak at 20 MHz). The
higher frequency field may be called a pumping field. In analogy with the usual maser (or
laser) the semiconductor sample plays the role of an active material and the connecting
cable – the role of high quality external resonator. The bandwidth of the HM is much
narrower than the bandwidth of isolated sample (the same situation as in case of laser).
The HM may be used for the contactless measurement of carrier density and mobility in
semiconductors and semiconductors, RF antenna modelling, investigation of self –
focusing and difraction of e/m waves, etc [2].
The measurement of the HM bandwidth in working mode is rather complicated as the
duration of helicon impulse is about 10 msec. In this paper the new experimental method
of the HM bandwidth measurement is described.
2. Subject and Methods
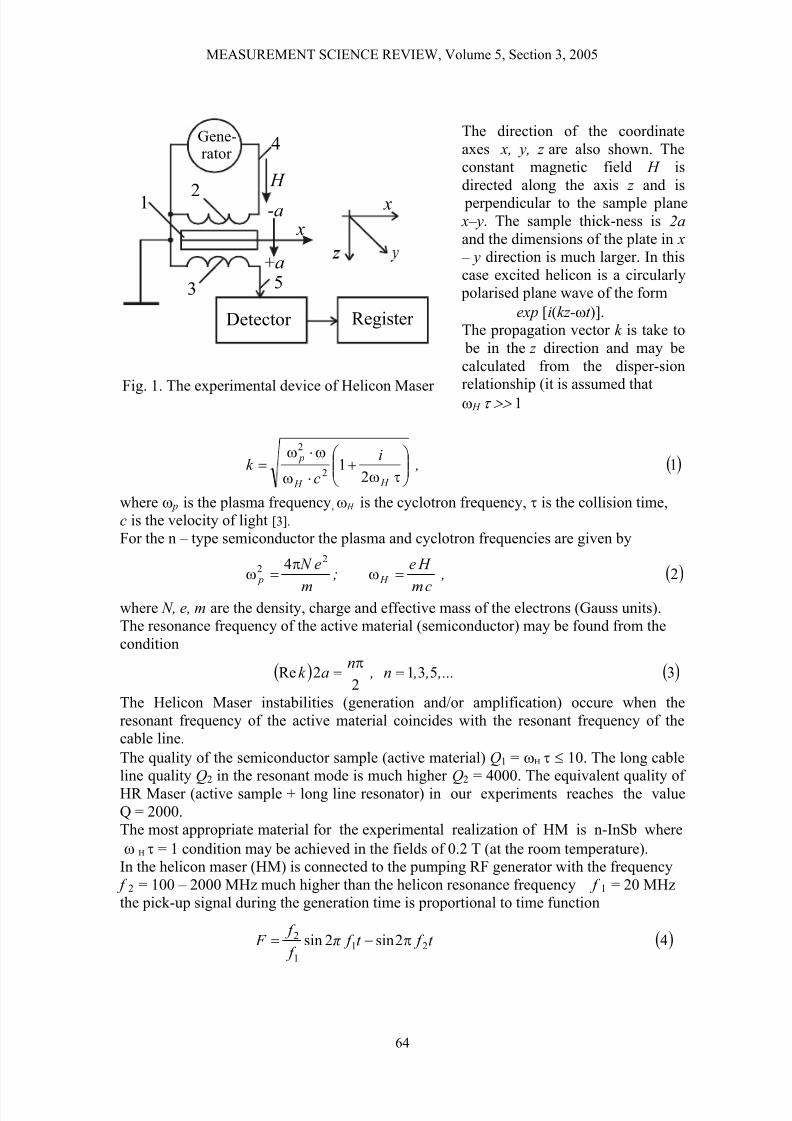
The block diagram of the Helicon Maser is shown in Fig.1. Here 1 is semiconductor
sample in the form of plate; 2 is excitation coil; 3 is pickup coil; 4 and 5 are the coaxial
cable lines.
8/3/2019 Zigmantas Jankauskas, Vygaudas Kvedaras and Valentinas Zaveckas- Measurement of the bandwidth of Helicon M…
http://slidepdf.com/reader/full/zigmantas-jankauskas-vygaudas-kvedaras-and-valentinas-zaveckas-measurement 2/4
MEASUREMENT SCIENCE REVIEW, Volume 5, Section 3, 2005
64
The direction of the coordinate
axes x, y, z are also shown. The
constant magnetic field H is
directed along the axis z and is
perpendicular to the sample plane
x–y. The sample thick-ness is 2a
and the dimensions of the plate in x
– y direction is much larger. In this
case excited helicon is a circularly
polarised plane wave of the form
exp [i(kz-ωt )].The propagation vector k is take to
be in the z direction and may be
calculated from the disper-sion
relationship (it is assumed thatω H τ >> 1
where ω p is the plasma frequency, ω H is the cyclotron frequency, τ is the collision time,
c is the velocity of light [3].For the n – type semiconductor the plasma and cyclotron frequencies are given by
where N, e, m are the density, charge and effective mass of the electrons (Gauss units).
The resonance frequency of the active material (semiconductor) may be found from the
condition
The Helicon Maser instabilities (generation and/or amplification) occure when the
resonant frequency of the active material coincides with the resonant frequency of the
cable line.
The quality of the semiconductor sample (active material) Q1 = ωH τ ≤ 10. The long cable
line quality Q2 in the resonant mode is much higher Q2 = 4000. The equivalent quality of HR Maser (active sample + long line resonator) in our experiments reaches the value
Q = 2000.
The most appropriate material for the experimental realization of HM is n-InSb where
ω H τ = 1 condition may be achieved in the fields of 0.2 T (at the room temperature).
In the helicon maser (HM) is connected to the pumping RF generator with the frequency
f 2 = 100 – 2000 MHz much higher than the helicon resonance frequency f 1 = 20 MHz
the pick-up signal during the generation time is proportional to time function
Gene-rator
4
5
1 2
3
H
-a
+a
x
x
Detector Register
Fig. 1. The experimental device of Helicon Maser
( )12
12
2
,i
ck
H H
p
τω+
⋅ω
ω⋅ω=
( )2
4 22
,cm
H e
;m
e N
H p =ω
π
=ω
( ) ( )35312
2Re ... , , ,n ,n
ak =π
=
( )42sin2sin 21
1
2 t f t f π
f
f F π−=

8/3/2019 Zigmantas Jankauskas, Vygaudas Kvedaras and Valentinas Zaveckas- Measurement of the bandwidth of Helicon M…
http://slidepdf.com/reader/full/zigmantas-jankauskas-vygaudas-kvedaras-and-valentinas-zaveckas-measurement 3/4
MEASUREMENT SCIENCE REVIEW, Volume 5, Section 3, 2005
65
with the initial condition
3. Experimental results
During the helicon generation time the first item in formula (4) represents the Helicon
Maser response and is much larger then the second item (the pumping signal).
Experimental results were obtained for a sample n-InSb (carrier density N = 1,5⋅1016 cm-3;
mobility µ = 5⋅104 cm2 V-1⋅S-1; sample thickness 2a = 0,5 cm; T = 300 K). The main
helicon generation peak was observed at B = 1,55 T with the helicon frequency f 1 = 20
MHz in the wide range of pumping frequencies f 2 = 100 ÷2000 MHz. The typical Helicon
Maser response is shown in Fig. 2 where the lower generation frequency f 1 peaks are
superimposed on the higher frequency f 2 of the pumping field (eq.(4)).
4. The HM bandwith measurement
results
The direct measurement of the HM
bandwidth in working mode is rather
complicated as the duration of helicon
impulse is only about 10 msec. In this
paper the new measurement method is
described and all operations may be
provided without pumping field.
The excitation coil in this case is
connected to the RF source of the
same frequency as helicon generation.
The process of the measurement is
illustrated by Fig. 3, where U is the
signal in the pickup coil and B is
induction of constant magnetic field.
In experimental device Fig. 1 the generation frequency is 20 MHz . If the HM is excited
by the RFs slightly less than 20 MHz we have the dependence U = f( B) described by thecurves 1, 2 and 3. The resonant curve 4 for f 1 = 20 MHz has the smallest bandwidth
which coincides with the bandwidth of Helicon Maser in the working mode when
pumping field (100 – 2000 MHz) is applied. For slightly higher excitation RF we have
once again the wider curve 5. Experimentally the helicon generation frequency and HM
bandwidth may be determined by starting at the lower RF (curve 1) and continuously
increasing the initial frequency.
In all cases the carrier density in the active material may be found by fixing the
generation frequency f 1 and using the equations (1), (2) and (3) where ω = 2π f 1 .
( ) ( ) ( )5000 . F F ' ==
0 5 10 15 20
0,2
0,4
0,6
0,8
U, mV
300 MHz
B, T
Fig. 2. The pick-up signal in milivolts versus
constant magnetic field induction B in Tesla
(pumping 300 MHz)

8/3/2019 Zigmantas Jankauskas, Vygaudas Kvedaras and Valentinas Zaveckas- Measurement of the bandwidth of Helicon M…
http://slidepdf.com/reader/full/zigmantas-jankauskas-vygaudas-kvedaras-and-valentinas-zaveckas-measurement 4/4
MEASUREMENT SCIENCE REVIEW, Volume 5, Section 3, 2005
66
Fig. 3. The resonance curves of the HM for various frequencies of excitution.
1 – 19,3 MHz; 2 – 19,5 MHz; 3 – 19,7 MHz; 4 – 20 MHz (generation frequency); 5 –
20,5 MHz; U – the signal of pickup coil in Volts; B – magnetic field induction in Tesla
5. Conclusions
In the Helicon Maser magnetoplasmic waves are excited by the radio frequencies much
higher than the helicon generation frequency. The excitation of helicons in this case may
be described by the effect similar to the Combination Scattering (Raman effect) when a
part of the high RF wave energy that passes through the active material is absorbed and
re–emitted by the magnetized solid – state plasma. The high RF e/m field may be called
the pumping field. In analogy with the usual maser (or laser) the semiconductor sample
plays the role of the active material and the connecting cable – the role of high quality
external resonator. The bandwidth of the HM is much narrower than the bandwidth of
isolated sample (exactly the same situation as in case of laser). The direct measurement of
the HM bandwidth in working mode is complicated as the duration of helicon impulse is
only about 10 msec. The new measurement method is proposed. Experimental resultats
for an active material n-InSb were obtained in the range of constant magnetic fields B = 0
– 20 T and pumping frequencies 100 – 2000 MHz.
Refereces
1. Z. Jankauskas, V. Kvedaras, L. Laurinavicius. Experimental realization of Helicon
Maser in magnetized solid–state plasma. Physica B. 2004. Vol. 346-347. P. 539-542.
2. Z. Jankauskas, L. Laurinavicius. Magnetic and Electric excitation of Magnetoplasmic
Waves. Electronics and Electrical Engineering. 2002. No 2 (37). P. 32-35.
3. Gayle F. Miner. Lines and electromagnetic fields for engineers. Oxford University
Press. 1996. P. 1008.
0
0,1
0,2
0,3
U, V
1
2
3
4
5
1 2 3 B, T
Second measurement