Embed Size (px)
Citation preview

Zhone Technologies, Inc.Annual Report 2010

The demand for bandwidth has never been greater. Subscriber’s demand for personalization and interactivity in communications and entertainment has placed unprecedented pressure on network operators worldwide to rapidly deliver multi-service access services such as triple play or quad play. In the face of relentless bandwidth requirements, network operators continue to face difficult challenges with downward pressure on access prices and service revenues. At Zhone, our core strength is our global network of 750 customers. We remain committed to working in close part-nership and actively listening to our customer results in the development of great products.
2010 Key Milestones
Last year, we officially surpassed the 1,000 mark for deployments worldwide of our flagship MXK, the industry’s first terabit-scale multi-service access platform. Continued interest from service providers in our MXK has reinforced our FTTx strategy.
In addition, we introduced two new high-density VDSL2 cards for our MXK and an entirely new multi-dwelling unit (MDU) product line, serving the fiber-to-the-home (FTTH) and fiber-to-the-building (FTTB) market segments. We also added the Zhone EZTouch Provisioning solution to the MXK portfolio to ensure all customers are afforded simple initial and ongoing configuration of their services.
We strengthened our relationship with Etisalat in the United Arab Emirates as they continued to deploy the MXK with a goal of reaching one million FTTx homes. In North America, we were able to gain momentum with a combination of new customer wins and organic growth. We began supporting several stimulus-funded projects throughout the year in partnership with customers.
2011 Vision and Objectives
As we kickoff 2011, we are aggressively pursuing new GPON and Active Ethernet deployments to gain greater market share internationally in both core and opportunistic regions. We are committed to organic growth that will help us further penetrate our strongest markets, the Middle East and South America, as well as focusing on extending our reach into regions such as Northern and Eastern Europe. We remain focused on serving our customer base in North America and look to continue growing broadband stimulus-funded projects.
Ultimately, we remain focused on achieving profitability in the coming months and leveraging the fast-emerging growth opportunities that exist as our customers begin their migration to next-generation fiber technologies.
Thank you for your continued support.
Sincerely, Mory EjabatChief Executive Officer, President and Chairman of the Board of the Directors Zhone Technologies, Inc.
Fellow Shareholders

FINANCIAL REVIEW
Page
Business . . . . . . . . . . . . . . . . . . . . . . . . . . . . . . . . . . . . . . . . . . . . . . . . . . . . . . . . . . . . . . . . . . . . . . . . 2Selected Financial Data . . . . . . . . . . . . . . . . . . . . . . . . . . . . . . . . . . . . . . . . . . . . . . . . . . . . . . . . . . . . 12Management’s Discussion and Analysis of Financial Condition and Results of Operations . . . . . . . 13Risk Factors . . . . . . . . . . . . . . . . . . . . . . . . . . . . . . . . . . . . . . . . . . . . . . . . . . . . . . . . . . . . . . . . . . . . . 27Market Price, Dividends and Related Stockholder Matters . . . . . . . . . . . . . . . . . . . . . . . . . . . . . . . . . 40Quantitative and Qualitative Disclosures About Market Risk . . . . . . . . . . . . . . . . . . . . . . . . . . . . . . . 42Consolidated Balance Sheets . . . . . . . . . . . . . . . . . . . . . . . . . . . . . . . . . . . . . . . . . . . . . . . . . . . . . . . . 44Consolidated Statements of Operations . . . . . . . . . . . . . . . . . . . . . . . . . . . . . . . . . . . . . . . . . . . . . . . . 45Consolidated Statements of Stockholders’ Equity . . . . . . . . . . . . . . . . . . . . . . . . . . . . . . . . . . . . . . . . 46Consolidated Statements of Cash Flows . . . . . . . . . . . . . . . . . . . . . . . . . . . . . . . . . . . . . . . . . . . . . . . 48Notes to Consolidated Financial Statements . . . . . . . . . . . . . . . . . . . . . . . . . . . . . . . . . . . . . . . . . . . . 49Report of Independent Registered Public Accounting Firm . . . . . . . . . . . . . . . . . . . . . . . . . . . . . . . . 72Internals Control Over Financial Reporting . . . . . . . . . . . . . . . . . . . . . . . . . . . . . . . . . . . . . . . . . . . . . 73Corporate Information . . . . . . . . . . . . . . . . . . . . . . . . . . . . . . . . . . . . . . . . . . . . . . . . . . . . . . . . . . . . . Inside Back
Cover
1

BUSINESS
Company Overview
We design, develop and manufacture communications network equipment for telecommunications, wirelessand cable operators worldwide. We believe that these network service providers can increase their revenues andlower their operating costs by using our products to deliver high quality video and interactive entertainment andInternet Protocol (IP) enabled next generation voice services in addition to their existing voice and data serviceofferings, all on a platform that permits a seamless migration from legacy technologies to a converged packet-based architecture. Our mature Single Line Multi-Service (SLMS) architecture provides cost-efficiency andfeature flexibility with support for voice over internet protocol (VoIP) and IP entertainment (IPTV). Within thisversatile SLMS architecture, our products allow service providers to deliver all of these and other next generationconverged packet services over their existing copper lines while providing support for fiber or Fiber to the homeor business (FTTx) build-out. With our products and solutions, network service providers can seamlessly migratefrom traditional circuit-based networks to packet-based networks and from copper-based access lines to fiber-based access lines without abandoning the investments they have made in their existing infrastructures.
In addition to our established product offerings, Zhone launched our flagship MXK IP Multi-service TerabitAccess Concentrator (MXK) and multiple new Optical Line Terminal (OLT) and outdoor units in late 2009. OurMXK product is a converged multi-services access platform that can be configured as a Gigabit Passive OpticalNetwork (GPON) or Active Ethernet OLT. The MXK GPON line module is ITU-T G.984 compliant, deliveringdata throughputs of up to 2.5 Gbps downstream and 1.25 Gbps upstream. Each line card is designed for up to 64passive splits per fiber. Active Ethernet delivers up to 100 Mbps point-to-point from a 20-port card. In 2010, wesold over 1000 MXK systems to new and existing customers globally.
Zhone’s MXK product supports the next generation of high-performance business and residential FTTxservices. Unlike most competing products, MXK has the ability to support both Passive Optical Network (PON)and Active Ethernet fiber technologies to the node, curb or premises. With our MXK product, service providerscan offer digital or Ratio Frequency (RF) video, high-bandwidth Internet access, VoIP and cell relay servicesfrom a single OLT over IP. Additionally, our MXK product provides Zhone with industry leading densityfeaturing an 8 port GPON Module enabling support for up to 9,216 GPON subscribers in a single MXK chassis.
The flexibility of our MXK product enables service providers to choose the best technology for bothservices and network architecture. Active Ethernet provides dedicated high symmetric bandwidth to the endcustomers and makes it an excellent technology for deployment of business services. GPON provides a cost-effective way to deliver high bandwidth to the residence for a robust triple play offering while enabling a host ofhigh speed data and video options for the businesses. In addition to Active Ethernet and dense GPON support,the MXK provides a wide array of multi-service functionality supporting well defined access standards enablingthe convergence of voice, data and entertainment over any access medium delivering high-performance all IPsolutions designed for today’s traffic mix.
Corporate Information
We were incorporated in Delaware under the name Zhone Technologies, Inc. in June 1999, and inNovember 2003, we consummated our merger with Tellium, Inc. Although Tellium acted as the legal acquirer,due to various factors, including the relative voting rights, board control and senior management composition ofthe combined company, Zhone was treated as the “acquirer” for accounting purposes. Following the merger, thecombined company was renamed Zhone Technologies, Inc. and retained substantially all of Zhone’s previousmanagement and operating structure. The mailing address of our worldwide headquarters is 7195 Oakport Street,Oakland, California 94621, and our telephone number at that location is (510) 777-7000. Our website address iswww.zhone.com. The information on our website does not constitute part of this report. Through a link on theInvestor Relations section of our website, we make available the following filings as soon as reasonablypracticable after they are electronically filed with or furnished to the SEC: our Annual Report on Form 10-K,
2

Quarterly Reports on Form 10-Q, Current Reports on Form 8-K and any amendments to those reports filed orfurnished pursuant to Section 13(a) or 15(d) of the Securities Exchange Act of 1934. All such filings areavailable free of charge.
Industry Background
Over the past decade, the communications network industry has experienced rapid expansion as the internetand the proliferation of bandwidth intensive applications and services have led to an increased demand for highbandwidth communications networks. The broad adoption of new technologies such as smartphones, MP3players, digital cameras and high definition televisions allow music, pictures, user-generated content (as found onthe many video-sharing sites) and high definition video to be a growing part of consumers’ regular exchange ofinformation. In 2010, the advent of social communications and social networking has continued to place demandson existing copper based access infrastructure and new consumer demands are challenging even the newest andmost advanced infrastructures. All of these new technologies share a common dependency on high bandwidthcommunication networks and sophisticated traffic management tools. However, network service providers havestruggled to meet the increased demand for high speed broadband access due to the constraints of the existingcommunications network infrastructure. This infrastructure consists of two interconnected networks:
• the “core” network, which interconnects service providers with each other; and
• the “access” network, which connects end-users to a service provider’s closest facility.
To address the increased demand for higher transmission speeds via greater bandwidth, service providershave expended significant capital over the past decade to upgrade the core network by replacing much of theircopper infrastructure with high-speed optical infrastructure. While the use of fiber optic equipment in the corenetwork has relieved the bandwidth capacity constraints in the core network between service providers, theaccess network continues to be a “bottleneck” that severely limits the transmission speed between serviceproviders and end-users. As a result, communications in the core network can travel at up to 10 gigabits persecond, while in stark contrast, many communications over the access network throughout the world still occur ata mere 56 kilobits per second, a speed that is 175,000 times slower. At 56 kilobits per second, it may take severalminutes to access even a modestly media laden website and several hours to download large files. Fiber accesslines have the potential to remedy this disparity, but re-wiring every home or business with fiber optic cable isboth cost prohibitive and extremely time consuming. Consequently, solving the access network bottleneck hastypically required more efficient use of the existing copper wire infrastructure and support for the gradualmigration from copper to fiber.
In an attempt to deliver high bandwidth services over existing copper wire in the access network, serviceproviders began deploying digital subscriber line (DSL) technology over a decade ago. However, this early DSLtechnology has practical limitations. Copper is a distance sensitive medium in that the amount of bandwidthavailable over a copper wire is inversely proportional to the length of the copper wire. In other words, the greaterthe distance between the service provider’s equipment and the customer’s premises, the lower the bandwidth.Unfortunately, most DSL services available today are provided by first generation DSL access multiplexer(DSLAM) equipment. These large unwieldy devices require conditioned power and a climate controlledenvironment typically found only in a telephone company’s central office, which is often at great distance fromthe customer. While adequate for basic data services, these first generation DSLAMs were not designed to meetthe needs of today’s high bandwidth applications. The modest bandwidth provided by existing DSLAMequipment is often incapable of delivering even a single channel of standard definition video, much less multiplechannels of standard definition video or high definition video.
More recently, regulatory changes have introduced new competitors in the telecommunication servicesindustry. Cable operators, with extensive networks designed originally to provide only video programming, havecollaborated to adopt new packet technologies that leverage their hybrid fiber/coaxial cable infrastructure. Usingmore recent technologies, cable operators have begun to cost-effectively deliver new service bundles. The newservice offerings provide not only enhanced features and capabilities, but also allow the cable operators to deliver
3

these services over a common network. The resulting cost-efficiencies realized by cable operators are difficult forincumbent telephone companies to match. Even with the telephone companies’ legacy voice switches fully paidfor, maintaining separate networks for their circuit-based voice and packet-based video and data networks isoperationally non-competitive. Perhaps even more important than economic efficiencies, by integrating theseservices over a common packet infrastructure, cable operators will realize levels of integration betweenapplications and new features that will be difficult to achieve from a multi-platform solution. Despite thesebenefits, coaxial cable has its own share of limitations. Unlike DSL, coaxial cable shares its bandwidth among allcustomers connected to it. Consequently, as new customers are added to coaxial cable networks, performancedecreases. As a shared medium, large numbers of subscribers who simultaneously access the same segment ofthe coaxial cable network can potentially compromise performance and security. This represents a source ofstrategic advantage for telecom operators who employ technology designed to maximize their service capabilitieson the point-to-point (i.e. not shared) architecture of their copper infrastructure. In addition, in recent years theintroduction of 3G and 4G wireless technologies and improved satellite technologies have enabled wireless andsatellite service providers to provide competitive broadband offerings as alternatives to traditional landlineaccess. This increased competition has placed significant pressure on all network service providers. Withsignificant service revenues at risk, these service providers have sought to upgrade and modernize their networksand broaden their service offerings to enable delivery of additional high bandwidth, high margin services, and tolower the cost of delivering these services.
The Zhone Solution
We believe that we are the first company dedicated solely to developing the full spectrum of next-generationaccess network solutions to cost-effectively deliver high bandwidth services while simultaneously preserving theinvestment in legacy networks. Our next-generation solutions are based upon our Single Line Multi-Service, orSLMS, architecture. From its inception, this SLMS architecture was specifically designed for the delivery ofmultiple classes of subscriber services (such as voice, data and video distribution), rather than being based on aparticular protocol or media. In other words, our SLMS products are built to support the migration from legacycircuit to packet technologies and from copper to fiber technologies. This flexibility and versatility allows ourproducts to adapt to future technologies while allowing service providers to focus on the delivery of additionalhigh bandwidth services. Because this SLMS architecture is designed to interoperate with existing legacyequipment, service providers can leverage their existing networks to deliver a combination of voice, data andvideo services today, while they migrate, either simultaneously or at a future date, from legacy equipment tonext-generation equipment with minimal interruption. We believe that our SLMS solution provides anevolutionary path for service providers using their existing infrastructures, as well as giving newer serviceproviders the capability to deploy cost-effective, multi-service networks that can support voice, data and video.
Triple Play Services with Converged Voice, Data and Video – SLMS simplifies the access network byconsolidating new and existing services onto a single line. This convergence of services and networks simplifiesprovisioning and operations, ensures quality of service and reliability, and reduces the time required to provideservices. SLMS integrates access, transport, customer premises equipment, and management functions in astandards-based system that provides scalability, interoperability and functionality for voice, data and videoservices.
Packet Migration – SLMS is a flexible multi-service architecture that provides current services whilesimultaneously supporting migration to a pure packet network. This flexibility allows service providers to cost-effectively provide carrier class performance, and functionality for current and future services withoutinterrupting existing services or abandoning existing subscribers. SLMS also protects the value of theinvestments made by residential and commercial subscribers in equipment, inside wiring and applications,thereby minimizing transition impact and subscriber attrition.
Fiber to the Home, Premise, Node, or Curb (FTTx) – We provide support for the full range of fiber-basedaccess network architectures that are seeing increased use by carriers. In many markets worldwide, both businessand residential demand for bandwidth is growing to the point where the deployment of fiber in the access
4

network is increasingly desirable. Where copper loops are plentiful and where civil restrictions make fiberdeployment all the way to the customer premises prohibitively expensive, if not impossible, many operators arechoosing to deploy fiber from central offices to neighborhoods and then using VDSL2 over copper to deliverbroadband connectivity over the last hundred meters or so. In other circumstances operators choose to deploypassive optical networks (PON) all the way to the customer premises, where a single fiber’s bandwidth is sharedthrough splitters with up to 64 subscribers. Some circumstances demand so-called “home run” fiber networks(with dedicated fiber resources linking every customer directly to the central office) to maximize bandwidth orservice segmentation. By supporting all these architectures within a common SLMS-based platform, we providecarriers maximum flexibility to build the network that best suits their needs.
Ethernet Service Delivery – We offer a complete array of equipment that allows carriers to deliver ethernetservices over copper or fiber. For business subscribers, our ethernet over copper product family allows carriers toquickly deliver ethernet services over existing copper SHDSL or T1/E1 circuits. Multiple circuits can be bondedto provide over 70 Megabits per second, enough to deliver ample ethernet bandwidth to satisfy businesssubscribers’ growing service requirements. This copper-based solution provides a compelling alternative toburying fiber and dedicating valuable fiber strands to long-haul ethernet services to small and mediumenterprises.
The Zhone Strategy
Our strategy has been to combine internal development with acquisitions of established access equipmentvendors to achieve the critical mass required of telecommunications equipment providers. We expect that ourfuture growth will focus primarily on organic growth in emerging technology markets. Going forward, the keyelements of our strategy include:
• Expand Our Infrastructure to Meet Service Provider Needs. Network service providers requireextensive support and integration with manufacturers to deliver reliable, innovative and cost-effectiveservices. By combining advanced, computer-aided design, test and manufacturing systems withexperienced, customer-focused management and technical staff, we believe that we have established thecritical mass required to fully support global service provider requirements. We continue to expand ourinfrastructure through ongoing development and strategic relationships, continuously improving quality,reducing costs and accelerating delivery of advanced solutions.
• Continue the Development and Enhancement of Our SLMS Products. Our SLMS architecture is thecornerstone of our product development strategy. The design criteria for SLMS products include carrier-class reliability, multi-protocol and multi-service support, and ease of provisioning. We intend tocontinue to introduce SLMS products that offer the configurations and feature sets that our customersrequire. In addition, we have introduced products that adhere to the standards, protocols and interfacesdictated by international standards bodies and service providers. In 2009, we introduced our MXKproduct, a new flagship SLMS product that provides a converged multi-services access platform. Tofacilitate the rapid development of our existing and new SLMS architecture and products, we haveestablished engineering teams responsible for each critical aspect of the architecture and products. Weintend to continue to leverage our expertise in voice, data and video technologies to enhance our SLMSarchitecture, supporting new services, protocols and technologies as they emerge. To further thisobjective, we intend to continue investing in research and development efforts to extend the SLMSarchitecture and introduce new SLMS products.
• Deliver Full Customer Solutions. In addition to delivering hardware and software product solutions, weprovide customers with pre-sales and post-sales support, education and professional services to enableour customers to more efficiently deploy and manage their networks. We provide customers withapplication notes, business planning information, web-based and phone-based troubleshootingassistance and installation guides. Our support programs provide a comprehensive portfolio of supporttools and resources that enable our customers to effectively sell to, support and expand their subscriberbase using our products and solutions.
5

Product Portfolio
Our products provide the framework around which we are designing and developing high speedcommunications software and equipment for the access network. All of the products listed below are currentlyavailable and being shipped to customers. Our products span two distinct categories:
SLMS Products
Our SLMS products address three areas of customer requirements. Our Broadband Aggregation and Serviceproducts aggregate, concentrate and optimize communications traffic from copper and fiber networks. Theseproducts are deployed in central offices, remote offices, points of presence, curbsides, data and co-locationcenters, and large enterprises. Our Customer Premise Equipment, or CPE, products offer a cost-effective solutionfor combining analog voice and data services to the subscriber’s premises over a single platform. The ZhoneManagement System, or ZMS, product provides optional software tools to help manage aggregation andcustomer premises network hardware. These products deliver voice, data and video interface connectivity forbroadcast and subscription television, internet routers and traditional telephony equipment.
Our SLMS products include:
Category Product Function
Broadband Aggregation and Service . . . . . MXK Multi-Service Terabit Access ConcentratorMALC Multi-Access Line ConcentratorMX Scalable 1U SLMS VDSL2/EthernetMALC-OLT FTTx Optical Line Terminal4000 /8000 /12000 DSLAMs
Customer Premise Equipment (CPE) . . . . EtherXtend Ethernet Over Copper16xx, 17xx, 6xxxzNID
Wireline/Wireless DSL ModemsOptical Network Terminals
Network and Subscriber Management . . . ZMS Zhone Management System
Legacy, Service and Other Products
Our legacy products support a variety of voice and data services, and are broadly deployed by serviceproviders worldwide. Our main legacy product during 2010 and 2009 was our IMACS product which functionsas a multi-access multiplexer.
Global Service & Support
In addition to our product offerings, we provide a broad range of service offerings through our GlobalService & Support organization. We supplement our standard and extended product warranties with programsthat offer technical support, product repair, education services and enhanced support services. These servicesenable our customers to protect their network investments, manage their networks more efficiently and minimizedowntime for mission-critical systems. Technical support services are designed to help ensure that our productsoperate efficiently, remain highly available, and benefit from recent software releases. Through our educationservices program, we offer in-depth training courses covering network design, installation, configuration,operation, trouble-shooting and maintenance. Our enhanced services offering is a comprehensive program thatprovides network engineering, configuration, integration, project management and other consultative support tomaximize the results of our customers during the design, deployment and operational phases. As part of ourcommitment to ensure around-the-clock support, we maintain a technical assistance center and a staff of qualifiednetwork support engineers to provide customers with 24-hour service, seven days a week.
6

Technology
We believe that our future success is built upon our investment in the development of advancedtechnologies. SLMS is based on a number of technologies that provide sustainable advantages, including thefollowing:
• Services-Centric Architecture. SLMS has been designed from inception for the delivery of multipleclasses of subscriber services (such as voice, data or video distribution), rather than being based on aparticular protocol or media. Our SLMS products are built to interoperate in networks supportingpacket, cell and circuit technologies. This independence between services and the underlyingtransportation is designed to position our products to be able to adapt to future transportationtechnologies within established architectures and to allow our customers to focus on service delivery.
• Common Code Base. Our SLMS products share a common base of software code, which is designed toaccelerate development, improve software quality, enable rapid deployment, and minimize training andoperations costs, in conjunction with network management software.
• Network Management and Operations. Our ZMS product provides management capabilities that enablerapid, cost-effective, and secure control of the network; standards-based interfaces for seamlessintegration with supporting systems; hierarchical service and subscriber profiles to allow rapid servicedefinition and provisioning, and to enable wholesaling of services; automated and intelligent CPEprovisioning to provide the best end-user experience and accelerate service turn-up; load-balancing forscalability; and full security features to ensure reliability and controlled access to systems and data.
• Test Methodologies. Our SLMS architecture provides for interoperability with a variety of products thatreside in networks in which we will deploy our products. To ensure interoperability, we have built atesting facility to conduct extensive multi-vendor trials and to ensure full performance under validnetwork conditions. Testing has included participation with partners’ certification and accreditationprograms for a wide range of interoperable products, including soft switches, SAN equipment andmanagement software. The successful completion of these processes is required by our largestcustomers to ensure interoperability with their existing software and systems.
• Acquired Technologies. Since our inception, we have completed twelve acquisitions pursuant to whichwe acquired products, technology and additional technical expertise.
Customers
We sell our products and services to network service providers that offer voice, data and video services tobusinesses, governments, utilities and residential consumers. Our global customer base includes regional,national and international telecommunications carriers. To date, our products are deployed by over 750 networkservice providers on six continents worldwide. Emirates Telecommunications Corporation (Etisalat) accountedfor 24% of net revenue in 2010 and 19% of net revenue in 2009. No other customer accounted for 10% or moreof net revenue during either period.
Research and Development
The industry in which we compete is subject to rapid technological developments, evolving industrystandards, changes in customer requirements, and continuing developments in communications service offerings.Our continuing ability to adapt to these changes, and to develop new and enhanced products, is a significantfactor in maintaining or improving our competitive position and our prospects for growth. Therefore, wecontinue to make significant investments in product development.
We conduct the majority of our research and product development activities at our headquarters in Oakland,California. In Oakland, we have built an extensive communications laboratory with hundreds of access
7

infrastructure products from multiple vendors that serve as an interoperability and test facility. This facilityallows us to emulate a communications network with serving capacity equivalent to that supporting a city of350,000 residents. We also have focused engineering staff and activities at additional development centerslocated in Alpharetta, Georgia; Largo, Florida; Westlake Village, California; and Portsmouth, New Hampshire.
Our product development activities focus on products to support both existing and emerging technologies inthe segments of the communications industry that we consider viable revenue opportunities. We are activelyengaged in continuing to refine our SLMS architecture, introducing new products under our SLMS architecture,and creating additional interfaces and protocols for both domestic and international markets.
We continue our commitment to invest in leading edge technology research and development. Our researchand product development expenditures were $21.2 million, $22.1 million, and $27.1 million, in 2010, 2009 and2008, respectively. All of our expenditures for research and product development costs, as well as stock-basedcompensation expense relating to research and product development, have been expensed as incurred. Theseamounts include stock-based compensation of $0.4 million, $0.4 million, and $0.5 million for 2010, 2009, and2008, respectively. We plan to continue to support the development of new products and features, while seekingto carefully manage associated costs through expense controls.
Intellectual Property
We seek to establish and maintain our proprietary rights in our technology and products through the use ofpatents, copyrights, trademarks and trade secret laws. We also seek to maintain our trade secrets and confidentialinformation by nondisclosure policies and through the use of appropriate confidentiality agreements. We haveobtained a number of patents and trademarks in the United States and in other countries. There can be noassurance, however, that these rights can be successfully enforced against competitive products in everyjurisdiction. Although we believe the protection afforded by our patents, copyrights, trademarks and trade secretshas value, the rapidly changing technology in the networking industry and uncertainties in the legal process makeour future success dependent primarily on the innovative skills, technological expertise, and managementabilities of our employees rather than on the protection afforded by patent, copyright, trademark, and trade secretlaws. In addition, we sold certain of our non-strategic patents for $1.1 million in 2008.
Many of our products are designed to include software or other intellectual property licensed from thirdparties. While it may be necessary in the future to seek or renew licenses relating to various aspects of ourproducts, we believe, based upon past experience and standard industry practice, that such licenses generallycould be obtained on commercially reasonable terms. Nonetheless, there can be no assurance that the necessarylicenses would be available on acceptable terms, if at all. Our inability to obtain certain licenses or other rights orto obtain such licenses or rights on favorable terms, or the need to engage in litigation regarding these matters,could have a material adverse effect on our business, operating results and financial condition.
The communications industry is characterized by rapidly changing technology, a large number of patents,and frequent claims and related litigation regarding patent and other intellectual property rights. We cannotassure you that our patents and other proprietary rights will not be challenged, invalidated or circumvented, thatothers will not assert intellectual property rights to technologies that are relevant to us, or that our rights will giveus a competitive advantage. In addition, the laws of some foreign countries may not protect our proprietary rightsto the same extent as the laws of the United States.
Sales and Marketing
We have a sales presence in various domestic and foreign locations, and we sell our products and servicesboth directly and indirectly through channel partners with support from our sales force. Channel partners includedistributors, resellers, system integrators and service providers. These partners sell directly to end customers and
8

often provide system installation, technical support, professional services and support services in addition to thenetwork equipment sale. Our sales efforts are generally organized according to geographical regions:
• U.S. Sales. Our U.S. Sales organization establishes and maintains direct relationships with domesticcustomers, which include communication service providers, cable operators, independent operatingcompanies, or IOCs, as well as competitive carriers, developers and utilities. In addition, thisorganization is responsible for managing our distribution and original equipment manufacturer, orOEM, partnerships.
• International Sales. Our International Sales organization targets foreign based service providers and isstaffed with individuals with specific experience dealing with service providers in their designatedinternational territories.
Our marketing team works closely with our sales, research and product development organizations, and ourcustomers by providing communications that keep the market current on our products and features. Marketingalso identifies and sizes new target markets for our products, creates awareness of our company and products,generates contacts and leads within these targeted markets and performs outbound education and public relations.
Backlog
Our backlog consists of purchase orders for products and services that we expect to ship or perform withinthe next year. At December 31, 2010, our backlog was $4.4 million, as compared to $21.6 million atDecember 31, 2009. We consider backlog to be an indicator, but not the sole predictor, of future sales becauseour customers may cancel or defer orders without penalty.
Competition
We compete in the communications equipment market, providing products and services for the delivery ofvoice, data and video services. This market is characterized by rapid change, converging technologies and amigration to solutions that offer superior advantages. These market factors represent both an opportunity and acompetitive threat to us. We compete with numerous vendors, including Alcatel-Lucent, Calix, Huawei, andZTE, among others. In addition, a number of companies have introduced products that address the same networkneeds that our products address, both domestically and abroad. The overall number of our competitors mayincrease, and the identity and composition of competitors may change. As we continue to expand our salesglobally, we may see new competition in different geographic regions. Barriers to entry are relatively low, andnew ventures to create products that do or could compete with our products are regularly formed. Many of ourcompetitors have greater financial, technical, sales and marketing resources than we do.
The principal competitive factors in the markets in which we presently compete and may compete in thefuture include:
• product performance;
• interoperability with existing products;
• scalability and upgradeability;
• conformance to standards;
• breadth of services;
• reliability;
• ease of installation and use;
• geographic footprints for products;
• ability to provide customer financing;
• price;
9

• technical support and customer service; and
• brand recognition.
While we believe that we compete successfully with respect to each of these factors, we expect to faceintense competition in our market. In addition, the inherent nature of communications networking requiresinteroperability. As such, we must cooperate and at the same time compete with many companies.
Manufacturing
We manufacture our products using a strategic combination of procurement from qualified suppliers,in-house manufacturing at our facility in Florida, and the use of original design manufacturers (ODM) located inthe Far East. Since our acquisition of Paradyne Networks, Inc., or Paradyne, in September 2005, we have beenmanufacturing a significant majority of our more complex products at our manufacturing facility in Florida.
Our parts and components are procured from a variety of qualified suppliers in the U.S., Far East, Mexico,and other countries around the world per our Approved Supplier List and detailed engineering specifications.Some completed products are procured to our specifications and shipped directly to our customers. We alsoacquire completed products from certain suppliers and configure and ship from our facility. Some of thesepurchases are significant. We purchase both standard off-the-shelf parts and components, which are generallyavailable from more than one supplier, and single-source parts and components. We have generally been able toobtain adequate supplies to meet customer demand in a timely manner from our current vendors, or, whennecessary, from alternate vendors. We believe that alternate vendors can be identified if current vendors areunable to fulfill our needs, or design changes can be made to employ alternate parts.
We design, specify, and monitor all of the tests that are required to meet our internal and external qualitystandards. Our manufacturing and test engineers work closely with our design engineers to ensuremanufacturability and testability of our products, and to ensure that manufacturing and testing processes evolveas our technologies evolve. Our manufacturing engineers specify, build, or procure our test stations, establishquality standards and protocols, and develop comprehensive test procedures and processes to assure thereliability and quality of our products. These processes and tests are reviewed by our design engineers to ensurethey meet the intent of the design. Products that are procured complete or partially complete are inspected, tested,and audited for quality control.
Our manufacturing quality system is ISO-9001 and is certified to ISO-9001 by our external registrar.ISO-9001 ensures our processes are documented, followed, and continuously improved. Internal audits areconducted on a regular schedule by our quality assurance personnel, and external audits are conducted by ourexternal registrar every six months. Our quality system is based upon our model for quality assurance in design,development, production, installation, and service to ensure our products meet rigorous quality standards.
We believe that we have sufficient production capacity to meet current and future demand for our productofferings through a combination of existing and added capacity, additional employees, or the outsourcing ofproducts or components.
Compliance with Regulatory and Industry Standards
Our products must comply with a significant number of voice and data regulations and standards which varybetween the U.S. and international markets, and which vary between specific international markets. Standards fornew services continue to evolve, and we may need to modify our products or develop new versions to meet thesestandards. Standards setting and compliance verification in the U.S. are determined by the FederalCommunications Commission, or FCC, Underwriters Laboratories, Quality Management Institute, TelcordiaTechnologies, Inc., and other communications companies. In international markets, our products must complywith standards issued by the European Telecommunications Standards Institute, or ETSI, and implemented andenforced by the telecommunications regulatory authorities of each nation.
10

Environmental Matters
Our operations and manufacturing processes are subject to federal, state, local and foreign environmentalprotection laws and regulations. These laws and regulations relate to the use, handling, storage, discharge anddisposal of certain hazardous materials and wastes, the pre-treatment and discharge of process waste waters andthe control of process air pollutants.
We believe that our operations and manufacturing processes currently comply in all material respects withapplicable environmental protection laws and regulations. If we fail to comply with any present and futureregulations, we could be subject to future liabilities, the suspension of production or a prohibition on the sale ofour products. In addition, such regulations could require us to incur other significant expenses to comply withenvironmental regulations, including expenses associated with the redesign of any non-compliant product. Fromtime to time new regulations are enacted, and it is difficult to anticipate how such regulations will beimplemented and enforced. For example, in 2003 the European Union enacted the Restriction on the Use ofCertain Hazardous Substances in Electrical and Electronic Equipment Directive (RoHS) and the Waste Electricaland Electronic Equipment Directive (WEEE), for implementation in European Union member states. We areaware of similar legislation that is currently in force or is being considered in the United States, as well as othercountries. Our failure to comply with any of such regulatory requirements or contractual obligations could resultin our being liable for costs, fines, penalties and third-party claims, and could jeopardize our ability to conductbusiness in countries in the jurisdictions where these regulations apply.
Employees
As of December 31, 2010, we employed 353 individuals worldwide. We consider the relationships with ouremployees to be positive. Competition for technical personnel in our industry is intense. We believe that ourfuture success depends in part on our continued ability to hire, assimilate and retain qualified personnel. To date,we believe that we have been successful in recruiting qualified employees, but there is no assurance that we willcontinue to be successful in the future.
Executive Officers
Set forth below is information concerning our executive officers and their ages as of December 31, 2010.
Name Age Position
Morteza Ejabat . . . . . . . . . . . . . . . . . . . . . . . . . . . . . . . . 60 Chief Executive Officer, President andChairman of the Board of Directors
Kirk Misaka . . . . . . . . . . . . . . . . . . . . . . . . . . . . . . . . . . . 52 Chief Financial Officer, Corporate Treasurer andSecretary
Morteza Ejabat is a co-founder of Zhone and has served as Chairman of the Board of Directors, Presidentand Chief Executive Officer since June 1999. Prior to co-founding Zhone, from June 1995 to June 1999,Mr. Ejabat was President and Chief Executive Officer of Ascend Communications, Inc., a provider oftelecommunications equipment which was acquired by Lucent Technologies, Inc. in June 1999. Previously,Mr. Ejabat held various senior management positions with Ascend from September 1990 to June 1995, mostrecently as Executive Vice President and Vice President, Operations. Mr. Ejabat holds a B.S. in IndustrialEngineering and an M.S. in Systems Engineering from California State University at Northridge and an M.B.A.from Pepperdine University.
Kirk Misaka has served as Zhone’s Corporate Treasurer since November 2000 and as Chief FinancialOfficer and Secretary since July 2003. Prior to joining Zhone, Mr. Misaka was a Certified Public Accountantwith KPMG LLP from 1980 to 2000, becoming a partner in 1989. Mr. Misaka earned a B.S. and an M.S. inAccounting from the University of Utah, and an M.S. in Tax from Golden Gate University.
11

SELECTED FINANCIAL DATA
The following selected financial data has been derived from our consolidated financial statements andshould be read in conjunction with the consolidated financial statements and notes thereto, and with“Management’s Discussion and Analysis of Financial Condition and Results of Operations.” During the yearsended December 31, 2010, 2009, 2008, 2007 and 2006, we recorded charges of zero, zero, $70.4 million, zero,and $113.7 million, respectively, related to the impairment of acquisition related intangibles and goodwill asdiscussed in Note 3 to the consolidated financial statements.
As of December 31,
2010 2009 2008 2007 2006
(in thousands, except per share data)Statement of Operations Data:Net revenue . . . . . . . . . . . . . . . . . . . . . . . . . . . . . . . . . . . . . . . . . . . . . . . . . . . . . $129,036 $126,501 $146,160 $175,448 $ 194,344Cost of revenue (1) . . . . . . . . . . . . . . . . . . . . . . . . . . . . . . . . . . . . . . . . . . . . . . . 79,864 81,106 101,096 116,370 131,749
Gross profit . . . . . . . . . . . . . . . . . . . . . . . . . . . . . . . . . . . . . . . . . . . . . . . . . 49,172 45,395 45,064 59,078 62,595
Operating expenses:Research and product development (1) . . . . . . . . . . . . . . . . . . . . . . . . . . . . 21,188 22,113 27,063 32,720 36,099Sales and marketing (1) . . . . . . . . . . . . . . . . . . . . . . . . . . . . . . . . . . . . . . . . 23,982 22,042 28,269 33,192 38,225General and administrative (1) . . . . . . . . . . . . . . . . . . . . . . . . . . . . . . . . . . 9,855 9,933 15,609 10,170 14,036Gain on sale of fixed assets . . . . . . . . . . . . . . . . . . . . . . . . . . . . . . . . . . . . . (1,959) — (455) (659) —Gain on sale of intangible assets . . . . . . . . . . . . . . . . . . . . . . . . . . . . . . . . . — — (4,397) (5,000) —Amortization of intangible assets . . . . . . . . . . . . . . . . . . . . . . . . . . . . . . . . — — — — 2,764Impairment of intangible assets and goodwill . . . . . . . . . . . . . . . . . . . . . . . — — 70,401 — 113,666
Total operating expenses . . . . . . . . . . . . . . . . . . . . . . . . . . . . . . . . . . . 53,066 54,088 136,490 70,423 204,790
Operating loss . . . . . . . . . . . . . . . . . . . . . . . . . . . . . . . . . . . . . . . . . . . . . . . . . . . (3,894) (8,693) (91,426) (11,345) (142,195)Interest expense . . . . . . . . . . . . . . . . . . . . . . . . . . . . . . . . . . . . . . . . . . . . . . . . . . (996) (1,331) (1,625) (2,213) (2,774)Interest income . . . . . . . . . . . . . . . . . . . . . . . . . . . . . . . . . . . . . . . . . . . . . . . . . . 7 47 708 1,813 2,328Other income, net . . . . . . . . . . . . . . . . . . . . . . . . . . . . . . . . . . . . . . . . . . . . . . . . 1 121 78 37 239
Loss before income taxes . . . . . . . . . . . . . . . . . . . . . . . . . . . . . . . . . . . . . . . . . . (4,882) (9,856) (92,265) (11,708) (142,402)Income tax provision (benefit) . . . . . . . . . . . . . . . . . . . . . . . . . . . . . . . . . . . . . . . (101) 171 270 394 264
Net loss . . . . . . . . . . . . . . . . . . . . . . . . . . . . . . . . . . . . . . . . . . . . . . . . . . . . . . . . $ (4,781) $ (10,027) $ (92,535) $ (12,102) $(142,666)
Basic and diluted net loss per share (2) . . . . . . . . . . . . . . . . . . . . . . . . . . . . . . . . $ (0.16) $ (0.33) $ (3.08) $ (0.40) $ (4.80)Shares used in per-share calculation (2) . . . . . . . . . . . . . . . . . . . . . . . . . . . . . . . 30,393 30,200 30,068 29,925 29,745(1) Amounts include stock-based compensation cost as follows:
Cost of revenue . . . . . . . . . . . . . . . . . . . . . . . . . . . . . . . . . . . . . . . . . . . . . . $ 94 $ 104 $ 158 $ 296 $ 892Research and product development . . . . . . . . . . . . . . . . . . . . . . . . . . . . . . . 362 414 479 717 1,632Sales and marketing . . . . . . . . . . . . . . . . . . . . . . . . . . . . . . . . . . . . . . . . . . . 421 484 511 603 1,380General and administrative . . . . . . . . . . . . . . . . . . . . . . . . . . . . . . . . . . . . . 1,388 1,258 1,203 1,250 1,601
(2) All share and per share amounts reflect the one-for-five reverse stock spliteffected on March 11, 2010.
As of December 31,
2010 2009 2008 2007 2006
(in thousands)Balance Sheet Data:Cash, cash equivalents and short-term investments . . . . . . . . . . . . . . . . . . . . . . $ 21,174 $ 21,766 $ 36,243 $ 50,165 $ 64,310Working capital . . . . . . . . . . . . . . . . . . . . . . . . . . . . . . . . . . . . . . . . . . . . . . . . . . 49,402 53,843 62,007 77,496 83,872Total assets . . . . . . . . . . . . . . . . . . . . . . . . . . . . . . . . . . . . . . . . . . . . . . . . . . . . . 90,111 110,259 123,449 223,406 240,182Long-term debt, including current portion . . . . . . . . . . . . . . . . . . . . . . . . . . . . . — 18,696 19,078 19,405 27,049Stockholders’ equity . . . . . . . . . . . . . . . . . . . . . . . . . . . . . . . . . . . . . . . . . . . . . . $ 49,415 $ 51,673 $ 59,297 $149,547 $ 157,604
12

MANAGEMENT’S DISCUSSION AND ANALYSIS OF FINANCIAL CONDITION ANDRESULTS OF OPERATIONS
Overview
We believe that we are the first company dedicated solely to developing the full spectrum of next-generationaccess network solutions to cost-effectively deliver high bandwidth services while simultaneously preserving theinvestment in today’s networks. Our next-generation solutions are based upon our SLMS architecture. From itsinception, this SLMS architecture was specifically designed for the delivery of multiple classes of subscriberservices (such as voice, data and video distribution), rather than being based on a particular protocol or media. Inother words, our SLMS products are built to support the migration from legacy circuit to packet technologies andfrom copper to fiber technologies. This flexibility and versatility allows our products to adapt to futuretechnologies while allowing service providers to focus on the delivery of additional high bandwidth services.Because this SLMS architecture is designed to interoperate with existing legacy equipment, service providers canleverage their existing networks to deliver a combination of voice, data and video services today, while theymigrate, either simultaneously or at a future date, from legacy equipment to next-generation equipment withminimal interruption. We believe that our SLMS solution provides an evolutionary path for service providersfrom their existing infrastructures, as well as gives newer service providers the capability to deploy cost-effective, multi-service networks that can support voice, data and video.
Our global customer base includes regional, national and international telecommunications carriers. To date,our products are deployed by over 750 network service providers on six continents worldwide. We believe thatwe have assembled the employee base, technological breadth and market presence to provide a simple yetcomprehensive set of next-generation solutions to the bandwidth bottleneck in the access network and the otherproblems encountered by network service providers when delivering communications services to subscribers.
Since inception, we have incurred significant operating losses and had an accumulated deficit of$1,020.4 million as of December 31, 2010. If we are unable to access or raise the capital needed to meet liquidityneeds and finance capital expenditures and working capital, or if the economic, market and geopoliticalconditions in the United States and the rest of the world do not improve or deteriorate, we may experiencematerial adverse impacts on our business, operating results and financial condition. During 2009, weimplemented several activities intended to reduce costs, improve operating efficiencies and change ouroperations to more closely align them with our key strategic focus, which included headcount reductions. During2010, we continued to focus on cost control and operating efficiency along with restrictions on discretionaryspending. The most significant cost-cutting measure during 2010 was the sale in September 2010 of our land andbuildings located in Oakland, California and extinguishment of related debt in a sale and leaseback transactionwith LBA Realty, LLC, or LBA Realty. The sale and leaseback transaction will allow us to reduce occupancycosts going forward and improved the current financial position by eliminating the related debt which was due inApril 2011.
Going forward, our key financial objectives include the following:
• Increasing revenue while continuing to carefully control costs;
• Continued investments in strategic research and product development activities that will provide themaximum potential return on investment; and
• Minimizing consumption of our cash and short-term investments.
Sale of Legacy Inventory and Other Assets
In January 2008, we sold our GigaMux legacy product line to a third party. The sale of the GigaMux legacyproduct line was not treated as a discontinued operation since it did not represent a component of the companythat had operations and cash flows that were clearly distinguishable, operationally and for financial reporting
13

purposes, from the rest of the entity. We allocated the proceeds received to receivables, inventory, fixed assetsand intangible assets based on the relative fair value of the assets sold. We recognized a gain of $1.3 million onthe sale of the inventory related to this product line in the first quarter of 2008 that was recorded in cost ofrevenue. We also recognized a gain of $0.5 million and $3.2 million on the sale of fixed assets and intangibleassets, respectively, in the first quarter of 2008 that was recorded as a component of operating expenses. We areentitled to additional contingent consideration for the sale of the GigaMux legacy product line upon the buyer’susage of inventory and/or attainment of certain performance targets through December 2010. Additionalcontingent consideration, if any, will be recorded upon receipt of cash as an additional gain in cost of revenue. In2008 and 2009, we received additional contingent consideration of $1.1 million and $0.4 million, respectively,related to the buyer’s usage of inventory related to the GigaMux legacy product line. We received no additionalcontingent consideration in 2010 related to the GigaMux legacy product line.
In December 2007, we sold inventory and certain assets related to our Access Node legacy product line to athird party. The sale of the Access Node product line was not treated as a discontinued operation since it did notrepresent a component of our company that had operations and cash flows that were clearly distinguishable,operationally and for financial reporting purposes, from the rest of the entity. Upon sale of the Access Nodeinventory, we recognized a gain of $1.7 million in 2007 that was recorded in cost of revenue. In 2008, 2009, and2010, we recognized additional gains of $0.2 million, $0.2 million, and $0.3 million, respectively, which wererecorded in cost of revenue. We will continue to record additional gain in the future contingent upon attainmentof certain earnout provisions.
Critical Accounting Policies and Estimates
Management’s discussion and analysis of financial condition and results of operations is based upon ourconsolidated financial statements, which have been prepared in accordance with generally accepted accountingprinciples in the United States of America. The preparation of these consolidated financial statements requiresmanagement to make estimates and judgments that affect the reported amounts of assets, liabilities, revenue andexpenses, and related disclosure of contingent assets and liabilities. The policies discussed below are consideredby management to be critical because changes in such estimates can materially affect the amount of our reportednet income or loss. For all of these policies, management cautions that actual results may differ materially fromthese estimates under different assumptions or conditions.
Revenue Recognition
We recognize revenue when the earnings process is complete. We recognize product revenue upon shipmentof product under contractual terms which transfer title to customers upon shipment, under normal credit terms,net of estimated sales returns and allowances at the time of shipment. Revenue is deferred if there are significantpost-delivery obligations or if the fees are not fixed or determinable. When significant post-delivery obligationsexist, revenue is deferred until such obligations are fulfilled. Our arrangements generally do not have anysignificant post-delivery obligations. If our arrangements include customer acceptance provisions, revenue isrecognized upon obtaining the signed acceptance certificate from the customer, unless we can objectivelydemonstrate that the delivered products or services meet all the acceptance criteria specified in the arrangementprior to obtaining the signed acceptance. In those instances where revenue is recognized prior to obtaining thesigned acceptance certificate, we use successful completion of customer testing as the basis to objectivelydemonstrate that the delivered products or services meet all the acceptance criteria specified in the arrangement.We also consider our historical acceptance experience with the customer, as well as the payment terms specifiedin the arrangement, when revenue is recognized prior to obtaining the signed acceptance certificate. We offerproducts and services such as support, education and training, hardware upgrades and post-warranty support. Formultiple element revenue arrangements, we establish the fair value of these products and services based primarilyon sales prices when the products and services are sold separately. If fair value cannot be established forundelivered elements, all of the revenue under the arrangement is deferred until those elements have beendelivered. When collectibility is not reasonably assured, revenue is recognized when cash is collected. Revenue
14

from education services and support services is recognized over the contract term or as the service is performed.We make certain sales to product distributors. These customers are given certain privileges to return a portion ofinventory. Return privileges generally allow distributors to return inventory based on a percent of purchasesmade within a specific period of time. We recognize revenue on sales to distributors that have contractual returnrights when the products have been sold by the distributors, unless there is sufficient customer specific sales andsales returns history to support revenue recognition upon shipment. In those instances when revenue isrecognized upon shipment to distributors, we use historical rates of return from the distributors to provide forestimated product returns. We accrue for warranty costs, sales returns and other allowances at the time ofshipment based on historical experience and expected future costs.
Allowances for Sales Returns and Doubtful Accounts
We record an allowance for sales returns for estimated future product returns related to current periodproduct revenue. The allowance for sales returns is recorded as a reduction of revenue and an allowance againstour accounts receivable. We base our allowance for sales returns on periodic assessments of historical trends inproduct return rates and current approved returned products. If the actual future returns were to deviate from thehistorical data on which the reserve had been established, our future revenue could be adversely affected. Werecord an allowance for doubtful accounts for estimated losses resulting from the inability of customers to makepayments for amounts owed to us. The allowance for doubtful accounts is recorded as a charge to general andadministrative expenses. We base our allowance on periodic assessments of our customers’ liquidity andfinancial condition through analysis of information obtained from credit rating agencies, financial statementreviews and historical collection trends. Additional allowances may be required in the future if the liquidity orfinancial condition of our customers deteriorates, resulting in impairment in their ability to make payments.
Stock-Based Compensation
We estimate the fair value of stock-based payment awards on the date of grant using the Black Scholespricing model, which is affected by our stock price as well as assumptions regarding a number of complex andsubjective variables. These variables include our expected stock price volatility over the term of the awards,actual and projected employee option exercise behaviors, risk free interest rate and expected dividends. Theexpected stock price volatility is based on the weighted average of the historical volatility of our common stockover the most recent period commensurate with the estimated expected life of our stock options. We base ourexpected life assumption on our historical experience and on the terms and conditions of the stock awards wegrant to employees. Risk free interest rates reflect the yield on zero-coupon U.S. Treasury securities. We do notanticipate paying any cash dividends in the foreseeable future and therefore use an expected dividend yield ofzero.
If factors change, and we employ different assumptions for estimating stock-based compensation expense infuture periods, or if we decide to use a different valuation model, the future periods may differ significantly fromwhat we have recorded in the current period and could materially affect our operating income, net loss and netloss per share. We are also required to estimate forfeitures at the time of grant and revise those estimates insubsequent periods if actual forfeitures differ from those estimates.
In addition, stock-based compensation expense was recorded for options issued to non-employees. Theseoptions are generally immediately exercisable and expire seven to ten years from the date of grant. We valuenon-employee options using the Black Scholes model. Non-employee options subject to vesting are valued asthey become vested.
In November 2008, we completed the Exchange Offer to exchange certain stock options issued to eligibleemployees, officers and directors of Zhone under Zhone’s equity incentive compensation plans. The primarypurpose of the Exchange Offer was to motivate, retain and reward talented employees and directors. Stockoptions previously granted that had an exercise price per share of equal to or greater than $1.75 per share were
15

eligible to be exchanged on a one-for-one basis for new stock options with an exercise price equal to the lastreported sale price of Zhone common stock on The Nasdaq Global Market on the date of grant. Options for anaggregate of 2.9 million shares of common stock were exchanged on November 17, 2008. The new stock optionsissued pursuant to the Exchange Offer have an exercise price of $0.50, vest over a four-year period with no creditfor past vesting and have a seven-year term. The Exchange Offer will result in incremental stock-basedcompensation of approximately $0.7 million to be recognized over the four-year vesting period. The remainingunrecognized compensation expense of the original grant will be amortized over the original requisite serviceperiod.
On March 31, 2010, our board of directors approved the acceleration of vesting of all unvested options topurchase shares of Zhone common stock issued in connection with the Exchange Offer that were held bymembers of Zhone’s senior management. The acceleration was effective as of March 31, 2010. Options topurchase an aggregate of approximately 0.9 million shares of Zhone common stock were subject to theacceleration and resulted in a compensation charge of $0.9 million which was fully expensed on March 31, 2010.The acceleration of these options was undertaken in recognition of the achievement of certain performanceobjectives by Zhone’s senior management.
Inventories
Inventories are stated at the lower of cost or market, with cost being determined using the first-in, first-out(FIFO) method. In assessing the net realizable value of inventories, we are required to make judgments as tofuture demand requirements and compare these with the current or committed inventory levels. Once inventoryhas been written down to its estimated net realizable value, its carrying value cannot be increased due tosubsequent changes in demand forecasts. To the extent that a severe decline in forecasted demand occurs, or weexperience a higher incidence of inventory obsolescence due to rapidly changing technology and customerrequirements, we may incur significant charges for excess inventory.
Operating Lease Liabilities
As a result of our acquisition of Paradyne in September 2005, we assumed certain lease liabilities forfacilities in Largo, Florida. We have accrued a liability for the excess portion of these facilities. The computationof the estimated liability includes a number of assumptions and subjective variables. These variables include thelevel and timing of future sublease income, amount of contractual variable costs, future market rental rates,discount rate, and other estimated expenses. If circumstances change, and we employ different assumptions infuture periods, the lease liability may differ significantly from what we have recorded in the current period andcould materially affect our net loss and net loss per share. During the second quarter of 2008, we increased theexcess lease liability balance by $3.3 million with a corresponding charge to general and administrativeexpenses. During 2009, we assumed that we would no longer be able to sublease the remaining excess space dueto the continued deterioration in the real estate market. Accordingly, during 2009, we increased our excess leaseliability balance by $0.6 million, with a corresponding charge to general and administrative expenses.
16

RESULTS OF OPERATIONS
We list in the table below the historical consolidated statement of operations as a percentage of net revenuefor the periods indicated.
Year ended December 31,
2010 2009 2008
Net revenue . . . . . . . . . . . . . . . . . . . . . . . . . . . . . . . . . . . . . . . . . . . . . . . . . . . . . . . . . . . . . 100% 100% 100%Cost of revenue . . . . . . . . . . . . . . . . . . . . . . . . . . . . . . . . . . . . . . . . . . . . . . . . . . . . . . . . . . 62% 64% 69%
Gross profit . . . . . . . . . . . . . . . . . . . . . . . . . . . . . . . . . . . . . . . . . . . . . . . . . . . . . . . . . . . . . 38% 36% 31%
Operating expenses:Research and product development . . . . . . . . . . . . . . . . . . . . . . . . . . . . . . . . . . . . . . . 16% 18% 19%Sales and marketing . . . . . . . . . . . . . . . . . . . . . . . . . . . . . . . . . . . . . . . . . . . . . . . . . . . 19% 17% 19%General and administrative . . . . . . . . . . . . . . . . . . . . . . . . . . . . . . . . . . . . . . . . . . . . . 8% 8% 11%Gain on sale of fixed assets . . . . . . . . . . . . . . . . . . . . . . . . . . . . . . . . . . . . . . . . . . . . . (2)% 0% 0%Gain on sale of intangible assets . . . . . . . . . . . . . . . . . . . . . . . . . . . . . . . . . . . . . . . . . 0% 0% (3)%Impairment of goodwill . . . . . . . . . . . . . . . . . . . . . . . . . . . . . . . . . . . . . . . . . . . . . . . . 0% 0% 48%
Total operating expenses . . . . . . . . . . . . . . . . . . . . . . . . . . . . . . . . . . . . . . . . . . . 41% 43% 94%
Operating loss . . . . . . . . . . . . . . . . . . . . . . . . . . . . . . . . . . . . . . . . . . . . . . . . . . . . . . . . . . . (3)% (7)% (63)%Interest expense . . . . . . . . . . . . . . . . . . . . . . . . . . . . . . . . . . . . . . . . . . . . . . . . . . . . . . . . . . (1)% (1)% (1)%Interest income . . . . . . . . . . . . . . . . . . . . . . . . . . . . . . . . . . . . . . . . . . . . . . . . . . . . . . . . . . . 0% 0% 1%Other income . . . . . . . . . . . . . . . . . . . . . . . . . . . . . . . . . . . . . . . . . . . . . . . . . . . . . . . . . . . . 0% 0% 0%
Loss before income taxes . . . . . . . . . . . . . . . . . . . . . . . . . . . . . . . . . . . . . . . . . . . . . . . . . . . (4)% (8)% (63)%Income tax provision . . . . . . . . . . . . . . . . . . . . . . . . . . . . . . . . . . . . . . . . . . . . . . . . . . . . . . 0% 0% 0%
Net loss . . . . . . . . . . . . . . . . . . . . . . . . . . . . . . . . . . . . . . . . . . . . . . . . . . . . . . . . . . . . . . . . . (4)% (8)% (63)%
2010 COMPAREDWITH 2009
Net Revenue
Information about our net revenue for products and services for 2010 and 2009 is summarized below (inmillions):
2010 2009Increase(Decrease)
%change
Products . . . . . . . . . . . . . . . . . . . . . . . . . . . . . . . . . . . . . . . $124.6 $120.9 $ 3.7 3%Services . . . . . . . . . . . . . . . . . . . . . . . . . . . . . . . . . . . . . . . 4.4 5.6 (1.2) (21)%
$129.0 $126.5 $ 2.5 2%
17

Information about our net revenue for North America and international markets for 2010 and 2009 issummarized below (in millions):
2010 2009Increase(Decrease)
%change
Revenue by geography:United States . . . . . . . . . . . . . . . . . . . . . . . . . . . . . . . $ 45.3 $ 50.1 $(4.8) (10)%Canada . . . . . . . . . . . . . . . . . . . . . . . . . . . . . . . . . . . . 4.9 5.5 (0.6) (11)%
Total North America . . . . . . . . . . . . . . . . . . . . . 50.2 55.6 (5.4) (10)%
Latin America . . . . . . . . . . . . . . . . . . . . . . . . . . . . . . 24.4 18.0 6.4 36%Europe, Middle East, Africa . . . . . . . . . . . . . . . . . . . 51.6 48.7 2.9 6%Asia Pacific . . . . . . . . . . . . . . . . . . . . . . . . . . . . . . . . 2.8 4.2 (1.4) (33)%
Total International . . . . . . . . . . . . . . . . . . . . . . . 78.8 70.9 7.9 11%
Total . . . . . . . . . . . . . . . . . . . . . . . . . . . . . . . . . . . . . . . . . . $129.0 $126.5 $ 2.5 2%
Net revenue increased 2% or $2.5 million to $129.0 million for 2010 compared to $126.5 million for 2009.The increase in net revenue was primarily attributable to an increase in product revenue, which in 2010 increased3% or $3.7 million compared to 2009. The increase was primarily due to increased sales in our SLMS productportfolio related to the continued success of our MXK product launch. Service revenue decreased 21% or $1.2million compared to 2009, primarily due to a decrease in gross sales accompanied by the timing of servicesperformed and revenue earned. Service revenue represents revenue from maintenance and other servicesassociated with product shipments.
International net revenue increased 11% or $7.9 million to $78.8 million in 2010 and represented 61% oftotal net revenue compared with 56% in 2009. The increase in international net revenue was primarily due tohigher demand in Latin America as a result of recent growth in demand for our products. In addition to thegrowth experienced in Latin America, we experienced continued growth associated with one customer in theMiddle East (Etisalat) that accounted for 24% of net revenue in 2010. The increase in international net revenuewas partially offset by a decrease in domestic net revenue of 10% or $5.4 million to $50.2 million in 2010compared to $55.6 million in 2009. The decrease was primarily the result of the continued weak economicconditions in the United States during 2010.
Etisalat accounted for 24% and 19% of net revenue in 2010 and 2009, respectively. We anticipate that ourresults of operations in any given period may depend to a large extent on sales to a small number of largeaccounts. As a result, our revenue for any quarter may be subject to significant volatility based upon changes inorders from one or a small number of key customers.
Cost of Revenue and Gross Profit
Total cost of revenue, including stock-based compensation, decreased $1.2 million or 2% to $79.9 millionfor 2010, compared to $81.1 million for 2009. Total cost of revenue was 62% of net revenue for 2010, comparedto 64% of net revenue for 2009, which resulted in an increase in gross profit percentage from 36% in 2009 to38% in 2010. The gross margin increased as compared with prior periods primarily due to increased sales volumeand the reduction in cost of revenue for the period resulting from greater sales of products with higher grossmargin, such as our MXK products.
We expect that in the future, our cost of revenue as a percentage of net revenue will vary depending on themix and average selling prices of products sold in the future. In addition, continued competitive and economicpressures could cause us to reduce our prices, adjust the carrying values of our inventory, or record inventorycharges relating to discontinued products and excess or obsolete inventory.
18

Research and Product Development Expenses
Research and product development expenses decreased 4% or $0.9 million to $21.2 million for 2010compared to $22.1 million for 2009. The decrease was primarily due to a reduction in non-personnel expensesresulting from the introduction of our MXK product to the market mid-year 2009 causing a decrease in prototypeand rework expenses of $0.7 million in 2010. We intend to continue to invest in research and productdevelopment to attain our strategic product development objectives, while seeking to manage the associated coststhrough expense controls.
Sales and Marketing Expenses
Sales and marketing expenses increased 9% or $2.0 million to $24.0 million for 2010 compared to$22.0 million for 2009. The increase was primarily attributable to increases in marketing expenses of $1.3million as we continue to grow our brand awareness which included increases of $0.5 million in personnel-related costs and $0.8 million in non-personnel costs. In addition, overall sales and customer service expensesincreased $0.7 million compared to 2009, mainly due to increased personnel-related expenses, including $0.3million of additional headcount expenses incurred to support operations in the Middle East.
General and Administrative Expenses
General and administrative expenses remained flat at $9.9 million for both 2010 and 2009. There werecontinued reductions made in personnel-related costs of $0.3 million in 2010 compared to 2009 and $0.4 millionin cost savings related to decreased property taxes resulting from our September 2010 sale of the Oakland,California campus. These decreases were offset by a $0.2 million increase in software maintenance expenses, and$0.5 million increase in other miscellaneous expenses.
Gain on Sale of Fixed Assets
Gain on sale of fixed assets was $2.0 million for 2010. The gain in 2010 was attributable to the sale of ourOakland, California campus, consisting of land and three buildings, in September 2010, as discussed in Note 5 ofthe consolidated financial statements. There were no similar sales of fixed assets in 2009.
Interest Expense
Interest expense for 2010 decreased by $0.3 million to $1.0 million compared to $1.3 million in 2009,primarily due to a decrease in outstanding debt balances and continued low interest rates during 2010. Thisincludes the effect of our September 2010 extinguishment of debt associated with the sale of our Oakland,California campus as discussed in Note 7 of the consolidated financial statements.
Interest Income
Interest income for 2010 decreased by $0.1 million to zero compared to $0.1 million in 2009 due to loweraverage balances of cash and short-term investments and the continued low interest rates during 2010.
Other Income
Other income for 2010 decreased by $0.1 million to zero compared to $0.1 million in 2009 due to decreasedsublease rental income received during 2010 as leases expired during the period.
Income Tax Provision
During the years ended December 31, 2010 and 2009, we recorded an income tax benefit of $0.1 millionand an income tax provision of $0.2 million, respectively, related to foreign and state taxes. No material
19

provision or benefit for income taxes was recorded in 2010 and 2009, due to our recurring operating losses andthe significant uncertainty regarding the realization of our net deferred tax assets, against which we havecontinued to record a full valuation allowance.
2009 COMPAREDWITH 2008
Revenue
Information about our net revenue for products and services for 2009 and 2008 is summarized below (inmillions):
2009 2008Increase(Decrease)
%change
Products . . . . . . . . . . . . . . . . . . . . . . . . . . . . . . . . . . . . . . . $120.9 $141.9 $(21.0) (15)%Services . . . . . . . . . . . . . . . . . . . . . . . . . . . . . . . . . . . . . . . 5.6 4.3 1.3 30%
$126.5 $146.2 $(19.7) (13)%
Information about our net revenue for North America and international markets for 2009 and 2008 issummarized below (in millions):
2009 2008Increase(Decrease)
%change
Revenue by geography:United States . . . . . . . . . . . . . . . . . . . . . . . . . . . . . . . $ 50.1 $ 60.8 $(10.7) (18)%Canada . . . . . . . . . . . . . . . . . . . . . . . . . . . . . . . . . . . . 5.5 5.4 0.1 2%
Total North America . . . . . . . . . . . . . . . . . . . . . 55.6 66.2 (10.6) (16)%
Latin America . . . . . . . . . . . . . . . . . . . . . . . . . . . . . . 18.0 32.2 (14.2) (44)%Europe, Middle East, Africa . . . . . . . . . . . . . . . . . . . 48.7 43.9 4.8 11%Asia Pacific . . . . . . . . . . . . . . . . . . . . . . . . . . . . . . . . 4.2 3.9 0.3 8%
Total International . . . . . . . . . . . . . . . . . . . . . . . 70.9 80.0 (9.1) (11)%
Total . . . . . . . . . . . . . . . . . . . . . . . . . . . . . . . . . . . . . . . . . . $126.5 $146.2 $(19.7) (13)%
Net revenue decreased 13% or $19.7 million to $126.5 million for 2009 compared to $146.2 million for2008. The decrease in net revenue was attributable to a decrease in product revenue, which in 2009, decreased15% or $21.0 million compared to 2008. The decrease was primarily due to the global recession and creditcontraction which caused many of our customers to defer or reduce their network expansion. Service revenueincreased 30% or $1.3 million compared to 2008. Service revenue represents revenue from maintenance andother services associated with product shipments.
International net revenue decreased 11% or $9.1 million to $70.9 million in 2009 and represented 56% oftotal net revenue compared with 55% in 2008. The decrease in international revenue was primarily due to lowerdemand in Latin America as a result of the global economic downturn and credit contraction. The decrease inLatin America was offset by an increase in revenue in Europe, Middle East and Africa in 2009 due to increasedsales of our new products. We experienced significant growth associated with one international customer(Etisalat) that accounted for 19% of net revenue in 2009.
During 2009, Etisalat accounted for 19% of net revenue and no customer accounted for 10% or more of netrevenue in 2008.
20

Cost of Revenue and Gross Profit
Total cost of revenue, including stock-based compensation, decreased $20.0 million, or 20% to$81.1 million for 2009, compared to $101.1 million for 2008. Total cost of revenue was 64% of net revenue for2009, compared to 69% of net revenue for 2008, which resulted in an increase in gross profit percentage from31% in 2008 to 36% in 2009. The increase in gross profit percentage during 2009 was attributed to the change inproduct mix and decrease in personnel-related costs for 2009. The change in product mix was mainly due to anincrease of $12.8 million in sales of the MXK product as compared with 2008, which has a higher gross margin.Personnel related costs for 2009 decreased over 2008 by $3.3 million primarily due to headcount reductions andeconomies of scale.
In January 2008, we sold inventory and certain assets related to our GigaMux legacy product line to a thirdparty. The sale of the GigaMux legacy product line was not treated as a discontinued operation since it did notrepresent a component of our company that had operations and cash flows that were clearly distinguishable,operationally and for financial reporting purposes, from the rest of the entity. Upon sale of the GigaMux legacyproduct line, we recognized a gain of $1.3 million during the first quarter of 2008 that was recorded in cost ofrevenue. Additional gains of $1.1 million and $0.4 million were recognized in 2008 and 2009, respectively,related to certain earnout provisions which were recorded in cost of revenue.
Research and Product Development Expenses
Research and product development expenses decreased 18% or $5.0 million to $22.1 million for 2009compared to $27.1 million for 2008. The decrease was primarily due to restructuring efforts to streamlineprocesses, which reduced personnel-related costs by $3.1 million and prototype costs by $1.2 million.
Sales and Marketing Expenses
Sales and marketing expenses decreased 22% or $6.3 million to $22.0 million for 2009 compared to$28.3 million for 2008. The decrease was primarily attributable to reductions in personnel-related costs of $1.8million from lower headcount as we realigned our resources to focus on emerging markets and also due to lowercommission expenses of $1.5 million related to decreased sales, and a reduction in travel expenses of $1.0million and trade show expenses of $0.9 million.
General and Administrative Expenses
General and administrative expenses decreased 37% or $5.7 million to $9.9 million for 2009 compared to$15.6 million for 2008. The decrease was primarily due to a reduction in personnel-related costs of $0.8 million,accounting and legal fees of $0.8 million and bad debt expenses of $0.8 million. In addition, during the secondquarter of 2008, we significantly reduced our assumptions regarding estimated future sublease income primarilyas a result of the deteriorating real estate market. Accordingly, we increased the excess lease liability balance by$3.3 million with a corresponding charge to general and administrative expenses during the second quarter of2008.
Gain on Sale of Fixed Assets
Gain on sale of fixed assets was $0.5 million for 2008. The gain in 2008 was attributable to the sale of fixedassets associated with our sale of the GigaMux legacy product line in January 2008. There were no similar salesof fixed assets for 2009.
Gain on Sale of Intangible Assets
Gain on sale of intangible assets was $4.4 million for 2008. The gain in 2008 was attributable to the sale ofintangible assets associated with our sale of the GigaMux legacy product line sold in January 2008 and the sale ofour non-strategic legacy patents. There were no similar sales of intangible assets for 2009.
21

Impairment of Intangible Assets and Goodwill
We review goodwill and other long-lived assets, including intangible assets, for impairment annually orwhenever events or changes in circumstances indicate that the carrying value of an asset may not be recoverable.In June 2008, we reviewed goodwill for impairment due to the significant decrease in our market capitalization inthe three months ended June 30, 2008 as well as subsequent to period end. We determined that indicators ofimpairment existed, resulting in a goodwill impairment loss of $70.4 million during the second quarter of 2008.At December 31, 2008, we had no remaining goodwill or intangible assets.
Interest Expense
Interest expense for 2009 decreased by $0.3 million to $1.3 million compared to $1.6 million in 2008 due toa decrease in the outstanding debt balances and a reduction in interest rates during 2009.
Interest Income
Interest income for 2009 decreased by $0.6 million to $0.1 million compared to $0.7 million in 2008 due tolower average balances of cash and short-term investments and a reduction in interest rates during 2009.
Income Tax Provision
During the years ended December 31, 2009 and 2008, we recorded an income tax provision of $0.2 millionand $0.3 million, respectively, related to foreign and state taxes. No material provision or benefit for incometaxes was recorded in 2009 and 2008, due to our recurring operating losses and the significant uncertaintyregarding the realization of our net deferred tax assets, against which we have continued to record a full valuationallowance.
LIQUIDITY AND CAPITAL RESOURCES
Our operations are financed through a combination of our existing cash, cash equivalents, available creditfacilities, and sales of equity and debt instruments, based on our operating requirements and market conditions.
At December 31, 2010, cash, cash equivalents and short-term investments were $21.2 million compared to$21.8 million at December 31, 2009. This amount included cash and cash equivalents of $21.2 million atDecember 31, 2010 compared to $21.5 million at December 31, 2009. The decrease in cash and cash equivalentsof $0.3 million was attributable to net cash used in investing activities and financing activities of $2.3 million and$0.1 million, respectively, offset by net cash provided by operating activities of $2.1 million.
Operating Activities
For fiscal year 2010, net cash provided by operating activities consisted of a net loss of $4.8 million,adjusted for non-cash charges totaling $2.7 million and a decrease in operating assets totaling $4.2 million. Themost significant components of the changes in net operating assets were a decrease in accounts receivable of $6.6million partially offset by a decrease in accounts payable of $3.1 million. The decrease in accounts receivablerelated to significant cash collections, primarily related to Etisalat, which were in turn used to pay downoutstanding payables causing the related decrease in the accounts payable balance.
For fiscal year 2009, net cash used in operating activities consisted of a net loss of $10.0 million, adjustedfor non-cash charges totaling $5.9 million and an increase in operating assets totaling $4.4 million. The mostsignificant components of the changes in net operating assets were an increase in accounts receivable of $15.2million offset by a decrease in inventories of $10.5 million. The increase in accounts receivable was primarilydue to the aging of Etisalat balances which accounted for 66% of net accounts receivable as of December 31,2009. The decrease in inventories was primarily due to better utilization of inventory during 2009.
22

Investing Activities
For fiscal year 2010, net cash used in investing activities consisted primarily of purchases of property andequipment of $3.2 million offset by proceeds from the sale of our Oakland, California campus andextinguishment of related debt of $0.6 million (as discussed in Note 7 of the consolidated financial statements)and proceeds from the maturity of short-term investments of $0.3 million. As part of our September 2010 saleand leaseback transaction with LBA Realty, we moved into another building at the Oakland location andperformed significant build-out of new labs and redesigned office spaces resulting in an increase in property andequipment purchases as compared to 2009.
For fiscal year 2009, net cash provided by investing activities consisted primarily of proceeds from the saleand maturity of short-term investments of $2.9 million offset by purchases of short-term investments of $0.3million and equipment purchases of $0.8 million.
Financing Activities
For fiscal year 2010, net cash used in financing activities consisted of repayment of the secured real estatedebt of $0.3 million for the period before the sale of the Oakland, California campus and extinguishment of therelated debt transaction as discussed in Note 5 of the consolidated financial statements. This was partially offsetby the proceeds related to exercise of stock options and purchases made under our 2002 Employee StockPurchase Plan, or ESPP of $0.2 million.
For fiscal year 2009, net cash used in financing activities consisted primarily of repayment of the debt andcredit facility of $5.4 million primarily in connection with the replacement of our existing revolving line of creditand letter of credit facility with SVB with a new revolving line of credit and letter of credit in March 2009.
Cash Management
Our primary source of liquidity comes from our cash and cash equivalents, which totaled $21.2 million atDecember 31, 2010, and our $25.0 million SVB Facility. Our cash and cash equivalents are held in accountsmanaged by third party financial institutions and consist of invested cash and cash in our operating accounts. Atcurrent revenue levels, we anticipate that some portion of our existing cash and cash equivalents will continue tobe consumed by operations.
Under the SVB Facility, we have the option of borrowing funds at agreed upon interest rates. The amountthat we are able to borrow under the SVB Facility varies based on the eligible accounts receivable, as defined inthe agreement, as long as the principal amount outstanding does not exceed $25.0 million. In addition, under theSVB Facility, we are able to utilize the facility as security for letters of credit.
Under the SVB Facility, $10.0 million was outstanding at December 31, 2010. In addition, $6.4 million wascommitted as security for various letters of credit and $7.7 million was unused and available for borrowing as ofDecember 31, 2010. As of December 31, 2010, the amounts borrowed under the SVB Facility bore interest,payable monthly, at a floating rate that was SVB’s prime rate plus 2.5%, with a minimum interest rate of 6.5%.The interest rate was 6.5% at December 31, 2010.
Our obligations under the SVB Facility are secured by substantially all of our personal property assets andthose of our subsidiaries, including our intellectual property. The SVB Facility contains certain financialcovenants, and customary affirmative covenants and negative covenants. If we do not comply with the variouscovenants and other requirements under the SVB Facility, SVB is entitled to, among other things, require theimmediate repayment of all outstanding amounts and sell our assets to satisfy the obligations under the SVBFacility. As of December 31, 2010, we were not in compliance with the financial covenant regarding minimumEBITDA under the SVB Facility. On January 19, 2011, we entered into an amendment with SVB in which SVB
23

agreed to waive our obligation to comply with the financial covenant regarding minimum EBITDA for thecompliance period ending December 31, 2010.
In January 2011, we repaid the $10.0 million outstanding under the SVB Facility. On March 14, 2011, werenewed the SVB Facility to provide liquidity and working capital through March 13, 2012 and amended theinterest rate applicable to amounts borrowed under the SVB Facility, as discussed in Note 16 to the consolidatedfinancial statements.
Future Requirements and Funding Sources
Our fixed commitments for cash expenditures consist primarily of payments under operating leases,inventory purchase commitments, and payments of principal and interest for debt obligations. As a result of theParadyne acquisition in 2005, we assumed a lease commitment for facilities in Largo, Florida. The term of thelease expires in June 2012 and had an estimated remaining obligation of approximately $6.5 million as ofDecember 31, 2010. We intend to continue to occupy only a portion of these facilities and are evaluating ouroptions to exit the excess portion of the lease. We have recorded a liability of $2.7 million as of December 31,2010, which we believe is adequate to cover costs incurred to exit the excess portion of these facilities, net ofestimated sublease income. Our operating lease commitments also include $3.0 million of future minimum leasepayments spread over the five-year lease term under the lease agreement we entered into with LBA Realty inSeptember 2010 with respect to our Oakland, California campus following the sale of our campus to LBA Realtyin a sale-leaseback transaction.
As a result of the financial demands of major network deployments and the difficulty in accessing capitalmarkets, network service providers continue to request financing assistance from their suppliers. From time totime, we may provide or commit to extend credit or credit support to our customers. This financing may includeextending the terms for product payments to customers. Depending upon market conditions, we may seek tofactor these arrangements to financial institutions and investors to reduce the amount of our financialcommitments associated with such arrangements. For example, during the year ended December 31, 2008, wesold $10.2 million of customer trade receivables to SVB on a non-recourse basis in exchange for cash. The saleof the receivables did not represent a securitization, and there was no continuing involvement or interests in thereceivables by us after the sale. Our ability to provide customer financing is limited and depends upon a numberof factors, including our capital structure, the level of our available credit and our ability to factor commitmentsto third parties. Any extension of financing to our customers will limit the capital that we have available for otheruses.
Our accounts receivable, while not considered a primary source of liquidity, represent a concentration ofcredit risk because a significant portion of the accounts receivable balance at any point in time typically consistsof large balances due from a relatively small number of customer account balances. As of December 31, 2010,Etisalat accounted for 30% of net accounts receivable, and receivables from customers in countries other than theUnited States of America represented 74% of net accounts receivable. We do not currently have any materialcommitments for capital expenditures, or any other material commitments aside from operating leases for ourfacilities, inventory purchase commitments and debt.
We expect that operating losses and negative cash flows from operations may continue. In order to meet ourliquidity needs and finance our capital expenditures and working capital needs for our business, we may berequired to sell assets, issue debt or equity securities or borrow on unfavorable terms. Continued uncertaintyregarding financial institutions’ ability and inclination to lend may negatively impact our ability to access debtfinancing or to refinance existing indebtedness in the future on favorable terms, or at all. We may be unable tosell assets, issue securities or access additional indebtedness to meet these needs on favorable terms, or at all. Ifadditional capital is raised through the issuance of debt securities or other debt financing, the terms of such debtmay include covenants, restrictions and financial ratios that may restrict our ability to operate our business.Likewise, any equity financing could result in additional dilution of our stockholders. If we are unable to obtain
24

additional capital or are required to obtain additional capital on terms that are not favorable to us, we may berequired to reduce the scope of our planned product development and sales and marketing efforts beyond thereductions we have previously taken. Based on our current plans and business conditions, we believe that ourexisting cash, cash equivalents and available credit facilities will be sufficient to satisfy our anticipated cashrequirements for the foreseeable future.
Contractual Commitments and Off-Balance Sheet Arrangements
At December 31, 2010, our future contractual commitments by fiscal year were as follows (in thousands):
Payments due by period
Total 2011 2012 2013 20142015 andthereafter
Operating leases . . . . . . . . . . . . . . . . . . . . . . . . . . . . . . . . $10,045 $ 5,291 $2,910 $690 $654 $500Purchase commitments . . . . . . . . . . . . . . . . . . . . . . . . . . . 7,320 7,320 — — — —Line of credit . . . . . . . . . . . . . . . . . . . . . . . . . . . . . . . . . . 10,000 10,000 — — — —
Total future contractual commitments . . . . . . . . . . . $27,365 $22,611 $2,910 $690 $654 $500
Operating Leases
The operating lease amounts shown above represent primarily off-balance sheet arrangements. For operatinglease commitments, a liability is generally not recorded on our balance sheet unless the facility represents anexcess facility for which an estimate of the facility exit costs has been recorded on our balance sheet, net ofestimated sublease income. For operating leases that include contractual commitments for operating expensesand maintenance, estimates of such amounts are included based on current rates. Payments made under operatingleases will be treated as rent expense for the facilities currently being utilized. Of the total $10.0 millionoperating lease amount, $2.7 million has been recorded as a liability on our balance sheet as of December 31,2010.
Purchase Commitments
The purchase commitments shown above represent non-cancellable inventory purchase commitments as ofDecember 31, 2010. The inventory purchase commitments typically allow for cancellation of orders 30 days inadvance of the required inventory availability date as set by us at time of order.
Line of Credit
The line of credit obligation has been recorded as a liability on our balance sheet. The line of creditobligation amount shown above represents the scheduled principal repayment under our SVB Facility, but not theassociated interest payments which may vary based on changes in market interest rates. At December 31, 2010,the interest rate under our SVB Facility was 6.5%.
As of December 31, 2010, we had $10.0 million outstanding under the SVB Facility and an additional$6.4 million committed as security for various letters of credit, as discussed in Note 7 to the consolidatedfinancial statements.
Sale-leaseback of Oakland, California Campus
On September 28, 2010, we sold our Oakland, California campus, consisting of land and three buildings, toLBA Realty for approximately $18.8 million. As part of the sale transaction, LBA Realty agreed to settle oursecured real estate debt which was secured by the Oakland, California campus for a net sum of $17.6 million.
25
In connection with the sale, we entered into a Multi-Tenant Commercial/Industrial Lease Agreement, or theLease Agreement, to rent one of the buildings from LBA Realty for a five-year term, commencing from theclosing of the sale. The initial annual rent under the Lease Agreement is approximately $0.6 million, withperiodic rent escalations at a rate of approximately 2% per annum. Under the Lease Agreement, in October 2010,we also received a non-refundable tenant improvement allowance of $1.7 million for the required alterations tothe property being leased back. The tenant improvement allowance amount will be amortized over the term of thelease as an offset to rent expense.
Recent Accounting Pronouncements
In September 2009, the Financial Accounting Standards Board (FASB) issued an Accounting StandardsUpdate (ASU) 2009-13, Revenue Recognition (Topic 605): Multiple-Deliverable Revenue Arrangements. Assummarized in ASU 2009-13, ASC Topic 605 has been amended (1) to provide updated guidance on whethermultiple deliverables exist, how the deliverables in an arrangement should be separated, and the considerationallocated; (2) to require an entity to allocate revenue in an arrangement using estimated selling prices ofdeliverables if a vendor does not have Vendor-Specific Objective Evidence (VSOE) or third-party evidence ofselling price; and (3) to eliminate the use of the residual method and require an entity to allocate revenue usingthe relative selling price method. The accounting changes summarized in ASU 2009-13 are effective for fiscalyears beginning on or after June 15, 2010, with early adoption permitted. Adoption may either be on aprospective basis or by retrospective application. We have assessed the impact of this amendment to the ASC onour accounting and reporting systems and processes; and do not anticipate the adoption to have a material impacton the consolidated financial statements.
In January 2010, FASB issued ASU 2010-06, Fair Value Measurements and Disclosures (Topic 820):Improving Disclosures about Fair Value Measurements. The update requires new disclosures about recurring ornonrecurring fair-value measurements including significant transfers into and out of Level 1 and Level 2 fair-value measurements. We adopted the updated standard as of March 31, 2010. The adoption did not have anyimpact on the consolidated financial statements.
26

Forward-looking Statements
This Annual Report on Form 10-K, including “Management’s Discussion and Analysis of FinancialCondition and Results of Operations,” contains forward-looking statements regarding future events and ourfuture results that are subject to the safe harbors created under the Securities Act of 1933 and the SecuritiesExchange Act of 1934. These statements are based on current expectations, estimates, forecasts, and projectionsabout the industries in which we operate and the beliefs and assumptions of our management. We use words suchas “anticipate,” “believe,” “continue,” “could,” “estimate,” “expect,” “goal,” “intend,” “may,” “plan,” “project,”“seek,” “should,” “target,” “will,” “would,” variations of such words, and similar expressions to identifyforward-looking statements. In addition, statements that refer to projections of earnings, revenue, costs or otherfinancial items; anticipated growth and trends in our business or key markets; future growth and revenues fromour Single Line Multi-Service, or SLMS, products; our ability to repay our existing indebtedness prior to theapplicable maturity date; future economic conditions and performance; anticipated performance of products orservices; plans, objectives and strategies for future operations; and other characterizations of future events orcircumstances, are forward-looking statements. Readers are cautioned that these forward-looking statements areonly predictions and are subject to risks, uncertainties and assumptions that are difficult to predict, includingthose identified under the heading “Risk Factors” in Item 1A, elsewhere in this report and our other filings withthe Securities and Exchange Commission (the SEC). Therefore, actual results may differ materially andadversely from those expressed in any forward-looking statements. Factors that might cause such a differenceinclude, but are not limited to, the ability to generate sufficient revenue to achieve or sustain profitability, theability to raise additional capital to fund existing and future operations or to repay our existing indebtedness,defects or other performance problems in our products, the economic slowdown in the telecommunicationsindustry that has restricted the ability of our customers to purchase our products, commercial acceptance of ourSLMS products, intense competition in the communications equipment market from large equipment companiesas well as private companies with products that address the same networks needs as our products, higher thananticipated expenses that we may incur, and other factors identified elsewhere in this report. We undertake noobligation to revise or update any forward-looking statements for any reason.
RISK FACTORS
Set forth below and elsewhere in this report and in other documents we file with the SEC are risks anduncertainties that could cause actual results to differ materially from the results contemplated by the forward-looking statements contained in this report.
Our future operating results are difficult to predict and our stock price may continue to be volatile.
As a result of a variety of factors discussed in this report, our revenues for a particular quarter are difficult topredict. Our revenue and operating results may vary significantly from quarter to quarter due to a number offactors, many of which are outside of our control. The primary factors that may affect our results of operationsinclude the following:
• commercial acceptance of our SLMS products;
• fluctuations in demand for network access products;
• the timing and size of orders from customers;
• the ability of our customers to finance their purchase of our products as well as their own operations;
• new product introductions, enhancements or announcements by our competitors;
• our ability to develop, introduce and ship new products and product enhancements that meet customerrequirements in a timely manner;
• changes in our pricing policies or the pricing policies of our competitors;
27

• the ability of our company and our contract manufacturers to attain and maintain production volumesand quality levels for our products;
• our ability to obtain sufficient supplies of sole or limited source components;
• increases in the prices of the components we purchase, or quality problems associated with thesecomponents;
• unanticipated changes in regulatory requirements which may require us to redesign portions of ourproducts;
• changes in accounting rules, such as recording expenses for employee stock option grants;
• integrating and operating any acquired businesses;
• our ability to achieve targeted cost reductions;
• how well we execute on our strategy and operating plans; and
• general economic conditions as well as those specific to the communications, internet and relatedindustries.
Any of the foregoing factors, or any other factors discussed elsewhere herein, could have a material adverseeffect on our business, results of operations, and financial condition that could adversely affect our stock price. Inaddition, public stock markets have experienced, and may in the future experience, extreme price and tradingvolume volatility, particularly in the technology sectors of the market. This volatility has significantly affectedthe market prices of securities of many technology companies for reasons frequently unrelated to ordisproportionately impacted by the operating performance of these companies. These broad market fluctuationsmay adversely affect the market price of our common stock. In addition, if our average market capitalization fallsbelow the carrying value of our assets for an extended period of time as it did in 2008 and 2009, this may indicatethat the fair value of our net assets is below their carrying value, and may result in recording impairment charges.
We have incurred significant losses to date and expect that we may continue to incur losses in theforeseeable future. If we fail to generate sufficient revenue to achieve or sustain profitability, our stockprice could decline.
We have incurred significant losses to date and expect that we may continue to incur losses in theforeseeable future. Our net losses for 2010 and 2009 were $4.8 million and $10.0 million, respectively, and wehad an accumulated deficit of $1,020.4 million at December 31, 2010. We have significant fixed expenses andexpect that we will continue to incur substantial manufacturing, research and product development, sales andmarketing, customer support, administrative and other expenses in connection with the ongoing development ofour business. In addition, we may be required to spend more on research and product development than originallybudgeted to respond to industry trends. We may also incur significant new costs related to acquisitions and theintegration of new technologies and other acquisitions that may occur in the future. We may not be able toadequately control costs and expenses or achieve or maintain adequate operating margins. As a result, our abilityto achieve and sustain profitability will depend on our ability to generate and sustain substantially higher revenuewhile maintaining reasonable cost and expense levels. If we fail to generate sufficient revenue to achieve orsustain profitability, we will continue to incur substantial operating losses and our stock price could decline.
We have significant debt obligations, which could adversely affect our business, operating results andfinancial condition.
As of December 31, 2010, we had approximately $10.0 million of total debt outstanding under our $25.0million revolving line of credit and letter of credit facility with Silicon Valley Bank, or SVB (the SVB Facility),of which all was current. Although we repaid this debt in full in January 2011, we expect to continue to make
28

borrowings from time to time under the SVB Facility. In addition, as of December 31, 2010, $6.4 million wascommitted as security for various letters of credit under the SVB Facility. Our debt obligations could materiallyand adversely affect us in a number of ways, including:
• limiting our ability to obtain additional financing in the future for working capital, capital expenditures,acquisitions or general corporate purposes;
• limiting our flexibility to plan for, or react to, changes in our business or market conditions;
• requiring us to use a significant portion of any future cash flow from operations to repay or service thedebt, thereby reducing the amount of cash available for other purposes;
• making us more highly leveraged than some of our competitors, which may place us at a competitivedisadvantage; and
• making us more vulnerable to the impact of adverse economic and industry conditions and increases ininterest rates.
We cannot assure you that we will be able to generate sufficient cash flow in amounts sufficient to enable usto service our debt or to meet our working capital and capital expenditure requirements. If we are unable togenerate sufficient cash flow from operations or to borrow sufficient funds to service our debt, due to borrowingbase restrictions or otherwise, we may be required to sell assets, reduce capital expenditures or obtain additionalfinancing. We cannot assure you that we will be able to engage in any of these actions on reasonable terms, if atall.
If we default under our SVB Facility because of a covenant breach or otherwise, all outstanding amountsthereunder could become immediately due and payable. Our failure to satisfy the financial covenant regardingminimum EBITDA for the compliance period ended December 31, 2010 constituted a default under the SVBFacility. In January 2011 we entered into an amendment with SVB in which SVB agreed to waive compliancewith this covenant for the compliance periods ended December 31, 2010. We cannot give assurances that we willbe able to obtain a waiver should a default occur in the future. Any acceleration of amounts due could have amaterial adverse effect on our liquidity and financial condition.
If we are unable to obtain additional capital to fund our existing and future operations, we may berequired to reduce the scope of our planned product development, and marketing and sales efforts, whichwould harm our business, financial condition and results of operations.
The development and marketing of new products, and the expansion of our direct sales operations andassociated support personnel requires a significant commitment of resources. We may continue to incursignificant operating losses or expend significant amounts of capital if:
• the market for our products develops more slowly than anticipated;
• we fail to establish market share or generate revenue at anticipated levels;
• our capital expenditure forecasts change or prove inaccurate; or
• we fail to respond to unforeseen challenges or take advantage of unanticipated opportunities.
As a result, we may need to raise substantial additional capital. Additional capital, if required, may not beavailable on acceptable terms, or at all. For example, U.S. credit markets have in recent years experiencedsignificant dislocations and liquidity disruptions which caused the spreads on prospective debt financings towiden considerably. These circumstances materially impacted liquidity in debt markets, making financing termsfor borrowers less attractive and resulting in the general unavailability of some forms of debt financing.Uncertainty in credit or capital markets could negatively impact our ability to access debt financing or torefinance existing indebtedness in the future on favorable terms, or at all. If additional capital is raised through
29

the issuance of debt securities or other debt financing, the terms of such debt may include covenants, restrictionsand financial ratios that may restrict our ability to operate our business. Weak and recessionary economicconditions in recent years have also adversely affected the trading prices of equity securities of many U.S.companies, including Zhone, which may make it more difficult or costly for us to raise capital through theissuance of common stock, preferred stock or other equity securities. If we elect to raise equity capital, this maybe dilutive to existing stockholders and could reduce the trading price of our common stock. If we are unable toobtain additional capital or are required to obtain additional capital on terms that are not favorable to us, we maybe required to reduce the scope of our planned product development and sales and marketing efforts beyond thereductions that we have previously taken, which could have a material adverse effect on our business, financialcondition and results of operations.
Our lack of liquid funds and other sources of financing may limit our ability to maintain our existingoperations, grow our business and compete effectively.
Our continued losses reduced our cash, cash equivalents and short-term investments in 2009 and 2010. Asof December 31, 2010, we had approximately $21.2 million in cash, cash equivalents and short-term investmentsand $10.0 million outstanding under our bank lending facility. In order to meet our liquidity needs and financeour capital expenditures and working capital needs for our business, we may be required to sell assets, or toborrow on potentially unfavorable terms. We may be unable to sell assets, or access additional indebtedness tomeet these needs. As a result, we may become unable to pay our ordinary expenses, including our debt service,on a timely basis. Our current lack of liquidity could harm us by:
• increasing our vulnerability to adverse economic conditions in our industry or the economy in general;
• requiring substantial amounts of cash to be used for debt servicing, rather than other purposes, includingoperations;
• limiting our ability to plan for, or react to, changes in our business and industry; and
• influencing investor and customer perceptions about our financial stability and limiting our ability toobtain financing or acquire customers.
We cannot be certain that additional financing, if needed, will be available on acceptable terms or at all. Ifwe cannot raise any necessary additional financing on acceptable terms, we may not be able to fund our businessexpansion, take advantage of future opportunities, meet our existing debt obligations or respond to competitivepressures or unanticipated capital requirements, any of which could have a material adverse effect on ourbusiness, financial condition and results of operations. Further, if we issue additional equity or debt securities,stockholders may experience additional dilution or the new equity securities may have rights, preference orprivileges senior to those of existing holders of our common stock.
We face a number of risks related to continued weak economic and market conditions.
Global market and economic conditions over the past three years have been unprecedented and challenging,with most major economies experiencing tighter credit conditions and an economic recession. Continued marketturbulence and weak economic conditions, as well as concerns about energy costs, geopolitical issues, theavailability and cost of credit, and the global housing and mortgage markets have contributed to continuedmarket volatility and weak economic growth in most major economies. These conditions, combined with volatileoil prices, low business and consumer confidence and continued significant unemployment, have contributed tovolatility of unprecedented levels. Continued weak economic and market conditions globally could impact ourbusiness in a number of ways, including:
Potential deferment of purchases and orders by customers: Uncertainty about current and future global economicconditions may cause consumers, businesses and governments to defer purchases in response to continued flat
30

revenue budgets, tighter credit, decreased cash availability and weak consumer confidence. Accordingly, futuredemand for our products could differ materially from our current expectations.
Customers’ inability to obtain financing to make purchases from Zhone and/or maintain their business: Some ofour customers require substantial financing in order to finance their business operations, including capitalexpenditures on new equipment and equipment upgrades, and make purchases from Zhone. The potentialinability of these customers to access the capital needed to finance purchases of our products and meet theirpayment obligations to us could adversely impact our financial condition and results of operations. If ourcustomers become insolvent due to market and economic conditions or otherwise, it could have a materialadverse impact on our business, financial condition and results of operations.
Negative impact from increased financial pressures on third-party dealers, distributors and retailers: We makesales in certain regions through third-party dealers, distributors and retailers. These third parties may beimpacted, among other things, by the significant decrease in available credit in recent years. If credit pressures orother financial difficulties result in insolvency for these third parties and we are unable to successfully transitionend customers to purchase our products from other third parties, or from us directly, it could adversely impactour financial condition and results of operations.
Negative impact from increased financial pressures on key suppliers: Our ability to meet customers’ demandsdepends, in part, on our ability to obtain timely and adequate delivery of quality materials, parts and componentsfrom our suppliers. Certain of our components are available only from a single source or limited sources. Ifcertain key suppliers were to become capacity constrained or insolvent, it could result in a reduction orinterruption in supplies or a significant increase in the price of supplies and adversely impact our financialcondition and results of operations. In addition, credit constraints of key suppliers could result in acceleratedpayment of accounts payable by Zhone, impacting our cash flow.
If weak economic, market and geopolitical conditions in the United States and the rest of the world continue orworsen, we may experience material adverse impacts on our business, operating results and financial condition.
If demand for our SLMS products does not develop, then our results of operations and financial conditionwill be adversely affected.
Our future revenue depends significantly on our ability to successfully develop, enhance and market ourSLMS products to the network service provider market. Most network service providers have made substantialinvestments in their current infrastructure, and they may elect to remain with their current architectures or toadopt new architectures, such as SLMS, in limited stages or over extended periods of time. A decision by acustomer to purchase our SLMS products will involve a significant capital investment. We must convince ourservice provider customers that they will achieve substantial benefits by deploying our products for futureupgrades or expansions. We do not know whether a viable market for our SLMS products will develop or besustainable. If this market does not develop or develops more slowly than we expect, our business, financialcondition and results of operations will be seriously harmed.
We depend upon the development of new products and enhancements to existing products, and if we fail topredict and respond to emerging technological trends and customers’ changing needs, our operatingresults and market share may suffer.
The markets for our products are characterized by rapidly changing technology, evolving industry standards,changes in end-user requirements, frequent new product introductions and changes in communications offeringsfrom network service provider customers. Our future success depends on our ability to anticipate or adapt to suchchanges and to offer, on a timely and cost-effective basis, products that meet changing customer demands andindustry standards. We may not have sufficient resources to successfully and accurately anticipate customers’
31
changing needs and technological trends, manage long development cycles or develop, introduce and market newproducts and enhancements. The process of developing new technology is complex and uncertain, and if we failto develop new products or enhancements to existing products on a timely and cost-effective basis, or if our newproducts or enhancements fail to achieve market acceptance, our business, financial condition and results ofoperations would be materially adversely affected.
Because our products are complex and are deployed in complex environments, our products may havedefects that we discover only after full deployment by our customers, which could seriously harm ourbusiness.
We produce highly complex products that incorporate leading-edge technology, including both hardwareand software. Software typically contains defects or programming flaws that can unexpectedly interfere withexpected operations. In addition, our products are complex and are designed to be deployed in large quantitiesacross complex networks. Because of the nature of these products, they can only be fully tested when completelydeployed in large networks with high amounts of traffic, and there is no assurance that our pre-shipment testingprograms will be adequate to detect all defects. As a result, our customers may discover errors or defects in ourhardware or software, or our products may not operate as expected, after they have been fully deployed by ourcustomers. If we are unable to cure a product defect, we could experience damage to our reputation, reducedcustomer satisfaction, loss of existing customers and failure to attract new customers, failure to achieve marketacceptance, reduced sales opportunities, loss of revenue and market share, increased service and warranty costs,diversion of development resources, legal actions by our customers, and increased insurance costs. Defects,integration issues or other performance problems in our products could also result in financial or other damagesto our customers. Our customers could seek damages for related losses from us, which could seriously harm ourbusiness, financial condition and results of operations. A product liability claim brought against us, even ifunsuccessful, would likely be time consuming and costly. The occurrence of any of these problems wouldseriously harm our business, financial condition and results of operations.
A shortage of adequate component supply or manufacturing capacity could increase our costs or cause adelay in our ability to fulfill orders, and our failure to estimate customer demand properly may result inexcess or obsolete component inventories that could adversely affect our gross margins.
Occasionally, we may experience a supply shortage, or a delay in receiving, certain component parts as aresult of strong demand for the component parts and/or capacity constraints or other problems experienced bysuppliers. If shortages or delays persist, the price of these components may increase, or the components may notbe available at all, and we may also encounter shortages if we do not accurately anticipate our needs. Conversely,we may not be able to secure enough components at reasonable prices or of acceptable quality to build newproducts in a timely manner in the quantities or configurations needed. Accordingly, our revenue and grossmargins could suffer until other sources can be developed. Our operating results would also be adversely affectedif, anticipating greater demand than actually develops, we commit to the purchase of more components than weneed. Furthermore, as a result of binding price or purchase commitments with suppliers, we may be obligated topurchase components at prices that are higher than those available in the current market. In the event that webecome committed to purchase components at prices in excess of the current market price when the componentsare actually used, our gross margins could decrease. In the past we experienced component shortages thatadversely affected our financial results and in the future may continue to experience component shortages.
We rely on contract manufacturers for a portion of our manufacturing requirements.
We rely on contract manufacturers to perform a portion of the manufacturing operations for our products.These contract manufacturers build product for other companies, including our competitors. In addition, we donot have contracts in place with some of these providers and may not be able to effectively manage thoserelationships. We cannot be certain that our contract manufacturers will be able to fill our orders in a timelymanner. We face a number of risks associated with this dependence on contract manufacturers including reduced
32

control over delivery schedules, the potential lack of adequate capacity during periods of excess demand, poormanufacturing yields and high costs, quality assurance, increases in prices, and the potential misappropriation ofour intellectual property. We have experienced in the past, and may experience in the future, problems with ourcontract manufacturers, such as inferior quality, insufficient quantities and late delivery of products.
We depend on a limited source of suppliers for several key components. If we are unable to obtain thesecomponents on a timely basis, we will be unable to meet our customers’ product delivery requirements,which would harm our business.
We currently purchase several key components from a limited number of suppliers. If any of our limitedsource of suppliers become insolvent, cease business or experience capacity constraints, work stoppages or anyother reduction or disruption in output, they may be unable to meet our delivery schedules. Our suppliers mayenter into exclusive arrangements with our competitors, be acquired by our competitors, stop selling theirproducts or components to us at commercially reasonable prices, refuse to sell their products or components to usat any price or be unable to obtain or have difficulty obtaining components for their products from theirsuppliers. If we do not receive critical components from our limited source of suppliers in a timely manner, wewill be unable to meet our customers’ product delivery requirements. Any failure to meet a customer’s deliveryrequirements could materially adversely affect our business, operating results and financial condition and couldmaterially damage customer relationships.
Our target customer base is concentrated, and the loss of one or more of our customers could harm ourbusiness.
The target customers for our products are network service providers that operate voice, data and videocommunications networks. There are a limited number of potential customers in our target market. During 2010,Etisalat accounted for 24% of net revenue and we expect that a significant portion of our future revenue willdepend on sales of our products to a limited number of customers. As a result, our revenue for any quarter maybe subject to significant volatility based on changes in orders from one or a small number of key customers. Anyfailure of one or more customers to purchase products from us for any reason, including any downturn in theirbusinesses, would seriously harm our business, financial condition and results of operations.
Industry consolidation may lead to increased competition and may harm our operating results.
There has been a trend toward industry consolidation in the communications equipment market for severalyears. We expect this trend to continue as companies attempt to strengthen or hold their market positions in anevolving industry and as companies are acquired or are unable to continue operations. We believe that industryconsolidation may result in stronger competitors that are better able to compete as sole-source vendors forcustomers. This could have a material adverse effect on our business, financial condition and results ofoperations. Furthermore, rapid consolidation could result in a decrease in the number of customers we serve.Loss of a major customer could have a material adverse effect on our business, financial condition and results ofoperations.
We are exposed to the credit risk of some of our customers and to credit exposures in weakened markets,which could result in material losses.
Recent industry and economic conditions have weakened the financial position of some of our customersand their ability to access capital to finance their business operations, including capital expenditures. To sell tosome of these customers, we may be required to assume incremental risks of uncollectible accounts or to extendcredit or credit support. While we monitor these situations carefully and attempt to take appropriate measures toprotect ourselves, including factoring credit arrangements to financial institutions, it is possible that we may haveto defer revenue until cash is collected or write-down or write-off uncollectible accounts. Such write-downs orwrite-offs, if large, could have a material adverse effect on our results of operations and financial condition.
33

The market we serve is highly competitive and we may not be able to compete successfully.
Competition in the communications equipment market is intense. This market is characterized by rapidchange, converging technologies and a migration to networking solutions that offer superior advantages. We areaware of many companies in related markets that address particular aspects of the features and functions that ourproducts provide. Currently, our primary competitors include Alcatel-Lucent, Calix, Huawei, and ZTE, amongothers. We also may face competition from other large communications equipment companies or othercompanies that may enter our market in the future. In addition, a number of companies have introduced productsthat address the same network needs that our products address, both domestically and abroad. Many of ourcompetitors have longer operating histories, greater name recognition, larger customer bases and greaterfinancial, technical, sales and marketing resources than we do and may be able to undertake more extensivemarketing efforts, adopt more aggressive pricing policies and provide more customer financing than we can. Inparticular, we are encountering price-focused competitors from Asia, especially China, which places pressure onus to reduce our prices. If we are forced to reduce prices in order to secure customers, we may be unable tosustain gross margins at desired levels or achieve profitability. Competitive pressures could result in increasedpricing pressure, reduced profit margins, increased sales and marketing expenses and failure to increase, or theloss of, market share, any of which could reduce our revenue and adversely affect our financial results.Moreover, our competitors may foresee the course of market developments more accurately than we do andcould develop new technologies that render our products less valuable or obsolete.
In our markets, principal competitive factors include:
• product performance;
• interoperability with existing products;
• scalability and upgradeability;
• conformance to standards;
• breadth of services;
• reliability;
• ease of installation and use;
• geographic footprints for products;
• ability to provide customer financing;
• price;
• technical support and customer service; and
• brand recognition.
If we are unable to compete successfully against our current and future competitors, we may have difficultyobtaining or retaining customers, and we could experience price reductions, order cancellations, increasedexpenses and reduced gross margins, any of which could have a material adverse effect on our business, financialcondition and results of operations.
Our success largely depends on our ability to retain and recruit key personnel, and any failure to do sowould harm our ability to meet key objectives.
Our future success depends upon the continued services of our executive officers and our ability to identify,attract and retain highly skilled technical, managerial, sales and marketing personnel who have critical industryexperience and relationships that we rely on to build our business, including Morteza Ejabat, our co-founder,Chairman, President and Chief Executive Officer, and Kirk Misaka, our Chief Financial Officer. The loss of the
34

services of any of our key employees, including Messrs. Ejabat and Misaka, could delay the development andproduction of our products and negatively impact our ability to maintain customer relationships, which wouldharm our business, financial condition and results of operations.
Any strategic acquisitions or investments we make could disrupt our operations and harm our operatingresults.
As of December 31, 2010, we had acquired twelve companies or product lines since we were founded in1999. Further, we may acquire additional businesses, products or technologies in the future. On an ongoing basis,we may evaluate acquisitions of, or investments in, complementary companies, products or technologies tosupplement our internal growth. Also, in the future, we may encounter difficulties identifying and acquiringsuitable acquisition candidates on reasonable terms.
If we do complete future acquisitions, we could:
• issue stock that would dilute our current stockholders’ percentage ownership;
• consume a substantial portion of our cash resources;
• incur substantial debt;
• assume liabilities;
• increase our ongoing operating expenses and level of fixed costs;
• record goodwill and non-amortizable intangible assets that will be subject to impairment testing andpotential periodic impairment charges;
• incur amortization expenses related to certain intangible assets;
• incur large and immediate write-offs; and
• become subject to litigation.
Any acquisitions or investments that we make in the future will involve numerous risks, including:
• difficulties in integrating the operations, technologies, products and personnel of the acquiredcompanies;
• unanticipated costs;
• diversion of management’s time and attention away from normal daily operations of the business andthe challenges of managing larger and more widespread operations resulting from acquisitions;
• difficulties in entering markets in which we have no or limited prior experience;
• insufficient revenues to offset increased expenses associated with acquisitions and where competitors insuch markets have stronger market positions; and
• potential loss of key employees, customers, distributors, vendors and other business partners of thecompanies we acquire following and continuing after announcement of acquisition plans.
Mergers and acquisitions of high-technology companies are inherently risky and subject to many factorsoutside of our control, and we cannot be certain that our previous or future acquisitions will be successful andwill not materially adversely affect our business, operating results or financial condition. We do not knowwhether we will be able to successfully integrate the businesses, products, technologies or personnel that wemight acquire in the future or that any strategic investments we make will meet our financial or other investmentobjectives. Any failure to do so could seriously harm our business, financial condition and results of operations.
35

Sales to communications service providers are especially volatile, and weakness in sales orders from thisindustry may harm our operating results and financial condition.
Sales activity in the service provider industry depends upon the stage of completion of expanding networkinfrastructures, the availability of funding, and the extent to which service providers are affected by regulatory,economic and business conditions in the country of operations. Although some service providers may beincreasing capital expenditures over the depressed levels that have prevailed over the last few years, weakness inorders from this industry could have a material adverse effect on our business, operating results and financialcondition. Slowdowns in the general economy, overcapacity, changes in the service provider market, regulatorydevelopments and constraints on capital availability have had a material adverse effect on many of our serviceprovider customers, with many of these customers going out of business or substantially reducing their expansionplans. These conditions have materially harmed our business and operating results, and we expect that some orall of these conditions may continue for the foreseeable future. Finally, service provider customers typically havelonger implementation cycles; require a broader range of service including design services; demand that vendorstake on a larger share of risks; often require acceptance provisions, which can lead to a delay in revenuerecognition; and expect financing from vendors. All these factors can add further risk to business conducted withservice providers.
Decreased effectiveness of share-based compensation could adversely affect our ability to attract andretain employees.
We have historically used stock options as a key component of our employee compensation program inorder to align the interests of our employees with the interests of our stockholders, encourage employee retentionand provide competitive compensation and benefit packages. If the trading price of our common stock declines,this would reduce the value of our share-based compensation to our present employees and could affect ourability to retain them. In addition, in recent periods, some of our employee stock options have had exercise pricesin excess of our stock price, which reduces their value to employees and could affect our ability to retain present,or attract prospective employees. To address these issues, in the fourth quarter of 2008, we conducted anexchange offer, or the Exchange Offer, in which eligible employees, officers and directors of Zhone couldexchange outstanding options to purchase shares of Zhone common stock previously granted under our equityincentive compensation plans with an exercise price per share equal to or greater than $1.75 on a one-for-onebasis for the grant of new options to purchase shares of Zhone common stock. Options to acquire approximately2.9 million shares of Zhone common stock were tendered in the Exchange Offer for new options with an exerciseprice of $0.50 per share, as adjusted for the one-for-five reverse stock split effected on March 11, 2010.Difficulties relating to obtaining stockholder approval of equity compensation plans could also make it harder ormore expensive for us to grant share-based payments to employees in the future.
Due to the international nature of our business, political or economic changes or other factors in a specificcountry or region could harm our future revenue, costs and expenses and financial condition.
We currently have international operations consisting of sales and technical support teams in variouslocations around the world. We expect to continue expanding our international operations in the future. Thesuccessful management and expansion of our international operations requires significant human effort and thecommitment of substantial financial resources. Further, our international operations may be subject to certainrisks and challenges that could harm our operating results, including:
• trade protection measures and other regulatory requirements which may affect our ability to import orexport our products into or from various countries;
• political considerations that affect service provider and government spending patterns;
• differing technology standards or customer requirements;
• developing and customizing our products for foreign countries;
36

• fluctuations in currency exchange rates;
• longer accounts receivable collection cycles and financial instability of customers;
• difficulties and excessive costs for staffing and managing foreign operations;
• potentially adverse tax consequences; and
• changes in a country’s or region’s political and economic conditions.
Any of these factors could harm our existing international operations and business or impair our ability tocontinue expanding into international markets.
Compliance or the failure to comply with current and future environmental regulations could cause ussignificant expense.
We are subject to a variety of federal, state, local and foreign environmental regulations. If we fail tocomply with any present and future regulations, we could be subject to future liabilities, the suspension ofproduction or a prohibition on the sale of our products. In addition, such regulations could require us to incurother significant expenses to comply with environmental regulations, including expenses associated with theredesign of any non-compliant product. From time to time new regulations are enacted, and it is difficult toanticipate how such regulations will be implemented and enforced. For example, in 2003 the European Unionenacted the Restriction on the Use of Certain Hazardous Substances in Electrical and Electronic EquipmentDirective (RoHS) and the Waste Electrical and Electronic Equipment Directive (WEEE), for implementation inEuropean Union member states. We are aware of similar legislation that is currently in force or is beingconsidered in the United States, as well as other countries, such as Japan and China. Our failure to comply withany of such regulatory requirements or contractual obligations could result in our being liable for costs, fines,penalties and third-party claims, and could jeopardize our ability to conduct business in countries in thejurisdictions where these regulations apply.
Adverse resolution of litigation may harm our operating results or financial condition.
We are a party to various lawsuits and claims in the normal course of our business. Litigation can beexpensive, lengthy, and disruptive to normal business operations. Moreover, the results of complex legalproceedings are difficult to predict. An unfavorable resolution of a particular lawsuit could have a materialadverse effect on our business, operating results and financial condition. For additional information regardinglitigation in which we are involved, see Item 3, “Legal Proceedings,” contained in Part I of this report.
Our intellectual property rights may prove difficult to protect and enforce.
We generally rely on a combination of copyrights, patents, trademarks and trade secret laws and restrictionson disclosure to protect our intellectual property rights. We also enter into confidentiality or license agreementswith our employees, consultants and corporate partners, and control access to and distribution of our proprietaryinformation. Despite our efforts to protect our proprietary rights, unauthorized parties may attempt to copy orotherwise obtain and use our products or technology. Monitoring unauthorized use of our technology is difficult,and we do not know whether the steps we have taken will prevent unauthorized use of our technology,particularly in foreign countries where the laws may not protect our proprietary rights as extensively as in theUnited States. We cannot assure you that our pending, or any future, patent applications will be granted, that anyexisting or future patents will not be challenged, invalidated, or circumvented, or that any existing or futurepatents will be enforceable. While we are not dependent on any individual patents, if we are unable to protect ourproprietary rights, we may find ourselves at a competitive disadvantage to others who need not incur thesubstantial expense, time and effort required to create the innovative products.
37

We may be subject to intellectual property infringement claims that are costly and time consuming todefend and could limit our ability to use some technologies in the future.
Third parties have in the past and may in the future assert claims or initiate litigation related to patent,copyright, trademark and other intellectual property rights to technologies and related standards that are relevantto us. The asserted claims or initiated litigation can include claims against us or our manufacturers, suppliers orcustomers alleging infringement of their proprietary rights with respect to our existing or future products, orcomponents of those products. We have received correspondence from companies claiming that many of ourproducts are using technology covered by or related to the intellectual property rights of these companies andinviting us to discuss licensing arrangements for the use of the technology. Regardless of the merit of theseclaims, intellectual property litigation can be time consuming and costly, and result in the diversion of technicaland management personnel. Any such litigation could force us to stop selling, incorporating or using ourproducts that include the challenged intellectual property, or redesign those products that use the technology. Inaddition, if a party accuses us of infringing upon its proprietary rights, we may have to enter into royalty orlicensing agreements, which may not be available on terms acceptable to us, if at all. If we are unsuccessful inany such litigation, we could be subject to significant liability for damages and loss of our proprietary rights. Anyof these results could have a material adverse effect on our business, financial condition and results of operations.
We rely on the availability of third party licenses.
Many of our products are designed to include software or other intellectual property licensed from thirdparties. It may be necessary in the future to seek or renew licenses relating to various elements of the technologyused to develop these products. We cannot assure you that our existing and future third-party licenses will beavailable to us on commercially reasonable terms, if at all. Our inability to maintain or obtain any third-partylicense required to sell or develop our products and product enhancements could require us to obtain substitutetechnology of lower quality or performance standards, or at greater cost.
The long and variable sales cycles for our products may cause revenue and operating results to varysignificantly from quarter to quarter.
The target customers for our products have substantial and complex networks that they traditionally expandin large increments on a periodic basis. Accordingly, our marketing efforts are focused primarily on prospectivecustomers that may purchase our products as part of a large-scale network deployment. Our target customerstypically require a lengthy evaluation, testing and product qualification process. Throughout this process, we areoften required to spend considerable time and incur significant expense educating and providing information toprospective customers about the uses and features of our products. Even after a company makes the final decisionto purchase our products, it may deploy our products over extended periods of time. The timing of deployment ofour products varies widely, and depends on a number of factors, including our customers’ skill sets, geographicdensity of potential subscribers, the degree of configuration and integration required to deploy our products, andour customers’ ability to finance their purchase of our products as well as their operations. As a result of any ofthese factors, our revenue and operating results may vary significantly from quarter to quarter.
The communications industry is subject to government regulations, which could harm our business.
The FCC has jurisdiction over the entire communications industry in the United States and, as a result, ourexisting and future products and our customers’ products are subject to FCC rules and regulations. Changes tocurrent FCC rules and regulations and future FCC rules and regulations could negatively affect our business. Theuncertainty associated with future FCC decisions may cause network service providers to delay decisionsregarding their capital expenditures for equipment for broadband services. In addition, international regulatorybodies establish standards that may govern our products in foreign markets. Changes to or future domestic andinternational regulatory requirements could result in postponements or cancellations of customer orders for ourproducts and services, which would harm our business, financial condition and results of operations. Further, we
38

cannot be certain that we will be successful in obtaining or maintaining regulatory approvals that may, in thefuture, be required to operate our business.
The ability of unaffiliated stockholders to influence key transactions, including changes of control, may belimited by significant insider ownership, provisions of our charter documents and provisions of Delawarelaw.
At December 31, 2010, our executive officers, directors and entities affiliated with them beneficially owned,in the aggregate, approximately 26% of our outstanding common stock. These stockholders, if acting together,will be able to influence substantially all matters requiring approval by our stockholders, including the election ofdirectors and the approval of mergers or other business combination transactions. Circumstances may arise inwhich the interests of these stockholders could conflict with the interests of our other stockholders. Thesestockholders could delay or prevent a change in control of our company even if such a transaction would bebeneficial to our other stockholders. In addition, provisions of our certificate of incorporation, bylaws andDelaware law could make it more difficult for a third party to acquire us, even if doing so would be beneficial tocertain stockholders.
Our business and operations are especially subject to the risks of earthquakes and other naturalcatastrophic events.
Our corporate headquarters, including a significant portion of our research and development operations, arelocated in Northern California, a region known for seismic activity. Additionally, some of our facilities,including our manufacturing facilities, are located near geographic areas that have experienced hurricanes in thepast. A significant natural disaster, such as an earthquake, hurricane, fire, flood or other catastrophic event, couldseverely affect our ability to conduct normal business operations, and as a result, our future operating resultscould be materially and adversely affected.
39

MARKET PRICE, DIVIDENDS AND RELATED STOCKHOLDERMATTERS
Price Range of Common Stock
Our common stock was listed on the Nasdaq Global Market under the symbol “ZHNE” until September 28,2009, when our common stock was transferred to the Nasdaq Capital Market, where it is also listed under thesymbol “ZHNE”. The following table sets forth, for the periods indicated, the high and low per share sales pricesof our common stock as reported on Nasdaq.
2010:High Low
Fourth Quarter ended December 31, 2010 . . . . . . . . . . . . . . . . . . . . . . . . . . $3.24 $1.87Third Quarter ended September 30, 2010 . . . . . . . . . . . . . . . . . . . . . . . . . . . 2.10 1.13Second Quarter ended June 30, 2010 . . . . . . . . . . . . . . . . . . . . . . . . . . . . . . 2.99 1.38First Quarter ended March 31, 2010 . . . . . . . . . . . . . . . . . . . . . . . . . . . . . . . 3.35 2.00
2009:High Low
Fourth Quarter ended December 31, 2009 . . . . . . . . . . . . . . . . . . . . . . . . . . $3.80 $1.65Third Quarter ended September 30, 2009 . . . . . . . . . . . . . . . . . . . . . . . . . . . 4.65 1.30Second Quarter ended June 30, 2009 . . . . . . . . . . . . . . . . . . . . . . . . . . . . . . 1.90 0.90First Quarter ended March 31, 2009 . . . . . . . . . . . . . . . . . . . . . . . . . . . . . . . 1.10 0.40
All per share prices reflect the one-for-five reverse stock split effected on March 11, 2010.
As of December 31, 2010, there were 1,352 registered stockholders of record. A substantially greaternumber of holders of Zhone common stock are “street name” or beneficial holders, whose shares are held ofrecord by banks, brokers and other financial institutions.
Dividend Policy
We have never paid or declared any cash dividends on our common stock or other securities and do notanticipate paying cash dividends in the foreseeable future. Any future determination to pay cash dividends willbe at the discretion of the Board of Directors, subject to any applicable restrictions under our debt and creditagreements, and will be dependent upon our financial condition, results of operations, capital requirements,general business condition and such other factors as the Board of Directors may deem relevant.
Recent Sales of Unregistered Securities
There were no unregistered sales of equity securities during 2010.
40

STOCK PERFORMANCE GRAPH
The graph depicted below compares the cumulative total stockholder return on Zhone common stock duringthe period from Zhone’s initial stock listing date through December 31, 2010, with the cumulative total return onthe S&P 500 Index and the Nasdaq Telecommunications Index. The comparison assumes $100 was invested onDecember 31, 2006 in each of Zhone common stock, the S&P 500 Index and the Nasdaq TelecommunicationsIndex, and assumes that all dividends, if any, were reinvested. Stockholder returns over the indicated period arebased on historical data and should not be considered indicative of future stockholder returns.
Comparison of Cumulative Total ReturnAmong Zhone Technologies, Inc.,
the S&P 500 Index andthe Nasdaq Telecommunications Index
$0
$50
$100
$150
Zhone $100 $89 $6 $31 $41
S&P 500 100 104 64 79 89
Nasdaq-Telecom 100 109 62 92 96
31-Dec-06 31-Dec-07 31-Dec-08 31-Dec-09 31-Dec-10
41

QUANTITATIVE AND QUALITATIVE DISCLOSURES ABOUTMARKET RISK
Cash, Cash Equivalents and Short-Term Investments
We consider all cash and highly liquid investments purchased with an original maturity of less than threemonths to be cash equivalents.
Cash, cash equivalents and short-term investments consisted of the following as of December 31, 2010 and2009 (in thousands):
December 31,2010
December 31,2009
Cash and cash equivalents . . . . . . . . . . . . . . . . . . . . . . . . . . . . . . . . . . . . . $21,174 $21,460Short-term investment . . . . . . . . . . . . . . . . . . . . . . . . . . . . . . . . . . . . . . . . — 306
$21,174 $21,766
Concentration of Credit Risk
Financial instruments which potentially subject us to concentrations of credit risk consist primarily of cashand cash equivalents, and accounts receivable. Cash and cash equivalents consist principally of demand depositand money market accounts. Cash and cash equivalents are principally held with various domestic financialinstitutions with high credit standing. We perform ongoing credit evaluations of our customers and generally donot require collateral. Allowances are maintained for potential doubtful accounts. During the year endedDecember 31, 2010, Etisalat accounted for 24% of net revenue. The same customer accounted for 19% netrevenue for the year ended December 31, 2009.
As of December 31, 2010, Etisalat receivables, which are denominated in United Arab Emirates Dirhams, acurrency that tracks to the U.S. dollar, accounted for 30% of net accounts receivable. As of December 31, 2009,the same customer accounted for 66% of net accounts receivable.
As of December 31, 2010 and December 31, 2009, receivables from customers in countries other than theUnited States represented 74% and 82%, respectively, of net accounts receivable.
Interest Rate Risk
Our exposure to market risk for changes in interest rates relates primarily to our outstanding debt. As ofDecember 31, 2010, our outstanding debt balance was $10.0 million, comprising borrowings under the SVBFacility. As of December 31, 2010, interest on borrowings under the SVB Facility accrued on the unpaidprincipal balance at a variable interest rate (which adjusted every six months) equal to the sum of the LIBOR rateplus 2.5% per annum; provided that in no event will the variable interest rate (a) exceed 14.2488% per annum,(b) be less than 6.5% per annum, or (c) be adjusted by more than 1.0% at any adjustment date. Assuming theoutstanding balance on our variable rate debt remained constant over a year, a 2% increase in the interest ratewould decrease pre-tax income and cash flow by approximately $0.2 million. On March 14, 2011, we renewedthe SVB Facility to provide liquidity and working capital through March 13, 2012 and amended the interest rateapplicable to amounts borrowed under the SVB Facility, as discussed in Note 16 to the consolidated financialstatements.
Foreign Currency Risk
We transact business in various foreign countries. Substantially all of our assets are located in the UnitedStates. We have sales operations throughout Europe, Asia, the Middle East and Latin America. We are exposed
42

to foreign currency exchange rate risk associated with foreign currency denominated assets and liabilities,primarily intercompany receivables and payables. Accordingly, our operating results are exposed to changes inexchange rates between the U.S. dollar and those currencies. During 2010 and 2009, we did not hedge any of ourforeign currency exposure. During both 2010 and 2009, we recorded $0.1 million of foreign exchange loss inother income (expense) on our statements of operations.
We have performed sensitivity analyses as of December 31, 2010 and 2009, using a modeling technique thatmeasures the impact arising from a hypothetical 10% adverse movement in the levels of foreign currencyexchange rates relative to the U.S. dollar, with all other variables held constant. The sensitivity analyses indicatedthat a hypothetical 10% adverse movement in foreign currency exchange rates would result in a foreign exchangeloss of $0.2 million and $0.1 million for 2010 and 2009, respectively. This sensitivity analysis assumes a paralleladverse shift in foreign currency exchange rates, which do not always move in the same direction. Actual resultsmay differ materially.
43

ZHONE TECHNOLOGIES, INC. AND SUBSIDIARIES
Consolidated Balance SheetsDecember 31, 2010 and 2009
(In thousands, except par value)
2010 2009
AssetsCurrent assets:
Cash and cash equivalents . . . . . . . . . . . . . . . . . . . . . . . . . . . . . . . . . . . . . . . . . . $ 21,174 $ 21,460Short-term investments . . . . . . . . . . . . . . . . . . . . . . . . . . . . . . . . . . . . . . . . . . . . . — 306Accounts receivable, net of allowances for sales returns and doubtful accountsof $2,433 in 2010 and $5,042 in 2009 . . . . . . . . . . . . . . . . . . . . . . . . . . . . . . . 29,747 37,107
Inventories . . . . . . . . . . . . . . . . . . . . . . . . . . . . . . . . . . . . . . . . . . . . . . . . . . . . . . 31,048 30,228Prepaid expenses and other current assets . . . . . . . . . . . . . . . . . . . . . . . . . . . . . . 2,514 2,098
Total current assets . . . . . . . . . . . . . . . . . . . . . . . . . . . . . . . . . . . . . . . . . . . . 84,483 91,199Property and equipment, net . . . . . . . . . . . . . . . . . . . . . . . . . . . . . . . . . . . . . . . . . . . . . 5,274 18,961Restricted cash . . . . . . . . . . . . . . . . . . . . . . . . . . . . . . . . . . . . . . . . . . . . . . . . . . . . . . . 58 58Other assets . . . . . . . . . . . . . . . . . . . . . . . . . . . . . . . . . . . . . . . . . . . . . . . . . . . . . . . . . . 296 41
Total assets . . . . . . . . . . . . . . . . . . . . . . . . . . . . . . . . . . . . . . . . . . . . . . . . . . $ 90,111 $ 110,259
Liabilities and Stockholders’ EquityCurrent liabilities:
Accounts payable . . . . . . . . . . . . . . . . . . . . . . . . . . . . . . . . . . . . . . . . . . . . . . . . . $ 11,864 $ 14,914Line of credit . . . . . . . . . . . . . . . . . . . . . . . . . . . . . . . . . . . . . . . . . . . . . . . . . . . . 10,000 10,000Current portion of long-term debt . . . . . . . . . . . . . . . . . . . . . . . . . . . . . . . . . . . . — 411Accrued and other liabilities . . . . . . . . . . . . . . . . . . . . . . . . . . . . . . . . . . . . . . . . . 13,217 12,031
Total current liabilities . . . . . . . . . . . . . . . . . . . . . . . . . . . . . . . . . . . . . . . . . 35,081 37,356Long-term debt, less current portion . . . . . . . . . . . . . . . . . . . . . . . . . . . . . . . . . . . . . . — 18,285Other long-term liabilities . . . . . . . . . . . . . . . . . . . . . . . . . . . . . . . . . . . . . . . . . . . . . . 5,615 2,945
Total liabilities . . . . . . . . . . . . . . . . . . . . . . . . . . . . . . . . . . . . . . . . . . . . . . . 40,696 58,586
Stockholders’ equity:Common stock, $0.001 par value. Authorized 180,000 shares; issued andoutstanding 30,555 and 30,272 shares as of December 31, 2010 and 2009,respectively . . . . . . . . . . . . . . . . . . . . . . . . . . . . . . . . . . . . . . . . . . . . . . . . . . . . 30 30
Additional paid-in capital . . . . . . . . . . . . . . . . . . . . . . . . . . . . . . . . . . . . . . . . . . . 1,069,513 1,066,974Other comprehensive income . . . . . . . . . . . . . . . . . . . . . . . . . . . . . . . . . . . . . . . . 277 293Accumulated deficit . . . . . . . . . . . . . . . . . . . . . . . . . . . . . . . . . . . . . . . . . . . . . . . (1,020,405) (1,015,624)
Total stockholders’ equity . . . . . . . . . . . . . . . . . . . . . . . . . . . . . . . . . . . . . . 49,415 51,673
Total liabilities and stockholders’ equity . . . . . . . . . . . . . . . . . . . . . . . . . . . $ 90,111 $ 110,259
See accompanying notes to consolidated financial statements.
44

ZHONE TECHNOLOGIES, INC. AND SUBSIDIARIES
Consolidated Statements of OperationsYears ended December 31, 2010, 2009 and 2008
(In thousands, except per share data)
2010 2009 2008
Net revenue . . . . . . . . . . . . . . . . . . . . . . . . . . . . . . . . . . . . . . . . . . . . . . . . . . . . $129,036 $126,501 $146,160Cost of revenue (1) . . . . . . . . . . . . . . . . . . . . . . . . . . . . . . . . . . . . . . . . . . . . . . . 79,864 81,106 101,096
Gross profit . . . . . . . . . . . . . . . . . . . . . . . . . . . . . . . . . . . . . . . . . . . . . . . . . . . . . 49,172 45,395 45,064
Operating expenses:Research and product development (1) . . . . . . . . . . . . . . . . . . . . . . . . . . . 21,188 22,113 27,063Sales and marketing (1) . . . . . . . . . . . . . . . . . . . . . . . . . . . . . . . . . . . . . . . 23,982 22,042 28,269General and administrative (1) . . . . . . . . . . . . . . . . . . . . . . . . . . . . . . . . . . 9,855 9,933 15,609Gain on sale of fixed assets . . . . . . . . . . . . . . . . . . . . . . . . . . . . . . . . . . . . (1,959) — (455)Gain on sale of intangible assets . . . . . . . . . . . . . . . . . . . . . . . . . . . . . . . . — — (4,397)Impairment of goodwill . . . . . . . . . . . . . . . . . . . . . . . . . . . . . . . . . . . . . . . — — 70,401
Total operating expenses . . . . . . . . . . . . . . . . . . . . . . . . . . . . . . . . . . 53,066 54,088 136,490
Operating loss . . . . . . . . . . . . . . . . . . . . . . . . . . . . . . . . . . . . . . . . . . . (3,894) (8,693) (91,426)Interest expense . . . . . . . . . . . . . . . . . . . . . . . . . . . . . . . . . . . . . . . . . . . . . . . . . (996) (1,331) (1,625)Interest income . . . . . . . . . . . . . . . . . . . . . . . . . . . . . . . . . . . . . . . . . . . . . . . . . . 7 47 708Other income . . . . . . . . . . . . . . . . . . . . . . . . . . . . . . . . . . . . . . . . . . . . . . . . . . . 1 121 78
Loss before income taxes . . . . . . . . . . . . . . . . . . . . . . . . . . . . . . . . . . (4,882) (9,856) (92,265)Income tax (benefit)/provision . . . . . . . . . . . . . . . . . . . . . . . . . . . . . . . . . . . . . . (101) 171 270
Net loss . . . . . . . . . . . . . . . . . . . . . . . . . . . . . . . . . . . . . . . . . . . . . . . . $ (4,781) $ (10,027) $ (92,535)
Basic and diluted net loss per share . . . . . . . . . . . . . . . . . . . . . . . . . . . . . . . . . . $ (0.16) $ (0.33) $ (3.08)Weighted average shares outstanding used to compute basic and diluted netloss per share . . . . . . . . . . . . . . . . . . . . . . . . . . . . . . . . . . . . . . . . . . . . . . . . . 30,393 30,200 30,068
(1) Amounts include stock-based compensation cost as follows:Cost of revenue . . . . . . . . . . . . . . . . . . . . . . . . . . . . . . . . . . . . . . . . . . . . . . 94 104 158Research and product development . . . . . . . . . . . . . . . . . . . . . . . . . . . . . . 362 414 479Sales and marketing . . . . . . . . . . . . . . . . . . . . . . . . . . . . . . . . . . . . . . . . . . 421 484 511General and administrative . . . . . . . . . . . . . . . . . . . . . . . . . . . . . . . . . . . . 1,388 1,258 1,203
See accompanying notes to consolidated financial statements.
45

ZHONETECHNOLOGIE
S,IN
C.A
NDSU
BSIDIA
RIE
S
Con
solid
ated
Statem
entsof
Stockh
olders’Equ
ityan
dCom
prehensive
Income
Years
endedDecem
ber31,2010,2009
and2008
(Inthou
sand
s)
Com
mon
stock
Add
itiona
lpa
id-in
capital
Other
comprehensive
income
Accum
ulated
deficit
Total
stockh
olders’
equity
Shares
Amou
nt
Balancesas
ofDecem
ber31,2007
......................................................
30,005
$30
$1,061,969
$610
$(913,062)
$149,547
Exerciseof
stockoptio
nsforcash
.......................................................
6—
6—
—6
Issuance
ofcommon
stockin
connectio
nwith
employ
eestockpurchase
plan
.....................
111
—288
——
288
Issuance
ofcommon
stockfordirector
services
............................................
15—
81—
—81
Stock-basedcompensation.............................................................
——
2,270
——
2,270
Com
prehensive
loss:
Netloss
................................
........................................
——
——
(92,535)
(92,535)
Foreigncurrency
translationadjustment..............................................
——
—(355)
—(355)
Unrealized
loss
onavailableforsalesecurities.........................................
——
—(5)
—(5)
Totalcomprehensive
loss
..............................................................
(92,895)
Balancesas
ofDecem
ber31,2008
......................................................
30,137
301,064,614
250
(1,005,597)
59,297
Exerciseof
stockoptio
nsforcash
.......................................................
20—
13—
—13
Issuance
ofcommon
stockin
connectio
nwith
employ
eestockpurchase
plan
.....................
83—
87—
—87
Issuance
ofcommon
stockforservices
...................................................
32—
66—
—66
Stock-basedcompensation.............................................................
——
2,194
——
2,194
Com
prehensive
loss:
Netloss
................................
........................................
——
——
(10,027)
(10,027)
Foreigncurrency
translationadjustment..............................................
——
—48
—48
Unrealized
loss
onavailableforsalesecurities.........................................
——
—(5)
—(5)
Totalcomprehensive
loss
..............................................................
(9,984)
Seeaccompanyingnotesto
consolidated
financialstatements.
46

Com
mon
stock
Add
itiona
lpa
id-in
capital
Other
comprehensive
income
Accum
ulated
deficit
Total
stockh
olders’
equity
Shares
Amou
nt
Balancesas
ofDecem
ber31,2009
......................................................
30,272
301,066,974
293
(1,015,624)
51,673
Exerciseof
stockoptio
nsforcash
.......................................................
104
—75
——
75Issuance
ofcommon
stockin
connectio
nwith
employ
eestockpurchase
plan
.....................
151
—199
——
199
Issuance
ofcommon
stockfordirector
services
............................................
28—
69—
—69
Stock-basedcompensation.............................................................
——
2,196
——
2,196
Com
prehensive
loss:
Netloss
................................
........................................
——
——
(4,781)
(4,781)
Foreigncurrency
translationadjustment..............................................
——
—(16)
—(16)
Unrealized
loss
onavailableforsalesecurities.........................................
——
——
——
Totalcomprehensive
loss
..............................................................
(4,797)
Balancesas
ofDecem
ber31,2010
......................................................
30,555
$30
$1,069,513
$277
$(1,020,405)
$49,415
Seeaccompanyingnotesto
consolidated
financialstatements.
47

ZHONE TECHNOLOGIES, INC. AND SUBSIDIARIES
Consolidated Statements of Cash FlowsYears ended December 31, 2010, 2009 and 2008
(In thousands)
2010 2009 2008
Cash flows from operating activities:Net loss . . . . . . . . . . . . . . . . . . . . . . . . . . . . . . . . . . . . . . . . . . . . . . . . . . . . . . . . . . . . . . . $ (4,781) $(10,027) $(92,535)Adjustments to reconcile net loss to net cash used in operating activities:
Depreciation and amortization . . . . . . . . . . . . . . . . . . . . . . . . . . . . . . . . . . . . . . . . . 1,585 1,834 2,204Stock-based compensation . . . . . . . . . . . . . . . . . . . . . . . . . . . . . . . . . . . . . . . . . . . . 2,265 2,260 2,351Impairment of goodwill . . . . . . . . . . . . . . . . . . . . . . . . . . . . . . . . . . . . . . . . . . . . . . — — 70,401Gain on sale of intangible assets . . . . . . . . . . . . . . . . . . . . . . . . . . . . . . . . . . . . . . . . — — (4,397)Gain on sale of fixed assets . . . . . . . . . . . . . . . . . . . . . . . . . . . . . . . . . . . . . . . . . . . (1,959) — (455)Loss on disposal of fixed assets . . . . . . . . . . . . . . . . . . . . . . . . . . . . . . . . . . . . . . . . — 2 —(Accretion) or impairment of investments . . . . . . . . . . . . . . . . . . . . . . . . . . . . . . . . — 44 (169)Provision for sales returns and doubtful accounts . . . . . . . . . . . . . . . . . . . . . . . . . . 761 1,780 3,143Changes in operating assets and liabilities:
Accounts receivable . . . . . . . . . . . . . . . . . . . . . . . . . . . . . . . . . . . . . . . . . . . . . 6,599 (15,222) 6,450Inventories . . . . . . . . . . . . . . . . . . . . . . . . . . . . . . . . . . . . . . . . . . . . . . . . . . . . (820) 10,478 3,992Prepaid expenses and other current assets . . . . . . . . . . . . . . . . . . . . . . . . . . . . (333) 556 1,150Other assets . . . . . . . . . . . . . . . . . . . . . . . . . . . . . . . . . . . . . . . . . . . . . . . . . . . . (155) 14 21Accounts payable . . . . . . . . . . . . . . . . . . . . . . . . . . . . . . . . . . . . . . . . . . . . . . . (3,050) 2,195 (8,557)Accrued and other liabilities . . . . . . . . . . . . . . . . . . . . . . . . . . . . . . . . . . . . . . . 1,944 (2,379) (823)
Net cash provided by (used in) operating activities . . . . . . . . . . . . . . . . . 2,056 (8,465) (17,224)
Cash flows from investing activities:Proceeds from sale of intangible assets . . . . . . . . . . . . . . . . . . . . . . . . . . . . . . . . . . . . . . — — 4,397Proceeds from sale of assets . . . . . . . . . . . . . . . . . . . . . . . . . . . . . . . . . . . . . . . . . . . . . . . 573 — 502Purchases of property and equipment . . . . . . . . . . . . . . . . . . . . . . . . . . . . . . . . . . . . . . . . (3,169) (794) (1,436)Purchases of short-term investments . . . . . . . . . . . . . . . . . . . . . . . . . . . . . . . . . . . . . . . . — (308) (10,879)Proceeds from maturity of short-term investments . . . . . . . . . . . . . . . . . . . . . . . . . . . . . 306 2,945 20,412Changes in restricted cash . . . . . . . . . . . . . . . . . . . . . . . . . . . . . . . . . . . . . . . . . . . . . . . . — 65 63
Net cash (used in) provided by investing activities . . . . . . . . . . . . . . . . . (2,290) 1,908 13,059
Cash flows from financing activities:Proceeds from issuance of common stock and warrants . . . . . . . . . . . . . . . . . . . . . . . . . 274 100 294Repayment under credit facilities . . . . . . . . . . . . . . . . . . . . . . . . . . . . . . . . . . . . . . . . . . . — (5,000) —Repayment of debt . . . . . . . . . . . . . . . . . . . . . . . . . . . . . . . . . . . . . . . . . . . . . . . . . . . . . . (310) (382) (327)
Net cash used in financing activities . . . . . . . . . . . . . . . . . . . . . . . . . . . . (36) (5,282) (33)
Effect of exchange rate changes on cash . . . . . . . . . . . . . . . . . . . . . . . . . . . . . . . . . . . . . . . . . (16) 48 (355)
Net decrease in cash and cash equivalents . . . . . . . . . . . . . . . . . . . . . . . . (286) (11,791) (4,553)Cash and cash equivalents at beginning of year . . . . . . . . . . . . . . . . . . . . . . . . . . . . . . . . . . . . 21,460 33,251 37,804
Cash and cash equivalents at end of year . . . . . . . . . . . . . . . . . . . . . . . . . . . . . . . . . . . . . . . . . $21,174 $ 21,460 $ 33,251
Supplemental disclosures of cash flow information:Cash paid during period for:
Taxes . . . . . . . . . . . . . . . . . . . . . . . . . . . . . . . . . . . . . . . . . . . . . . . . . . . . . . . . . . . . . $ 75 $ 171 $ 371Interest . . . . . . . . . . . . . . . . . . . . . . . . . . . . . . . . . . . . . . . . . . . . . . . . . . . . . . . . . . . 1,101 1,339 1,639
Non-cash investing and financing activities:Sale of Oakland, California campus and extinguishment of related debt (Refer toNote 5)
See accompanying notes to consolidated financial statements.
48

ZHONE TECHNOLOGIES, INC. AND SUBSIDIARIES
Notes to Consolidated Financial Statements
(1) Organization and Summary of Significant Accounting Policies
(a) Description of Business
Zhone Technologies, Inc. (sometimes referred to, collectively with its subsidiaries, as “Zhone” or the“Company”) designs, develops and manufactures communications network equipment fortelecommunications, wireless and cable operators worldwide. The Company’s products allow networkservice providers to deliver video and interactive entertainment services in addition to their existing voiceand data service offerings. The Company was incorporated under the laws of the state of Delaware in June1999. The Company began operations in September 1999 and is headquartered in Oakland, California.
(b) Basis of Presentation
The consolidated financial statements include the accounts of the Company and its wholly ownedsubsidiaries. All significant inter-company transactions and balances have been eliminated in consolidation.
(c) Reverse Stock Split
On March 11, 2010, the Company effected a one-for-five reverse stock split. All share and per shareinformation included in the Company’s consolidated financial statements and accompanying notespresented herein reflect the retroactive effect of the one-for-five reverse stock split, as discussed in Note 8.
(d) Risks and Uncertainties
The accompanying consolidated financial statements have been prepared assuming that the Companywill continue as a going concern. The Company’s continued losses reduced cash, cash equivalents and short-term investments in 2009 and 2010. As of December 31, 2010, the Company had approximately $21.2million in cash and cash equivalents and $10.0 million of current debt outstanding under its revolving line ofcredit and letter of credit facility (the “SVB Facility”). The Company renewed and amended the SVBFacility on March 14, 2011 to provide liquidity and working capital through March 13, 2012, as discussed inNote 16. Continued uncertainty regarding financial institutions’ ability and inclination to lend maynegatively impact the Company’s ability to refinance its existing indebtedness on favorable terms, or at all.
The global unfavorable economic and market conditions could impact the Company’s business in anumber of ways, including:
• Potential deferment of purchases and orders by customers;
• Customers’ inability to obtain financing to make purchases from the Company and/or maintain theirbusiness;
• Negative impact from increased financial pressures on third-party dealers, distributors and retailers;and
• Negative impact from increased financial pressures on key suppliers.
If the economic, market and geopolitical conditions in the United States and the rest of the world do notcontinue to improve or if they deteriorate, the Company may experience material adverse impacts on itsbusiness, operating results and financial condition.
During 2009, the Company implemented several activities intended to reduce costs, improve operatingefficiencies and change its operations to more closely align them with its key strategic focus, whichincluded headcount reductions. During 2010, the Company continued to focus on cost control and operating
49

efficiency along with restrictions on discretionary spending. The most significant cost-cutting measureduring this period was the sale in September 2010 of the Company’s land and buildings located in Oakland,California and extinguishment of related debt in a sale and leaseback transaction with LBA Realty, LLC(“LBA Realty”). The sale and leaseback transaction will allow the Company to reduce occupancy costsgoing forward and improved the current financial position by eliminating the related debt which was due inApril 2011.
The Company expects that operating losses and negative cash flows from operations may continue. Inorder to meet the Company’s liquidity needs and finance its capital expenditures and working capital needsfor the business, the Company may be required to sell assets, issue debt or equity securities or borrow onunfavorable terms. Continued uncertainty regarding financial institutions’ ability and inclination to lendmay negatively impact the Company’s ability to access debt financing or to refinance existing indebtednessin the future on favorable terms, or at all. The Company may be unable to sell assets, issue securities oraccess additional indebtedness to meet these needs on favorable terms, or at all. As a result, the Companymay become unable to pay its ordinary expenses, including its debt service, on a timely basis. TheCompany’s current lack of liquidity could harm it by:
• increasing its vulnerability to adverse economic conditions in its industry or the economy in general;
• requiring substantial amounts of cash to be used for debt servicing, rather than other purposes,including operations;
• limiting its ability to plan for, or react to, changes in its business and industry; and
• influencing investor and customer perceptions about its financial stability and limiting its ability toobtain financing or acquire customers.
If additional capital is raised through the issuance of debt securities or other debt financing, the termsof such debt may include covenants, restrictions and financial ratios that may restrict the Company’s abilityto operate its business. Likewise, any equity financing could result in additional dilution of the Company’sstockholders. If the Company is unable to obtain additional capital or is required to obtain additional capitalon terms that are not favorable, it may be required to reduce the scope of its planned product developmentand sales and marketing efforts beyond the reductions it has previously taken. Based on the Company’scurrent plans and business conditions, it believes that its existing cash, cash equivalents and available creditfacilities will be sufficient to satisfy its anticipated cash requirements for the foreseeable future.
(e) Use of Estimates
The preparation of the consolidated financial statements in conformity with generally acceptedaccounting principles in the United States of America requires management to make estimates andassumptions that affect the reported amounts of assets and liabilities and disclosure of contingent assets andliabilities at the date of the consolidated financial statements and the reported amounts of revenue andexpenses during the reporting period. Actual results could differ materially from those estimates.
(f) Revenue Recognition
The Company recognizes revenue when the earnings process is complete. The Company recognizesproduct revenue upon shipment of product under contractual terms which transfer title to customers uponshipment, under normal credit terms, net of estimated sales returns and allowances at the time of shipment.Revenue is deferred if there are significant post-delivery obligations or if the fees are not fixed ordeterminable. When significant post-delivery obligations exist, revenue is deferred until such obligations arefulfilled. The Company’s arrangements generally do not have any significant post-delivery obligations. Ifthe Company’s arrangements include customer acceptance provisions, revenue is recognized upon obtainingthe signed acceptance certificate from the customer, unless the Company can objectively demonstrate thatthe delivered products or services meet all the acceptance criteria specified in the arrangement prior to
50

obtaining the signed acceptance. In those instances where revenue is recognized prior to obtaining thesigned acceptance certificate, the Company uses successful completion of customer testing as the basis toobjectively demonstrate that the delivered products or services meet all the acceptance criteria specified inthe arrangement. The Company also considers historical acceptance experience with the customer, as wellas the payment terms specified in the arrangement, when revenue is recognized prior to obtaining the signedacceptance certificate. The Company offers products and services such as support, education and training,hardware upgrades and post-warranty support. For multiple element revenue arrangements, the Companyestablishes the fair value of these products and services based primarily on sales prices when the productsand services are sold separately. If fair value cannot be established for undelivered elements, all of therevenue under the arrangement is deferred until those elements have been delivered. When collectibility isnot reasonably assured, revenue is recognized when cash is collected. Revenue from education services andsupport services is recognized over the contract term or as the service is performed. The Company makescertain sales to product distributors. These customers are given certain privileges to return a portion ofinventory. Return privileges generally allow distributors to return inventory based on a percent of purchasesmade within a specific period of time. The Company recognizes revenue on sales to distributors that havecontractual return rights when the products have been sold by the distributors, unless there is sufficientcustomer specific sales and sales returns history to support revenue recognition upon shipment. In thoseinstances when revenue is recognized upon shipment to distributors, the Company uses historical rates ofreturn from the distributors to provide for estimated product returns. The Company accrues for warrantycosts, sales returns and other allowances at the time of shipment based on historical experience and expectedfuture costs.
(g) Allowances for Sales Returns and Doubtful Accounts
The Company records an allowance for sales returns for estimated future product returns related tocurrent period product revenue. The allowance for sales returns is recorded as a reduction of revenue and anallowance against accounts receivable. The Company bases its allowance for sales returns on periodicassessments of historical trends in product return rates and current approved returned products. If the actualfuture returns were to deviate from the historical data on which the reserve had been established, theCompany’s future revenue could be adversely affected.
The Company records an allowance for doubtful accounts for estimated losses resulting from theinability of customers to make payments for amounts owed to the Company. The allowance for doubtfulaccounts is recorded as a charge to general and administrative expenses. The Company bases its allowanceon periodic assessments of its customers’ liquidity and financial condition through analysis of informationobtained from credit rating agencies, financial statement review and historical collection trends. Additionalallowances may be required in the future if the liquidity or financial conditions of its customers deteriorate,resulting in impairment in their ability to make payments.
Activity under the Company’s allowance for sales returns and doubtful accounts was comprised asfollows (in thousands):
Year ended December 31,
2010 2009 2008
Balance at beginning of year . . . . . . . . . . . . . . . . . . . . . . . . . . . . . . . . $ 5,042 $ 5,155 $ 5,941Charged to revenue . . . . . . . . . . . . . . . . . . . . . . . . . . . . . . . . . . . . . . . . 616 1,800 2,356Charged to (reversal of) expense . . . . . . . . . . . . . . . . . . . . . . . . . . . . . 144 (20) 787Utilization . . . . . . . . . . . . . . . . . . . . . . . . . . . . . . . . . . . . . . . . . . . . . . . (3,369) (1,893) (3,929)
Balance at end of year . . . . . . . . . . . . . . . . . . . . . . . . . . . . . . . . . . . . . $ 2,433 $ 5,042 $ 5,155
The allowance for doubtful accounts was $1.7 million and $3.8 million as of December 31, 2010 and2009, respectively.
51

(h) Inventories
Inventories are stated at the lower of cost or market, with cost being determined using the first-in,first-out (FIFO) method. In assessing the net realizable value of inventories, the Company is required tomake judgments as to future demand requirements and compare these with the current or committedinventory levels. Once inventory has been written down to its estimated net realizable value, its carryingvalue cannot be increased due to subsequent changes in demand forecasts. To the extent that a severedecline in forecasted demand occurs, or the Company experiences a higher incidence of inventoryobsolescence due to rapidly changing technology and customer requirements, the Company may incursignificant charges for excess inventory.
(i) Operating Lease Liabilities
As a result of the acquisition of Paradyne Networks, Inc. (“Paradyne”) in September 2005, theCompany assumed certain lease liabilities for facilities in Largo, Florida. The Company has accrued aliability for the excess portion of these facilities. The computation of the estimated liability includes anumber of assumptions and subjective variables. These variables include the level and timing of futuresublease income, amount of contractual variable costs, future market rental rates, discount rate, and otherestimated expenses. If circumstances change, and the Company employs different assumptions in futureperiods, the future lease liability may differ significantly from what the Company has recorded in thecurrent period and could materially affect its net loss and net loss per share.
(j) Foreign Currency Translation
For operations outside the United States, the Company translates assets and liabilities of foreignsubsidiaries, whose functional currency is the local currency, at end of period exchange rates. Revenues andexpenses are translated at monthly average rates of exchange prevailing during the year. The adjustmentresulting from translating the financial statements of such foreign subsidiaries, is included in accumulatedother comprehensive income (loss), which is reflected as a separate component of stockholders’ equity.Realized gains and losses on foreign currency transactions are included in other income (expense) in theaccompanying consolidated statement of operations. During 2010, 2009 and 2008, the Company recorded a$0.1 million realized foreign exchange loss for each period in other income (expense) on its statements ofoperations.
(k) Cash and Cash Equivalents, and Short-Term Investments
The Company considers all cash and highly liquid investments purchased with an original maturity ofless than three months to be cash equivalents.
Short-term investments include securities with original maturities greater than three months and lessthan one year and are available for use in current operations or other activities. Short-term investmentsconsist principally of commercial paper, corporate debentures and bonds. Short-term investments have beenclassified as available for sale. Under this classification, the investments are reported at fair value, withunrealized gains and losses excluded from results of operations and reported, net of tax, as a component ofother comprehensive loss in stockholders’ equity. Realized gains and losses and declines in value judged tobe other than temporary are included in results of operations. Gains and losses from the sale of securities arebased on the specific-identification method.
52

Cash, cash equivalents, and short-term investments as of December 31, 2010 and December 31, 2009consisted of the following (in thousands):
December 31,2010
December 31,2009
Cash and Cash Equivalents:Cash . . . . . . . . . . . . . . . . . . . . . . . . . . . . . . . . . . . . . . . . . . . . . . . . . . $16,957 $19,050Money Market Funds . . . . . . . . . . . . . . . . . . . . . . . . . . . . . . . . . . . . . 4,217 2,410
$21,174 $21,460
Short-term investments:Corporate Securities . . . . . . . . . . . . . . . . . . . . . . . . . . . . . . . . . . . . . . — 306
$ — $ 306
As of December 31, 2010 and December 31, 2009, the fair value equaled cost of the cash and cashequivalents and short-term investments.
(l) Fair Value of Financial Instruments
The carrying amounts of the Company’s consolidated financial instruments which include cash andcash equivalents, accounts receivable, accounts payable and accrued liabilities approximate their fair valuesas of December 31, 2010 and 2009 due to the relatively short maturities of these instruments. The carryingvalue of the Company’s debt obligations at December 31, 2010 and 2009 approximate their fair value.
(m) Concentration of Risk
Financial instruments which potentially subject the Company to concentrations of credit risk consistprimarily of cash and cash equivalents and accounts receivable. Cash and cash equivalents consistprincipally of demand deposit and money market accounts. Cash and cash equivalents are principally heldwith various domestic financial institutions with high credit standing. The Company performs ongoingcredit evaluations of its customers and generally does not require collateral. Allowances are maintained forpotential doubtful accounts. During the year ended December 31, 2010, Emirates TelecommunicationsCorporation (“Etisalat”) accounted for 24% of net revenue. For the year ended December 31, 2009, the samecustomer accounted for 19% of net revenue.
The target customers for the Company’s products are network service providers that operate voice, dataand video communications networks. There are a limited number of potential customers in this targetmarket. The Company expects that a significant portion of the Company’s future revenue will depend onsales of its products to a limited number of customers. Any failure of one or more customers to purchaseproducts from the Company for any reason, including any downturn in their businesses, would seriouslyharm the Company’s business, financial condition and results of operations.
Etisalat accounted for 30% and 66% of net accounts receivable as of December 31, 2010 andDecember 31, 2009, respectively. Etisalat receivables are denominated in United Arab Emirates Dirhams, acurrency that tracks to the U.S. dollar.
As of December 31, 2010 and December 31, 2009, receivables from customers in countries other thanthe United States represented 74% and 82%, respectively, of net accounts receivable.
From time to time, the Company may provide or commit to extend credit or credit support to itscustomers. This financing may include extending the terms for product payments to customers. Dependingupon market conditions, the Company may seek to factor these arrangements to financial institutions andinvestors to reduce the amount of its financial commitments associated with such arrangements. Forexample, during the year ended December 31, 2008, the Company sold $10.2 million of customer trade
53

receivables to SVB on a non-recourse basis in exchange for cash. The sale of receivables did not represent asecuritization, and there was no continuing involvement or interests in the receivables by the Company afterthe sale. As of December 31, 2010, the Company did not have any significant customer financingcommitments or guarantees.
The Company’s products are concentrated in the communications equipment market, which is highlycompetitive and subject to rapid change. Significant technological changes in the industry could adverselyaffect operating results. The Company’s inventories include components that may be specialized in nature,and subject to rapid technological obsolescence. The Company actively manages inventory levels, and theCompany considers technological obsolescence and potential changes in product demand based onmacroeconomic conditions when estimating required allowances to reduce recorded inventory amounts tomarket value. Such estimates could change in the future.
The Company’s growth and ability to meet customer demands are also dependent on its ability toobtain timely deliveries of components from suppliers and contract manufacturers. The Company dependson contract manufacturers and sole or limited source suppliers for several key components. If the Companywere unable to obtain these components on a timely basis, the Company would be unable to meet itscustomers’ product delivery requirements which could adversely impact operating results. While theCompany is not solely dependent on one contract manufacturer, it expects to continue to rely on contractmanufacturers to fulfill a portion of its product manufacturing requirements.
(n) Property and Equipment
Property and equipment are stated at cost and depreciated using the straight-line method over theirestimated useful lives. Useful life for buildings is 30 years. Useful lives for laboratory and manufacturingequipment range from 10 to 30 years. Useful lives of all other property and equipment range from 3 to 5years. Leasehold improvements are generally amortized over the shorter of their useful lives or theremaining lease term.
(o) Goodwill
Costs in excess of the fair value of tangible and identifiable intangible assets acquired and liabilitiesassumed in a purchase business combination are recorded as goodwill. The Company tests for goodwillimpairment at least annually using a two-step approach. The Company evaluates goodwill on an annualbasis in November, at a minimum, and whenever events and changes in circumstances suggest that thecarrying amount may not be recoverable. Impairment of goodwill is tested at the reporting unit level bycomparing the reporting unit’s carrying amount, including goodwill, to the fair value of the reporting unit.The Company has determined that it operates in a single segment with one operating unit. The Companyperforms the annual goodwill impairment test using the market approach. If the carrying amount of thereporting unit exceeds its fair value, indication of goodwill impairment exists and a second step isperformed to measure the amount of impairment loss, if any. During the year ended December 31, 2008, theCompany recorded non-cash goodwill impairment charges of $70.4 million. As a result, the goodwill wasfully impaired as of December 31, 2008, as discussed in Note 3.
(p) Purchased Intangibles and Other Long-Lived Assets
The Company reviews long-lived assets, including intangible assets other than goodwill, forimpairment whenever events or changes in circumstances indicate that the carrying value of an asset maynot be fully recoverable based on expected undiscounted cash flows attributable to that asset. Recoverabilityof assets to be held and used is measured by a comparison of the carrying amount of an asset to future netundiscounted cash flows expected to be generated by the asset. If the carrying amount of an asset exceeds itsestimated future net undiscounted cash flows, an impairment charge is recognized by the amount by whichthe carrying amount of the asset exceeds the fair value of the asset. Any assets to be disposed of would be
54

separately presented in the balance sheet and reported at the lower of the carrying amount or fair value lesscosts to sell, and would no longer be depreciated. The assets and liabilities of a disposed group classified asheld for sale would be presented separately in the appropriate asset and liability sections of the balancesheet.
(q) Accounting for Stock-Based Compensation
The Company has adopted the Black Scholes model to estimate the fair value of options. The value ofthe portion of the award that is ultimately expected to vest is recognized as expense over the requisiteservice periods in the Company’s consolidated statement of operations.
Awards of stock options granted to consultants under the Company’s share-based compensation plansare accounted for at fair value determined by using the Black Scholes option pricing. These options aregenerally immediately exercisable and expire seven to ten years from the date of grant. The Company valuesnon-employee options using the Black Scholes model. Non-employee options subject to vesting are valuedas they become vested.
The Company attributes the values of the stock-based compensation to expense using the straight linemethod.
(r) Income Taxes
The Company uses the asset and liability method to account for income taxes. Under this method,deferred tax assets and liabilities are determined based on differences between the financial reporting andthe income tax bases of assets and liabilities. Deferred tax assets and liabilities are measured using enactedtax rates and laws that will be in effect when the differences are expected to reverse. Valuation allowancesare established, when necessary, to reduce deferred tax assets to the amount expected to be realized. TheCompany has recorded a full valuation allowance against its net deferred tax assets at December 31, 2010and 2009 due to the significant uncertainty regarding whether the deferred tax assets will be realized.
(s) Net Loss per Common Share
Basic net loss per share is computed by dividing the net loss applicable to holders of common stock forthe period by the weighted average number of shares of common stock outstanding during the period. Thecalculation of diluted net loss per share gives effect to common stock equivalents; however, potentialcommon equivalent shares are excluded if their effect is antidilutive. Potential common equivalent sharesare composed of common stock subject to repurchase rights and incremental shares of common equivalentshares issuable upon the exercise of stock options and warrants, and the conversion of convertible debt.
(t) Other Comprehensive Income (Loss)
Other comprehensive income (loss) is recorded directly to stockholders’ equity and includes unrealizedgains and losses which have been excluded from the consolidated statements of operations. These unrealizedgains and losses consist of foreign currency translation adjustments and unrealized gains and losses onavailable-for-sale securities.
(u) Recent Accounting Pronouncements
In September 2009, the Financial Accounting Standards Board (“FASB”) issued an AccountingStandards Update (“ASU”) 2009-13, Revenue Recognition (Topic 605): Multiple-Deliverable RevenueArrangements. As summarized in ASU 2009-13, ASC Topic 605 has been amended (1) to provide updatedguidance on whether multiple deliverables exist, how the deliverables in an arrangement should beseparated, and the consideration allocated; (2) to require an entity to allocate revenue in an arrangement
55

using estimated selling prices of deliverables if a vendor does not have Vendor-Specific Objective Evidence(“VSOE”) or third-party evidence of selling price; and (3) to eliminate the use of the residual method andrequire an entity to allocate revenue using the relative selling price method. The accounting changessummarized in ASU 2009-13 are effective for fiscal years beginning on or after June 15, 2010, with earlyadoption permitted. Adoption may either be on a prospective basis or by retrospective application. TheCompany has assessed the impact of this amendment to the ASC on its accounting and reporting systemsand processes and does not anticipate the adoption to have a material impact on the consolidated financialstatements.
In January 2010, FASB issued ASU 2010-06, Fair Value Measurements and Disclosures (Topic 820):Improving Disclosures about Fair Value Measurements. The update requires new disclosures aboutrecurring or nonrecurring fair-value measurements including significant transfers into and out of Level 1and Level 2 fair-value measurements. The Company adopted the updated standard as of March 31, 2010.The adoption did not have any impact on the Company’s consolidated financial statements.
(2) Operating Lease Liabilities
As a result of the acquisition of Paradyne in September 2005, the Company assumed certain lease liabilitiesfor facilities in Largo, Florida. The Company has accrued a liability for the excess portion of these facilities. Theterm of the lease expires in June 2012 and had an estimated remaining obligation of approximately $6.5 millionas of December 31, 2010, of which $2.7 million was accrued for excess facilities, net of contractual andestimated sublease income. During the second quarter of 2008, the Company significantly reduced itsassumptions regarding estimated future sublease income primarily as a result of the deteriorating real estatemarket. Accordingly, during the second quarter of 2008, the Company increased its excess lease liability balanceby $3.3 million with a corresponding charge to general and administrative expenses. During 2009, the Companyassumed that it would no longer be able to sublease the remaining excess space due to the continued deteriorationin the real estate market. Accordingly, during 2009, the Company increased its excess lease liability balance by$0.6 million, with a corresponding charge to general and administrative expenses. A summary of current periodactivity related to excess lease liabilities accrued is as follows (in thousands):
Exit costs
Balance at December 31, 2009 . . . . . . . . . . . . . . . . . . . . . . . . . . . . . . . . . . . . . . . . . . . . . . . . . $ 4,418Cash payments, net . . . . . . . . . . . . . . . . . . . . . . . . . . . . . . . . . . . . . . . . . . . . . . . . . . . . . . . . . . (1,691)
Balance at December 31, 2010 . . . . . . . . . . . . . . . . . . . . . . . . . . . . . . . . . . . . . . . . . . . . . . . . . $ 2,727
A summary of the excess lease liabilities at their net present value is as follows (in thousands):
Exit costs
Future lease payments for excess space . . . . . . . . . . . . . . . . . . . . . . . . . . . . . . . . . . . . . . . . . . $3,492Less: contractual sublease income . . . . . . . . . . . . . . . . . . . . . . . . . . . . . . . . . . . . . . . . . . . . . . (765)
Balance at December 31, 2010 . . . . . . . . . . . . . . . . . . . . . . . . . . . . . . . . . . . . . . . . . . . . . . . . . $2,727
The current portion of the excess lease liability as of December 31, 2010 of $1.8 million is classified in“Accrued and other liabilities” and the long-term portion of $0.9 million is classified in “Other long-termliabilities” in the accompanying consolidated balance sheet.
56

(3) Long-lived Assets, Goodwill and Other Acquisition-Related Intangible Assets
Impairment
The Company tests goodwill for impairment using a two step approach on an annual basis in November, orwhen certain indicators of impairment exist. Impairment of goodwill is tested at the reporting unit level bycomparing the reporting unit’s carrying amount, including goodwill, to the fair value of the reporting unit usingthe market approach. The Company has determined that it operates in a single segment with one reporting unit. Ifthe carrying amount of the reporting unit exceeds its fair value, a second step is performed to measure the amountof impairment loss, if any. In 2008, the Company determined that the reporting unit’s carrying value exceeded itsfair value and the second step was performed, resulting in a goodwill impairment loss of $70.4 million. TheCompany has not incurred any additional goodwill since the 2008 impairment.
The Company reviews long-lived assets, including intangible assets other than goodwill, for impairmentwhenever events or changes in circumstances indicate that the carrying value of an asset may not be recoverablebased on expected undiscounted cash flows attributable to that asset. The amount of any impairment is measuredas the difference between the carrying value and the fair value of the impaired asset.
The Company estimates the fair value of its long-lived assets based on a combination of the market, incomeand replacement cost approaches. In the application of the impairment testing, the Company is required to makeestimates of future operating trends and resulting cash flows and judgments on discount rates and other variables.Actual future results and other assumed variables could differ from these estimates. As of December 31, 2010,the Company’s long-lived assets consisted of $5.3 million of net property and equipment.
Sale of Intangible Assets
During 2008, the Company sold some of its non-strategic patents for $1.1 million. The resulting $1.1million gain was recorded within operating expenses as gain on sale of intangible assets. There were no similarsales of intangible assets during 2009 or 2010.
Sale of Legacy Inventory and Other Assets
In January 2008, the Company sold its GigaMux legacy product line to a third party. The sale of theGigaMux legacy product line was not treated as a discontinued operation since it did not represent a componentof the Company that had operations and cash flows that were clearly distinguishable, operationally and forfinancial reporting purposes, from the rest of the entity. The Company allocated the proceeds received toreceivables, inventory, fixed assets and intangible assets based on the relative fair value of the assets sold. TheCompany recognized a gain of $1.3 million on the sale of the inventory related to this product line in the firstquarter of 2008 that was recorded in cost of revenue. The Company also recognized a gain of $0.5 million and$3.2 million on the sale of fixed assets and intangible assets, respectively, in the first quarter of 2008 that wasrecorded as a component of operating expenses. The Company is entitled to additional contingent considerationfor the sale of the GigaMux legacy product line upon the buyer’s usage of inventory and/or attainment of certainperformance targets through December 2010. Additional contingent consideration, if any, will be recorded uponreceipt of cash as an additional gain in cost of revenue. In 2008 and 2009, the Company received additionalcontingent consideration of $1.1 million and $0.4 million, respectively, related to the buyer’s usage of inventoryrelated to the GigaMux legacy product line. The Company received no additional contingent consideration in2010 related to the GigaMux legacy product line.
(4) Fair Value Measurement
The Company utilizes the market approach to measure fair value of its financial assets and liabilities. Themarket approach uses prices and other relevant information generated by market transactions involving identicalor comparable assets or liabilities.
57
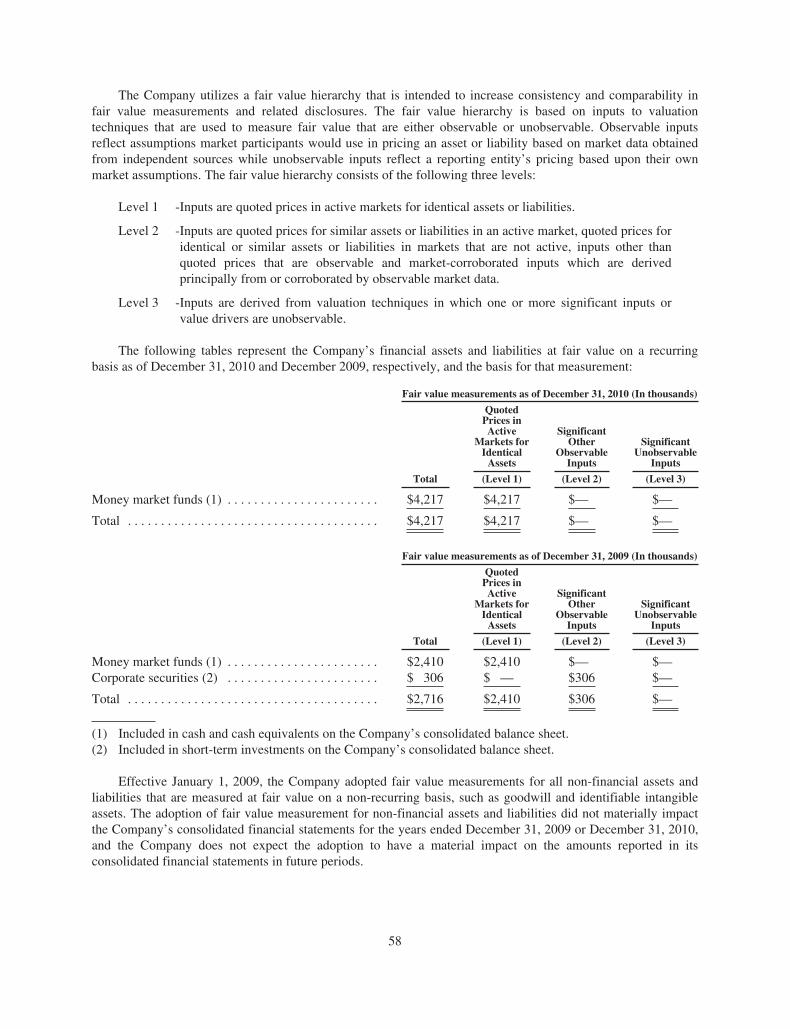
The Company utilizes a fair value hierarchy that is intended to increase consistency and comparability infair value measurements and related disclosures. The fair value hierarchy is based on inputs to valuationtechniques that are used to measure fair value that are either observable or unobservable. Observable inputsreflect assumptions market participants would use in pricing an asset or liability based on market data obtainedfrom independent sources while unobservable inputs reflect a reporting entity’s pricing based upon their ownmarket assumptions. The fair value hierarchy consists of the following three levels:
Level 1 -Inputs are quoted prices in active markets for identical assets or liabilities.
Level 2 -Inputs are quoted prices for similar assets or liabilities in an active market, quoted prices foridentical or similar assets or liabilities in markets that are not active, inputs other thanquoted prices that are observable and market-corroborated inputs which are derivedprincipally from or corroborated by observable market data.
Level 3 -Inputs are derived from valuation techniques in which one or more significant inputs orvalue drivers are unobservable.
The following tables represent the Company’s financial assets and liabilities at fair value on a recurringbasis as of December 31, 2010 and December 2009, respectively, and the basis for that measurement:
Fair value measurements as of December 31, 2010 (In thousands)
Total
QuotedPrices inActive
Markets forIdenticalAssets
SignificantOther
ObservableInputs
SignificantUnobservable
Inputs
(Level 1) (Level 2) (Level 3)
Money market funds (1) . . . . . . . . . . . . . . . . . . . . . . . $4,217 $4,217 $— $—
Total . . . . . . . . . . . . . . . . . . . . . . . . . . . . . . . . . . . . . . $4,217 $4,217 $— $—
Fair value measurements as of December 31, 2009 (In thousands)
Total
QuotedPrices inActive
Markets forIdenticalAssets
SignificantOther
ObservableInputs
SignificantUnobservable
Inputs
(Level 1) (Level 2) (Level 3)
Money market funds (1) . . . . . . . . . . . . . . . . . . . . . . . $2,410 $2,410 $— $—Corporate securities (2) . . . . . . . . . . . . . . . . . . . . . . . $ 306 $ — $306 $—
Total . . . . . . . . . . . . . . . . . . . . . . . . . . . . . . . . . . . . . . $2,716 $2,410 $306 $—
(1) Included in cash and cash equivalents on the Company’s consolidated balance sheet.(2) Included in short-term investments on the Company’s consolidated balance sheet.
Effective January 1, 2009, the Company adopted fair value measurements for all non-financial assets andliabilities that are measured at fair value on a non-recurring basis, such as goodwill and identifiable intangibleassets. The adoption of fair value measurement for non-financial assets and liabilities did not materially impactthe Company’s consolidated financial statements for the years ended December 31, 2009 or December 31, 2010,and the Company does not expect the adoption to have a material impact on the amounts reported in itsconsolidated financial statements in future periods.
58

(5) Sale-leaseback of Oakland, California Campus
On September 28, 2010, the Company sold its Oakland, California campus, consisting of land and threebuildings, to LBA Realty for approximately $18.8 million. As part of the sale transaction, LBA Realty agreed tosettle the Company’s secured real estate debt which was secured by the Oakland, California campus for a net sumof $17.6 million pursuant to a Discount Payoff Agreement as discussed in Note 7. The net cash proceeds from thesale of Oakland, California campus and extinguishment of related debt was $0.6 million after offsetting the grossselling price of $18.8 million with the closing costs of $0.2 million, extinguishment of related debt of $17.6million and other miscellaneous payments of $0.4 million. As the sale transaction and the extinguishment of debtoccurred simultaneously with the same party, the gain on the extinguishment of $0.8 million has been accountedfor as sale proceeds in the sale and leaseback transaction.
In connection with the sale, the Company entered into a Multi-Tenant Commercial/Industrial LeaseAgreement (the “Lease Agreement”) to rent one of the buildings from LBA Realty for a five-year term,commencing from the closing of the sale. The initial annual rent under the Lease Agreement is approximately$0.6 million, with periodic rent escalations at a rate of approximately 2% per annum. Under the LeaseAgreement, in October 2010, the Company received a non-refundable tenant improvement allowance of $1.7million for the required alterations to the property being leased back. The tenant improvement allowance amountis being amortized over the term of the lease as an offset to rent expense.
The sale of the Oakland, California campus, consisting of land and three buildings, qualified as a ‘sale’ asthat term is defined in Accounting Standards Codification (“ASC”) 360-20, Real Estate Sales. Additionally, thesubsequent leaseback of one of the buildings qualified as a normal leaseback as defined in ASU 840-40, Sale-Leaseback Transactions. The Company recognized a net gain in the condensed consolidated statement ofoperations for the year ended 2010 of $2.0 million, which represents the estimated fair value in excess of thebook value of the buildings sold but not leased back. The remaining gain of $2.2 million, representing theestimated fair value in excess of the book value of the building sold and leased back, was deferred in a long-termliability account to be amortized as a reduction in rent expense over the term of the lease.
For the purposes of accounting for the sale and leaseback transaction, the estimated fair value of thebuildings on an individual basis was determined by the Company based on the compilation and review of third-party evidence of the current market prices for sales of similar buildings in the geographic area where theCompany’s campus is situated.
59

(6) Balance Sheet Detail
Balance sheet detail as of December 31, 2010 and 2009 is as follows (in thousands):
2010 2009
Inventories:Raw materials . . . . . . . . . . . . . . . . . . . . . . . . . . . . . . . . . . . . . . . . . . . . . . . . $20,539 $ 20,898Work in process . . . . . . . . . . . . . . . . . . . . . . . . . . . . . . . . . . . . . . . . . . . . . . 2,751 3,071Finished goods . . . . . . . . . . . . . . . . . . . . . . . . . . . . . . . . . . . . . . . . . . . . . . . 7,758 6,259
$31,048 $ 30,228
Property and equipment, net:Land . . . . . . . . . . . . . . . . . . . . . . . . . . . . . . . . . . . . . . . . . . . . . . . . . . . . . . . $ — $ 4,821Buildings . . . . . . . . . . . . . . . . . . . . . . . . . . . . . . . . . . . . . . . . . . . . . . . . . . . — 14,007Machinery and equipment . . . . . . . . . . . . . . . . . . . . . . . . . . . . . . . . . . . . . . 8,406 9,420Computers and acquired software . . . . . . . . . . . . . . . . . . . . . . . . . . . . . . . . 3,573 3,795Furniture and fixtures . . . . . . . . . . . . . . . . . . . . . . . . . . . . . . . . . . . . . . . . . . 416 313Leasehold improvements . . . . . . . . . . . . . . . . . . . . . . . . . . . . . . . . . . . . . . . 2,006 376
14,401 32,732Less accumulated depreciation and amortization . . . . . . . . . . . . . . . . . . . . (9,127) (13,771)
$ 5,274 $ 18,961
Depreciation and amortization expense associated with property and equipment amounted to $1.6 million,$1.8 million and $2.2 million for the years ended December 31, 2010, 2009 and 2008, respectively.
2010 2009
Accrued and other liabilities (in thousands):Accrued warranty . . . . . . . . . . . . . . . . . . . . . . . . . . . . . . . . . . . . . . . . . . . . . $ 1,683 $ 1,662Accrued compensation . . . . . . . . . . . . . . . . . . . . . . . . . . . . . . . . . . . . . . . . . 2,583 2,700Accrued exit costs . . . . . . . . . . . . . . . . . . . . . . . . . . . . . . . . . . . . . . . . . . . . . 1,818 1,785Deferred revenue . . . . . . . . . . . . . . . . . . . . . . . . . . . . . . . . . . . . . . . . . . . . . . 1,045 624Other . . . . . . . . . . . . . . . . . . . . . . . . . . . . . . . . . . . . . . . . . . . . . . . . . . . . . . . 6,088 5,260
$13,217 $12,031
The Company accrues for warranty costs based on historical trends for the expected material and labor coststo provide warranty services. Warranty periods are generally one year from the date of shipment. The followingtable summarizes the activity related to the product warranty liability during the years ended December 31, 2010and 2009 (in thousands):
Balance at December 31, 2008 . . . . . . . . . . . . . . . . . . . . . . . . . . . . . . . . . . . . . . . . . . . . . . . . . $ 1,979Charged to operations . . . . . . . . . . . . . . . . . . . . . . . . . . . . . . . . . . . . . . . . . . . . . . . . . . . . . . . . 1,537Claims/settlements . . . . . . . . . . . . . . . . . . . . . . . . . . . . . . . . . . . . . . . . . . . . . . . . . . . . . . . . . . (1,854)
Balance at December 31, 2009 . . . . . . . . . . . . . . . . . . . . . . . . . . . . . . . . . . . . . . . . . . . . . . . . . $ 1,662Charged to operations . . . . . . . . . . . . . . . . . . . . . . . . . . . . . . . . . . . . . . . . . . . . . . . . . . . . . . . . 1,593Claims/settlements . . . . . . . . . . . . . . . . . . . . . . . . . . . . . . . . . . . . . . . . . . . . . . . . . . . . . . . . . . (1,572)
Balance at December 31, 2010 . . . . . . . . . . . . . . . . . . . . . . . . . . . . . . . . . . . . . . . . . . . . . . . . . $ 1,683
60

(7) Debt
Secured Real Estate Loan
In September 2010, the Company extinguished its existing secured real estate loan secured by the Oakland,California campus for $17.6 million as part of the sale-leaseback transaction as discussed in Note 5. The totalamount outstanding under the secured real estate loan was $18.4 million at the extinguishment date, with amaturity date of April 1, 2011. The interest rate on the secured real estate loan was 6.5% per annum. As the saletransaction and the extinguishment of debt occurred simultaneously with the same party, the gain on theextinguishment of $0.8 million has been accounted for as sale proceeds in the sale and leaseback transaction asdiscussed in Note 5. As a result of the sale-leaseback transaction the secured real estate loan balance was of zeroand $18.3 million as of December 31, 2010 and December 31, 2009, respectively.
Credit Facility
In March 2010, the Company renewed its SVB Facility with Silicon Valley Bank (“SVB”) to provideliquidity and working capital through March 15, 2011.
Under the SVB Facility, the Company has the option of borrowing funds at agreed upon interest rates. Theamount that the Company is able to borrow under the SVB Facility varies based on the eligible accountsreceivable, as defined in the agreement, as long as the principal amount outstanding does not exceed $25.0million. In addition, under the SVB Facility, the Company is able to utilize the facility as security for letters ofcredit.
Under the SVB Facility, $10.0 million was outstanding at December 31, 2010. In addition, $6.4 million wascommitted as security for various letters of credit and $7.7 million was unused and available for borrowing as ofDecember 31, 2010. As of December 31, 2010, the amounts borrowed under the SVB Facility bore interest,payable monthly, at a floating rate that was SVB’s prime rate plus 2.5%, with a minimum interest rate of 6.5%.The interest rate was 6.5% at December 31, 2010.
The Company’s obligations under the SVB Facility are secured by substantially all of its personal propertyassets and those of its subsidiaries, including their intellectual property. The SVB Facility contains certainfinancial covenants, and customary affirmative covenants and negative covenants. If the Company does notcomply with the various covenants and other requirements under the SVB Facility, SVB is entitled to, amongother things, require the immediate repayment of all outstanding amounts and sell the Company’s assets tosatisfy the obligations under the SVB Facility. As of December 31, 2010, the Company was not in compliancewith the financial covenant regarding minimum EBITDA under the SVB Facility. On January 19, 2011, theCompany entered into an amendment with SVB in which SVB agreed to waive the Company’s obligation tocomply with the financial covenant regarding minimum EBITDA for the compliance period endingDecember 31, 2010.
On March 14, 2011, the Company renewed its SVB Facility with SVB to provide liquidity and workingcapital through March 13, 2012 and amended the interest rate applicable to amounts borrowed under the SVBFacility, as discussed in Note 16.
(8) Stockholders’ Equity
(a) Overview
As of December 31, 2010 and 2009, the Company’s equity capitalization consisted of 180 millionauthorized shares of common stock, of which 30.6 million and 30.3 million shares, respectively, wereoutstanding.
On March 11, 2010, the Company filed a Certificate of Amendment with the Delaware Secretary of State toamend the Company’s Certificate of Incorporation, which amendment effected a one-for-five reverse stock split
61

of Zhone common stock and reduced the authorized shares of Zhone common stock from 900,000,000 to180,000,000. No fractional shares of common stock were issued as a result of the reverse stock split andshareholders of record received cash in lieu of the fractional shares to which they would otherwise have beenentitled, based on the closing price of Zhone common stock on March 10, 2010. All stock options were modifiedfor the one-for-five reverse split by decreasing the number of shares and increasing the exercise price per shareon a one-for-five basis. This modification did not result in any additional stock compensation expense in thecurrent period or future periods. References to shares of Zhone common stock, warrants and stock options (andassociated dollar amounts) in this Form 10-K for the year ended December 31, 2010 are provided on a post-reverse stock split basis.
(b) Warrants
At December 31, 2010, the Company had a total of 7,238 warrants to purchase common stock outstanding ata weighted average exercise price of $116.55 per share. Warrants to purchase 270,523 shares of common stockexpired unexercised in 2009, with an aggregate exercise price of $5.6 million. The remaining outstandingwarrants will expire in the years 2013 and 2014. No warrants were exercised in 2010, 2009 or 2008.
(c) Stock-Based Compensation
As of December 31, 2010, the Company had two types of share-based compensation plans related to stockoptions and employee stock purchases. The compensation cost that has been charged as an expense in thestatement of operations for those plans was $2.3 million, $2.3 million and $2.4 million for the years endedDecember 31, 2010, 2009 and 2008, respectively.
The following table summarizes stock-based compensation expense for the years ended December 31, 2010,2009 and 2008 (in thousands):
Year ended December 31,
2010 2009 2008
Compensation expense relating to employee stock options . . . . . . . . . . . . . . . . . . . . . . $2,098 $2,142 $2,140Compensation expense relating to non-employees . . . . . . . . . . . . . . . . . . . . . . . . . . . . 69 69 81Compensation expense relating to Employee Stock Purchase Plan . . . . . . . . . . . . . . . . 98 49 130
Stock-based compensation expense . . . . . . . . . . . . . . . . . . . . . . . . . . . . . . . . . . . . . . . . $2,265 $2,260 $2,351
Stock Options
The Company’s stock-based compensation plans are designed to attract, motivate, retain and reward talentedemployees, directors and consultants and align stockholder and employee interests. The Company has two activestock option plans, the Amended and Restated Special 2001 Stock Incentive Plan and the Amended and Restated2001 Stock Incentive Plan. Stock options are primarily issued from the Amended and Restated 2001 StockIncentive Plan. This plan provides for the grant of incentive stock options, non-statutory stock options, restrictedstock awards and other stock-based awards to officers, employees, directors and consultants of the Company.Options may be granted at an exercise price less than, equal to or greater than the fair market value on the date ofgrant, except that any options granted to a 10% stockholder must have an exercise price equal to at least 110% ofthe fair market value of the Company’s common stock on the date of grant. The Board of Directors determinesthe term of each option, the option exercise price and the vesting terms. Stock options are generally granted at anexercise price equal to the fair market value on the date of grant, expiring seven to ten years from the date ofgrant and vesting over a period of four years. On January 1 of each year, if the number of shares available forgrant under the Amended and Restated 2001 Stock Incentive Plan is less than 5% of the total number of shares ofcommon stock outstanding as of that date, the shares available for grant under the plan are automaticallyincreased by the amount necessary to make the total number of shares available for grant equal to 5% of the total
62
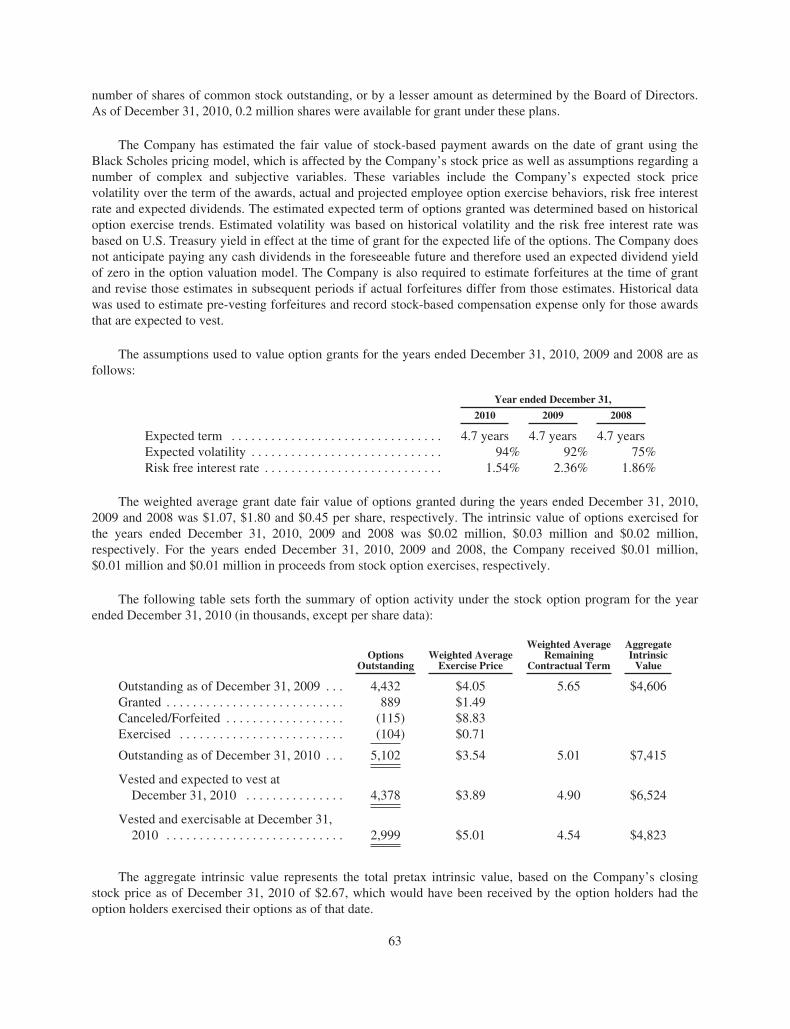
number of shares of common stock outstanding, or by a lesser amount as determined by the Board of Directors.As of December 31, 2010, 0.2 million shares were available for grant under these plans.
The Company has estimated the fair value of stock-based payment awards on the date of grant using theBlack Scholes pricing model, which is affected by the Company’s stock price as well as assumptions regarding anumber of complex and subjective variables. These variables include the Company’s expected stock pricevolatility over the term of the awards, actual and projected employee option exercise behaviors, risk free interestrate and expected dividends. The estimated expected term of options granted was determined based on historicaloption exercise trends. Estimated volatility was based on historical volatility and the risk free interest rate wasbased on U.S. Treasury yield in effect at the time of grant for the expected life of the options. The Company doesnot anticipate paying any cash dividends in the foreseeable future and therefore used an expected dividend yieldof zero in the option valuation model. The Company is also required to estimate forfeitures at the time of grantand revise those estimates in subsequent periods if actual forfeitures differ from those estimates. Historical datawas used to estimate pre-vesting forfeitures and record stock-based compensation expense only for those awardsthat are expected to vest.
The assumptions used to value option grants for the years ended December 31, 2010, 2009 and 2008 are asfollows:
Year ended December 31,
2010 2009 2008
Expected term . . . . . . . . . . . . . . . . . . . . . . . . . . . . . . . . 4.7 years 4.7 years 4.7 yearsExpected volatility . . . . . . . . . . . . . . . . . . . . . . . . . . . . . 94% 92% 75%Risk free interest rate . . . . . . . . . . . . . . . . . . . . . . . . . . . 1.54% 2.36% 1.86%
The weighted average grant date fair value of options granted during the years ended December 31, 2010,2009 and 2008 was $1.07, $1.80 and $0.45 per share, respectively. The intrinsic value of options exercised forthe years ended December 31, 2010, 2009 and 2008 was $0.02 million, $0.03 million and $0.02 million,respectively. For the years ended December 31, 2010, 2009 and 2008, the Company received $0.01 million,$0.01 million and $0.01 million in proceeds from stock option exercises, respectively.
The following table sets forth the summary of option activity under the stock option program for the yearended December 31, 2010 (in thousands, except per share data):
OptionsOutstanding
Weighted AverageExercise Price
Weighted AverageRemaining
Contractual Term
AggregateIntrinsicValue
Outstanding as of December 31, 2009 . . . 4,432 $4.05 5.65 $4,606Granted . . . . . . . . . . . . . . . . . . . . . . . . . . . 889 $1.49Canceled/Forfeited . . . . . . . . . . . . . . . . . . (115) $8.83Exercised . . . . . . . . . . . . . . . . . . . . . . . . . (104) $0.71
Outstanding as of December 31, 2010 . . . 5,102 $3.54 5.01 $7,415
Vested and expected to vest atDecember 31, 2010 . . . . . . . . . . . . . . . 4,378 $3.89 4.90 $6,524
Vested and exercisable at December 31,2010 . . . . . . . . . . . . . . . . . . . . . . . . . . . 2,999 $5.01 4.54 $4,823
The aggregate intrinsic value represents the total pretax intrinsic value, based on the Company’s closingstock price as of December 31, 2010 of $2.67, which would have been received by the option holders had theoption holders exercised their options as of that date.
63

As of December 31, 2010, there was $1.8 million of unrecognized compensation costs, adjusted forestimated forfeitures related to unvested stock-based payments granted which are expected to be recognized overa weighted average period of 1.9 years.
In November 2008, the Company completed an offer (the “Exchange Offer”) to exchange certain stockoptions issued to eligible employees, officers and directors of Zhone under Zhone’s equity incentivecompensation plans. Stock options previously granted that had an exercise price per share of equal to or greaterthan $1.75 per share were eligible to be exchanged on a one-for-one basis for new stock options with an exerciseprice equal to the last reported sale price of Zhone common stock on The Nasdaq Global Market on the date ofgrant. Options for an aggregate of 2.9 million shares of common stock were exchanged. The new stock optionsissued pursuant to the Exchange Offer have an exercise price of $0.50, vest over a four-year period with no creditfor past vesting and have a seven-year term. The Exchange Offer will result in incremental stock-basedcompensation of approximately $0.7 million to be recognized over the four-year vesting period. The remainingunrecognized compensation expense of the original grant will be amortized over the original requisite serviceperiod.
On March 31, 2010, the Company’s board of directors approved the acceleration of vesting of all unvestedoptions to purchase shares of Zhone common stock issued in connection with the Exchange Offer that were heldby members of the Company’s senior management. The acceleration was effective as of March 31, 2010. Optionsto purchase an aggregate of approximately 0.9 million shares of Zhone common stock were subject to theacceleration and resulted in a compensation charge of $0.9 million which was fully expensed on March 31, 2010.The acceleration of these options was undertaken in recognition of the achievement of certain performanceobjectives by the Company’s senior management.
Employee Stock Purchase Plan
The Company’s 2002 Employee Stock Purchase Plan (“ESPP”) allows eligible employee participants topurchase shares of the Company’s common stock at a price equal to 85% of the lower of the fair market value ofthe common stock at the beginning or the end of each offering period. Participation is limited to 10% of anemployee’s eligible compensation, not to exceed amounts allowed by the Internal Revenue Code. During thesecond quarter of 2006, the number of available shares under the ESPP was increased by 0.4 million. AtSeptember 1, 2005, the Company changed from a six month offering period to a three month offering periodunder the ESPP. The following table summarizes shares purchased, weighted average purchase price, cashreceived and the aggregate intrinsic value for ESPP purchases during the years ended December 31, 2010, 2009and 2008 (in thousands, except per share data):
Year ended December 31,
2010 2009 2008
Shares purchased . . . . . . . . . . . . . . . . . . . . . . . . . . . . . . . . . . . . . . . . . . . . . . 151 83 111Weighted average purchase price . . . . . . . . . . . . . . . . . . . . . . . . . . . . . . . . . . $1.31 $1.05 $2.60Cash received . . . . . . . . . . . . . . . . . . . . . . . . . . . . . . . . . . . . . . . . . . . . . . . . . $ 199 $ 87 $ 288Aggregate intrinsic value . . . . . . . . . . . . . . . . . . . . . . . . . . . . . . . . . . . . . . . . $ 38 $ 66 $ 50
The assumptions used to value stock purchases under the Company’s ESPP for the years endedDecember 31, 2010, 2009 and 2008 are as follows:
Year ended December 31,
2010 2009 2008
Expected term . . . . . . . . . . . . . . . . . . . . . . . . . . . . . . . . . . . . . . . . 3 months 3 months 3 monthsVolatility . . . . . . . . . . . . . . . . . . . . . . . . . . . . . . . . . . . . . . . . . . . . 83% 145% 68%Risk free interest rate . . . . . . . . . . . . . . . . . . . . . . . . . . . . . . . . . . 0.1% 0.2% 2.0%Weighted average fair value per share . . . . . . . . . . . . . . . . . . . . . $0.68 $0.50 $1.20
64

(9) Net Loss Per Share
The following table sets forth the computation of basic and diluted net loss per share (in thousands, exceptper share data):
Year ended December 31,
2010 2009 2008
Numerator:Net loss . . . . . . . . . . . . . . . . . . . . . . . . . . . . . . . . . . . . . . . . . . $ (4,781) $(10,027) $(92,535)
Denominator:Weighted average common stock outstanding . . . . . . . . . . . . 30,393 30,200 30,068
Basic and diluted net loss per share . . . . . . . . . . . . . . . . . . . . . . . . . $ (0.16) $ (0.33) $ (3.08)
The following tables set forth potential common stock that is not included in the diluted net loss per sharecalculation above because their effect would be anti-dilutive for the periods indicated (in thousands, exceptexercise price per share data):
2010Weighted averageexercise price
Warrants . . . . . . . . . . . . . . . . . . . . . . . . . . . . . . . . . . . . . . . . . . . . . . . . . . . . . 7 $116.55Outstanding stock options and unvested restricted shares . . . . . . . . . . . . . . 5,133 $ 3.52
5,140
2009Weighted averageexercise price
Warrants . . . . . . . . . . . . . . . . . . . . . . . . . . . . . . . . . . . . . . . . . . . . . . . . . . . . . 7 $116.55Outstanding stock options and unvested restricted shares . . . . . . . . . . . . . . 4,445 $ 4.05
4,452
2008Weighted averageexercise price
Warrants . . . . . . . . . . . . . . . . . . . . . . . . . . . . . . . . . . . . . . . . . . . . . . . . . . . . . 278 $ 23.35Outstanding stock options and unvested restricted shares . . . . . . . . . . . . . . 5,310 $ 11.45
5,588
As of December 31, 2010 and 2009, there were zero shares of issued common stock subject to repurchase.
65

(10) Income Taxes
The following is a summary of the components of income tax expense applicable to loss before incometaxes (in thousands):
Year ended December 31,
2010 2009 2008
Current:Federal . . . . . . . . . . . . . . . . . . . . . . . . . . . . . . . . . . . . . . . . . . . . . . . . . . . $(176) $— $—State . . . . . . . . . . . . . . . . . . . . . . . . . . . . . . . . . . . . . . . . . . . . . . . . . . . . . 34 70 104Foreign . . . . . . . . . . . . . . . . . . . . . . . . . . . . . . . . . . . . . . . . . . . . . . . . . . . 41 101 166
(101) 171 270Deferred:
Federal . . . . . . . . . . . . . . . . . . . . . . . . . . . . . . . . . . . . . . . . . . . . . . . . . . . — — —State . . . . . . . . . . . . . . . . . . . . . . . . . . . . . . . . . . . . . . . . . . . . . . . . . . . . . — — —Foreign . . . . . . . . . . . . . . . . . . . . . . . . . . . . . . . . . . . . . . . . . . . . . . . . . . . — — —
$(101) $171 $270
A reconciliation of the expected tax expense (benefit) to the actual tax expense (benefit) is as follows (inthousands):
Year ended December 31,
2010 2009 2008
Expected tax benefit at statutory rate (35%) . . . . . . . . . . . . . . . . . . . . . . . . . . . . . . $(1,709) $(3,450) $(32,292)State taxes, net of Federal effect . . . . . . . . . . . . . . . . . . . . . . . . . . . . . . . . . . . . . . . 22 46 68Goodwill amortization and impairment . . . . . . . . . . . . . . . . . . . . . . . . . . . . . . . . . . — — 24,640Foreign rate differential . . . . . . . . . . . . . . . . . . . . . . . . . . . . . . . . . . . . . . . . . . . . . . (3,598) (1,204) (759)Valuation allowance . . . . . . . . . . . . . . . . . . . . . . . . . . . . . . . . . . . . . . . . . . . . . . . . . 4,535 3,960 7,764Stock-based compensation . . . . . . . . . . . . . . . . . . . . . . . . . . . . . . . . . . . . . . . . . . . . 722 791 810Other . . . . . . . . . . . . . . . . . . . . . . . . . . . . . . . . . . . . . . . . . . . . . . . . . . . . . . . . . . . . . (73) 28 39
$ (101) $ 171 $ 270
Deferred income taxes reflect the net tax effects of temporary differences between the carrying amounts ofassets and liabilities for financial reporting and income tax purposes. Significant components of the Company’sdeferred tax assets and liabilities as of December 31, 2010 and 2009 are as follows (in thousands):
2010 2009
Deferred assets:Net operating loss, capital loss, and tax credit carryforwards . . . . . . . . $ 532,036 $ 501,894Fixed assets and intangible assets . . . . . . . . . . . . . . . . . . . . . . . . . . . . . . 21,873 45,000Inventory and other reserves . . . . . . . . . . . . . . . . . . . . . . . . . . . . . . . . . 7,289 11,773Other . . . . . . . . . . . . . . . . . . . . . . . . . . . . . . . . . . . . . . . . . . . . . . . . . . . . 102 110
Gross deferred tax assets . . . . . . . . . . . . . . . . . . . . . . . . . . . . . . . . 561,300 558,777Less valuation allowance . . . . . . . . . . . . . . . . . . . . . . . . . . . . . . . . . . . . (561,300) (558,777)
Total deferred tax assets . . . . . . . . . . . . . . . . . . . . . . . . . . . . . . . . . $ — $ —
For the years ended December 31, 2010 and 2009, the net changes in the valuation allowance were anincrease of $2.5 million and an increase of $2.4 million, respectively. The Company recorded a full valuationallowance against the net deferred tax assets at December 31, 2010 and 2009 since it is more likely than not that
66

the net deferred tax assets will not be realized due to the lack of previously paid taxes and anticipated taxableincome.
As of December 31, 2010, the Company had net operating loss carryforwards for federal and Californiaincome tax purposes of approximately $1,373.5 million and $460.7 million, respectively, which are available tooffset future taxable income, if any, in years through 2030. Approximately $3.3 million and $2.1 million netoperating loss carryforwards for federal and California income tax purposes, respectively, are attributable toemployee stock option deductions, the benefit from which will be allocated to paid-in-capital rather than currentincome when subsequently recognized. Federal and state laws impose substantial restrictions on the utilization ofnet operating loss and tax credit carryforwards in the event of an ownership change for tax purposes, as definedin Section 382 of the Internal Revenue Code. As a result of such ownership changes, the Company’s ability torealize the potential future benefit of tax losses and tax credits that existed at the time of the ownership changewill be significantly reduced. The Company’s deferred tax asset and related valuation allowance would bereduced as a result. The Company has not yet performed a Section 382 study to determine the amount ofreduction, if any.
As of December 31, 2010, the Company also had research credit carryforwards for federal and state incometax purposes of approximately $20.8 million and $7.7 million, respectively, which are available to reduce futureincome taxes, if any, in years through 2030 and over an indefinite period, respectively. Additionally, theCompany had alternative minimum tax credit carryforwards for federal income tax purposes of approximately$0.1 million which are available to reduce future income taxes, if any, over an indefinite period. The Companyalso had enterprise zone credit carryforwards for state income tax purposes of approximately $0.2 million whichare available to reduce future state income taxes, if any, over an indefinite period.
The Company may have unrecognized tax benefits included in its deferred tax assets which are subject to afull valuation allowance as of December 31, 2010 and 2009. However, the Company has not yet performed astudy to determine the amount of such unrecognized tax benefits.
Interest and penalties, to the extent accrued on unrecognized tax benefits in the future, will be included intax expense.
The Company or one of its subsidiaries files income tax returns in the U.S. federal jurisdiction, and variousstate and foreign jurisdictions. The open tax years for the major jurisdictions are as follows:
• Federal 2007 – 2010• California and Canada 2006 – 2010• Brazil 2005 – 2010• Germany and United Kingdom 2006 – 2010
However, due to the fact the Company had net operating losses and credits carried forward in mostjurisdictions, certain items attributable to technically closed years are still subject to adjustment by the relevanttaxing authority through an adjustment to tax attributes carried forward to open years.
In addition, to the extent the Company is deemed to have a sufficient connection to a particular taxingjurisdiction to enable that jurisdiction to tax the Company but the Company has not filed an income tax return inthat jurisdiction for the year(s) at issue, the jurisdiction would typically be able to assert a tax liability for suchyears without limitation on the number of years it may examine.
The Company is not currently under examination for income taxes in any material jurisdiction.
(11) Related-Party Transactions
In the ordinary course of business, the Company’s executive officers and non-employee directors arereimbursed for travel related expenses when incurred for business purposes. The Company reimburses its
67

Chairman, President and Chief Executive Officer, Morteza Ejabat, for the direct operating expenses incurred inthe use of his private aircraft when used for business purposes. The amount reimbursed for these expenses was$0.3 million, $0.3 million, and $0.5 million during the years ended December 31, 2010, 2009 and 2008,respectively.
(12) Commitments and Contingencies
Operating Leases
The Company has entered into operating leases for certain office space and equipment, some of whichcontain renewal options.
Estimated future lease payments under all non-cancelable operating leases with terms in excess of one year,including taxes and service fees, are as follows (in thousands):
Operating leases
Year ending December 31:2011 . . . . . . . . . . . . . . . . . . . . . . . . . . . . . . . . . . . . . . . . . . . . . . . . . . . . $ 5,2912012 . . . . . . . . . . . . . . . . . . . . . . . . . . . . . . . . . . . . . . . . . . . . . . . . . . . . 2,9102013 . . . . . . . . . . . . . . . . . . . . . . . . . . . . . . . . . . . . . . . . . . . . . . . . . . . . 6902014 . . . . . . . . . . . . . . . . . . . . . . . . . . . . . . . . . . . . . . . . . . . . . . . . . . . . 6542015 and Thereafter . . . . . . . . . . . . . . . . . . . . . . . . . . . . . . . . . . . . . . . . 500
Total minimum lease payments . . . . . . . . . . . . . . . . . . . . . . . . . . . $10,045
The total minimum lease payments shown above include projected payments and obligations for leases thatthe Company is no longer utilizing, some of which relate to excess facilities obtained through acquisitions. AtDecember 31, 2010, the Company had estimated commitments of $6.5 million related to facilities assumed as aresult of the Paradyne acquisition, of which $2.7 million was accrued for excess facilities, which is net ofestimated sublease income. The above amounts also include $3.0 million of future minimum lease paymentsspread over the five-year lease term under the Lease Agreement entered into with LBA Realty in September 2010with respect to the Company’s Oakland, California campus in connection with the sale and leaseback transaction,as discussed in Note 5. For operating leases that include contractual commitments for operating expenses andmaintenance, estimates of such amounts are included based on current rates. Rent expense under operatingleases, excluding rent relating to excess facilities previously accrued, totaled $3.3 million, $3.5 million and$4.0 million for the years ended December 31, 2010, 2009 and 2008, respectively. Sublease rental income totaled$1.0 million, $1.2 million and $1.3 million for the years ended December 31, 2010, 2009 and 2008, respectively.
Other Commitments
Certain pre-acquisition contingencies from the acquisition of Tellium, Inc. in 2003 continue to exist forwhich the Company has reserved an estimated amount that it believes is sufficient to cover the probable lossfrom these matters.
The Company is currently under audit examination by several state taxing authorities for non income basedtaxes. The Company has reserved an estimated amount which the Company believes is sufficient to coverpotential claims.
Performance Bonds
In the normal course of operations, the Company arranges for the issuance of various types of surety bonds,such as bid and performance bonds, which are agreements under which the surety company guarantees that the
68

Company will perform in accordance with contractual or legal obligations. If the Company fails to perform underits obligations, the maximum potential payment under these surety bonds would have been $0.8 million as ofDecember 31, 2010.
Purchase Commitments
The Company has agreements with various contract manufacturers which include non-cancellable inventorypurchase commitments. The Company’s inventory purchase commitments typically allow for cancellation oforders 30 days in advance of the required inventory availability date as set by the Company at time of order. Theamount of non-cancellable purchase commitments outstanding was $7.3 million as of December 31, 2010.
Royalties
The Company has certain royalty commitments associated with the shipment and licensing of certainproducts. Royalty expense is generally based on a dollar amount per unit shipped or a percentage of theunderlying revenue.
(13) Litigation
The Company is subject to various legal proceedings, claims and litigation arising in the ordinary course ofbusiness. While the outcome of these matters is currently not determinable, the Company does not expect that theultimate costs to resolve these matters will have a material adverse effect on its consolidated financial position orresults of operations. However, litigation is subject to inherent uncertainties, and unfavorable rulings could occur.If an unfavorable ruling were to occur, there exists the possibility of a material adverse impact on the results ofoperations of the period in which the ruling occurs, or future periods.
(14) Employee Benefit Plan
The Company maintains a 401(k) plan for its employees whereby eligible employees may contribute up to aspecified percentage of their earnings, on a pretax basis, subject to the maximum amount permitted by theInternal Revenue Code. Under the 401(k) plan, the Company may make discretionary contributions. In 2010, theCompany made a discretionary contribution to the plan of $0.6 million. This was a non-elective employercontribution made from the forfeiture account to all eligible participants. The Company made no discretionarycontributions to the plan in 2008 and 2009.
69

(15) Enterprise Wide Information
The Company designs, develops and manufactures communications products for network service providers.The Company derives substantially all of its revenues from the sales of the Zhone product family. TheCompany’s chief operating decision maker is the Company’s Chief Executive Officer. The Chief ExecutiveOfficer reviews financial information presented on a consolidated basis accompanied by disaggregatedinformation about revenues by geographic region for purposes of making operating decisions and assessingfinancial performance. The Company has determined that it has operated within one discrete reportable businesssegment since inception. The following summarizes required disclosures about geographic concentrations andrevenue by products and services (in thousands).
Year ended December 31,
2010 2009 2008
Revenue by Geography:United States . . . . . . . . . . . . . . . . . . . . . . . . . . . . . . . . . . . . $ 45,303 $ 50,146 $ 60,830Canada . . . . . . . . . . . . . . . . . . . . . . . . . . . . . . . . . . . . . . . . . 4,923 5,458 5,391
Total North America . . . . . . . . . . . . . . . . . . . . . . . . . . 50,226 55,604 66,221
Latin America . . . . . . . . . . . . . . . . . . . . . . . . . . . . . . . . . . . . 24,369 18,016 32,197Europe, Middle East, Africa . . . . . . . . . . . . . . . . . . . . . . . . . 51,596 48,657 43,820Asia Pacific . . . . . . . . . . . . . . . . . . . . . . . . . . . . . . . . . . . . . 2,845 4,224 3,922
Total International . . . . . . . . . . . . . . . . . . . . . . . . . . . . 78,810 70,897 79,939
$129,036 $126,501 $146,160
Year ended December 31,
2010 2009 2008
Revenue by products and services:Products . . . . . . . . . . . . . . . . . . . . . . . . . . . . . . . . . . . . . . . . $124,673 $120,939 $141,916Services . . . . . . . . . . . . . . . . . . . . . . . . . . . . . . . . . . . . . . . . 4,363 5,562 4,244
$129,036 $126,501 $146,160
(16) Subsequent Events
Revolving Line of Credit Renewal
On March 14, 2011, the Company renewed and amended its SVB Facility with SVB to provide liquidity andworking capital through March 13, 2012.
Under the SVB Facility, the Company has the option of borrowing funds at agreed upon interest rates. Theamount that the Company is able to borrow under the SVB Facility will vary based on the eligible accountsreceivable, as defined in the agreement, as long as the principal amount outstanding does not exceed $25.0million. In addition, under the SVB Facility, the Company is able to utilize the facility as security for letters ofcredit.
The amounts borrowed under the revolving credit facility, as amended, will bear interest, payable monthly,at a floating rate equal to the Wall Street Journal Prime Rate plus a margin of 0.0%–1.0% depending on theCompany’s reported quarterly EBITDA as defined in the agreement. The Company’s obligations under the SVBFacility are secured by substantially all of its personal property assets and those of its subsidiaries, including theirintellectual property. The SVB Facility contains certain financial covenants, and customary affirmative andnegative covenants. If Zhone does not comply with the various covenants and other requirements under the SVB
70

Facility, SVB is entitled, among other things, to require the immediate repayment of all outstanding amounts andto sell Zhone’s assets to satisfy the obligations under the SVB Facility.
(17) Quarterly Information (unaudited)
Year ended December 31, 2010
Q1 Q2 Q3 Q4
(in thousands, except per share data)
Net revenue . . . . . . . . . . . . . . . . . . . . . . . . . . . . . . . . . . . . . . . . . . . . . . . $31,082 $33,255 $33,683 $31,016Gross profit . . . . . . . . . . . . . . . . . . . . . . . . . . . . . . . . . . . . . . . . . . . . . . . 11,317 12,005 13,576 12,274Operating income (loss) . . . . . . . . . . . . . . . . . . . . . . . . . . . . . . . . . . . . . (3,002) (1,584) 1,921 (1,229)Net income (loss) . . . . . . . . . . . . . . . . . . . . . . . . . . . . . . . . . . . . . . . . . . (3,204) (2,002) 1,697 (1,272)Net income (loss) per share
Basic . . . . . . . . . . . . . . . . . . . . . . . . . . . . . . . . . . . . . . . . . . . . . . . . $ (0.11) $ (0.07) $ 0.06 $ (0.04)Diluted . . . . . . . . . . . . . . . . . . . . . . . . . . . . . . . . . . . . . . . . . . . . . . . (0.11) (0.07) 0.05 (0.04)
Weighted-average shares outstandingBasic . . . . . . . . . . . . . . . . . . . . . . . . . . . . . . . . . . . . . . . . . . . . . . . . 30,282 30,343 30,431 30,515Diluted . . . . . . . . . . . . . . . . . . . . . . . . . . . . . . . . . . . . . . . . . . . . . . . 30,282 30,343 31,882 30,515
Year ended December 31, 2009
Q1 Q2 Q3 Q4
(in thousands, except per share data)
Net revenue . . . . . . . . . . . . . . . . . . . . . . . . . . . . . . . . . . . . . . . . . . . . . . . $24,103 $30,346 $36,016 $36,036Gross profit . . . . . . . . . . . . . . . . . . . . . . . . . . . . . . . . . . . . . . . . . . . . . . . 7,813 11,056 12,067 14,459Operating income (loss) . . . . . . . . . . . . . . . . . . . . . . . . . . . . . . . . . . . . . (6,596) (1,954) (894) 751Net income (loss) . . . . . . . . . . . . . . . . . . . . . . . . . . . . . . . . . . . . . . . . . . (6,903) (2,264) (1,204) 344Net income (loss) per share
Basic . . . . . . . . . . . . . . . . . . . . . . . . . . . . . . . . . . . . . . . . . . . . . . . . $ (0.23) $ (0.08) $ (0.04) $ 0.01Diluted . . . . . . . . . . . . . . . . . . . . . . . . . . . . . . . . . . . . . . . . . . . . . . . (0.23) (0.08) (0.04) 0.01
Weighted-average shares outstandingBasic . . . . . . . . . . . . . . . . . . . . . . . . . . . . . . . . . . . . . . . . . . . . . . . . 30,144 30,183 30,222 30,254Diluted . . . . . . . . . . . . . . . . . . . . . . . . . . . . . . . . . . . . . . . . . . . . . . . 30,144 30,183 30,222 32,730
71

REPORT OF INDEPENDENT REGISTERED PUBLIC ACCOUNTING FIRM
The Board of Directors and StockholdersZhone Technologies, Inc.:
We have audited the accompanying consolidated balance sheets of Zhone Technologies, Inc. andsubsidiaries (“the Company”) as of December 31, 2010 and 2009, and the related consolidated statements ofoperations, stockholders’ equity and cash flows for each of the years in the three-year period ended December 31,2010. These consolidated financial statements are the responsibility of the Company’s management. Ourresponsibility is to express an opinion on these consolidated financial statements based on our audits.
We conducted our audits in accordance with the standards of the Public Company Accounting OversightBoard (United States). Those standards require that we plan and perform the audit to obtain reasonable assuranceabout whether the financial statements are free of material misstatement. An audit includes examining, on a testbasis, evidence supporting the amounts and disclosures in the financial statements. An audit also includesassessing the accounting principles used and significant estimates made by management, as well as evaluatingthe overall financial statement presentation. We believe that our audits provide a reasonable basis for ouropinion.
In our opinion, the consolidated financial statements referred to above present fairly, in all material respects,the financial position of Zhone Technologies, Inc. and subsidiaries as of December 31, 2010 and 2009, and theresults of their operations and their cash flows for each of the years in the three-year period ended December 31,2010, in conformity with U.S. generally accepted accounting principles.
/s/ KPMG LLP
San Francisco, CaliforniaMarch 15, 2011
72

INTERNAL CONTROLS OVER FINANCIAL REPORTING
Management’s Annual Report on Internal Control Over Financial Reporting
Our management is responsible for establishing and maintaining adequate internal control over financialreporting to provide reasonable assurance regarding the reliability of our financial reporting and the preparationof financial statements for external purposes in accordance with generally accepted accounting principles.Management assessed the effectiveness of our internal control over financial reporting as of December 31, 2010,the end of our fiscal year. In making this assessment, management used the criteria established by the Committeeof Sponsoring Organizations of the Treadway Commission (COSO) in the report entitled “Internal Control-Integrated Framework.” Based on our assessment of internal control over financial reporting, management hasconcluded that, as of December 31, 2010, our internal control over financial reporting was effective to providereasonable assurance regarding the reliability of financial reporting and the preparation of financial statementsfor external reporting purposes in accordance with generally accepted accounting principles.
Changes in Internal Control Over Financial Reporting
There were no changes in our internal control over financial reporting that occurred during our last fiscalquarter that have materially affected, or are reasonably likely to materially affect, our internal control overfinancial reporting.
Inherent Limitations on Effectiveness of Controls
Our management, including our Chief Executive Officer and Chief Financial Officer, does not expect thatour disclosure controls and procedures or our internal control over financial reporting will prevent or detect allerror and all fraud. A control system, no matter how well designed and operated, can provide only reasonable,not absolute, assurance that the control system’s objectives will be met. The design of a control system mustreflect the fact that there are resource constraints, and the benefits of controls must be considered relative to theircosts. Further, because of the inherent limitations in all control systems, no evaluation of controls can provideabsolute assurance that misstatements due to error or fraud will not occur or that all control issues and instancesof fraud, if any, within the Company have been detected. These inherent limitations include the realities thatjudgments in decision-making can be faulty and that breakdowns can occur because of simple error or mistake.Controls can also be circumvented by the individual acts of some persons, by collusion of two or more people, orby management override of the controls. The design of any system of controls is based in part on certainassumptions about the likelihood of future events, and there can be no assurance that any design will succeed inachieving its stated goals under all potential future conditions. Projections of any evaluation of controlseffectiveness to future periods are subject to risks. Over time, controls may become inadequate because ofchanges in conditions or deterioration in the degree of compliance with policies or procedures.
73

[THIS PAGE INTENTIONALLY LEFT BLANK]

[THIS PAGE INTENTIONALLY LEFT BLANK]

[THIS PAGE INTENTIONALLY LEFT BLANK]

Executive Officers
Morteza EjabatChief Executive Officer, President & Chairman of the Board of Directors
Kirk MisakaChief Financial Officer, Treasurer & Secretary
Board of Directors
Morteza EjabatChief Executive Officer, President & Chairman of the Board of Directors
Lawrence W. Briscoe Former Senior Vice President and Chief Financial Officer of Maxygen, Inc.
Michael Connors Director, The Connors Foundation
Robert Dahl Partner, Riviera Ventures LLP
C. Richard Kramlich General Partner, New Enterprise Associates Nancy PiercePresident and Managing Director of KELD LLC James Timmins Managing Director, Teknos Associates LLC
Senior Management Brian CaskeyChief Marketing Officer
Steve DickVice President, Global Service & Support
Michael FischerVice President, North America Sales
David MisunasVice President, Business Development
Eric PresworskyChief Technology Officer
Bruce RoeVice President, Engineering
Michael ScheckVice President, International Sales
Edward ThompsonVice President, Manufacturing
Corporate Information

Annual MeetingThe 2011 Annual Meeting will be held at Zhone’s headquarters, located at 7195 Oakport Street, Oakland, California 94621 on May 10, 2011 at 10:00 a.m. Pacific Time.
Independent Registered Public Accounting Firm KPMG LLP San Francisco, California
Transfer Agent & Registrar Computershare Investor Services 250 Royall St. Canton, MA 02021 Telephone: 1-312-588-4990 www.computershare.com
Investor RelationsFor investor information, financial information, SEC filings and other useful information, visit our web site at www.zhone.com. The information on our web site does not constitute a part of this annual report.
TO OBTAIN A PRINTED COPY OF OUR FORM 10-K (INCLUDING OUR FINANCIAL STATEMENTS) WITHOUT CHARGE, OR TO RECEIVE ADDITIONAL COPIES OF THIS REPORT OR OTHER FINANCIAL INFORMATION, PLEASE CONTACT OUR INVESTOR RELATIONS DEPARTMENT AT: Zhone Technologies, Inc. Attn: Investor Relations 7195 Oakport Street, Oakland, CA USA 94621 Telephone: +1 510 777 7013 Email: [email protected]
Copyright © 2011 Zhone Technologies, Inc. Zhone, the Zhone logo, and all Zhone product names are trademarks of Zhone Technologies. All rights reserved.
Zhone Technologies, Inc.
7195 Oakport Street Oakland, CA 94621
Phone: 1 510.777.7000 www.zhone.com