Embed Size (px)
Citation preview

i
State Governments as Financiers of Technology Startups:
Implications for Firm Performance
Bo Zhao* Stephen M. Ross School of Business
University of Michigan [email protected]
and
Rosemarie Ziedonis Lundquist College of Business
University of Oregon [email protected]
July 2012
Keywords: innovation; government R&D programs; entrepreneurial finance; regression discontinuity design
__________________________________
* We thank representatives from the Michigan Economic Development Corporation (MEDC) for providing access to archives and for answering our many questions. Financial support from the Ewing Marion Kauffman Foundation is gratefully acknowledged.

ii
State Governments as Financiers of Technology Startups: Implications for Firm Performance
Abstract
U.S. state governments are active financiers of new science and technology companies. Yet little is known about the effects of state R&D funding on the performance of recipient ventures. This study provides new evidence based on competitive R&D awards administered by the state of Michigan from 2002 through 2008. We find strong and compelling evidence that state R&D awards enhanced the commercial viability (i.e., survival) of recipient firms, suggesting a relaxation of financial constraints. Among firms with scores near the discontinuous funding threshold, our estimates suggest that awardees were 15% to 25% more likely to survive three years after the competition than otherwise comparable applicants that sought but failed to receive an award. We also find that receipt of state R&D funding enhanced the follow-on financing for these new ventures, but only for those with more onerous information challenges in entrepreneurial capital markets. Keywords: innovation; government R&D programs; entrepreneurial finance; regression
discontinuity design

1
1. Introduction
Faced with an eroding base of traditional manufacturing industries, U.S. state governments
have assumed a more prominent role as financiers of new science and technology companies. In
2002, for example, Ohio launched a $1.6 billion Ohio Third Frontier (OTF) initiative to support
technology-based economic development within the state. The program is credited with helping
create and finance over 500 Ohio-based companies since its inception (SRI 2009). Also aimed at
stimulating entrepreneurial innovation inside its borders, the state of Utah established a Science
Technology and Research (USTAR) program in 2006. In addition to funding research at Utah-based
universities, USTAR subsidizes the commercialization activities of technology startups within the
state (Duran 2010).
Despite large-scale policy experimentation, little is known about the effects of state
innovation programs on the performance of participating ventures. Relative to federal initiatives in
the United States like the Small Business Investment Research (SBIR) program, information about
state-level R&D programs is fragmented and cumbersome to assemble. Empirical research on this
topic is further plagued by methodological problems. Absent appropriate baselines for comparison,
it is difficult to discern whether state funds causally improve firm performance or whether more
promising companies are simply chosen for awards. Given the pervasiveness of state-level R&D
programs (Coburn and Berglund 1995, Feldman and Lanahan 2010), distinguishing between these
interpretations is vital both from an academic and practical (managerial/public policy) perspective.
This study provides new evidence based on innovation programs launched since 1999 in the
state of Michigan. Like many states in the Great Lakes Region, Michigan has been battered for
decades by declining health in its manufacturing sectors and an outmigration of high-skilled labor
(Samuel 2010). To diversify its tax base and re-kindle economic growth within the state, the
Michigan Life Science Corridor (MLSC) program was launched in 1999 through a $1 billion legal

2
settlement from the tobacco industry. Similar to the later Ohio and Utah initiatives, the MLSC and
its affiliated programs offer R&D financing to startups through a competitive awards process.
To test whether state R&D awards enhance the performance of participating ventures, we
compile a novel database from Michigan government archives on all for-profit participants in
competitions held from 2002 through 2008. Importantly, these data enable us to observe both pre-
treatment characteristics and external reviewer scores for the entire applicant pool, including firms
that sought but failed to receive an award. Also useful from a methodological perspective, these data
reveal discontinuous cut-offs in the distribution of reviewer scores that correspond to receipt of
funding. This artifact of the selections process enables us to use regression discontinuity design
(RDD) methods to compile more comparable sets of participating and non-participating ventures
than is typically possible for innovation scholars. Increasingly common in economics (e.g., Black
1999, Lee and Lemieux 2010), RDD-related approaches remain under-utilized in the strategic
management and entrepreneurial finance literatures.1
The results of our analyses are quite striking. On one hand, we find strong and compelling
evidence that program participation bolstered the commercial viability of Michigan-based
technology companies: funded firms are 15% to 25% more likely to survive 2-3 years after the
competition. The results hold in subsamples of firms proximate to the funding cut-off and do not
appear to be driven purely by the selection of “better” companies for the awards. This evidence is
consistent with the view that the program helped ameliorate imperfections in the market for
entrepreneurial financing: absent R&D awards from the state, companies of comparable quality were
less likely to remain in business.
The effects of program participation on other aspects of entrepreneurial-firm
performance—including patent productivity and receipt of follow-on financing—are more
1 See Kerr et al. (2011) for a recent exception in entrepreneurial finance.

3
ambiguous. Surprisingly, we find no discernable effect of award receipt on patent productivity. Our
analysis reveals, however, that state R&D funding stimulates follow-on financing from other
government (SBIR) and VC sources when capital-market imperfections are more severe. We
interpret this latter evidence as consistent with the view that competition-based R&D awards help
reduce informational inefficiencies in markets for entrepreneurial financing (Lerner 1999; Hall and
Lerner 2010).
This study contributes to three main strands of literature. First, it contributes to a
burgeoning literature in strategic management and economics on the performance implications of
alternative sources of entrepreneurial financing. Prior work has investigated the effects on new
ventures of financial backing from corporations (Katila et al. 2008, Dushnitsky and Shaver 2009,
Park et al. 2012), independent venture capitalists (Hellmann and Puri 2002, Hsu 2004, Fitza et al
2009) and national government agencies (Kortum and Lerner 2000, Brander et al. 2010, Cox and
Katila 2010). The extent to which, if at all, R&D financing from state-government sources affects
new venture performance has received little attention in this literature, a gap that our study helps fill.
Within strategic management, the study also is salient to an ongoing search for ways to tease
apart the consequences associated with non-random actions using observational data, a
methodological challenge that continues to garner widespread attention in the field (Shaver 1998,
Hamilton and Nickerson 2003, Durand and Vaara 2009). Our study not only underscores the
importance of taking into account the underlying selection process, but also illustrates how
discontinuities that result from that process can be fruitfully exploited.
Finally, we contribute to a more targeted line of inquiry on R&D program evaluation (Klette
et al. 2000, Jaffe 2002). Even though governments aim to alleviate sources of market failure through
R&D policy intervention, they often fail to do so due to design and implementation problems
(Wallsten 2000, Lerner 2009). Empirical evidence on this topic nonetheless remains inconclusive and

4
is sparse in state-government contexts. We provide new evidence with an approach that could be
used to evaluate the private returns of other R&D programs, both within the United States and in
other countries. Although providing limited guidance on whether public R&D programs are
justified from a social welfare perspective (see Klette et al. 2000), such evidence would deepen
extant understanding on the extent to which government R&D awards boost the performance of
award recipients above and beyond what otherwise would be predicted.
2. Rationale for Government R&D Awards and Prior Empirical Evidence
Why should governments subsidize R&D projects in the private sector?2 The answer rests
on theoretical concerns about market failure. One concern is that, absent policy intervention, the
private sector will under-invest in R&D relative to socially optimum levels (Griliches, 1992; Hall,
1996; Jaffe, 2002). The output of R&D (“knowledge”) has a public goods component: use by one
firm does not preclude use by another. In the presence of knowledge externalities, or “spillovers,”
the socially optimal rate of R&D investment can exceed the private returns to such investments.
A second and related concern is that capital markets function imperfectly, further eroding
R&D incentives in the private sector (Hall and Lerner, 2010). For young science and technology
companies, the development and commercialization of new products typically requires financial
backing from third parties. Discerning the value and commercial promise of embryonic technologies
nonetheless can be difficult for outsiders. As Hall and Lerner (2010) point out, when investors find
it challenging to sort good projects from bad due to imperfect information, financial backing can be
more costly or difficult to secure. If financial intermediaries like banks, angel investors, and venture
capitalists are unable to fully mitigate this problem, entrepreneurs may be unable to secure sufficient
capital through market mechanisms alone (Lerner & Kegler 2000).
2 In addition to allocating R&D funds directly to companies, governments can reduce the costs of industrial R&D through tax-based incentives. Wilson (2009) and Hall and Lerner (2010) discuss alternative policy levers used to stimulate innovation in the private sector and key trade-offs among them.

5
In addition, state governments pursue more parochial interests: to stimulate economic
growth inside geographic borders and to diversify the tax base (Acs et al. 2008). Not surprisingly,
eligibility in state-run R&D and commercialization programs is therefore restricted to companies
with headquarters or major R&D facilities within the state. A more specific concern is that
entrepreneurs within the state may find it difficult to secure “expansion” capital without re-locating
to a major hub of venture capital activity. Despite syndicated deals through investor networks, the
U.S. venture capital (VC) industry remains tightly agglomerated in the bicoastal states of California
and Massachusetts (Sorenson and Stuart 2001). From 1995-2009, for example, only 25.7 percent of
biomedical research dollars from the National Institutes of Health (NIH) flowed to California and
Massachusetts-based institutions. That same year, however, over 55.9 percent of U.S. venture capital
to biomedical startups originated from these two states.3 To facilitate interactions with entrepreneurs
and to lower monitoring costs, venture capitalists typically require portfolio companies to locate key
operations and personnel nearby, including top managers and core development teams (Chen et al.
2010). By providing entrepreneurs with an alternative source of R&D financing, state governments
may be able to retain more promising ventures and, in doing so, stimulate the development of an
indigenous investment community.
Empirical evidence on the “treatment” effects of government R&D funding on participating
(versus non-participating) remains largely based on national programs. Within the United States
context, the SBIR program and a similar subsidy-based Advanced Technology Project (ATP)
initiative have received the lion’s share of analytical attention.4 Even then, prior studies fail to reach
consensus on the effects of these long-standing programs on participant-firm performance.
3 Authors’ calculations based on NIH and VentureXpert data. 4 Lerner (2009) and Brander et al. (2010) review the evidence from national programs outside the United States. For brevity, we restrict attention below to evidence on U.S.-based programs.

6
Consider evidence from the SBIR program. Comparing SBIR awardees with matched
samples of entrepreneurial companies, Lerner (1999) finds that SBIR recipients are more successful
in securing follow-on VC financing relative to non-recipients. This evidence is consistent with the
view that winning a public R&D awards can help “certify” the quality of new technology companies
to outside investors, thus reducing information problems in markets for entrepreneurial financing.
(Feldman and Kelley (2003) report a similar “halo” effect in the ATP program.) Based on survey
evidence, Audretsch et al. (2002) further suggest that SBIR awards enable the commercialization of
research that would not have been undertaken absent policy intervention.
Wallsten (2000) and Cox and Katilla (2010) offer a less sanguine view of the relationship
between SBIR funding and new venture performance. Taking into account the SBIR selection
process, Wallsten (2000) fails to discern that the awards stimulate employment growth among young
companies, an effect attributed to the “cherry-picking” of more-promising applicants for the awards.
More troublesome, Wallsten suggests that the SBIR program fails to address capital-market
imperfections, crowding out R&D funds from private sources on a dollar-for-dollar basis. Also
troublesome, Cox and Katila (2010) suggest that SBIR funding undermines the innovative and
commercial productivity of technology ventures, based on comparisons between VC-backed
companies that did (versus did not) receive such awards. As mentioned earlier, systematic evidence
on the performance implications of state-government programs remains lacking.
3. Michigan’s Innovation Programs5
3.1 Overview
To investigate the effects of state-government R&D funding on new-venture performance,
we focus on three innovation programs introduced since 1999 in Michigan, a state that houses top-
5 This section draws on conversations with program managers during 2010-2011, annual Battelle/BIO State Bioscience Initiatives reports, archived minutes from Michigan Strategic Fund Board meetings, and government reports (e.g., MEDC 2010).

7
tier medical and research institutions despite well-known challenges in traditional manufacturing
industries (Samuel 2010). The Michigan Life Science Corridor was the state’s first large-scale
innovation program. When the program was announced in 1999, its billion-dollar size was
unprecedented among state R&D initiatives at the time. The MLSC aimed to position Michigan
among the top five U.S. states in the life science sector within twenty years, in part by stimulating a
more vibrant base of entrepreneurial companies. The annual budget anticipated for the program
was $50 million, much of which was initially directed toward university research.
After gubernatorial turnover and lobbying from non-life-science industries, the MLSC was
modified in 2004 to include alternative energy, advanced automotive technologies, and homeland
security. Reflecting this shift, the program was renamed the Michigan Technology Tri-corridor
(MTTC). Soon thereafter, the MLSC and MTTC activities were subsumed under a new 21st Century
Jobs Fund (21CJF) program. From 2000 through 2003, the total program budget ranged from $32
to $50 million per year. In the ensuing years, annual budgets fluctuated from $10 million in 2004-
2005 and $200 million in 2006-2007, to $75 million in 2008.
Under this umbrella of programs, Michigan-based companies could apply for R&D awards
to help defray product development and commercialization expenses in eligible sectors, with
preference given to young and small companies. Relative to other sources of government R&D
funds for technology ventures, the sums available from the state are non-trivial. As shown in Figure
1, the mean award per firm was $600,000 in 2002 and exceeded $1.5 million in the 2006 and 2008
competitions. By comparison, SBIR technology development and commercialization awards in this
period averaged around $500,000 but included a per-firm limit of $1 million (Wessner, 2007).6
6 Statistics are based “Phase II” SBIR awards administered through the National Science Foundation. As Wessner (2007) reports, the Small Business Administration (SBA) increased the per-firm limit of SBIR Phase II grants from $750,000 to $1 million in 2003.

8
Across all incarnations of Michigan’s innovation programs—from the MLSC and MTTC to
the ongoing 21st Century Jobs Fund—one agency was responsible for overseeing and managing the
state’s R&D awards to for-profit companies. This quasi-governmental agency, the Michigan
Economic Development Corporation (MEDC), is responsible for economic development in the
state. According to MEDC officials, state R&D awards are typically structured as repayable debt or
“convertible loans” that can switch to equity if certain milestones are met.7 Although contract terms
are confidential, program managers report that loans are offered at competitive rates and typically
allow firms to defer payment for a two-to-three year period. Program managers saw some
advantages of this financial instrument over pure loans, which have limited upside potential, and
grants, which as subsidies offer less means for accountability and are more difficult to “sell”
politically.
In addition to awarding R&D funds to technology startups, the state of Michigan plays a
more passive role in entrepreneurial capital markets through its “fund-of-funds” program. In this
initiative, the state invests in venture capital funds that support Michigan-based companies in hopes
of increasing the supply of expansion capital within the state. The state has sponsored two such
funds to date, one in 2006 with $95 million and another in 2011 with $120 million.8 Unfortunately it
is premature to assess the impact of these fund-of-fund investments, either overall or relative to
direct models of R&D financing. We therefore restrict attention below to R&D awards directly
allocated to technology startups through the combined set of MLSC, MTTC and 21CJF programs.
3.2. The Selection Process
To receive R&D funding from the state, entrepreneurs must submit an application through a
competitive awards process. As depicted in Figure 2, proposals are first screened for Request for 7 Both parties must agree to the conversion. From an entrepreneur’s perspective, the conversion trades off loan repayment with the sale of private equity in the company. See Lerner (2009) for more detailed discussion of alternative financing vehicles. 8 For more information, see http://www.venturemichigan.com (last visited Jan 03, 2012).

9
Proposal (RFP) compliance. All proposals that meet the RFP requirements proceed through a
competitive evaluation and review process. In Round 1, proposals are sent to an external panel of
peer reviewers for evaluation and scoring.9 The proposals are scored based on four equal-weighted
criteria specified in the RFP: (1) Scientific Merit, (2) Personnel expertise, (3) Commercialization
Merit and (4) Ability to Leverage Additional Funds. Based on Round 1 scores, top-ranked proposals
are invited to proceed to Round 2. Lower-ranked proposals are omitted from consideration.
In Round 2, additional input is gleaned from interviews with representatives from applicant
companies and proposals are re-scored based on the RFP criteria. Following this second evaluation,
the external review panel recommends proposals for funding and provides the state information
about each proposal’s ranking, score, and budget. A governing board, the Strategic Economic
Investment and Commercialization (SEIC) Board, then selects the highest-ranked projects
recommended for funding until the total budget allocated for the competition is expended.
According to MEDC officials, the total budget amount for a competition round is largely pre-
determined prior to a solicitation for proposals. Funding decisions are final and not subject to appeal.
The final stage is “due diligence” and contract negotiation. At this stage, projects can be
dropped for two main reasons. First, the state may choose to rescind an award if new information
revealed through due diligence renders an applicant ineligible (e.g., financial commitments from
third parties have fallen through). Alternatively, the applicant may choose to withdraw from
consideration due to concerns about the terms or cost of financing or unrelated reasons (e.g., a shift
in corporate priorities).
Of the 273 entrepreneurial-firm proposals in our estimation sample described below, roughly
half (49%) were screened out in Round 1 of the selection process while the remainder (51%)
9 From 2002 through 2006, technical experts from the American Association for the Advancement of Science (AAAS) evaluated the proposals. In 2008, the review process was altered to include individuals with business and/or entrepreneurial investment experience.

10
proceeded to Round 2. Of those invited to Round 2, less than half (46%) received R&D funds. In
total, 23% of all entrepreneurial-firm applicants from 2002 through 2008 received financial
assistance through these state-run R&D programs.10
4. Data
4.1. Sample Construction
Applicants for R&D financing through Michigan’s competition-based programs were
identified with archival data from the Michigan Economic Development Corporation. For each
proposal, these data report information about the principle investigator (name, title, department),
organization (name, address), project type (applied research or commercialization), industry sector,
and funds requested. In addition, these data reveal project-specific information generated during the
evaluation process, including external reviewer scores, stage of advancement through the
competition, and how much funding was recommended and dispersed, if any.
To identify “entrepreneurial-firm” applicants, we first restricted attention to proposals from
for-profit companies, thus omitting awards to universities and non-profits. Based on a state business
registry (described below), we then identified the founding years of for-profit applicants and selected
the subset that were 15 years or younger as of the application year.11 This age filter eliminated 23
older firms from the estimation sample, but retained 92 percent of all for-profit applicants. As a
robustness check, we re-ran the regressions below with the entire company-applicant sample and
obtained similar results.
10 In contrast, Wessner (2007, p. 55) reports NSF acceptance rates of SBIR proposals between 40 and 60 percent from 1997 through 2005. For the federal ATP initiative, Feldman and Kelley (2003, p. 155) document that “fewer than 20 percent of proposed projects [submitted between 1990 and 1999] actually receive funding” 1990 and 1999.” 11 Hellmann and Puri (2002) define “startups” as firms less than 11 years old while Stuart et al. (1999) report that the maximum age of venture-backed biotechnology firms with IPOs in the 1980s to mid-1990s is 12 years since founding. Since our data span the decade of the 2000s, a period that includes a prolonged and severe economic downturn, we prefer a less restrictive 15-year threshold.

11
Finally, thirteen (13) firms filed multiple applications in a given round of competition. If a
firm with multiple applications received R&D funds in a single round, we omitted unfunded
proposals of the company from the control-group sample. For non-winners with multiple
submissions, we retained only the applicant’s top-ranked proposal in the control group to yield
greater comparability with the awardee sample.
In combination, these criteria resulted in 273 applications filed by 233 entrepreneurial firms
from 2002 through 2008.
4.2. Startup Characteristics and Outcome Variables
Empirical studies on entrepreneurial firms face notorious data-collection challenges. Unlike
older and publicly traded companies, information about entrepreneurial firms is more scattered and
difficult to obtain. In light of this challenge, we integrate data from multiple sources. Key sources
include the MEDC archives (for applicant-level information and reviewer scores), the Michigan
Department of Licensing and Regulatory Affairs database (for commercial viability), VenturXpert
(for follow-on VC financing), SBIR awardee lists (for SBIR awards), Delphion (for successful
applications of U.S. patents). We supplement these data with searches of company websites, press
releases, and news articles as needed.
Information from these sources is used to compile three time-varying indicators of new
venture performance: (1) whether the firm remains in business (i.e., “survives”) by time t; (2) its
ability to secure financing from other third parties; and (3) its productivity in generating patents.
Unfortunately, we lack reliable firm-level data on annual R&D expenditures and employment
growth.
Our first outcome variable, Survival, is based on the “current status” of companies listed in
the Michigan Department of Licensing and Regulatory Affairs (LARA) database. Five main status
types are listed: (1) active; (2) active but not in good standing; (3) dissolved; (4) withdrawn; and (5)

12
merged. Fortunately, the database also indicates the date on which a firm switches type (if at all). For
firms listed in categories other than “active,” we conducted supplemental searches of company
websites and press release. This process helps ensure that a “dissolved” or “withdrawn” status does
not simply reflect movement from the state or a re-organization via merger or acquisition. In
ambiguous cases, we called the company to determine whether it was still in business. The LARA
database also reports incorporation dates for Michigan-based companies, which we used to
determine the ages of applicant-firms in our sample.
A second outcome variable pertains to follow-on financing, and is used to test the
“certification” hypothesis (Lerner 1999; Wallsten 2000)—that winning a competitive R&D award
casts a positive signal to other investors, thus making it easier to attract other sources of financing.
Young science and technology companies seek financial capital from numerous sources. Prominent
among those capital sources are grants from the SBIR and investments from VCs. To identify SBIR
awards to applicant-companies, we searched the Small Business Administration (SBA) TECH-Net
database by company names, using company locations to ensure a match. We then compiled the
number of SBA awards to each applicant company, including both Phrase I and Phrase II awards.
For VC investments, we conducted similar searches of VentureXpert, a venture capital database
commonly used in empirical research (e.g., Dushnitsky and Lenox 2005, Park and Steensma 2012),
company websites, and Zephyr, which includes news articles about VC deals since 1997. Since
funding amounts were sparsely reported, our proxy for follow-on VC financing is based on the
number of VC investment rounds (if any) listed for each firm.
A third outcome variable, Patent Productivity, captures whether state R&D funding enhances
the innovative productivity of participating firms. Although an imperfect measure of innovative
output, patent counts capture the extent to which these startups succeed in producing novel and
patent-worthy inventions from their R&D activities. By searching company names in the Delphion

13
database, we assemble all U.S. patents awarded to these companies through 2010. The annual patent
productivity of each company is based on the dates that issued patents are filed rather than granted,
as is conventional practice in the literature.
Table 1 reports summary statistics for the entrepreneurial applicant-firm sample. On
average, sample firms are quite young in the focal year of competition, at 4 years post-founding. As
expected from the program’s history, the life science sector represents the largest component of the
applicant pool, filing almost half (44%) of all requests for funding. Roughly 19 percent of the
applicants ceased operations due to business failure within three years of the competition year,
which could reflect the liquidity constraints faced by Michigan-based companies in the recessionary
period of the 2000s.
5. Estimation Method
Establishing a causal relationship between state R&D financing and the subsequent
performance of new ventures poses well-known methodological challenges (David et al. 2000; Klette
et al. 2000). In light of that challenge, we employ multiple empirical approaches and estimation
samples. First, we estimate “naïve regressions” that use the entire applicant-pool sample but control
for observable characteristics of the firms pre-treatment. Second, we restrict attention to more
comparable applicants that proceed to the second round of the competition and use external
reviewer scores to further control for unobservable characteristics of firms insufficiently captured by
covariates in our regressions. In a final set of analyses, we use regression discontinuity design (RDD)
methods to estimate effects with subsets of firms proximate to the cut-off in scores that determine
the allocation of funding. Intuitively, we assume that omitted variable problems fall as more
restrictions are imposed upon the sample. The trade-off, of course, is that the corresponding decline

14
in sample sizes could reduce estimation precision. We therefore report results using multiple
methods and samples and assess patterns among them.
5.1. Controlling for Observables
Equation (1) represents our baseline model:
Φ (1)
is the outcome variable of applicant i in subsequent period t+1. is a binary
variable that indicates whether the company was funded (1=funded; else=0). is a vector of
applicant-level covariates that include the age of the firm in the competition year, the industrial sector,
the application category (applied research vs. commercialization project), and competition-year fixed
effects. Controlling for these observable firm-level characteristics, we estimate effects with the entire
pool of entrepreneurial-firm applicants, including firms that sought but failed to receive an award.
When the dependent variable is a binary variable such as an indicator of survival,
where 1| and is the binary indicator, we use probit estimation with robust
standard errors. Marginal effects are reported for ease of interpretation. When the dependent variable
is a count (i.e., number of SBA awards, patents, or VC investments), we use a Poisson quasi-
maximum likelihood estimator, again with robust standard errors. As Gourieroux et al. (1984) and
Santos Silva and Tenreyo (2006) report, Poisson QMLE outperforms OLS in terms of fit and
robustness when dependent variables are non-negative and skewed.
5.2. Using scores as proxies for unobservable firm-level characteristics
Refining the “naïve” (control for observables-only) regressions, we restrict attention to more
comparable Round 2 applicants and use the scores assigned by external reviewers to control for
unobservable firm-level characteristics omitted from equation (1) that may otherwise affect applicant
performance. More specifically, we select Round 2-only firms and define cutoff as the score

15
above which companies are recommended for funding. We then subtract the cutoff from the
second-round score of company i in application category j in year t, defined as . This process
yields a normalized score for each applicant, defined as = - . To make the variable more
flexible in a parametric estimation, we add a smooth quadratic function of the normalized score to
equation (1) and estimate the following equation:
Φ (2)
5.3. Estimation near the discontinuity border
Our final approach exploits the discontinuous breakpoint between external reviewer scores
and funding probabilities more fully by invoking regression discontinuity design (RDD) methods
widely used in labor and education economics (Lee & Lemieux 2010). Black et al. (2007), for
example, use discontinuities in treatment status to evaluate the effects of government training
services on individuals in search of re-employment. Implementing RDD in an instrumental variable
framework, Jacob and Lefgren (2004) test the causal effects of educational remedial programs on the
scholastic achievement of students. A separate body of research, more closely related to this study,
uses RDD methods to discern how government R&D grants affect the career trajectories and
productivity of individual scientists (Carter et al. 1987, Arora and Gambardella 2005, Chudnovsky et
al. 2008, Ubfal and Maffioli, 2011).
Intuitively, RDD methods compare the performance of companies that lie slightly above a
discontinuity border with that of entities falling slightly below that border. In doing so, scholars
assume that companies within certain bandwidths of the cut-off border are more similar to one
another than they are to firms located at more distant points in the distribution (Lee & Lemieux
2010). Similarly, we assume that two companies with normalized scores of +50 and -50 (i.e., positive

16
and negative outliers) are less comparable than two companies with normalized scores of +1 and -1,
where both firms have scores close to the funding breakpoint.
To infer causality using RDD methods in this setting, three assumptions must be met: (1)
the cut-off score cannot be pre-determined and subject to manipulation by applicants; (2) the
relationship between the score and the probability of funding must be non-linear (i.e., a breakpoint
must exist); (3) applicant characteristics (both observed and unobserved) must be comparable in the
cutoff region (Lee & Lemieux 2010).
As discussed earlier, an independent panel of external reviewers scores each funding
proposal. The cut-off score is unknown to applicants in advance and can change across
competitions: it is largely driven by the total funds allocated to a competition in advance of
solicitations for proposals and the amount of funds requested by high-ranked submissions.
Therefore, assumption (1) is satisfied.
Figure 3a and 3b suggest that assumption (2) is satisfied: the probability of receiving state
R&D funding shifts discontinuously with external reviewer scores. Figure 3a is a lowess smoother
with bandwidth 0.8. Figure 3b plots the mean of the binary variable “funded” over constant 10-unit
intervals. Both figures reveal a visible and discontinuous pattern.
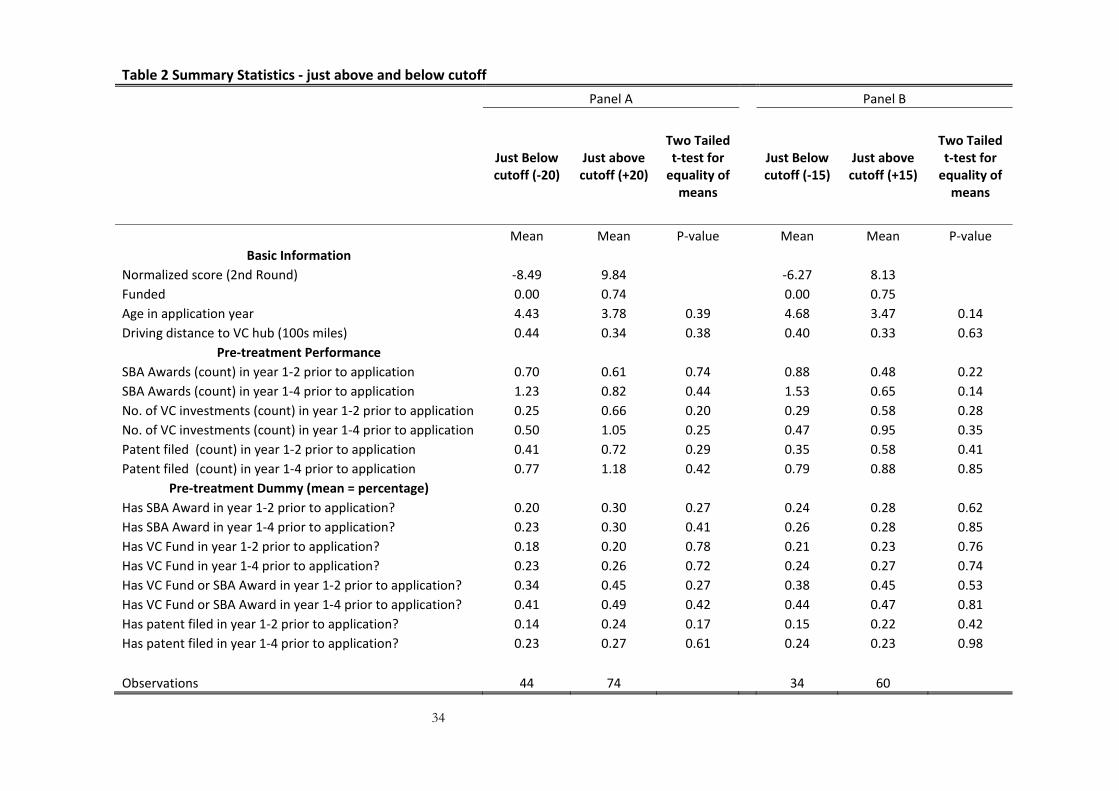
Table 2 evaluates the comparability of firms just below and above the discontinuity border
based on observable characteristics. Panel A of Table 2 reports mean values of applicant
characteristics within 20-points of the discontinuous cutoff. Panel B reports similar statistics for the
narrower 15-point bandwidth. Based on two-tailed t tests, the average pre-treatment characteristics
of the groups are statistically indistinguishable in both panels. Despite the evidence in Table 2, it is
possible of course that firms near the funding cutoff differ in unobserved ways likely to affect future
performance. Lacking a direct test, we must assume that this latter requirement—of comparability in
unobserved traits—is met (Lee & Lemieux 2010).

17
6. Findings
To what extent, if at all, does receipt of state R&D financing improve the performance of
technology startups? Does state R&D financing help mitigate imperfections in entrepreneurial
capital markets? To shed empirical light on these questions, we present three sets of analyses that
correspond to each outcome variable. The first set estimates the effects of state R&D awards on a
crucial outcome variable for young technology companies: survival. A second set tests for
“certification” effects on follow-on financing, both for SBA awards and VC investments. A final set
tests whether state R&D financing bolsters the patent productivity of new ventures.
6.1. Effects on firm survival
Table 3 reports regression estimates of equations (1) and (2) with two time-periods of
survival and the four applicant-firm samples discussed above. The dependent variable in Panel A
and B is a binary indicator of whether an applicant is active (i.e., not in poor standing or disbanded)
2 and 3 years after the competition respectively. All regressions include year, industry sector and
project category dummies as control variables. For the Round 2 sample (Cols. 2 and 6), normalized
applicant scores also are included to control for omitted firm-specific characteristics.
The results in Table 3 are quite striking. Regardless of the survival period or estimation
sample, applicants that receive state R&D financing are significantly more likely to survive than
those that do not. Importantly, we find no evidence that this result is a simple artifact of the
selection process. Even after the sample is narrowed to more comparable sets of firms (Round 2-
only, and those proximate to the funding cutoff), Table 3 suggests that awardees are 18% to 26%
more likely to survive 2-3 years following the competition than firms seeking but failing to receive
such awards. The results are robust to the exclusion of 27 applicants with merger/acquisition exits,
and to use of a 4-year survival period that implicitly drops the 2008 cohort.

18
We interpret this evidence as consistent with the view that state R&D financing relaxed the
financial constraints for these companies: absent R&D funds from the state, otherwise-comparable
companies were less likely to remain in business.
6.2. Effects on follow-on financing
A second set of analyses tests the “certification hypothesis” that, by certifying new venture
quality, state R&D awards reduce informational problems in markets for entrepreneurial capital and
thereby stimulate the subsequent financing activities of young companies (Lerner 1999, Feldman and
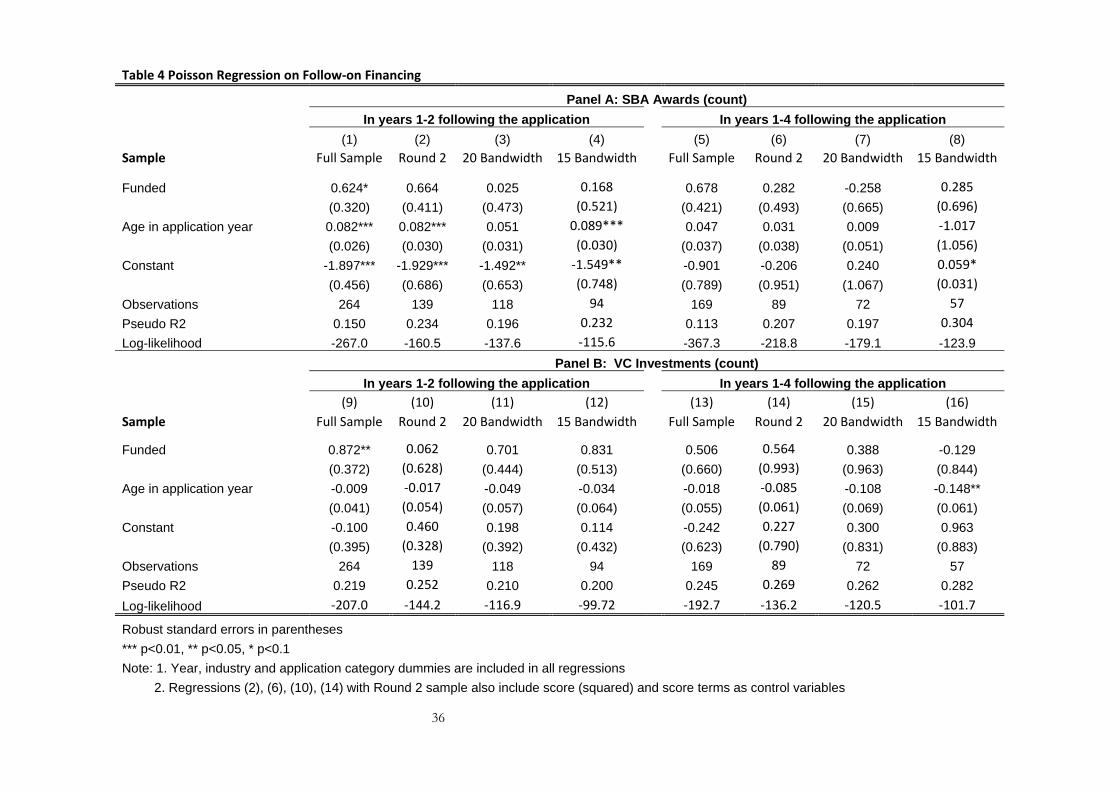
Kenney 2003). Table 4 reports the estimated effect of state R&D awards on follow-on financing
from SBA and VC sources. Tables 5 and 6 test for heterogeneous effects within the sample: If state
R&D awards certify quality to external capital providers, their effects should be more pronounced
for startups with greater informational challenges in such markets.
Turning first to Columns (1) and (9) of Table 4 and the full entrepreneurial-applicant sample,
the estimates suggest that funded startups receive significantly more SBA awards and VC
investments in the two years following the competition. Columns (5) and (13) of Table 4 reveal,
however, that the Funded coefficient is no longer significant at conventional levels in the longer 4-
year post-competition-year window. Although suggestive of a short-term certification effect, this
result could be due to the process used to select applicants for funding. As noted earlier, the ability
to secure third-party financial commitments is among the criteria used in the selection process.
To disentangle certification from a potential “cherry-picking” effect, Table 4 restricts the
sample to more comparable subsets of Round 2-only firms (in Cols. 2, 6, 10, and 14) and those near
the discontinuity border in the remaining columns. Once the estimation sample is restricted to more
comparable firms, we fail to discern a significant effect of the awards on follow-on financing
activities from either government/SBA (Panel A) or private/VC (Panel B) sources. We therefore
interpret the evidence in Table 4 as more consistent with the “cherry-picking” of firms with greater

19
financing prospects for the awards than a causal relationship between award receipt and follow-on
financing for the average company.
If state R&D awards reduce informational problems in entrepreneurial capital markets (via
certification), however, we should expect heterogeneous treatment effects within the sample. More
specifically, the awards should “matter more” to new ventures facing wider the information gaps
with potential capital providers.
To test the certification hypothesis more fully, we therefore identify three sources of firm-
level variation likely to correlate with information asymmetry levels within the context of our study.
Absent R&D financing from the state, startups with prior VC-backing or SBA awards should be
better able than their unfunded counterparts to convey quality to external capital providers. If state
R&D awards serve a quality-certification function, we therefore should expect their effects on
follow-on financing to be more pronounced among startups lacking prior VC-backing or SBA
awards. Similarly, the awards should be especially important for younger (versus older) startups
given the relative lack of observable track records with which to convey performance-potential.
On a related point, Sorenson and Stuart (2001) and others suggest that (a) “hubs” of
entrepreneurial activity house rich information about entrepreneurs and the resources for building
new companies flows and that (b) such information transfers imperfectly across geographic
distances. If true, we should expect less efficient (“thinner”) entrepreneurial capital markets farther
away from hubs of entrepreneurial activity, therefore amplifying the certification value of R&D
awards from the state.
To operationalize this final location-based test, we identify the headquarter location of
applicants from MEDC documents and use VC investments reported in VentureXpert to measure
hubs of entrepreneurial activity within the state. Consistent with patterns reported across U.S. states
(Sorenson and Stuart 2001), VC investments are spatially agglomerated within Michigan—with a

20
dominant cluster near Ann Arbor, where the University of Michigan and most Michigan-based VCs
are based. We therefore define Driving Distance to VC hub as the number of miles (in 100s) between
Ann Arbor and each headquarter location. As a robustness check, we categorize the VC hub as the
greater Ann Arbor-Detroit Metro Area and use of indicator variables (inside/outside VC hub) and
obtain similar findings.
Tables 5 and 6 report results that sequentially interact Funded with the three variables
discussed above: (1) Has Prior VC or SBA Award, (2) Startup Age, and (3) Driving Distance to VC Hub.
For simplicity, we show results only for the 2-year period following the competition (t+2) and list
them separately for SBA awards (in Table 5) and follow-on rounds of VC investment (in Table 6).
As before, we use four estimation samples: (a) all entrepreneurial-applicants (i.e., the “full sample”),
(b) Round-2 only firms (using reviewer scores to proxy for unobserved firm characteristics), (c)
firms 20 or fewer points surrounding the normalized funding cutoff, and (d) firms 15 or fewer
normalized points surrounding the funding breakpoint. Naturally, the sample-size shrinks as more
restrictions are added.
To synthesize key findings from Tables 5 and 6, Table 7 reports the estimated conditional
effect of state R&D awards on follow-on financing for our most comparable subsample of firms—
those closest to the funding threshold (i.e., the “15 bandwidth” companies). Standard errors and
confidence intervals are computed with formulas reported in Hilbe (2008), given the non-linearity of
the estimator.
Turning first to Panel A of Table 7, the estimates suggest that receipt of state R&D financing
significantly boosts the predicted levels of follow-on financing for entrepreneurial firms lacking prior
VC-backing or SBA awards: among this subset of relatively disadvantaged companies, awardees
received 11.8 times (=exp(2.47)) more follow-on SBA awards and 4.46 times (=exp(1.49)) more
rounds of VC financing relative to otherwise comparable applicants that sought but failed to receive

21
an award. As depicted in Figure 4a, we fail to discern a significant effect of state R&D awards on the
follow-on financing of applicants with prior VC or SBA funding, suggesting that the marginal effect
of being “certified” by the state is negligible for such companies.
In Panel B of Table 8, we expected to find that the conditional effect of state R&D awards
would grow larger as distance from the VC hub increases. The evidence is only partially supportive
of this view. Similar to the findings in Panel A, Panel B suggests that the “certification” value of
state R&D awards is negligible for startups located in better-developed markets for entrepreneurial
capital (i.e., inside a hub of VC activity). For those located outside the VC hub, however, the
conditional effect of state R&D award on follow-on financing is statistically significant and
increasing in distance—but only for other government (SBA) sources. More specifically, the point
estimates in Panel B of Table 7 suggest that effect of state R&D financing on the securement of
future SBA awards is roughly 5 times (=exp(2.85)/exp(1.21)) larger for firms located 100 miles from
the VC hub than it is for firms located only 50 miles from the hub. Although the magnitude of the
effect also is increasing in distance for follow-on VC financing (reported in the second column of
Table 7, Panel B), the estimated effect is not statistically significant at conventional levels. Figure 4b
plots these effects.
Panel C of Table 7 similarly reveals partial evidence that state R&D awards “matter more” to
the follow-on financing activities of younger companies. Here, however, the effect is statistically
significant for private/VC but not for government/SBA sources. As shown in Figure 4c, state R&D
award significantly boost the number of VC financing otherwise predicted for young firms. The
magnitude of the effect decreases with age, however, and becomes insignificant when the firm is
more than 2 years old.
Although the evidence in Tables 5-7 suggests that the effects of state R&D awards on
follow-on financing can differ markedly for government/SBA and private/VC sources, it is

22
generally consistent with the view that the “certification value” of the awards is higher in the
presence of greater informational imperfections in external markets for entrepreneurial capital.
6.3. Effects on patent productivity
A final set of analyses in Tables 8 investigates the effects of state R&D funding on patent
productivity. Aided by funds from the state, startups should be able to proceed with R&D and
commercialization activities more aggressively than otherwise possible. If true, receipt of state-
government financing should enable awardees to yield more innovative output from their endeavors.
To investigate this potential productivity effects, we test whether receipt of state-government
financing increases the annual production of patented inventions by new ventures.
Table 8 reports the patent productivity estimates using Poisson QMLE methods and the
estimation samples defined earlier. Panel A estimates effects in the 2-year period following the
competition, while Panel B allows for a longer 4-year window. Due to right-sided truncation, use of
the 4-year window in Panel B implicitly removes the 2008 cohort, therefore explaining the drop in
sample size reported.
In Columns (1) and (5) of Table 8, the Funded coefficient is positive predictor of patent
productivity but the effect is statistically indistinguishable from zero. This result is especially
surprising since it is based on the entire applicant pool. As noted earlier, the criteria used to score
proposals include scientific merit. Assuming that such merit correlates with patenting potential, we
should expect a positive and significant Funded coefficient simply as an artifact of the selection
process. We fail, however, to discern this effect. The effect is not driven by differential survival rates
of funded and unfunded companies. As a robustness check, we retained failed companies in the
sample (with post-exit patenting output coded as zero) and obtained similar results. Not surprisingly,
the coefficient on Funded remains statistically insignificant in other columns of Table 8, where the
estimation sample comprises more comparable firms.

23
One explanation for this “non-finding” is measurement error. Small firms often submit
provisional filings a year in advance of formal patent applications, which could make it more
difficult to discern a near-term effect. As a robustness check, we re-estimated effects using the
earliest date associated with each patented invention (including the date of a provisional filings if
any). The results were qualitatively unchanged.
Similarly, it is logical to assume that many applicant-firms are commercializing technologies
from Michigan-based universities. Since universities typically retain title to inventions originating
from their labs, this could impose a downward bias on our patent-based output measures. To
investigate this possibility, we used supplemental information from press releases and news articles
to identify applicants (~36% of the full sample) founded by university faculty or formed to
commercialize university inventions. In supplemental analyses, we find no evidence that this source
of measurement error explains the patent-related non-finding.
A final, more plausible explanation is that the funds allocated by the state are used primarily
to accelerate time-to-market rather than to discover and develop new products. In this event, patent-
based estimates could underestimate the true productivity effects associated with the awards.
Unfortunately, we lack reliable time-to-market indicators with which to investigate this issue further.
6. Discussion and Conclusion
This study investigates whether R&D financing from state-government sources improves the
performance of technology startups. Using novel data on Michigan-based programs, we test for
causal linkages between state R&D financing and new venture performance with multiple outcome
variables and methods, including regression discontinuity design. Increasingly common within the
field of economics (e.g., Black 1999, Lee and Lemieux 2010), RDD methods remain under-utilized
in the strategic management and entrepreneurial finance literatures.

24
We present new and compelling evidence that these state-run R&D awards increased the
commercial viability (i.e., survival) of award recipients relative to startups that sought but failed to
receive such awards. We find little evidence that this survival effect is driven solely by the selection
of “better” companies into awards. Proximate to the funding threshold, recipients and non-
recipients are comparable based on observable pre-treatment characteristics. Nonetheless, state
funding remains a positive and significant predictor of survival among these otherwise-comparable
applicants. This evidence is consistent with the view that public R&D financing helps ameliorate
imperfections in capital markets for entrepreneurial companies: absent R&D financing from the
state, our findings suggest that otherwise comparable ventures were less likely to remain in business.
The effects of state R&D awards on other salient outcomes for technology ventures—the
production of patents and the securement of other third-party financing—are more ambiguous in
the context of this study. Surprisingly, we find no evidence that state funds bolstered the patent
productivity of recipient companies, an effect that could reflect the more applied and
commercialization-focused orientation of the program.
We do, however, find more nuanced effects on follow-on financing. In regressions that
include all applicants in the estimation sample, receipt of state R&D financing correlates with greater
follow-on financing activity in the two-year period following the award, from both public (SBIR)
and private (venture capital) sources. At first blush, this finding appears to confirm the “certification
effect” shown in empirical studies of federal R&D programs (Lerner 1999, Feldman and Kelley
2003): winning public R&D competitions can cast a positive signal that helps attract additional
sources of financing. We show, however that the overall effect dissipates in more comparable pre-
treatment samples. This finding underscores the importance of taking into account potential “cherry
picking” in the provision of entrepreneurial capital, a topic widely discussed in the program

25
evaluation literature (Klette et al. 2000, Wallsten 2000): firms likely to attract other sources of
financing typically receive higher scores and are more likely to receive funding.
More consistent with the view that state R&D awards help certify the value of young
companies to other capital providers, we observe heterogeneous treatment effects within the sample.
In general, we find that state R&D awards “matter more” to the follow-on financing activities of
firms that lack prior VC funding or SBA awards, are younger, and are located farther away from
spatial hubs of entrepreneurial activities. Assuming that these firm-level traits correlate with greater
inefficiencies in securing access to financial resources, this evidence is consistent with the view that
public R&D financing can help ameliorate imperfections that arise in markets for entrepreneurial
financing.
This study is limited in ways that build a natural the stage for further research. Of particular
note, our analysis is based on R&D awards from a single state in the decade of the 2000s, when
technology ventures faced tighter capital constraints than was true in the boom years of the late-
1990s. From a policy perspective, this timing of the Michigan-based programs was fortuitous: it
increased the odds of capital-market imperfections that public monies could help address (Lerner
2009). If similar data were compiled for more longstanding government programs, future studies
could investigate how the magnitude of private-sector outcomes associated with public R&D
financing are altered by macroeconomic conditions.
Future research also could probe more deeply into how the design of public R&D programs
affects outcomes realized by program participations. In this respect, Michigan’s recent switch from a
direct (provision of R&D financing) to an indirect (subsidization of private equity) model of
entrepreneurial financing is particularly intriguing. Understanding the trade-offs of alternative
vehicles for financing entrepreneurial-firm innovation, both within the United States and in other
countries, remains a fruitful avenue for further investigation.

26
Finally, while this study provides evidence on the private returns to state R&D awards,
answers to larger policy-related questions remain unclear: Is it optimal—from a social welfare
perspective—to extend the survival period of new science and technology companies or to enhance
the abilities of such companies to secure funds from other government and private sources? Do
these benefits outweigh the direct and indirect costs of the program? In general, our evidence
suggests that Michigan’s competitive R&D awards involved more than simply “picking winners.” To
investigate whether the intervention was justified from a policy perspective, a host of factors beyond
the scope of our study must be considered.
To conclude, although state governments are active financiers of new science and
technology companies, little is known about their effects on new venture performance. Based on
novel data for Michigan-based innovation programs, we find that state R&D financing increased the
survival prospects of new ventures and helped stimulate the follow-on financing of firms with wider
information gaps in markets for entrepreneurial capital.

27
References:
Acs Z, Glaeser E, Litan R, Fleming L, Goetz SJ, Kerr W, Klepper S, Rosenthal S, Sorenson O, Strange WC. 2008. Entrepreneurship and urban success: Toward a policy consensus. Kauffman Foundation Policy Report
Almus M, Czarnitzki D. 2003. The effects of public R&D subsidies on firms' innovation activities. Journal of Business and Economic Statistics, 21(2): 226-236.
Arora A, Gambardella A. 2005. The impact of NSF support for basic research in economics. Annales D'Économie et de Statistique: 79-80.
Audretsch DB., Link AN, & Scott JT. 2002. Public/private technology partnerships: evaluating SBIR-supported research. Research Policy, 31(1): 145-158.
Black DA, Galdo J, Smith JA. 2007. Evaluating the worker profiling and reemployment services system using a regression discontinuity approach. American Economic Review, 97(2): 104-107.
Busom I. 2000. An empirical evaluation of the effects of R&D subsidies. Economics of Innovation and New Technology, 9(2): 111-148.
Black SE. 1999. Do better schools matter? Parental valuation of elementary education. Quarterly Journal of Economics, 5: 577-599.
Busom I. 2000. An empirical evaluation of the effects of R&D subsidies. Economics of Innovation and New Technology, 9(2): 111-148.
Carter GM, Winkler JD, Biddle-Zehnder AK. 1987. An evaluation of the NIH research career development award: Rand Corporation.
Coburn C, Berglund D. 1995. Partnerships: A Compendium of State and Federal Cooperative Technology Programs. Columbus, OH: Battelle Press.
Cohen WM., Nelson RR, Walsh JP. 2000. Protecting Their Intellectual Assets: Appropriability Conditions and Why U.S. Manufacturing Firms Patent (or Not). NBER working paper 7552
Chudnovsky D, López A, Rossi MA, Ubfal D. 2008. Money for science? The impact of research grants on academic output. Fiscal Studies, 29(1): 75-87.
Cox E, Katila R. 2011. The impact of funding sources on innovation in new firms. Stanford University working paper
David PA, Hall BH, Toole AA. 2000. Is public R&D a complement or substitute for private R&D? A review of the econometric evidence. Research Policy, 29(4-5): 497-529.
Duran R. 2010. Medical device firms share sage advice. Business Expansion Journal, May. http://www.bxjmag.com/bxj/article.asp?magarticle_id=1514 (last viewed on Jan 02, 2012).
Durand, R., & Vaara, E. 2009. Causation, counterfactuals, and competitive advantage. Strategic Management Journal, 30(12): 1245-1264.
Dushnitsky, G., & Lenox, M. J. 2005. When do firms undertake R&D by investing in new ventures? Strategic Management Journal, 26(10): 947-965.
Dushnitsky G, Shaver JM. 2009. Limitations to inter-organizational knowledge acquisition: the paradox of corporate venture capital. Strategic Management Journal 30(10): 1045-1067.
Feldman M, Kelley MR. 2003. Leveraging research and development: Assessing the impact of the US Advanced Technology Program. Small Business Economics, 20(2): 153-165.
Feldman M, Lanahan L. 2010. Silos of small beer - a case study of the efficacy of federal innovation programs in a key midwest regional economy. Center for American Progress.
Feldman M, Lowe N. 2010. Restructuring for resilience: the importance of organizational design. UNC-Chapel Hill working paper.
Fitza, M., Matusik, S. F., & Mosakowski, E. 2009. Do VCs matter? the importance of owners on performance variance in start-up firms. Strategic Management Journal, 30(4): 387-404.
Griliches Z. 1992. The search for R&D spillovers. Scandinavian Journal of Economics 94: 29-47.
28
Gourieroux C, Monfort A, Trognon A. 1984. Pseudo maximum likelihood methods: Applications to poisson models. Econometrica, 52: 701–720.
Hall BH. 1992. Investment and Research and Development at the Firm Level: Does the Source of Financing Matter? National Bureau of Economic Research Working Paper Series, No. 4096.
Hall BH. 1996. The private and social returns to research and development. Technology, R&D, and the Economy, 140: 162.
Hall BH, Lerner J. 2010. The financing of R&D and innovation, in B.H. Hall and N. Rosenberg, eds. Elsevier Handbook of the Economics of Innovation.
Hellmann T, Puri M. 2002. Venture capital and the professionalization of startup firms: empirical evidence. Journal of Finance 57: 169–197.
Hilbe JM. 2008. Brief overview on interpreting count model risk ratios. Addendum to Negative Binomial Regression. Cambridge University Press.
Hochberg Y, Ljungqvist AP, Lu Y. 2007. Whom you know matters: Venture capital networks and investment performance. Journal of Finance 62: 251–301.
Hsu DH. 2004. What do entrepreneurs pay for venture capital affiliation? Journal of Finance 59: 1805–1844.
Imbens GW, JM Wooldridge. 2000. Recent developments in the econometrics of program evaluation. Journal of Economic Literature 47(1): 5-86.
Jacob BA, Lefgren L. 2004. Remedial education and student achievement: A regression-discontinuity analysis. Review of Economics and Statistics, 86(1): 226-244.
Jaffe AB. 2002. Building programme evaluation into the design of public research‐support programmes. Oxford Review of Economic Policy, 18(1): 22-34.
Katila R, Rosenberger JD, Eisenhardt KM. 2008. Swimming with sharks: Technology ventures, defense mechanisms, and corporate relationships. Administrative Science Quarterly 53: 295-332.
Kauko K. 1996. Effectiveness of R & D subsidies -- a sceptical note on the empirical literature. Research Policy, 25(3): 321-323.
Kerr W, Lerner J, Schoar A. forthcoming. The consequences of entrepreneurial finance: Evidence from angel financings. The Review of Financial Studies.
Kerr W, Nanda R. 2010. Financing constraints and entrepreneurship. HBS working paper #10-013. Klette TJ, Møen J, Griliches Z. 2000. Do subsidies to commercial R&D reduce market failures?
Microeconometric evaluation studies. Research Policy, 29(4-5): 471-495. Kortum S, Lerner J. 2000. Assessing the contribution of venture capital to innovation. Rand Journal of
Economics 31: 674-692. Lee DS, Lemieux, T. 2010. Regression discontinuity designs in economics. Journal of Economic
Literature, 48(2): 281-355. Leland HE, Pyle DH. 1977. Information asymmetries, financial structure, and financial
intermediation. The Journal of Finance (May): 371–387. Lerner J. 1999. The government as venture capitalist: The long-run impact of the SBIR program.
Journal of Business, 72(3): 285-318. Lerner J. 2009. Boulevard of broken dreams: Why public efforts to boost entrepreneurship and venture capital have
failed--and what to do about it. Princeton, NJ. Princeton Univ Pr. Lerner J., & Kegler C. 2000. Evaluating the small business innovation research program: A literature
review. The Small Business Innovation Research Program: An Assessment of the Department of Defense Fast Track Initiative: 307-324.
Link AN., & Scott JT 2010. Government as entrepreneur: Evaluating the commercialization success of SBIR projects. Research Policy, 39(5): 589-601.

29
Pages ER, Poole K. 2003. Understanding entrepreneurship as an economic development strategy: a three-state survey. Washington DC: National Commission on Entrepreneurship and the Center for Regional Economic Competitiveness.
Park HD, Steensma HK. 2012. When does corporate venture capital add value for new ventures? Strategic Management Journal 33(1): 1-22.
MEDC. 2010. A foundation for the new Michigan economy. 21st Century Jobs Fund Report. Lansing, MI: Michigan Economic Development Council.
Moore, I., & Garnsey, E. 1993. Funding for innovation in small firms: The role of government. Research Policy, 22(5-6): 507-519.
Samila, S., & Sorenson, O. 2010. Venture capital as a catalyst to commercialization. Research Policy, 39(10): 1348-1360
Samuel FE. 2010. Turning up the heat: how venture capital can help fuel the economic transformation of the Great Lakes Region. Washington, DC: Brookings Institution.
Santos Silva JMC, Tenreyro S. 2006. The log of gravity. Rev. Econom. Statistics. 88(4): 641-658. SRI. 2009. Making an impact: Assessing the benefits of Ohio's investment in technology-based
economic development programs. Stanford Research Institute Report. Stuart TE, Hoang H, Hybels R. 1999. Interorganizational endorsements and the performance of
entrepreneurial ventures. Administrative Science Quarterly 44: 315–349. Ubfal D, Maffioli A. 2011. The impact of funding on research collaboration: Evidence from a
developing country. Research Policy, 40(9): 1269-1279. Wallsten SJ. 2000. The effects of government-industry R&D programs on private R&D: The case of
the small business innovation research program. The RAND Journal of Economics, 31(1): 82-100.
Wessner CW. 2007, ed. The Advanced Technology Program: Assessing outcomes. Washington, DC: National Academy Press.
Wessner CW. 2007, ed. An assessment of the SBIR program at the National Science Foundation. Washington, DC: National Academy Press.
Wilson, DJ. 2009. Beggar thy neighbor? The in-state, out-of-state, and aggregate effects of R&D tax credits. Review of Economics and Statistics, 91(2): 431‐36.

Figure 1
Figure 2
0.
0.
0.
0.
1.
1.
1.
1.
Millions
1: Average
2: The Sele
0
2
4
6
8
1
2
4
6
8
2
2002
Size of ME
ection Proce
2003
EDC Progra
ess (Decisio
2004
30
am Funding
on Tree)
2005
g to Awarde
2006
ees
2008
Mea
Med
n
ian

31
Figure 3a. Effect of Peer Review Score on Probability of Receiving Funds v1: Calculated with Lowess smoother (bandwidth 0.8)
Figure 3b. Effect of Peer Review Score on Probability of Receiving Funds v2: Calculated at mean of binary “funded” variable over constant 10-unit intervals
0.2
.4.6
.81
Fund
ed (Low
ess
smoo
ther)
-100 -50 0 50Normalized Score (round 2)
bandwidth = .8
0.2
.4.6
.81
fund
ed (m
ean
)
-100 -50 0 50Normalized Score (round 2)

Figure 4 4a: Star
4b: Star
4c: Star
12 Dashed
4: Conditio
rtup has (vs
rtup Distan
rtup Age in
d lines indicate
onal Effects
s does not h
nce from VC
Years (App
that the condi
s of State R
have) Prior
C Hub with
plication Ye
itional effect is
32
R&D Award
VC$ or SB
hin the State
ear minus F
s statistically in
d on Follow
A Award
e (in miles)
Founding Y
nsignificant.
w-on Financ
Year)
cing (t+2)12

33
Table 1 Summary Statistics (Full Sample) Variable Obs Mean Std. Dev. Min Max
Basic Information Normalized score (1st Round) 273 ‐4.621 19.591 ‐58.5 32 Normalized score (2nd Round) 138 ‐0.917 17.748 ‐79.5 31 Funded 273 0.216 0.412 0 1 Age in application year 273 4.165 4.024 0 15 Sector = advanced auto 273 0.330 0.471 0 1 Sector = alternative energy 273 0.092 0.289 0 1 Sector = homeland security 273 0.143 0.351 0 1 Sector = life science 273 0.436 0.497 0 1 Application category = applied research project 273 0.183 0.388 0 1 Application category = commercialization project 273 0.817 0.388 0 1
Survival Status Survival in the following year 1‐2 273 0.864 0.343 0 1 Survival in the following year 1‐3 273 0.810 0.393 0 1
SBA Awards SBA awards (count) in year 1‐2 prior to application 273 0.297 0.941 0 7 SBA awards (count) in year 1‐4 prior to application 273 0.487 1.795 0 21 SBA awards (count) in the following year 1‐2 273 0.377 1.179 0 9 SBA awards (count) in the following year 1‐4 190 0.847 2.611 0 15
VC Investment No. of VC investments (count) in year 1‐2 prior to application 273 0.311 1.438 0 14 No. of VC investments (count) in year 1‐4 prior to application 273 0.495 1.743 0 14 No. of VC investments (count) in the following year 1‐2 273 0.326 1.150 0 10 No. of VC investments (count) in the following year 1‐4 190 0.432 1.939 0 19
VC or SBA Investment Has VC Fund or SBA Award in year 1‐2 prior to application? 273 0.242 0.429 0 1 Has VC Fund or SBA Award in year 1‐4 prior to application? 273 0.278 0.449 0 1
Patent Patent filed (count) in year 1‐2 prior to application 273 0.374 1.248 0 8 Patent filed (count) in year 1‐4 prior to application 273 0.685 2.329 0 19 Patent filed (count) in the following year 1‐2 273 0.278 1.139 0 8 Patent filed (count) in the following year 1‐4 190 0.505 1.739 0 12
Geography Driving distance to VC hub (unit = 100 miles) 270 0.456 0.592 0 5.55
34
Table 2 Summary Statistics ‐ just above and below cutoff Panel A Panel B
Just Below cutoff (‐20)
Just above cutoff (+20)
Two Tailed t‐test for equality of means
Just Below cutoff (‐15)
Just above cutoff (+15)
Two Tailed t‐test for equality of means
Mean Mean P‐value Mean Mean P‐value
Basic Information Normalized score (2nd Round) ‐8.49 9.84 ‐6.27 8.13
Funded 0.00 0.74 0.00 0.75
Age in application year 4.43 3.78 0.39 4.68 3.47 0.14
Driving distance to VC hub (100s miles) 0.44 0.34 0.38 0.40 0.33 0.63
Pre‐treatment Performance
SBA Awards (count) in year 1‐2 prior to application 0.70 0.61 0.74 0.88 0.48 0.22
SBA Awards (count) in year 1‐4 prior to application 1.23 0.82 0.44 1.53 0.65 0.14
No. of VC investments (count) in year 1‐2 prior to application 0.25 0.66 0.20 0.29 0.58 0.28
No. of VC investments (count) in year 1‐4 prior to application 0.50 1.05 0.25 0.47 0.95 0.35
Patent filed (count) in year 1‐2 prior to application 0.41 0.72 0.29 0.35 0.58 0.41
Patent filed (count) in year 1‐4 prior to application 0.77 1.18 0.42 0.79 0.88 0.85
Pre‐treatment Dummy (mean = percentage) Has SBA Award in year 1‐2 prior to application? 0.20 0.30 0.27 0.24 0.28 0.62
Has SBA Award in year 1‐4 prior to application? 0.23 0.30 0.41 0.26 0.28 0.85
Has VC Fund in year 1‐2 prior to application? 0.18 0.20 0.78 0.21 0.23 0.76
Has VC Fund in year 1‐4 prior to application? 0.23 0.26 0.72 0.24 0.27 0.74
Has VC Fund or SBA Award in year 1‐2 prior to application? 0.34 0.45 0.27 0.38 0.45 0.53
Has VC Fund or SBA Award in year 1‐4 prior to application? 0.41 0.49 0.42 0.44 0.47 0.81
Has patent filed in year 1‐2 prior to application? 0.14 0.24 0.17 0.15 0.22 0.42
Has patent filed in year 1‐4 prior to application? 0.23 0.27 0.61 0.24 0.23 0.98
Observations 44 74 34 60

35
Table 3 Probit Regression on Survival
Panel A: Survival 2 years after competition
(1) (2) (3) (4)
Sample Full Sample Round 2 20 Bandwidth 15 Bandwidth
Funded 0.151*** 0.183*** 0.143*** 0.259***
(0.026) (0.061) (0.050) (0.076)
Age in application year 0.006 0.014*** 0.010* 0.000
(0.005) (0.005) (0.006) (0.000)
Observations 273 138 110 76
Pseudo R2 0.100 0.263 0.191 0.270
Panel B: Survival 3 years after competition
(5) (6) (7) (8)
Sample Full Sample Round 2 20 Bandwidth 15 Bandwidth
Funded 0.219*** 0.199*** 0.175*** 0.267***
(0.030) (0.061) (0.054) (0.076)
Age in application year 0.007 0.013** 0.009 0.000
(0.006) (0.005) (0.006) (0.000)
Observations 273 138 110 76
Pseudo R2 0.106 0.231 0.187 0.277
Robust standard errors in parentheses
*** p<0.01, ** p<0.05, * p<0.1
Note: 1. Year, industry and application category dummies are included in all regressions
2. Regressions (2) and (6) for round 2 sample also include score (squared) and score terms as control variables.
3. Marginal effects are reported.
36
Table 4 Poisson Regression on Follow‐on Financing
Panel A: SBA Awards (count)
In years 1-2 following the application In years 1-4 following the application
(1) (2) (3) (4) (5) (6) (7) (8)
Sample Full Sample Round 2 20 Bandwidth 15 Bandwidth Full Sample Round 2 20 Bandwidth 15 Bandwidth
Funded 0.624* 0.664 0.025 0.168 0.678 0.282 -0.258 0.285
(0.320) (0.411) (0.473) (0.521) (0.421) (0.493) (0.665) (0.696)
Age in application year 0.082*** 0.082*** 0.051 0.089*** 0.047 0.031 0.009 ‐1.017
(0.026) (0.030) (0.031) (0.030) (0.037) (0.038) (0.051) (1.056)
Constant -1.897*** -1.929*** -1.492** ‐1.549** -0.901 -0.206 0.240 0.059*
(0.456) (0.686) (0.653) (0.748) (0.789) (0.951) (1.067) (0.031)
Observations 264 139 118 94 169 89 72 57
Pseudo R2 0.150 0.234 0.196 0.232 0.113 0.207 0.197 0.304
Log-likelihood -267.0 -160.5 -137.6 ‐115.6 -367.3 -218.8 -179.1 -123.9
Panel B: VC Investments (count)
In years 1-2 following the application In years 1-4 following the application
(9) (10) (11) (12) (13) (14) (15) (16)
Sample Full Sample Round 2 20 Bandwidth 15 Bandwidth Full Sample Round 2 20 Bandwidth 15 Bandwidth
Funded 0.872** 0.062 0.701 0.831 0.506 0.564 0.388 -0.129
(0.372) (0.628) (0.444) (0.513) (0.660) (0.993) (0.963) (0.844)
Age in application year -0.009 ‐0.017 -0.049 -0.034 -0.018 ‐0.085 -0.108 -0.148**
(0.041) (0.054) (0.057) (0.064) (0.055) (0.061) (0.069) (0.061)
Constant -0.100 0.460 0.198 0.114 -0.242 0.227 0.300 0.963
(0.395) (0.328) (0.392) (0.432) (0.623) (0.790) (0.831) (0.883)
Observations 264 139 118 94 169 89 72 57
Pseudo R2 0.219 0.252 0.210 0.200 0.245 0.269 0.262 0.282
Log-likelihood ‐207.0 ‐144.2 ‐116.9 ‐99.72 ‐192.7 ‐136.2 ‐120.5 ‐101.7
Robust standard errors in parentheses
*** p<0.01, ** p<0.05, * p<0.1
Note: 1. Year, industry and application category dummies are included in all regressions
2. Regressions (2), (6), (10), (14) with Round 2 sample also include score (squared) and score terms as control variables

37
Table 5 Poisson Regression on Follow‐on SBA Awards with Interaction Effect (t+2) Sample Full Sample Round 2
(1) (2) (3) (4) (5) (6) (7) (8) Funded 0.624* 1.881*** -0.264 0.751 0.664 2.351*** 0.265 0.468
(0.320) (0.437) (0.352) (0.503) (0.411) (0.688) (0.429) (0.650) Funded * Has Prior VC or SBA Award (prior 1_4) -2.353*** -2.308***
(0.627) (0.775) Has Prior VC or SBA Award (prior 1_4) 1.968*** 1.817***
(0.445) (0.628) Funded * Driving Distance to VC Hub (100s miles) 3.787*** 2.281**
(0.991) (0.983) Driving Distance to VC Hub (100s miles) -3.392*** -2.133**
(0.833) (0.835) Funded*Age in application year -0.022 0.038
(0.063) (0.079) Age in application year 0.082*** 0.046* 0.082*** 0.089** 0.082*** 0.079*** 0.091*** 0.068
(0.026) (0.025) (0.024) (0.035) (0.030) (0.030) (0.035) (0.048) Constant -1.897*** -3.080*** -1.170*** -1.952*** -1.929*** -3.290*** -1.421** -1.837**
(0.456) (0.560) (0.404) (0.526) (0.686) (0.818) (0.642) (0.720) Observations 264 264 262 264 139 139 139 139 Pseudo R2 0.150 0.254 0.246 0.150 0.234 0.306 0.277 0.235 Log-likelihood -267.0 -234.5 -236.0 ‐266.9 -160.5 -145.5 -151.5 -160.3
Sample Above and Below 20 near the discontinuity border Above and Below 15 near the discontinuity border(9) (10) (11) (12) (13) (14) (15) (16)
Funded 0.025 1.429** -0.493 0.020 0.168 2.466** ‐0.431 0.200 (0.473) (0.721) (0.542) (0.747) (0.521) (1.083) (0.549) (0.751)
Funded * Has Prior VC or SBA Award (prior 1_4) -2.010** ‐3.077***
(0.823) (1.117)
Has Prior VC or SBA Award (prior 1_4) 2.125*** 2.994***
(0.688) (1.006)
Funded * Driving Distance to VC Hub (100s miles) 1.993* 3.276**
(1.112) (1.521)
Driving Distance to VC Hub (100s miles) -1.690* ‐2.961**
(0.989) (1.399)Funded*Age in application year 0.001 -0.006
(0.089) (0.073) Age in application year 0.051 0.025 0.052 0.051 0.089*** 0.077** 0.094*** 0.092**
(0.031) (0.035) (0.034) (0.053) (0.030) (0.035) (0.033) (0.046) Constant -1.492** -3.082*** -1.009 -1.490** ‐1.549** ‐3.971*** ‐0.956 -1.561**
(0.653) (0.858) (0.679) (0.696) (0.748) (1.106) (0.704) (0.777) Observations 118 118 118 118 94 94 94 94 Pseudo R2 0.196 0.273 0.226 0.196 0.232 0.344 0.277 0.232 Log-likelihood -137.6 -124.3 -132.5 ‐137.6 -115.6 -98.81 -108.9 -115.6
Robust standard errors in parentheses *** p<0.01, ** p<0.05, * p<0.1 Note: 1. Year, industry and application category dummies are included in all regressions 2. Regressions (5)-(8) based on round 2 sample also include score (squared) and score terms as control variables

38
Table 6 Poisson Regression on Follow‐on VC Investments with Interaction Effect (t+2) Sample Full Sample Round 2
(1) (2) (3) (4) (5) (6) (7) (8) Funded 0.872** 1.741*** 0.446 1.142** 0.062 0.929 ‐0.269 0.345
(0.372) (0.597) (0.508) (0.481) (0.628) (0.802) (0.677) (0.672) Funded * Has Prior VC or SBA Award (prior 1_4) -1.628** -1.215*
(0.725) (0.719) Has Prior VC or SBA Award (prior 1_4) 1.585*** 0.974*
(0.503) (0.537) Funded * Driving Distance to VC Hub (100s miles) 1.151 1.044
(0.837) (0.830) Driving Distance to VC Hub (100s miles) -0.935 -0.668
(0.664) (0.676) Funded*Age in application year -0.084 -0.092
(0.080) (0.081) Age in application year -0.009 -0.044 -0.004 0.013 ‐0.017 -0.032 ‐0.013 0.025
(0.041) (0.045) (0.046) (0.044) (0.054) (0.054) (0.065) (0.058) Constant -0.100 -0.962* 0.211 -0.193 0.460 -0.128 0.662* 0.357
(0.395) (0.521) (0.461) (0.430) (0.328) (0.538) (0.391) (0.352) Observations 264 264 262 264 139 139 139 139 Pseudo R2 0.219 0.270 0.233 0.222 0.252 0.272 0.263 0.256 Log-likelihood ‐207.0 ‐193.3 ‐202.5 ‐206.2 ‐144.2 ‐140.3 ‐142.0 ‐143.5
Sample Above and Below 20 near the discontinuity border Above and Below 15 near the discontinuity border (9) (10) (11) (12) (13) (14) (15) (16)
Funded 0.701 1.048* 0.501 0.806 0.831 1.494** 0.663 1.045* (0.444) (0.600) (0.588) (0.527) (0.513) (0.721) (0.698) (0.547)
Funded * Has Prior VC or SBA Award (prior 1_4) -0.722 -1.320 (0.780) (0.969)
Has Prior VC or SBA Award (prior 1_4) 0.261 0.483 (0.600) (0.671)
Funded * Driving Distance to VC Hub (100s miles) 0.478 0.404 (0.773) (0.966)
Driving Distance to VC Hub (100s miles) -0.156 -0.058 (0.607) (0.732)
Funded*Age in application year -0.038 -0.078 (0.095) (0.106)
Age in application year -0.049 -0.031 -0.035 -0.027 -0.034 0.013 -0.015 0.015 (0.057) (0.053) (0.075) (0.072) (0.064) (0.066) (0.090) (0.089)
Constant 0.198 0.035 0.233 0.145 0.114 -0.248 0.087 -0.002 (0.392) (0.509) (0.486) (0.408) (0.432) (0.557) (0.525) (0.412)
Observations 118 118 118 118 94 94 94 94 Pseudo R2 0.210 0.218 0.213 0.211 0.200 0.221 0.203 0.202
Log-likelihood ‐116.9 ‐115.7 ‐116.4 ‐116.8 ‐99.72 ‐97.02 ‐99.32 ‐99.41
Robust standard errors in parentheses *** p<0.01, ** p<0.05, * p<0.1 Note: 1. Year, industry and application category dummies are included in all regressions 2. Regressions (5)-(8) based on round 2 sample also include score (squared) and score terms as control variables

39
Table 7 Conditional Effect of State R&D Award on Follow‐on Financing, t+2
# SBA Awards # VC Rounds Panel A: Has Prior VC $ or SBA Award?
Yes ‐0.61 0.17
No 2.47** 1.49**
Panel B: Distance from VC Hub None (located in hub city) ‐0.43 0.66
50 miles away 1.21* 0.86
100 miles away 2.85* 1.06
150 miles away 4.48** 1.27
Panel C: Firm Age in Application Year Age = 0 0.2 1.04*
Age = 1 0.19 0.97*
Age = 2 0.19 0.89*
Age = 3 0.18 0.81
Age = 4 0.18 0.73
Note: Estimations are based on sample within 15‐points of the awards cutoff score

40
Table 8 Poisson Regression on Patent Productivity
Panel A: # of Patent filed in years 1-2 following the application
(1) (2) (3) (4)
Sample Full Sample Round 2 20 Bandwidth 15 Bandwidth
Funded 0.414 0.324 -0.193 -0.719
(0.489) (0.742) (0.606) (0.770)
Age in application year 0.071* 0.076 0.057 -0.042
(0.037) (0.050) (0.050) (0.066)
Constant -3.696*** -3.500*** -4.712*** -3.868***
(0.674) (0.951) (1.327) (1.210)
Observations 264 139 118 94
Pseudo R2 0.174 0.231 0.293 0.279
Log-likelihood ‐241.7 ‐156.1 ‐112.7 ‐88.76
Panel B: # of Patent filed in years 1-4 following the application
(5) (6) (7) (8)
Sample Full Sample Round 2 20 Bandwidth 15 Bandwidth
Funded 0.324 0.515 -0.075 -0.775
(0.492) (0.773) (0.642) (0.798)
Age in application year 0.060 0.058 0.038 -0.072
(0.039) (0.055) (0.055) (0.068)
Constant -1.098** -0.373 -0.368 0.576
(0.488) (0.727) (0.791) (0.865)
Observations 169 89 72 57
Pseudo R2 0.132 0.137 0.140 0.134 Log-likelihood ‐280.1 ‐186.8 ‐139.5 ‐106.1
Robust standard errors in parentheses
*** p<0.01, ** p<0.05, * p<0.1
Note: 1. Year, industry, and application category dummies are included in all regressions 2. Regressions (2) and (6) with round 2 sample also include score (squared) and score terms as control variables