Embed Size (px)
Citation preview
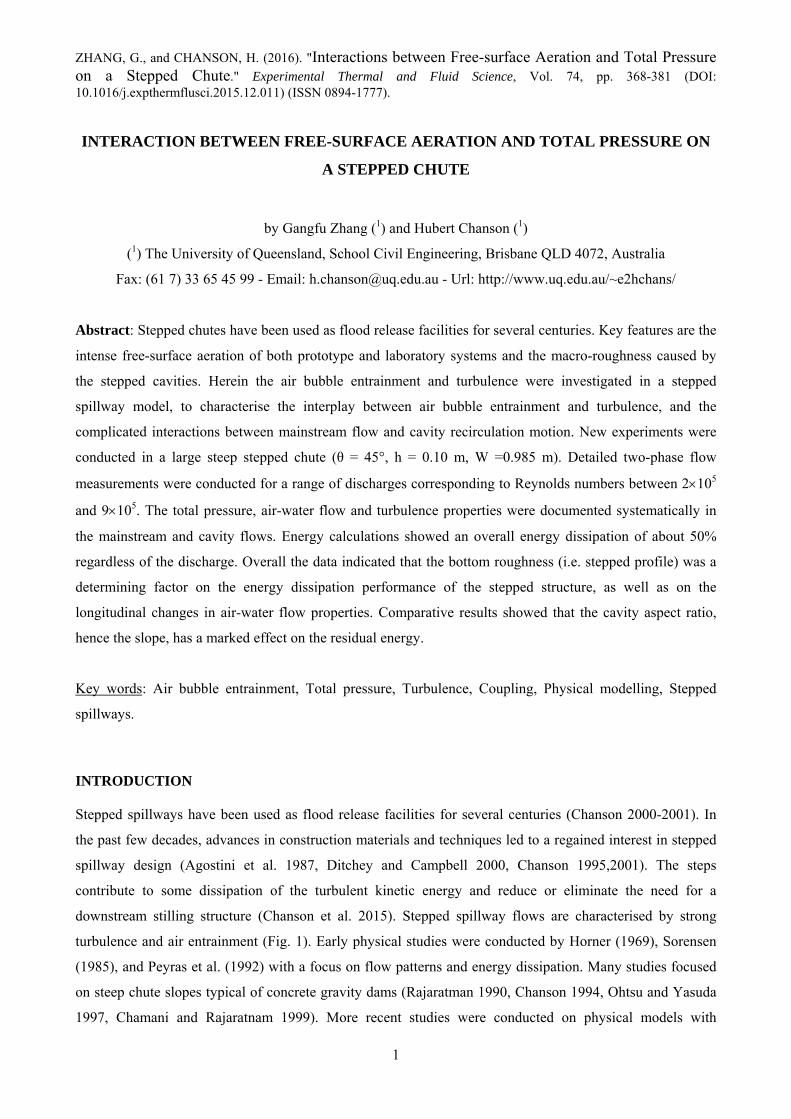
ZHANG, G., and CHANSON, H. (2016). "Interactions between Free-surface Aeration and Total Pressure on a Stepped Chute." Experimental Thermal and Fluid Science, Vol. 74, pp. 368-381 (DOI: 10.1016/j.expthermflusci.2015.12.011) (ISSN 0894-1777).
1
INTERACTION BETWEEN FREE-SURFACE AERATION AND TOTAL PRESSURE ON
A STEPPED CHUTE
by Gangfu Zhang (1) and Hubert Chanson (1)
(1) The University of Queensland, School Civil Engineering, Brisbane QLD 4072, Australia
Fax: (61 7) 33 65 45 99 - Email: [email protected] - Url: http://www.uq.edu.au/~e2hchans/
Abstract: Stepped chutes have been used as flood release facilities for several centuries. Key features are the
intense free-surface aeration of both prototype and laboratory systems and the macro-roughness caused by
the stepped cavities. Herein the air bubble entrainment and turbulence were investigated in a stepped
spillway model, to characterise the interplay between air bubble entrainment and turbulence, and the
complicated interactions between mainstream flow and cavity recirculation motion. New experiments were
conducted in a large steep stepped chute (θ = 45°, h = 0.10 m, W =0.985 m). Detailed two-phase flow
measurements were conducted for a range of discharges corresponding to Reynolds numbers between 2105
and 9105. The total pressure, air-water flow and turbulence properties were documented systematically in
the mainstream and cavity flows. Energy calculations showed an overall energy dissipation of about 50%
regardless of the discharge. Overall the data indicated that the bottom roughness (i.e. stepped profile) was a
determining factor on the energy dissipation performance of the stepped structure, as well as on the
longitudinal changes in air-water flow properties. Comparative results showed that the cavity aspect ratio,
hence the slope, has a marked effect on the residual energy.
Key words: Air bubble entrainment, Total pressure, Turbulence, Coupling, Physical modelling, Stepped
spillways.
INTRODUCTION
Stepped spillways have been used as flood release facilities for several centuries (Chanson 2000-2001). In
the past few decades, advances in construction materials and techniques led to a regained interest in stepped
spillway design (Agostini et al. 1987, Ditchey and Campbell 2000, Chanson 1995,2001). The steps
contribute to some dissipation of the turbulent kinetic energy and reduce or eliminate the need for a
downstream stilling structure (Chanson et al. 2015). Stepped spillway flows are characterised by strong
turbulence and air entrainment (Fig. 1). Early physical studies were conducted by Horner (1969), Sorensen
(1985), and Peyras et al. (1992) with a focus on flow patterns and energy dissipation. Many studies focused
on steep chute slopes typical of concrete gravity dams (Rajaratman 1990, Chanson 1994, Ohtsu and Yasuda
1997, Chamani and Rajaratnam 1999). More recent studies were conducted on physical models with
ZHANG, G., and CHANSON, H. (2016). "Interactions between Free-surface Aeration and Total Pressure on a Stepped Chute." Experimental Thermal and Fluid Science, Vol. 74, pp. 368-381 (DOI: 10.1016/j.expthermflusci.2015.12.011) (ISSN 0894-1777).
2
moderate slopes typical of embankment structures (Ohtsu et al. 2004, Hunt et al. 2008, Felder and Chanson
2009, Bung 2011,2013, Takahashi and Ohtsu 2012, Wuthrich and Chanson 2014).
A key feature of stepped chute flows is the intense free-surface aeration observed in both prototype and
laboratory (Fig. 1 and 2). A number of laboratory studies investigated systematically the air-water flow
properties at step edges (Matos 2000, Chanson and Toombes 2003, Takahashi et al. 2006, Carosi and
Chanson 2008, Bung 2009). A few studies measured the two-phase flow properties inside and above the step
cavities (Gonzalez and Chanson 2004, Felder and Chanson 2011). The stepped cavities act as macro-
roughness, with intense cavity recirculation. To date the findings hinted a strong interplay between air
bubble entrainment and turbulence, and complicated interactions between mainstream flow and cavity
recirculation motion, although no definite conclusion has been drawn in terms of stepped spillway design.
The goal of this contribution is to examine the air bubble entrainment and turbulence in a stepped spillway
model. New experiments were conducted in a large steep chute (θ = 45°) equipped with 12 flat impervious
steps (h = 0.10 m, W =0.985 m). Detailed two-phase flow measurements were conducted for a range of
discharges corresponding to the transition and skimming flow regimes. The total pressure, air-water flow and
turbulence properties in the mainstream and cavity flows were documented systematically. It is the aim of
this work to quantify the interplay between air bubble entrainment, turbulence and energy dissipation.
EXPERIMENTAL FACILITY AND INSTRUMENTATION
New experiments were conducted in a large-size stepped spillway model located at the University of
Queensland (Fig. 2 & 3). The facility consisted of a 12.4 m long channel. Three pumps driven by adjustable
frequency AC motors delivered a controlled discharge to a 5 m wide, 2.7 m wide and 1.7 m deep intake basin
equipped with a carefully designed diffuser, followed by two rows of flow straighteners. The intake basin
was connected to the test section through to a 2.8 m long 5.08:1 sidewall contraction. The entire setup
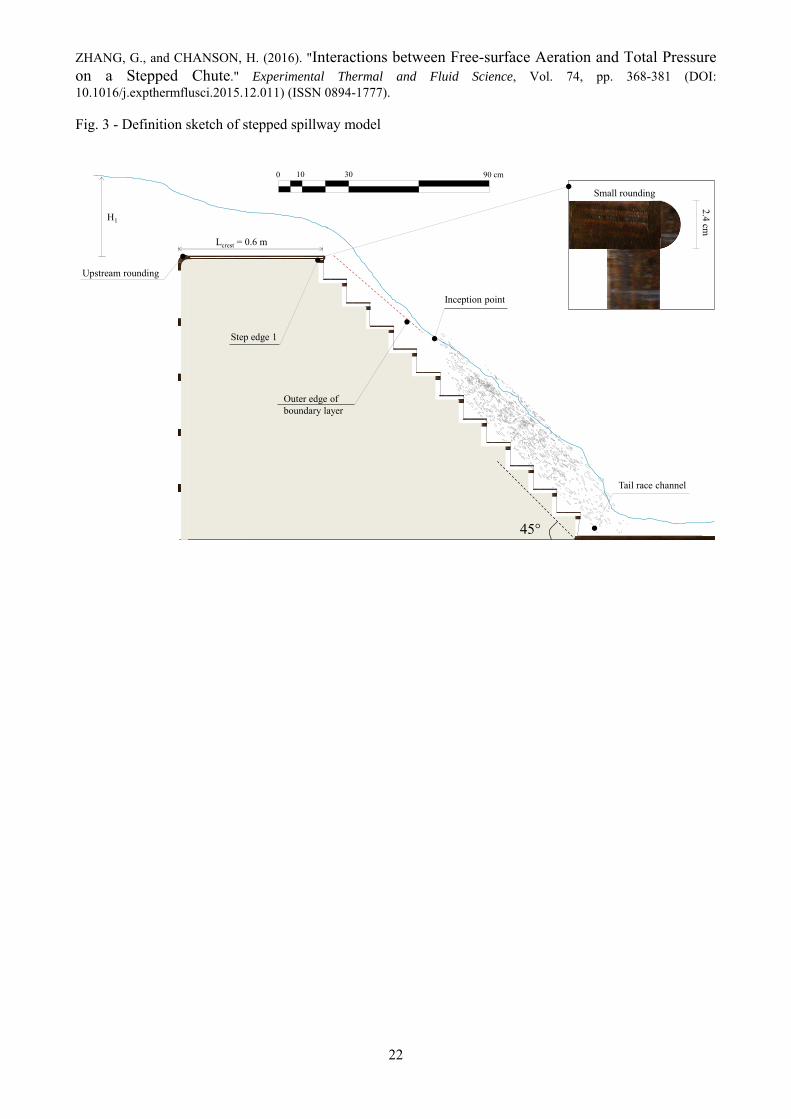
resulted in a smooth and waveless inflow for discharges up to 0.30 m3/s. The stepped chute was controlled
by a broad-crested weir at the upstream end (Fig. 2A). The broad crest was horizontal, 0.6 m long and 0.985
m wide with a vertical upstream wall and an upstream rounded nose (0.058 m radius). During initial tests, the
weir ended with a sharp edge (see below). Later a downstream rounded edge (0.018 m radius) was installed
and all experiments were conducted with the downstream edge rounding. The stepped chute consisted of
twelve 0.1 m high and 0.1 m long smooth flat steps made of plywood (Fig. 2). Each step was 0.985 m wide.
The stepped chute was followed by a horizontal tailrace flume ending into a free overfall.
The discharge was deduced from detailed velocity and pressure measurements above the broad crested weir
using a Dwyer® 166 Series Prandtl-Pitot tube connected to an inclined manometer, giving total head and
piezometric head data (Zhang and Chanson 2015). The results yielded the following relationship between the
discharge per unit width q and the upstream head above crest H1:
ZHANG, G., and CHANSON, H. (2016). "Interactions between Free-surface Aeration and Total Pressure on a Stepped Chute." Experimental Thermal and Fluid Science, Vol. 74, pp. 368-381 (DOI: 10.1016/j.expthermflusci.2015.12.011) (ISSN 0894-1777).
3
3
1crest
1 H3
2g
L
H0.2430.897q
(1)
where g is the gravity constant and Lcrest is the crest length (Lcrest = 0.60 m) (Fig. 3). Clear-water flow depths
were measured with a pointer-gauge on the channel centreline as well as dSLR photography (Canon™
400D) through the sidewalls.
The air-water flow measurements were conducted using a dual-tip phase detection probe developed at the
University of Queensland. The probe was capable of recording rapidly varying air-water interfaces based
upon changes in resistivity and consisted of two identical tips, with an inner diameter of 0.25 mm, separated
longitudinally by a distance x. The longitudinal separation x for each probe was 4.89 mm, 6.50 mm, 8.0
mm, and 8.42 mm.. The probe sensors were excited by an electronic system and the signal output was
recorded at 20 kHz per sensor for 45 s, following previous sensitivity analyses (Toombes 2002, Felder and
Chanson 2015).
The instantaneous total pressure was measured with a MeasureX MRV21 miniature pressure transducer, its
sensor featuring a silicon diaphragm with minimal static and thermal errors. The transducer was custom
designed and measured relative pressures between 0 to 0.15 bars with a precision of 0.5% full scale. The
signal was amplified and low-pass filtered at a cut off frequency of 2 kHz. The total pressure sensor was
mounted alongside the dual-tip conductivity probe to record simultaneously the instantaneous total pressure
and void fraction. The probes were sampled at 5 kHz per sensor for 180 s, following Wang et al. (2014). The
data were sampled above each step edge downstream of the inception point of free-surface aeration.
A trolley system used to position the probes was fixed by steel rails parallel to the pseudo-bottom between
step edges. The vertical movement of the probes was controlled by a Mitutoyo™ digital ruler within ±0.01
mm and the error on the horizontal position was less than 1 mm.
Preliminary tests
Initial tests were conducted with a sharp downstream crest edge. Un-ventilated deflected jets were observed
for 0.15 < H1/Lcrest < 0.44. The results were quantitatively comparable to the findings of Pfister (2009). There
were however some distinctive difference across the range of flow conditions, the worst deflecting jet
conditions being observed for 0.18 < H1/Lcrest < 0.27. For these conditions, deflecting jets took off at step
edges 1 and 4, while large air cavities formed between step edges 1-3 and between step edges 4-6
respectively. Further a series of tests were performed systematically with a monotonically increasing
discharge, followed by a monotonically decreasing flow rate. The results showed some marked hysteresis.
The above quantitative observations were obtained with increasing discharges.
Following these initial tests, a 0.018 m radius rounded edge was installed at the downstream end of the broad
crest (Fig. 3) and no further jet deflection was observed within 0.045 < dc/h < 2 where dc is the critical flow
depth (dc = (q2/g)1/3) and h is the vertical step height (h = 0.10 m).
ZHANG, G., and CHANSON, H. (2016). "Interactions between Free-surface Aeration and Total Pressure on a Stepped Chute." Experimental Thermal and Fluid Science, Vol. 74, pp. 368-381 (DOI: 10.1016/j.expthermflusci.2015.12.011) (ISSN 0894-1777).
4
Experimental flow conditions
Total pressure and two-phase flow measurements were performed for a range of discharges encompassing
transition and skimming flows, although the focus of the study was on the skimming flow regime. Two-
phase flow measurements were undertaken at step edges in the aerated flow region for both transition and
skimming flows. Next the measurements were repeated in and above several step cavities for a subset of
skimming flow discharges. Lastly, simultaneous two-phase flow and total pressure measurements were
conducted in the aerated flow region for a range of skimming flow conditions. The experimental flow
conditions are summarised in Table 1
RESULTS (1) FLOW PATTERNS
Visual observations were conducted for a broad range of dimensionless discharges dc/h (Table 1). Three
main flow regimes were identified, namely a nappe flow, a transition flow or a skimming flow regime
depending upon the discharge. For dc/h < 0.15, the water cascaded from one step to the next one and
appeared highly fragmented. For 0.15 ≤ dc/h < 0.4, a clear water supercritical jet developed downstream of
step edge 2 and reattached upstream of step edge 5. The jet was deflected again off step 5 edge and a large
amount of air was entrained. A transition flow was observed for 0.4 ≤ dc/h < 0.9. For 0.4 ≤ dc/h < 0.6, the
step cavities downstream of the large clear water jet impact were partially filled and the flow appeared highly
chaotic with strong splashing and spray. The upstream clear jet disappeared for 0.6 ≤ dc/h < 0.9 where all
cavities became partially filled with alternating cavity sizes, similar to previous observations (e.g. Chanson
and Toombes 2004). For dc/h ≥ 0.9, a skimming flow was observed (Fig. 2). The mainstream flow skimmed
over the pseudo-bottom formed by the step edges as sketched in Figure 3. The streamlines were
approximately parallel, although the free-surface exhibited a wavy profile approximately in phase with the
steps at lower discharges. At the upstream end, the flow was smooth and glassy. Downstream of the
inception point of free-surface aeration, some complex air-water interactions were observed (Fig. 2). The
flow in each step cavity exhibited a quasi-stable recirculation motion (Fig. 2B). Visual observations
suggested strong mainstream-cavity flow interactions, as previously reported (Rajaratnam 1990, Chanson
and Toombes 2003, Gonzalez and Chanson 2004, Bung 2009).
In the following sections, the focus will be on the transition and skimming flow regime, the latter being
typical of steep stepped spillway operating at large flows during major floods (Chanson et al. 2015).
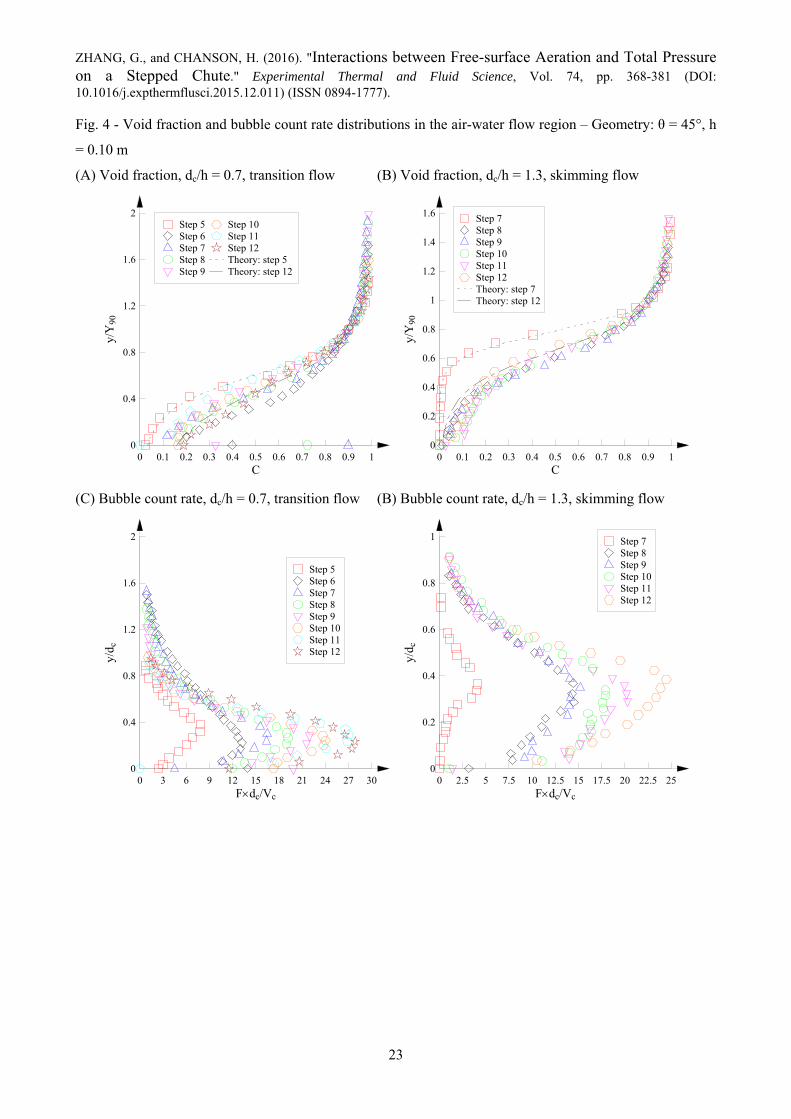
RESULTS (2) AIR-WATER FLOW PROPERTIES AT STEP EDGES
Detailed void fraction measurements were conducted with a dual-tip phase detection probe at all step edges
downstream of the inception point. Typical void fraction distributions are presented in Figures 4A and 4B for
transition and skimming flows. For most flow rates, the results showed an S-shape typically observed on
ZHANG, G., and CHANSON, H. (2016). "Interactions between Free-surface Aeration and Total Pressure on a Stepped Chute." Experimental Thermal and Fluid Science, Vol. 74, pp. 368-381 (DOI: 10.1016/j.expthermflusci.2015.12.011) (ISSN 0894-1777).
5
stepped spillways with flat steps (Ruff and Frizell 1993, Chamani and Rajaratnam 1999, Chanson and
Toombes 2003). The void fraction data showed some self-similarity except at the first step edge downstream
of the onset of aeration. In the overflow above the stepped bottom, the void fraction data followed closely a
theoretical distribution (Chanson and Toombes 2003):
0
3
0
2
D3
3
1'y
D2
'y'Ktanh1C (2)
where y' = y/Y90, y is the distance normal to the pseudo-bottom formed by the step edges, Y90 is the normal
distance from the pseudo-bottom for C = 0.9, and K' and D0 are functions of the depth-averaged void fraction
Cmean:
90Y
090
mean dyCY
1C (3)
Equation (2) is plotted in Figure 4 for the first and last step edges downstream of the inception point. Overall
a good agreement was obtained, despite small scatter underlying void fraction and height measurements
uncertainties.
The bubble count rate F is defined as half the number of air-water interfaces detected by the probe sensor per
unit time. The bubble count rate is a function of the flow fragmentation. For a given interfacial velocity, F is
proportional to the specific interface area (Chanson 2002), thus providing some information on the re-
aeration rate. Typical dimensionless bubble count rate F×dc/Vc distributions are shown in Figures 4C and 4D.
The data showed a distinct shape, with a maximum bubble count rate Fmax at about 0.3 < y/dc < 0.4
corresponding to a void fraction between 0.4 and 0.5, as previously reported (Toombes and Chanson 2008,
Bung 2009).
The interfacial velocities were calculated based upon a cross-correlation method. The velocity data exhibited
some self-similarity and they were approximately by a simple power law for y < Y90 and an uniform profile
above:
N/1
9090 Y
y
V
V
0 < y < Y90 (4a)
1V
V
90
Y90 < y (4b)
where the interfacial velocity V was normalised in terms of the characteristic velocity V90 defined as the
interfacial velocity for C = 0.9. The above relationships were compared successfully to data (data not
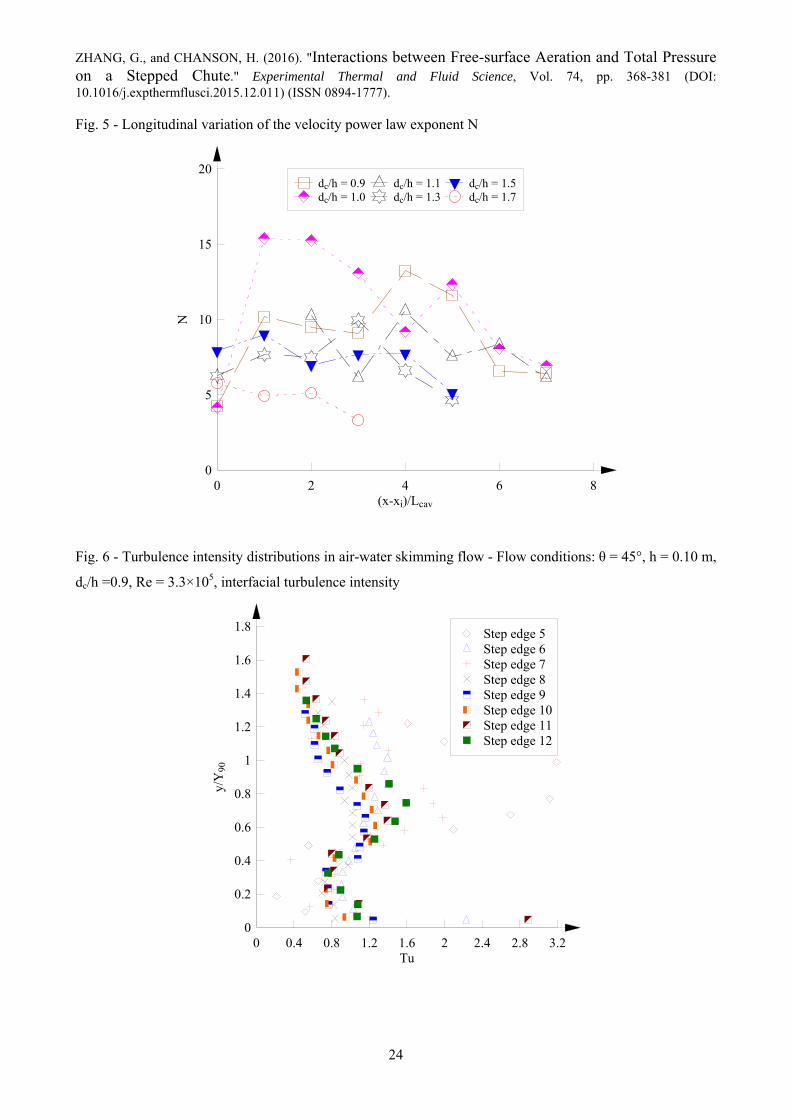
shown), with a satisfactory agreement for N = 10 on average. For a given discharge, the velocity power law
exponent N was observed to vary from one step to the next one, as shown by Felder and Chanson (2009). For
ZHANG, G., and CHANSON, H. (2016). "Interactions between Free-surface Aeration and Total Pressure on a Stepped Chute." Experimental Thermal and Fluid Science, Vol. 74, pp. 368-381 (DOI: 10.1016/j.expthermflusci.2015.12.011) (ISSN 0894-1777).
6
a given discharge, the velocity power N showed some longitudinal fluctuation with a wavelength about 1-2
cavity lengths. Such a longitudinal variation in N was likely linked to the flow response to contraction and
expansion, and interactions with vortices shed from the bottom roughness. Herein the longitudinal
distribution of the velocity power N in skimming flows is plotted in Figure 5, where x is the streamwise
distance from step edge 1, xi is the streamwise location of the inception point of free-surface aeration and Lcav
is the cavity length (Lcav = (h2+l2)1/2). The data showed large scatter without correlation to the discharge.
The interfacial turbulence intensity is defined as the ratio of the root-mean-square of interfacial velocity
fluctuations to the mean interfacial velocity: Tu = 2v /V. It was calculated based upon a cross-correlation
technique between the probe signals (Chanson and Toombes 2003). Typical distributions are presented in
Figure 6. In the transition flow, the turbulence intensity data generally increased with increasing elevation,
with local maxima next to the step edge at y/dc ≈ 0.4, which were respectively linked to the existence of a
large number of air-water interfaces and irregular flow impingement on the horizontal step face (Felder and
Chanson 2014). In skimming flows, the data followed a characteristic shape with maximum turbulence levels
at y/dc ≈ 0.4 (Fig. 6). Overall the turbulence levels tended to be larger in skimming flows than in transition
flows. For all discharges, the local maxima in turbulence levels approximately occurred at those of maximum
bubble count rates (see discussion below).
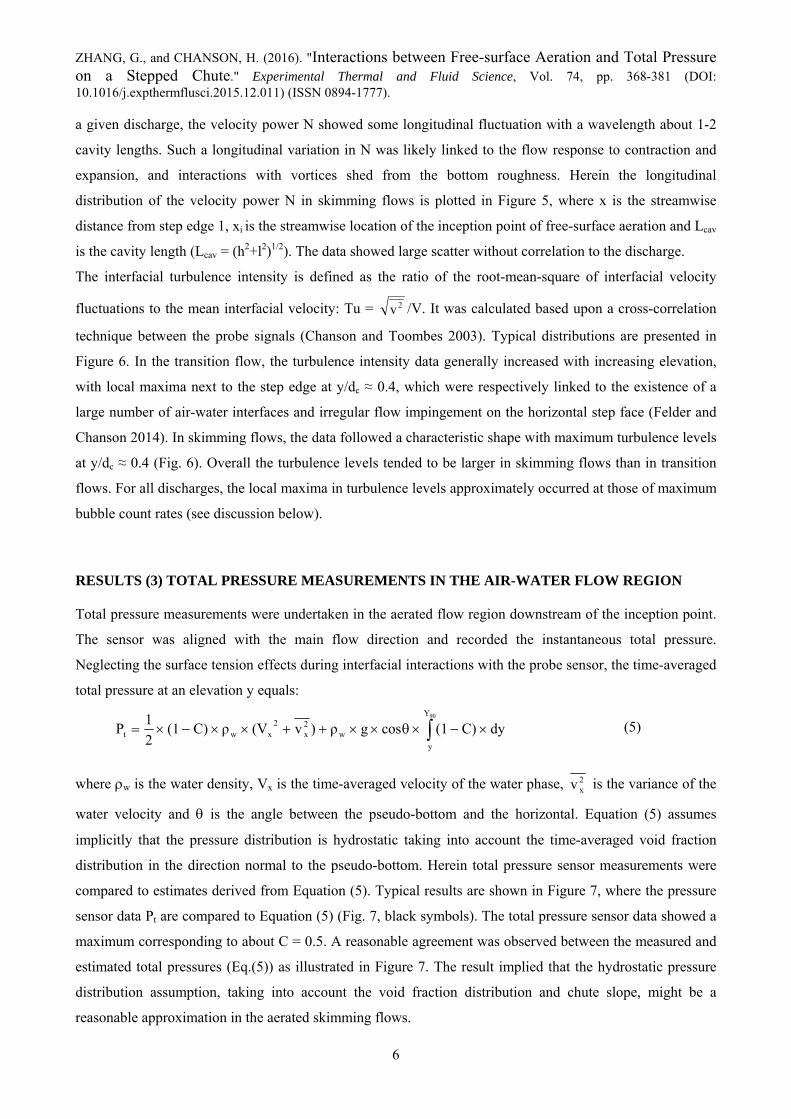
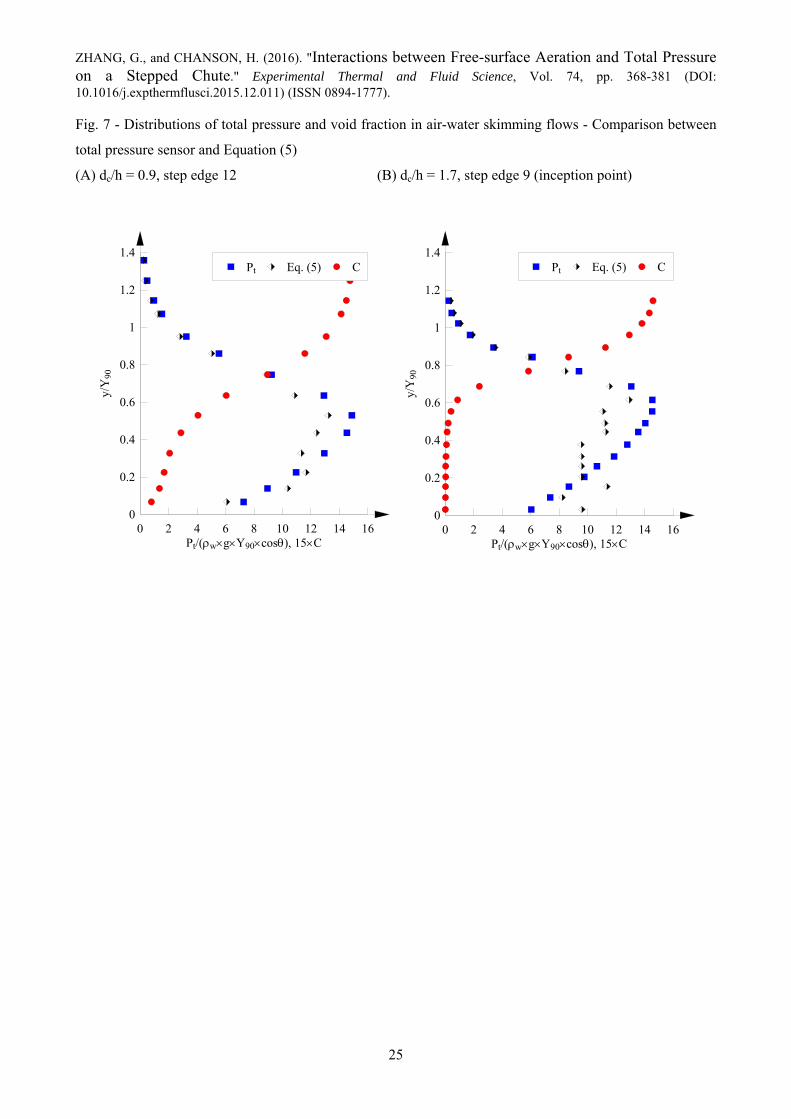
RESULTS (3) TOTAL PRESSURE MEASUREMENTS IN THE AIR-WATER FLOW REGION
Total pressure measurements were undertaken in the aerated flow region downstream of the inception point.
The sensor was aligned with the main flow direction and recorded the instantaneous total pressure.
Neglecting the surface tension effects during interfacial interactions with the probe sensor, the time-averaged
total pressure at an elevation y equals:
90Y
y
w2x
2xwt dyC)(1cosgρ)v(VρC)(1
2
1P (5)
where w is the water density, Vx is the time-averaged velocity of the water phase, 2xv is the variance of the
water velocity and is the angle between the pseudo-bottom and the horizontal. Equation (5) assumes
implicitly that the pressure distribution is hydrostatic taking into account the time-averaged void fraction
distribution in the direction normal to the pseudo-bottom. Herein total pressure sensor measurements were
compared to estimates derived from Equation (5). Typical results are shown in Figure 7, where the pressure
sensor data Pt are compared to Equation (5) (Fig. 7, black symbols). The total pressure sensor data showed a
maximum corresponding to about C = 0.5. A reasonable agreement was observed between the measured and
estimated total pressures (Eq.(5)) as illustrated in Figure 7. The result implied that the hydrostatic pressure
distribution assumption, taking into account the void fraction distribution and chute slope, might be a
reasonable approximation in the aerated skimming flows.
ZHANG, G., and CHANSON, H. (2016). "Interactions between Free-surface Aeration and Total Pressure on a Stepped Chute." Experimental Thermal and Fluid Science, Vol. 74, pp. 368-381 (DOI: 10.1016/j.expthermflusci.2015.12.011) (ISSN 0894-1777).
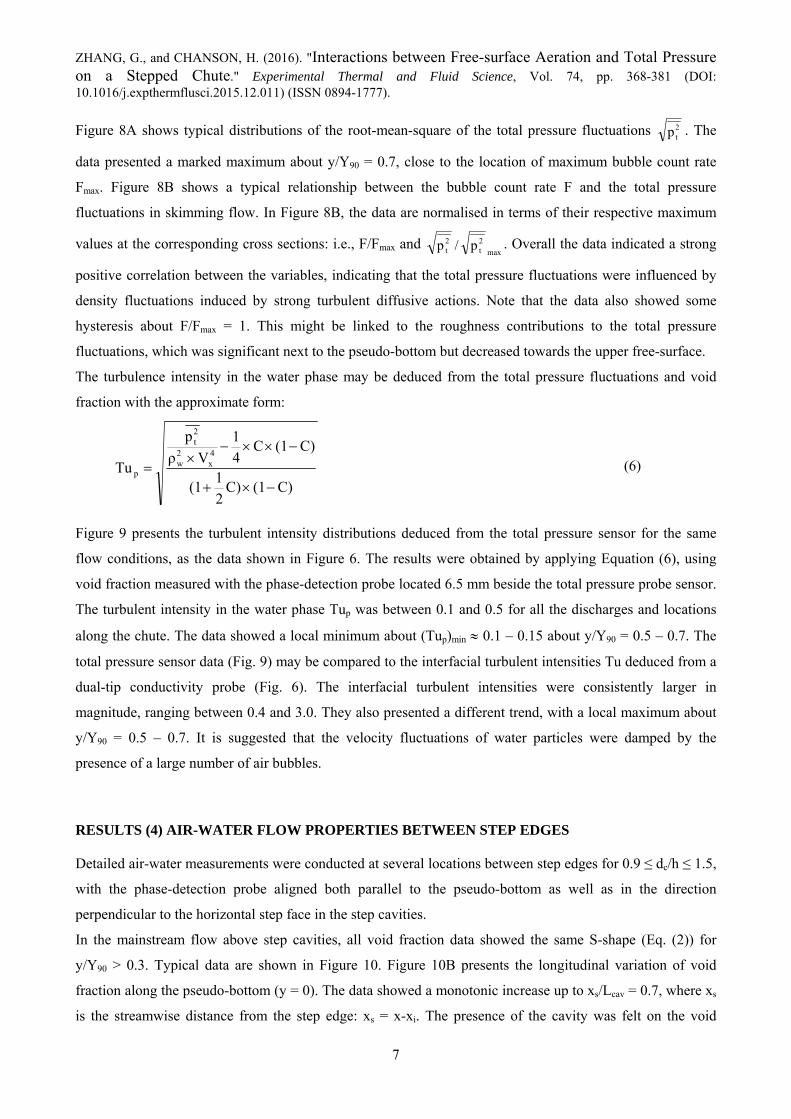
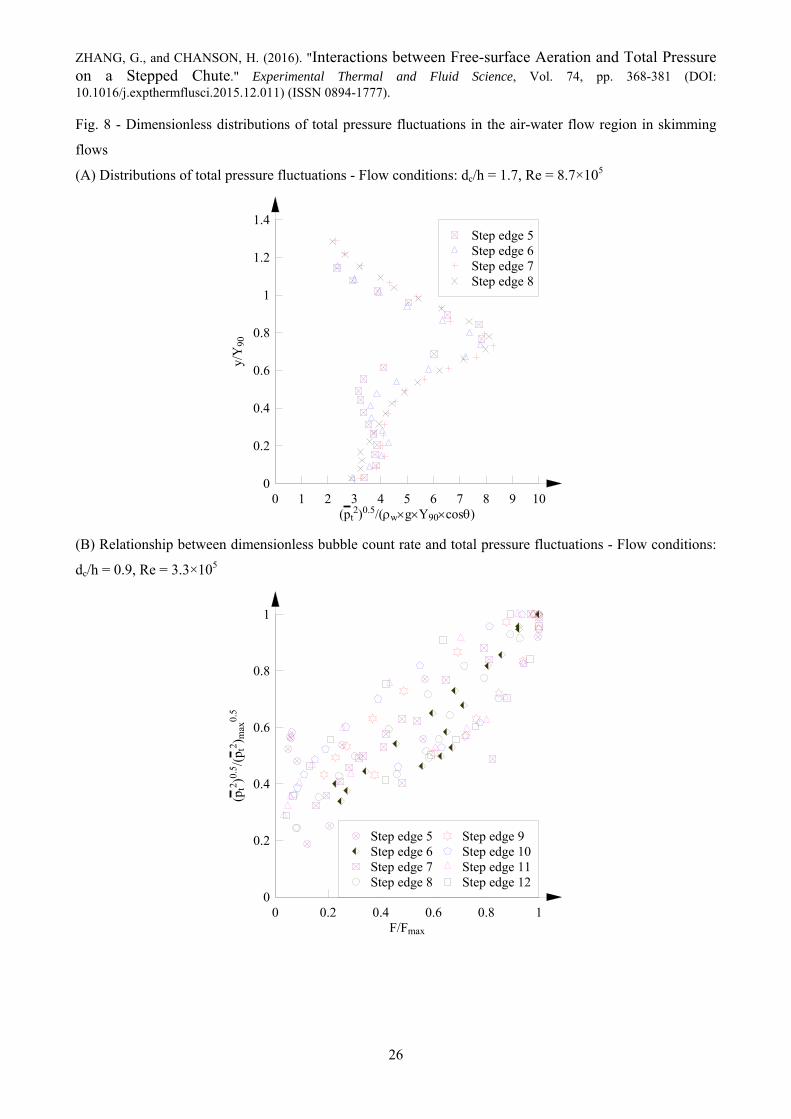
7
Figure 8A shows typical distributions of the root-mean-square of the total pressure fluctuations 2tp . The
data presented a marked maximum about y/Y90 = 0.7, close to the location of maximum bubble count rate
Fmax. Figure 8B shows a typical relationship between the bubble count rate F and the total pressure
fluctuations in skimming flow. In Figure 8B, the data are normalised in terms of their respective maximum
values at the corresponding cross sections: i.e., F/Fmax and max
2t
2t p/p . Overall the data indicated a strong
positive correlation between the variables, indicating that the total pressure fluctuations were influenced by
density fluctuations induced by strong turbulent diffusive actions. Note that the data also showed some
hysteresis about F/Fmax = 1. This might be linked to the roughness contributions to the total pressure
fluctuations, which was significant next to the pseudo-bottom but decreased towards the upper free-surface.
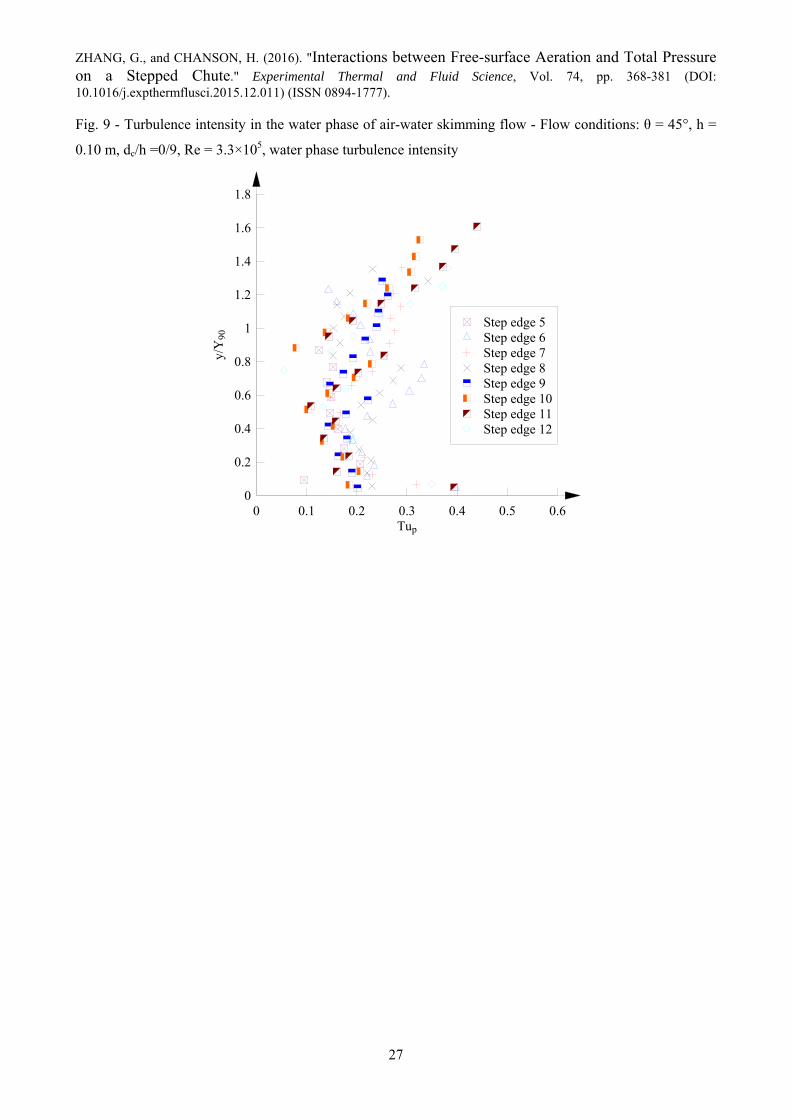
The turbulence intensity in the water phase may be deduced from the total pressure fluctuations and void
fraction with the approximate form:
C)(1C)2
1(1
C)(1C4
1
Vρ
p
Tu4x
2w
2t
p
(6)
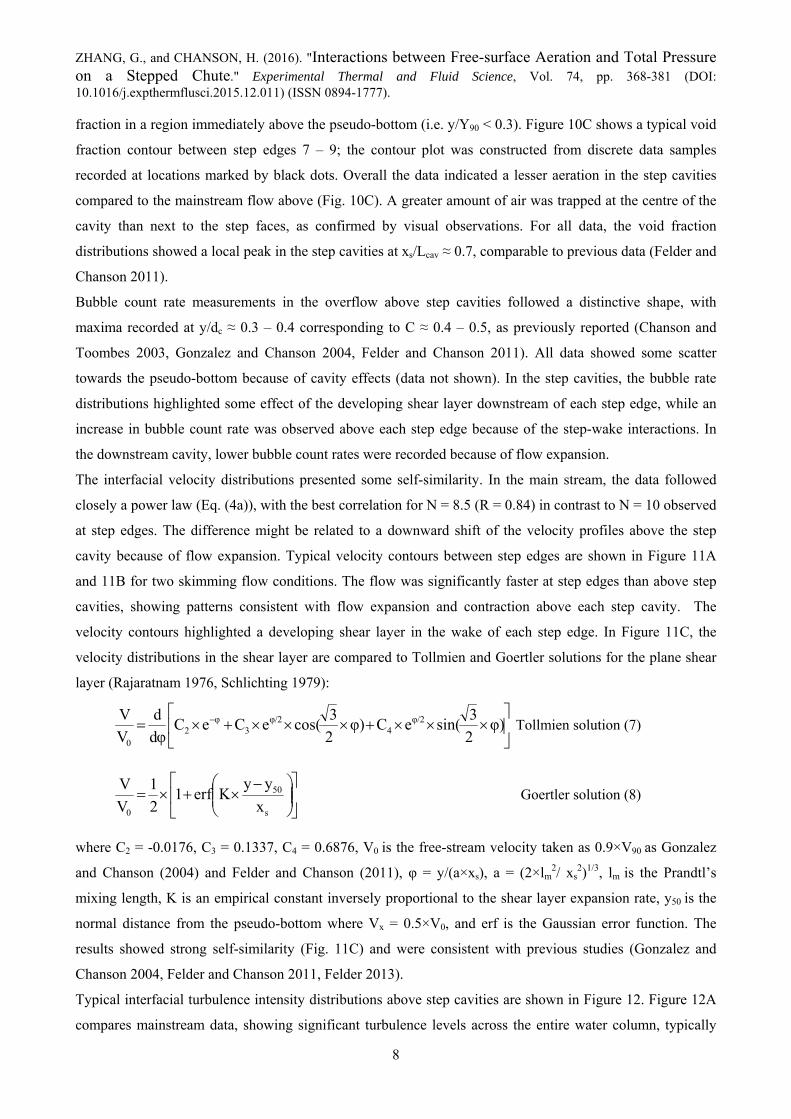
Figure 9 presents the turbulent intensity distributions deduced from the total pressure sensor for the same
flow conditions, as the data shown in Figure 6. The results were obtained by applying Equation (6), using
void fraction measured with the phase-detection probe located 6.5 mm beside the total pressure probe sensor.
The turbulent intensity in the water phase Tup was between 0.1 and 0.5 for all the discharges and locations
along the chute. The data showed a local minimum about (Tup)min 0.1 – 0.15 about y/Y90 = 0.5 – 0.7. The
total pressure sensor data (Fig. 9) may be compared to the interfacial turbulent intensities Tu deduced from a
dual-tip conductivity probe (Fig. 6). The interfacial turbulent intensities were consistently larger in
magnitude, ranging between 0.4 and 3.0. They also presented a different trend, with a local maximum about
y/Y90 = 0.5 – 0.7. It is suggested that the velocity fluctuations of water particles were damped by the
presence of a large number of air bubbles.
RESULTS (4) AIR-WATER FLOW PROPERTIES BETWEEN STEP EDGES
Detailed air-water measurements were conducted at several locations between step edges for 0.9 ≤ dc/h ≤ 1.5,
with the phase-detection probe aligned both parallel to the pseudo-bottom as well as in the direction
perpendicular to the horizontal step face in the step cavities.
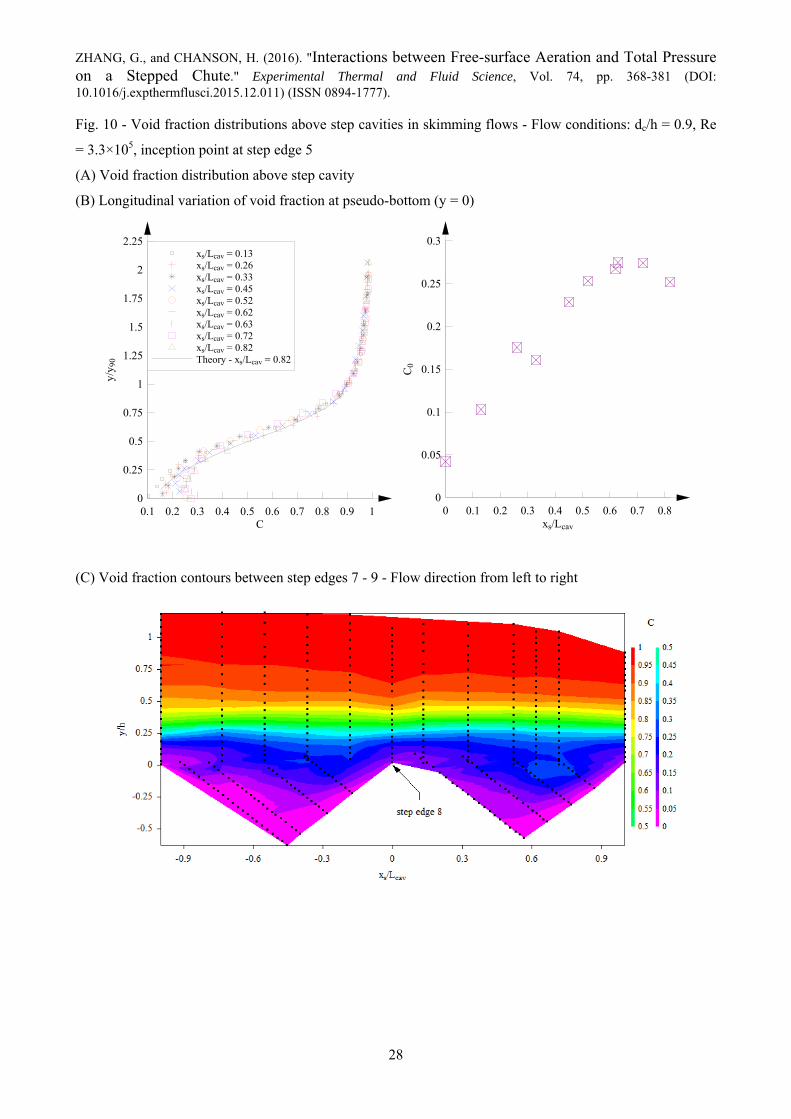
In the mainstream flow above step cavities, all void fraction data showed the same S-shape (Eq. (2)) for
y/Y90 > 0.3. Typical data are shown in Figure 10. Figure 10B presents the longitudinal variation of void
fraction along the pseudo-bottom (y = 0). The data showed a monotonic increase up to xs/Lcav = 0.7, where xs
is the streamwise distance from the step edge: xs = x-xi. The presence of the cavity was felt on the void
ZHANG, G., and CHANSON, H. (2016). "Interactions between Free-surface Aeration and Total Pressure on a Stepped Chute." Experimental Thermal and Fluid Science, Vol. 74, pp. 368-381 (DOI: 10.1016/j.expthermflusci.2015.12.011) (ISSN 0894-1777).
8
fraction in a region immediately above the pseudo-bottom (i.e. y/Y90 < 0.3). Figure 10C shows a typical void
fraction contour between step edges 7 – 9; the contour plot was constructed from discrete data samples
recorded at locations marked by black dots. Overall the data indicated a lesser aeration in the step cavities
compared to the mainstream flow above (Fig. 10C). A greater amount of air was trapped at the centre of the
cavity than next to the step faces, as confirmed by visual observations. For all data, the void fraction
distributions showed a local peak in the step cavities at xs/Lcav ≈ 0.7, comparable to previous data (Felder and
Chanson 2011).
Bubble count rate measurements in the overflow above step cavities followed a distinctive shape, with
maxima recorded at y/dc ≈ 0.3 – 0.4 corresponding to C ≈ 0.4 – 0.5, as previously reported (Chanson and
Toombes 2003, Gonzalez and Chanson 2004, Felder and Chanson 2011). All data showed some scatter
towards the pseudo-bottom because of cavity effects (data not shown). In the step cavities, the bubble rate
distributions highlighted some effect of the developing shear layer downstream of each step edge, while an
increase in bubble count rate was observed above each step edge because of the step-wake interactions. In
the downstream cavity, lower bubble count rates were recorded because of flow expansion.
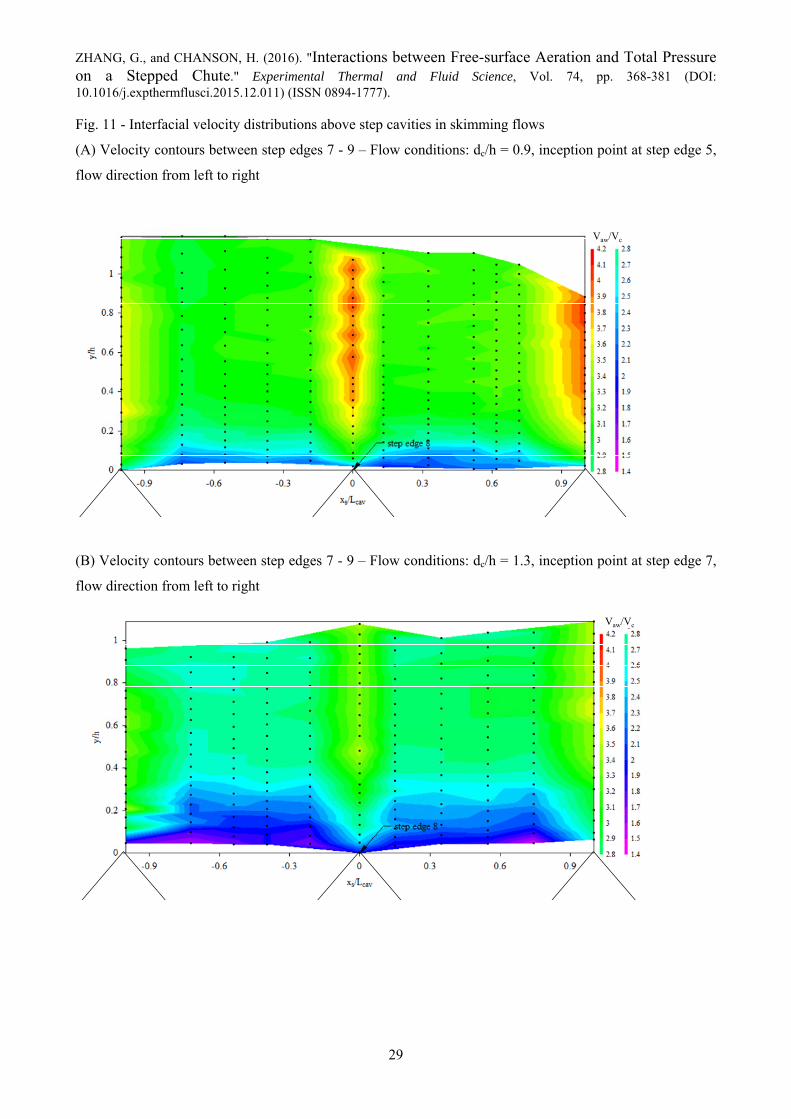
The interfacial velocity distributions presented some self-similarity. In the main stream, the data followed
closely a power law (Eq. (4a)), with the best correlation for N = 8.5 (R = 0.84) in contrast to N = 10 observed
at step edges. The difference might be related to a downward shift of the velocity profiles above the step
cavity because of flow expansion. Typical velocity contours between step edges are shown in Figure 11A
and 11B for two skimming flow conditions. The flow was significantly faster at step edges than above step
cavities, showing patterns consistent with flow expansion and contraction above each step cavity. The
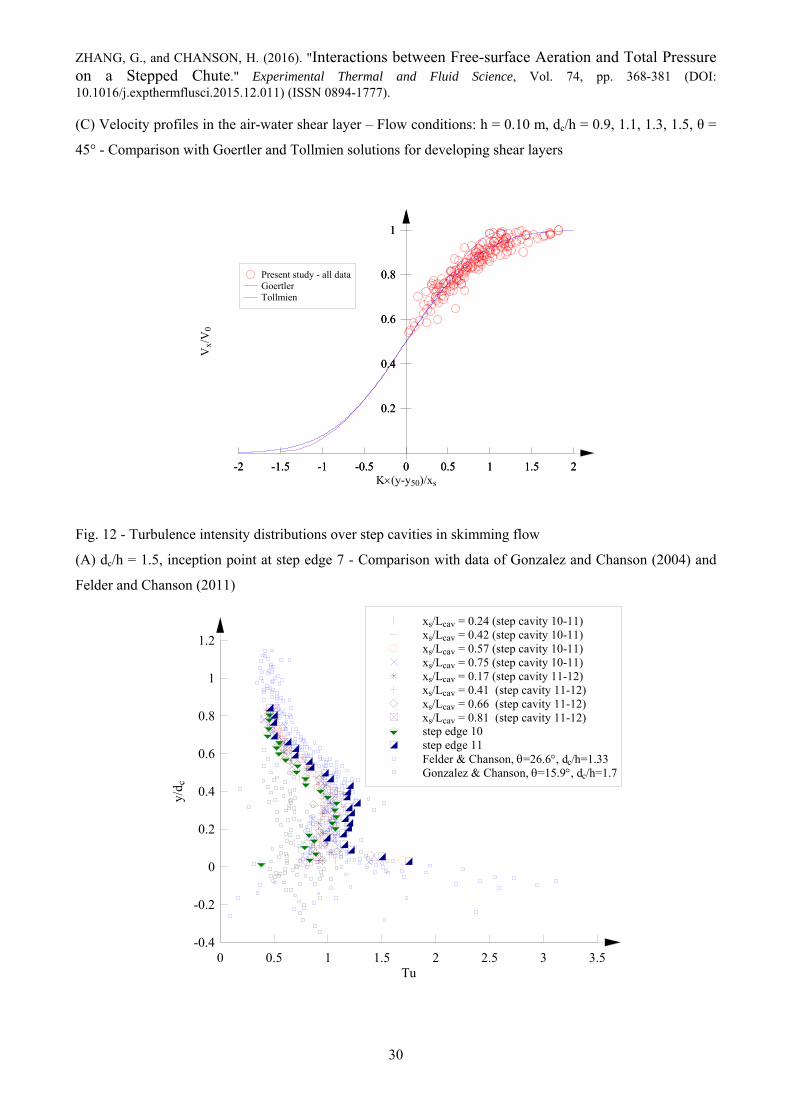
velocity contours highlighted a developing shear layer in the wake of each step edge. In Figure 11C, the
velocity distributions in the shear layer are compared to Tollmien and Goertler solutions for the plane shear
layer (Rajaratnam 1976, Schlichting 1979):
φ)
2
3sin(eCφ)
2
3cos(eCeC
dφ
d
V
V φ/24
φ/23
φ2
0
Tollmien solution (7)
s
50
0 x
yyKerf1
2
1
V
V Goertler solution (8)
where C2 = -0.0176, C3 = 0.1337, C4 = 0.6876, V0 is the free-stream velocity taken as 0.9×V90 as Gonzalez
and Chanson (2004) and Felder and Chanson (2011), φ = y/(a×xs), a = (2×lm2/ xs
2)1/3, lm is the Prandtl’s
mixing length, K is an empirical constant inversely proportional to the shear layer expansion rate, y50 is the
normal distance from the pseudo-bottom where Vx = 0.5×V0, and erf is the Gaussian error function. The
results showed strong self-similarity (Fig. 11C) and were consistent with previous studies (Gonzalez and
Chanson 2004, Felder and Chanson 2011, Felder 2013).
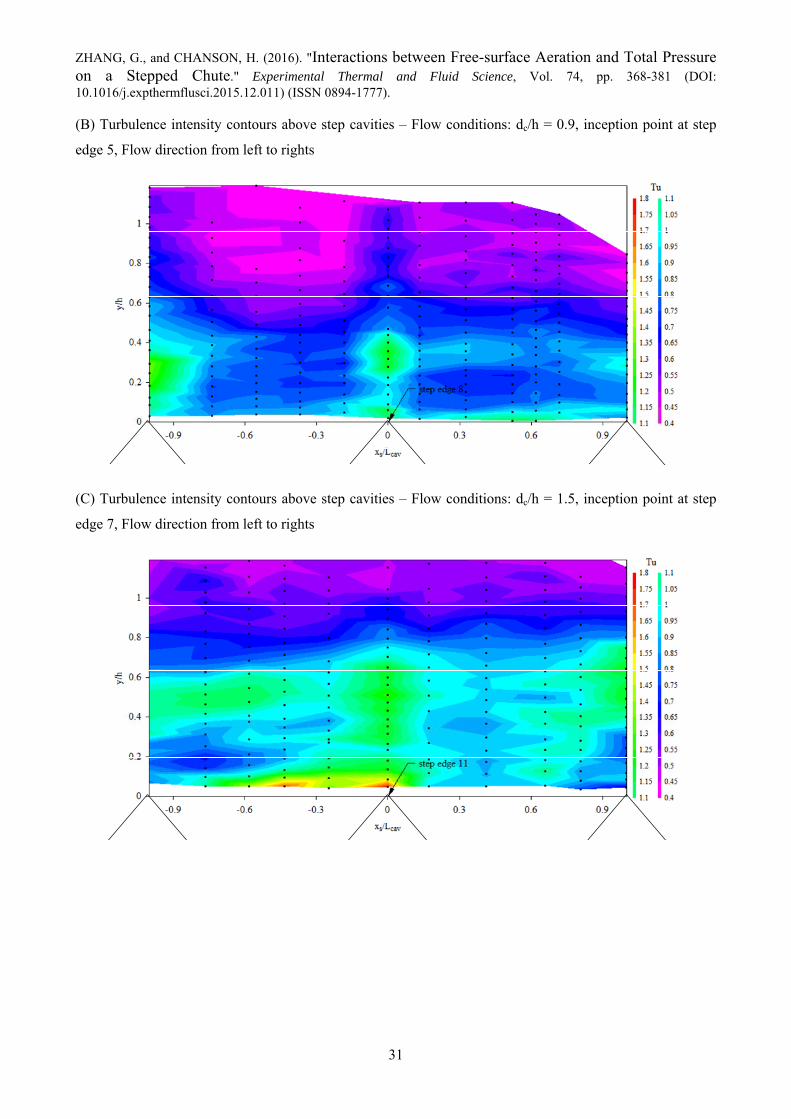
Typical interfacial turbulence intensity distributions above step cavities are shown in Figure 12. Figure 12A
compares mainstream data, showing significant turbulence levels across the entire water column, typically
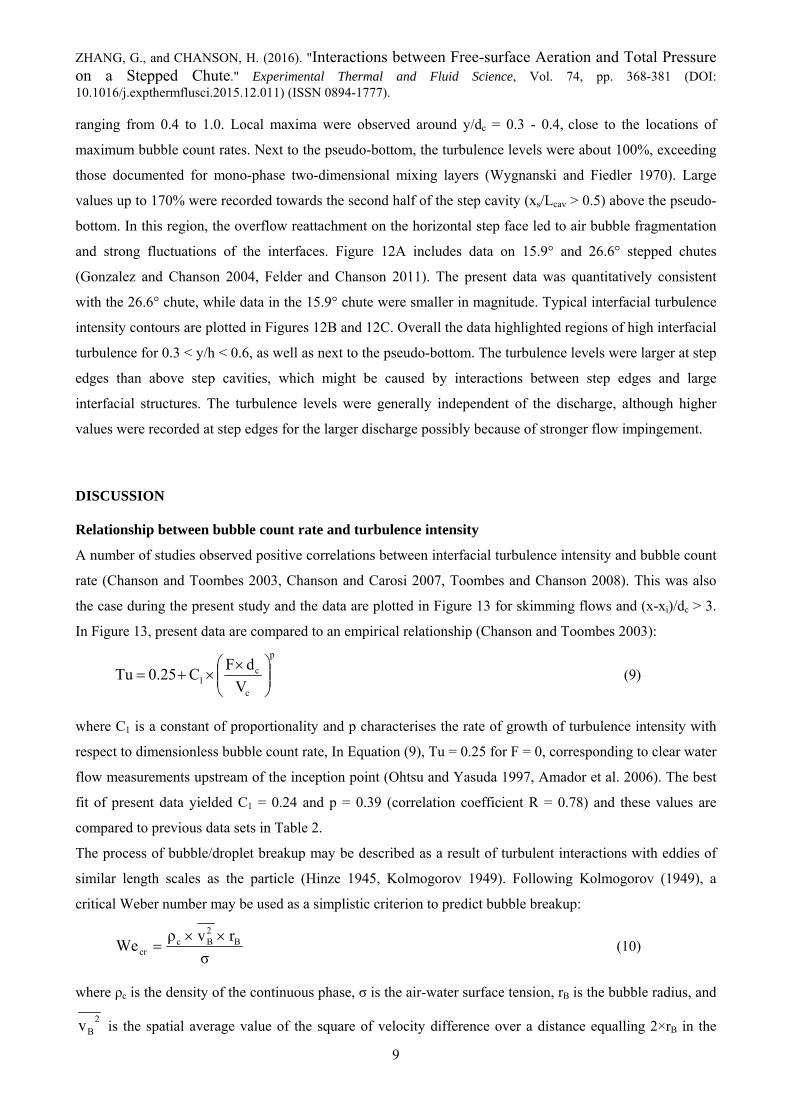
ZHANG, G., and CHANSON, H. (2016). "Interactions between Free-surface Aeration and Total Pressure on a Stepped Chute." Experimental Thermal and Fluid Science, Vol. 74, pp. 368-381 (DOI: 10.1016/j.expthermflusci.2015.12.011) (ISSN 0894-1777).
9
ranging from 0.4 to 1.0. Local maxima were observed around y/dc = 0.3 - 0.4, close to the locations of
maximum bubble count rates. Next to the pseudo-bottom, the turbulence levels were about 100%, exceeding
those documented for mono-phase two-dimensional mixing layers (Wygnanski and Fiedler 1970). Large
values up to 170% were recorded towards the second half of the step cavity (xs/Lcav > 0.5) above the pseudo-
bottom. In this region, the overflow reattachment on the horizontal step face led to air bubble fragmentation
and strong fluctuations of the interfaces. Figure 12A includes data on 15.9° and 26.6° stepped chutes
(Gonzalez and Chanson 2004, Felder and Chanson 2011). The present data was quantitatively consistent
with the 26.6° chute, while data in the 15.9° chute were smaller in magnitude. Typical interfacial turbulence
intensity contours are plotted in Figures 12B and 12C. Overall the data highlighted regions of high interfacial
turbulence for 0.3 < y/h < 0.6, as well as next to the pseudo-bottom. The turbulence levels were larger at step
edges than above step cavities, which might be caused by interactions between step edges and large
interfacial structures. The turbulence levels were generally independent of the discharge, although higher
values were recorded at step edges for the larger discharge possibly because of stronger flow impingement.
DISCUSSION
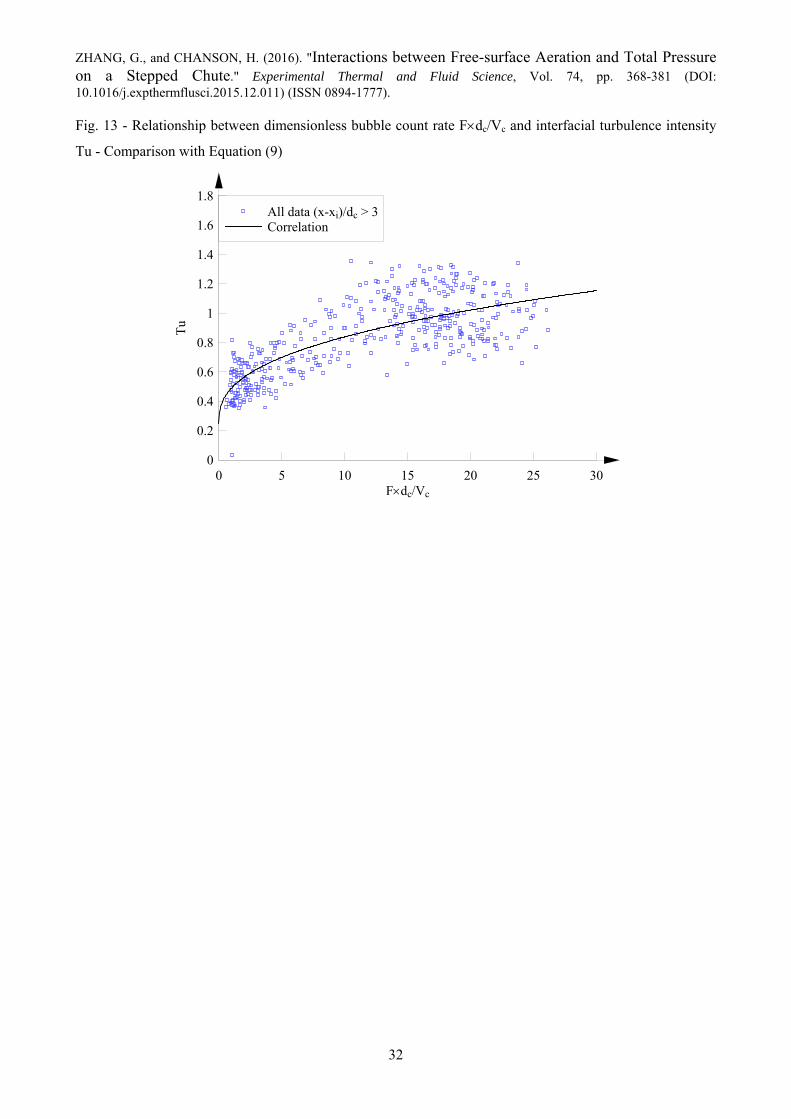
Relationship between bubble count rate and turbulence intensity
A number of studies observed positive correlations between interfacial turbulence intensity and bubble count
rate (Chanson and Toombes 2003, Chanson and Carosi 2007, Toombes and Chanson 2008). This was also
the case during the present study and the data are plotted in Figure 13 for skimming flows and (x-xi)/dc > 3.
In Figure 13, present data are compared to an empirical relationship (Chanson and Toombes 2003):
p
c
c1 V
dFC0.25Tu
(9)
where C1 is a constant of proportionality and p characterises the rate of growth of turbulence intensity with
respect to dimensionless bubble count rate, In Equation (9), Tu = 0.25 for F = 0, corresponding to clear water
flow measurements upstream of the inception point (Ohtsu and Yasuda 1997, Amador et al. 2006). The best
fit of present data yielded C1 = 0.24 and p = 0.39 (correlation coefficient R = 0.78) and these values are
compared to previous data sets in Table 2.
The process of bubble/droplet breakup may be described as a result of turbulent interactions with eddies of
similar length scales as the particle (Hinze 1945, Kolmogorov 1949). Following Kolmogorov (1949), a
critical Weber number may be used as a simplistic criterion to predict bubble breakup:
σ
rvρWe B
2Bc
cr
(10)
where ρc is the density of the continuous phase, σ is the air-water surface tension, rB is the bubble radius, and
2Bv is the spatial average value of the square of velocity difference over a distance equalling 2×rB in the
ZHANG, G., and CHANSON, H. (2016). "Interactions between Free-surface Aeration and Total Pressure on a Stepped Chute." Experimental Thermal and Fluid Science, Vol. 74, pp. 368-381 (DOI: 10.1016/j.expthermflusci.2015.12.011) (ISSN 0894-1777).
10
external flow field (Sevik and Park 1973). Assuming that the process is ergodic, and 2Bv is the same order
as the characteristic interfacial velocity fluctuation 2v , the following relationship holds for a constant Wecr
and a characteristic bubble radius rB within the inertial subrange:
2/5B εr (11)
where ε is the energy dissipation per unit mass and unit time (m2/s3):
int
33
int
2/32
L
VTu
L
v~ε
(12)
since /VvTu 2 , with v the turbulent interfacial velocity fluctuation over the interfacial integral length
scale Lint measurable by statistical methods (Tennekes and Lumley 1972). Following Toombes (2002), the
air-water flow may be reduced to a streamwise distribution of small discrete air and water elements,
comprised of the smallest discrete air-water particles of length scale λ, selected such that the probability of
one element being air or water becomes independent of its adjacent elements. For a sufficiently large number
of bubbles, the bubble count rate may be expressed as:
C)(1Cλ
VF (13)
where V is the interfacial velocity. For a uniform velocity distribution and assuming the smallest length scale
λ to be proportional to rB, it yields:
C)(1CL
TuF
2/5int
6/5
(14)
implying Tu F5/6/(C(1-C))5/6 if the variation in Lint2/5 is small across the water column. Equation (14) and
Equation (9) both suggest a power law relationship between turbulence intensity Tu and bubble count rate F.
Equation (14) shows that Tu vanishes to zero for F = 0, in absence of interface. In contrast, in Equation (9),
the constant offset term (0.25) physically relates to the water phase fluctuations in the clear-water flow
immediately upstream of the inception point of free-surface aeration.
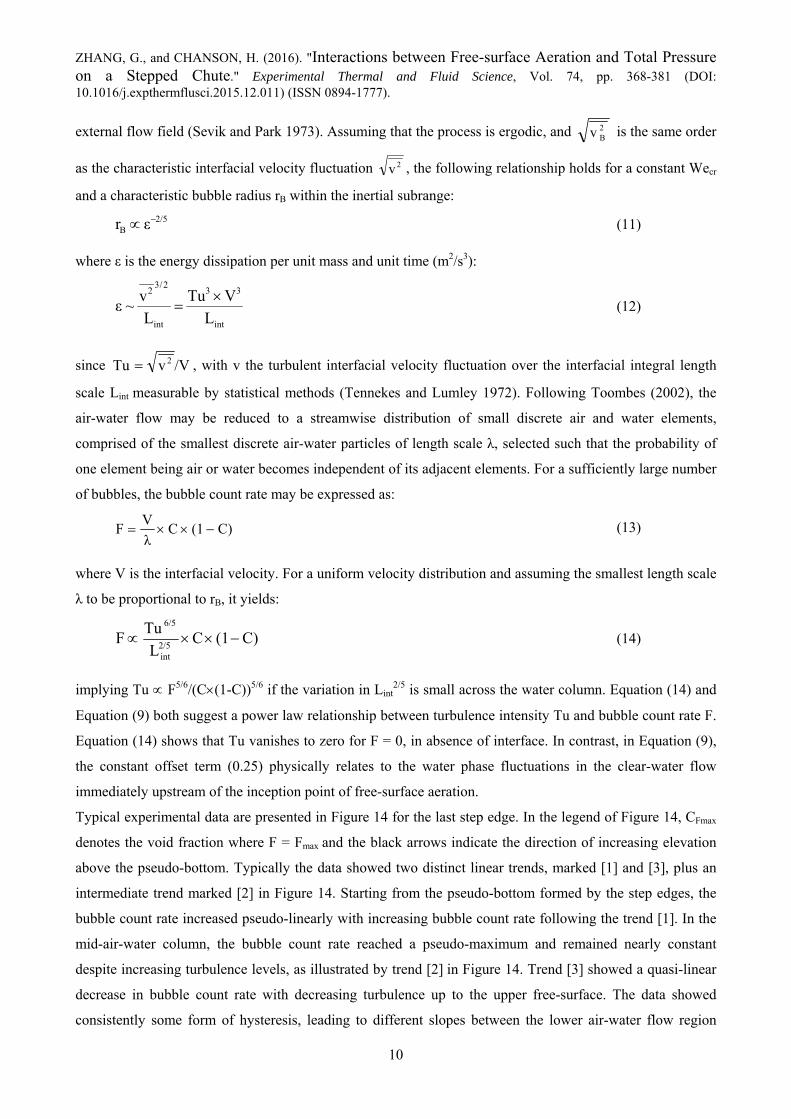
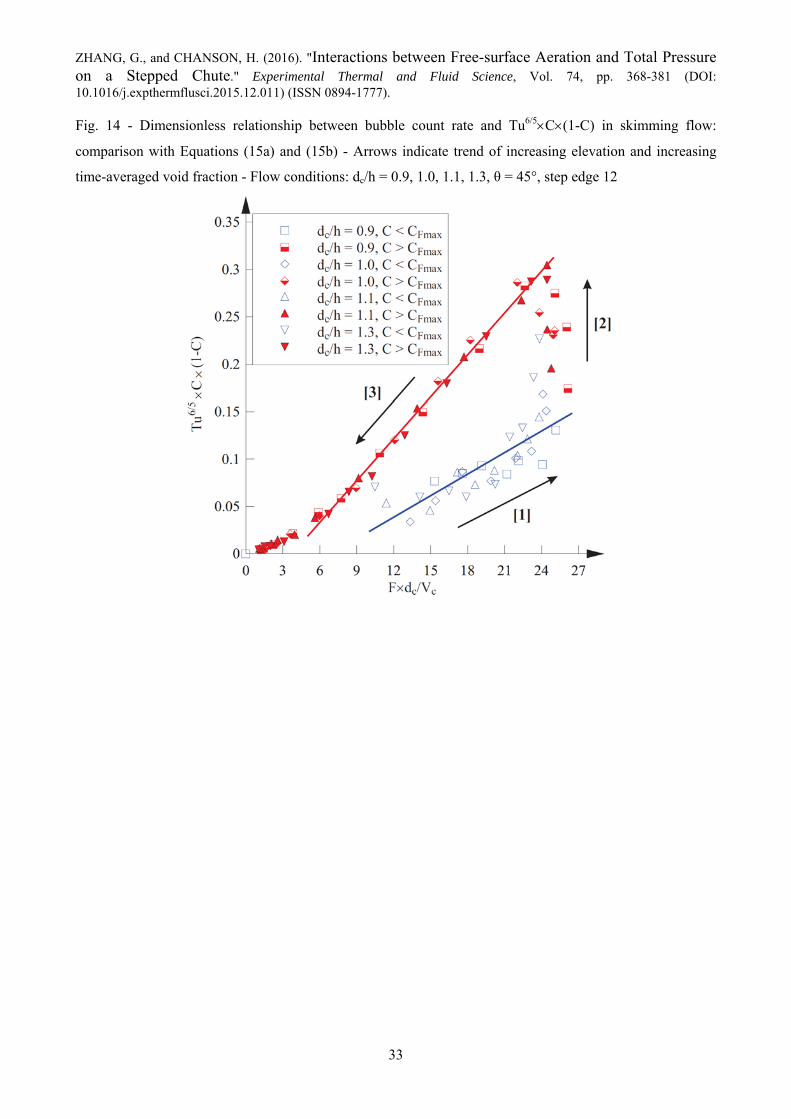
Typical experimental data are presented in Figure 14 for the last step edge. In the legend of Figure 14, CFmax
denotes the void fraction where F = Fmax and the black arrows indicate the direction of increasing elevation
above the pseudo-bottom. Typically the data showed two distinct linear trends, marked [1] and [3], plus an
intermediate trend marked [2] in Figure 14. Starting from the pseudo-bottom formed by the step edges, the
bubble count rate increased pseudo-linearly with increasing bubble count rate following the trend [1]. In the
mid-air-water column, the bubble count rate reached a pseudo-maximum and remained nearly constant
despite increasing turbulence levels, as illustrated by trend [2]in Figure 14. Trend [3] showed a quasi-linear
decrease in bubble count rate with decreasing turbulence up to the upper free-surface. The data showed
consistently some form of hysteresis, leading to different slopes between the lower air-water flow region
ZHANG, G., and CHANSON, H. (2016). "Interactions between Free-surface Aeration and Total Pressure on a Stepped Chute." Experimental Thermal and Fluid Science, Vol. 74, pp. 368-381 (DOI: 10.1016/j.expthermflusci.2015.12.011) (ISSN 0894-1777).
11
(region [1]) and the upper air-water flow region (region [3]).
For Figure 14, the data were best correlated by
052.0V
dF0076.0)C1(CTu
c
c5/6
Region [1] - C < CFmax (15a)
055.0V
dF0147.0)C1(CTu
c
c5/6
Region [3] - CFmax < C < 0.95 (15b)
Both equations are compared to experimental data in Figure 14, where the different flow rates are indicated
in the figure legend.
Energy dissipation
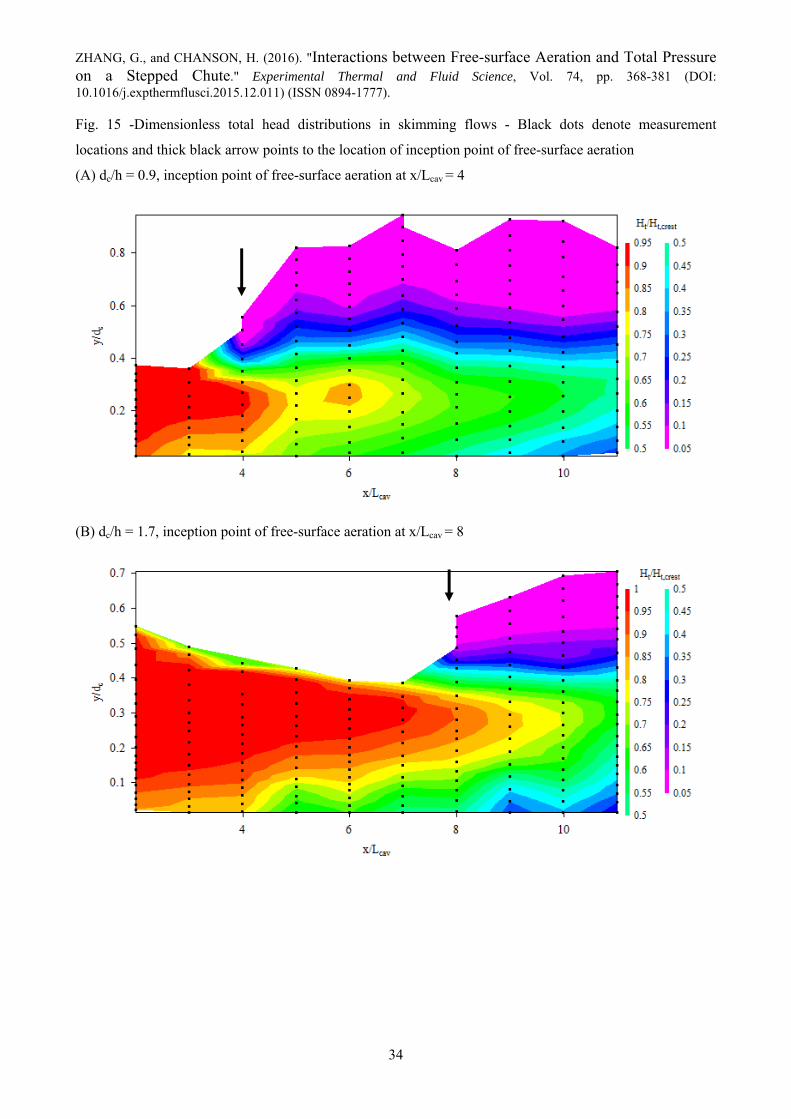
Based upon the total pressure measurements undertaken along the stepped chute centreline, the time-
averaged total head Ht was evaluated as:
z)C1(g
PH
w
tt
(16)
where Pt is the time-averaged total pressure measured by the total pressure sensor, and z is the vertical
elevation measured above the spillway toe. The total head Ht is total energy per unit weight of the fluid
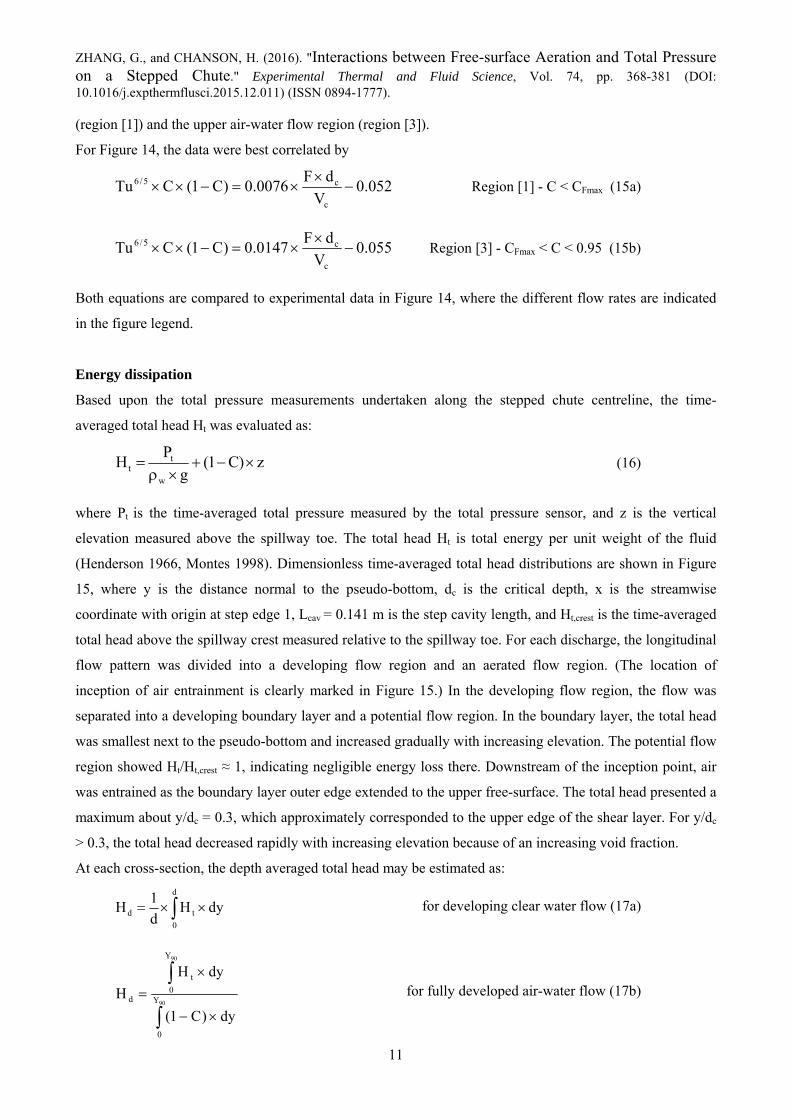
(Henderson 1966, Montes 1998). Dimensionless time-averaged total head distributions are shown in Figure
15, where y is the distance normal to the pseudo-bottom, dc is the critical depth, x is the streamwise
coordinate with origin at step edge 1, Lcav = 0.141 m is the step cavity length, and Ht,crest is the time-averaged
total head above the spillway crest measured relative to the spillway toe. For each discharge, the longitudinal
flow pattern was divided into a developing flow region and an aerated flow region. (The location of
inception of air entrainment is clearly marked in Figure 15.) In the developing flow region, the flow was
separated into a developing boundary layer and a potential flow region. In the boundary layer, the total head
was smallest next to the pseudo-bottom and increased gradually with increasing elevation. The potential flow
region showed Ht/Ht,crest ≈ 1, indicating negligible energy loss there. Downstream of the inception point, air
was entrained as the boundary layer outer edge extended to the upper free-surface. The total head presented a
maximum about y/dc = 0.3, which approximately corresponded to the upper edge of the shear layer. For y/dc
> 0.3, the total head decreased rapidly with increasing elevation because of an increasing void fraction.
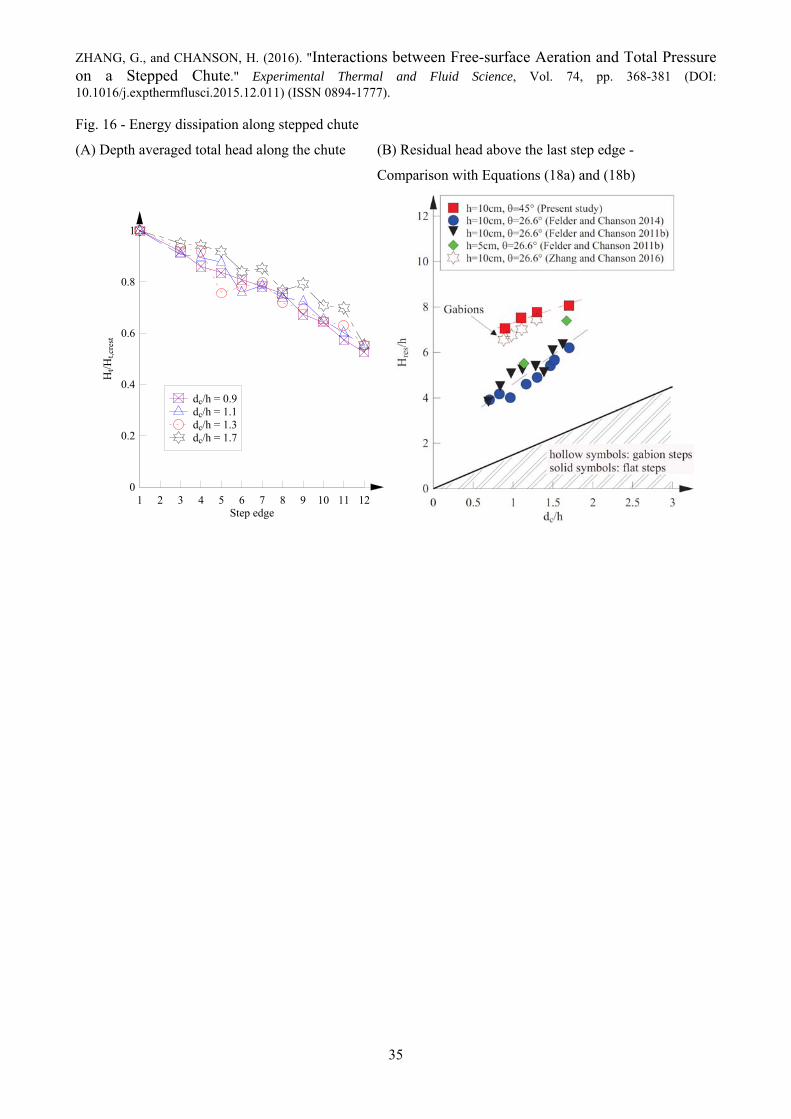
At each cross-section, the depth averaged total head may be estimated as:
d
0
td dyHd
1H for developing clear water flow (17a)
90
90
Y
0
Y
0
t
d
dy)C1(
dyH
H for fully developed air-water flow (17b)
ZHANG, G., and CHANSON, H. (2016). "Interactions between Free-surface Aeration and Total Pressure on a Stepped Chute." Experimental Thermal and Fluid Science, Vol. 74, pp. 368-381 (DOI: 10.1016/j.expthermflusci.2015.12.011) (ISSN 0894-1777).
12
where Hd is the depth averaged total head at a cross-section and d is the clear-water depth. Longitudinal
distributions of depth-averaged total head Hd are presented in Figure 16A. The data trend indicated that the
flow energy decreased almost linearly in the downstream direction, for all but the largest discharge (dc/h =
1.7). The finding implied a consistent rate of energy dissipation (∂Hd/∂x) in both the clear-water and aerated
flow regions. For the largest discharge, the rate of energy dissipation over the first few steps was small
because the boundary layer was thin compared to the flow depth. For all discharges, the overall energy
dissipation was about 50% at the end of the stepped chute.
Another design parameter is the residual head Hres, defined as the depth-averaged total head at the last step
edge: i.e., Hd at step edge 12. (Herein both total heads, Ht and Hd, residual head Hres and vertical elevation z
are measured above the spillway toe.) Residual head data are presented in Figure 16B. In Figure 16B, the
present data were compared to 26.6° slope data chutes with flat steps (Felder and Chanson 2011,2014), and a
reanalysis of 26.6° gabion stepped chute data (Zhang and Chanson 2016). All data corresponded to a very
close geometry: namely 1 m and 1.2 m high stepped chutes downstream of a broad-crested weir, and most
data were recorded with the same step height: h = 0.10 m. Solid symbols correspond to flat impervious steps
and hollow symbols to gabion steps in Figure 16B. For all configurations the dimensionless residual head
Hres/h increased with increasing dimensionless discharge dc/h. For solid (non-gabion) steps, however, the
results indicated a marked difference between 45º and 26º slopes:
h
d6.205.2
h
H cres 26º slope with 0.7 < dc/h < 1.7 (18a)
h
d19.11.6
h
H cres 45º slope with 0.9 < dc/h < 1.7 (18b)
It is believed that the main difference seen in Figure 16B was caused by the different cavity aspect ratio, and
the chute slope. For completness, note that the dimensionless residual head has a lower limit, Hres/dc = 1.5,
corresponding to critical flow conditions (Bakhmeteff 1932, Henderson 1966), and shown in Figure 16B
(thick black line).
The large amount of energy dissipation was mostly a result of form loss behind the steps (Chanson 2001,
Chanson et al. 2002). The flow is commonly assumed to be quasi-smooth and its resistance expressed using
the Darcy-Weisbach friction factor (Rajaratnam 1990, Chanson 2001):
3
c
Y
0fe d
dy)C1(S8f
90
for fully-developed air-water flow (19)
where the friction slope Sf is the slope of the total head line: Sf = -Hd/x. For each discharge, the friction
factor was calculated. In the aerated flow region the friction factors ranged between 0.25 and 0.45. The
present data were comparable to previous results (Chanson et al. 2002, Chanson 2006)
Results of the present analyses demonstrated the strong dissipative nature of the stepped chute. The rate of
ZHANG, G., and CHANSON, H. (2016). "Interactions between Free-surface Aeration and Total Pressure on a Stepped Chute." Experimental Thermal and Fluid Science, Vol. 74, pp. 368-381 (DOI: 10.1016/j.expthermflusci.2015.12.011) (ISSN 0894-1777).
13
energy dissipation was close between the aerated flow region and the developing flow region, except for the
largest discharge where the boundary layer remained thin above the first few step edges (Fig. 16A). The
friction factors were high and the rate of energy dissipation was largely determined by the bottom roughness.
The stepped bottom induced large form losses in a manner similar to a k-type or d-type rib roughness, the
effects of which might be sensitive to the overflow discharge.
CONCLUSION
Detailed air-water flow measurements were conducted in a large facility using both phase-detection and total
pressure probes. The stepped chute flow was characterised by strong free-surface aeration and turbulent
energy dissipation.
Downstream of the inception point of free-surface aeration, the void fraction distributions presented a S-
shape which was modelled by an advection-diffusion equation solution. The location for C 0.4-0.5 was
characterised by the highest bubble count rate and strongest interfacial turbulence. A theoretical relationship
between bubble count rate and interfacial turbulence intensity was derived. In the wake of each step edge, the
velocity profiles highlighted an expanding shear layer. The velocity distribution above and inside the shear
layer respectively followed respectively a power law and theoretical solutions for a plane shear layer.
Simultaneous total pressure and void fraction measurements showed quasi-hydrostatic pressure distributions
in the mainstream flow. Energy calculations showed the overall energy dissipation was about 50% regardless
of the discharge. The rate of energy dissipation (∂Hd/∂x) was similar in both the clear-water and aerated flow
regions. Overall the data indicated that the bottom roughness (i.e. stepped profile) was the determining factor
on the energy dissipation performances of the stepped structure, as well as on the longitudinal changes in air-
water flow properties. Further a comparison between present and earlier data suggested that the cavity aspect
ratio, hence the slope, has a marked effect on the residual energy.
ACKNOWLEDGMENTS
The authors thank Dr Hang Wang (University of Queensland, Australia) for his personal involvement,
contribution and comments to the research project. They acknowledge the technical assistance of Jason Van
Der Gevel and Stewart Matthews (The University of Queensland). The financial support through the
Australian Research Council (Grant DP120100481) is acknowledged.
REFERENCES
Agostini, R., Bizzarri, A., Masetti, M., and Papetti, A. (1987). "Flexible Gabion and Reno Mattress
Structures in River and Stream Training Works. Section One: Weirs." Officine Maccaferri, Bologna,
ZHANG, G., and CHANSON, H. (2016). "Interactions between Free-surface Aeration and Total Pressure on a Stepped Chute." Experimental Thermal and Fluid Science, Vol. 74, pp. 368-381 (DOI: 10.1016/j.expthermflusci.2015.12.011) (ISSN 0894-1777).
14
Italy, 2nd edition.
Amador, A., Sánchez-Juny, M. and Dolz, J. (2006). "Characterization of the nonaerated flow region in a
stepped spillway by PIV." Journal of Fluids Engineering, Transactions of the ASME, Vol. 128, No. 6, pp.
1266-1273 (DOI: 10.1115/1.2354529).
Bakhmeteff, B.A. (1932). "Hydraulics of Open Channels." McGraw-Hill, New York, USA, 1st edition, 329
pages.
Bung, D.B. (2009). "Zur selbstbelüfteten Gerinnenströmung auf Kaskaden mit gemässigter Neigung." ('Self-
aerated skimming flows on embankment stepped spillways.') Ph.D. thesis, University of Wuppertal,
LuFG Wasserwirtschaft and Wasserbau, Germany, 292 pages (in German).
Bung, D.B. (2011). "Developing flow in skimming flow regime on embankment stepped spillways." Journal
of Hydraulic Research, IAHR, Vol. 49, No. 5, pp. 639–648 (DOI: 10.1080/00221686.2011.584372).
Bung, D.B. (2013)."Non-intrusive detection of air–water surface roughness in self-aerated chute flows."
Journal of Hydraulic Research, IAHR, Vol. 51, No. 3, pp. 322-329 (DOI:
10.1080/00221686.2013.777373).
Carosi, G., and Chanson, H. (2008). "Turbulence Characteristics in Skimming Flows on Stepped Spillways."
Canadian Journal of Civil Engineering, Vol. 35, No. 9, pp. 865-880 (DOI:10.1139/L08-030).
Chamani, M.R., and Rajaratnam, N. (1999). "Characteristics of Skimming Flow over Stepped Spillways."
Journal of Hydraulic Engineering, ASCE, Vol. 125, No. 4, pp. 361-368.
Chanson, H. (1994). "Hydraulics of skimming flows over stepped channels and spillways." Journal of
Hydraulic Research, Vol. 32, No. 3, pp. 445-460 (DOI: 10.1080/00221689409498745).
Chanson, H. (1995). "Hydraulic Design of Stepped Cascades, Channels, Weirs and Spillways." Pergamon,
Oxford, UK, Jan., 292 pages.
Chanson, H. (2000-2001). "Historical Development of Stepped Cascades for the Dissipation of Hydraulic
Energy." Transactions of the Newcomen Society, Vol. 71, No. 2, pp. 295-318.
Chanson, H. (2001). "The Hydraulics of Stepped Chutes and Spillways." Balkema, Lisse, The Netherlands,
418 pages.
Chanson, H. (2002). "Air-water flow measurements with intrusive phase-detection probes. Can we improve
their interpretation?" Journal of Hydraulic Engineering, ASCE, Vol. 128, No. 3, pp. 252-255 (DOI:
10.1061/(ASCE)0733-9429(2002)128:3(252)).
Chanson, H. (2006). "Hydraulics of skimming flows on stepped chutes: the effects of inflow conditions?"
Journal of Hydraulic Research, IAHR, Vol. 44, No. 1, pp. 51-60 (DOI:
10.1080/00221686.2006.9521660).
Chanson, H., Bung, D., and Matos, J. (2015). "Stepped spillways and cascades." in "Energy Dissipation in
Hydraulic Structures." IAHR Monograph, CRC Press, Taylor & Francis Group, Leiden, The Netherlands,
H. Chanson Editor, pp. 45-64
Chanson, H., and Carosi, G. (2007). "Turbulent time and length scale measurements in high- velocity open
ZHANG, G., and CHANSON, H. (2016). "Interactions between Free-surface Aeration and Total Pressure on a Stepped Chute." Experimental Thermal and Fluid Science, Vol. 74, pp. 368-381 (DOI: 10.1016/j.expthermflusci.2015.12.011) (ISSN 0894-1777).
15
channel flows." Experiments in Fluids, Vol. 42, No. 3, pp. 385-401 (DOI: 10.1007/s00348-006-0246-2).
Chanson, H., and Toombes, L. (2003). "Strong Interactions between Free-Surface Aeration and Turbulence
in an Open Channel Flow." Experimental Thermal and Fluid Science, Vol. 27, No. 5, pp. 525-535 (DOI:
10.1016/S0894-1777(02)00266-2).
Chanson, H., and Toombes, L. (2004). "Hydraulics of stepped chutes: the transition flow." Journal of
Hydraulic Research., IAHR, Vol. 42, No. 1, pp. 43-54 (DOI: 10.1080/00221686.2004.9641182).
Chanson, H., Yasuda, Y., and Ohtsu, I. (2002). "Flow resistance in skimming flows and its modelling."
Canadian Journal of Civil Engineering, Vol. 29, No. 6, pp. 809-819 (DOI: 10.1139/l02-083).
Ditchey, E.J., and Campbell, D.B. (2000). "Roller Compacted Concrete and Stepped Spillways." Intl
Workshop on Hydraulics of Stepped Spillways, Zürich, Switzerland, H.E. Minor & W.H. Hager Editors,
Balkema Publ., pp. 171-178.
Felder, S. (2013). "Air-water flow properties on stepped spillways for embankment dams. Aeration, energy
dissipation and turbulence on uniform, non-uniform and pooled stepped chutes." Ph.D. thesis, School of
Civil Engineering, The University of Queensland, Brisbane, Australia.
Felder, S., and Chanson, H. (2009). "Turbulence, dynamic similarity and scale effects in high-velocity free-
surface flows above a stepped chute." Experiments in Fluids, Vol. 47, No. 1, pp. 1-18 (DOI:
10.1007/s00348-009-0628-3).
Felder, S., and Chanson, H. (2011). "Air-water flow properties in step cavity down a stepped chute."
International Journal of Multiphase Flow, Vol. 37, No. 7, pp. 732–745 (DOI:
10.1016/j.ijmultiphaseflow.2011.02.009).
Felder, S., and Chanson, H. (2014). "Effects of step pool porosity upon flow aeration and energy dissipation
on pooled stepped spillways." Journal of Hydraulic Engineering, ASCE, Vol. 140, No. 4, Paper
04014002, 11 pages (DOI: 10.1061/(ASCE)HY.1943-7900.0000858).
Felder, S., and Chanson, H. (2015). "Phase-detection probe measurements in high-velocity free-surface flows
including a discussion of key sampling parameters." Experimental Thermal and Fluid Science, Vol. 61,
pp. 66-78 (DOI: 10.1016/j.expthermflusci.2014.10.009).
Gonzalez, C.A., and Chanson, H. (2004). "Interactions between cavity flow and main stream skimming
flows: an experimental study." Canadian Journal of Civil Engineering, Vol. 31, No. 1, pp. 33-44 (DOI:
10.1139/l03-066).
Henderson, F.M. (1966). "Open Channel Flow." MacMillan Company, New York, USA.
Hinze, J. O., "Fundamentals of the hydrodynamics mechanisms of splitting in dispersion process." Journal of
American Institute of Chemical Engineers, Vol. 1, No. 3, 1955, pp. 289-295 (DOI:
10.1002/aic.690010303).
Horner, M.W. (1969). "An analysis of flow on cascades of steps." Ph.D. Thesis, University of Birmingham,
UK, 357 pages.
Hunt, S.L., Kadavy, K.C., Abt, S.R., and Temple, D.M. (2008). "Impact of Converging Chute Walls for
ZHANG, G., and CHANSON, H. (2016). "Interactions between Free-surface Aeration and Total Pressure on a Stepped Chute." Experimental Thermal and Fluid Science, Vol. 74, pp. 368-381 (DOI: 10.1016/j.expthermflusci.2015.12.011) (ISSN 0894-1777).
16
Roller Compacted Concrete Stepped Spillways." Journal of Hydraulic Engineering, ASCE, Vol. 134, No.
7, pp. 1000-1003 (DOI: 10.1061/(ASCE)0733-9429(2008)134:7(1000)).
Kolmogorov, A. N. (1949). "On the disintegration of drops in a turbulent flow." Doklady Akad. Nauk.,
SSSR, Vol. 66, 194H p. 825.
Matos, J. (2000). "Hydraulic design of stepped spillways over RCC dams." Proc. The International
Workshop on Hydraulics of Stepped Spillways, Zürich, March 22-24, 2000, pp. 187-194.
Montes, J.S. (1998). "Hydraulics of Open Channel Flow." ASCE Press, New-York, USA, 697 pages.
Ohtsu, I., and Yasuda, Y. (1997). "Characteristics of flow conditions on stepped channels." Proc. 27th IAHR
Biennal Congress, San Francisco, USA, Theme D, pp. 583-588.
Ohtsu, I., Yasuda, Y., and Takahashi, M. (2004). "Flow characteristics of skimming flows in stepped
channels." Journal of Hydraulic Engineering, ASCE, Vol. 130, No. 9, pp. 860-869 (DOI:
10.1061/(asce)0733-9429(2004)130:9(860)).
Peyras, L., Royet, P., and Degoutte, G. (1992). "Flow and energy dissipation over stepped gabion weirs."
Journal of Hydraulic Engineering, ASCE, Vol. 118, No. 5, pp. 707-717 (DOI: 10.1061/(asce)0733-
9429(1992)118:5(707)).
Pfister, M. (2009). "Effect of Control Section on Stepped Spillway flow." Proc. 33rd IAHR Biennial
Congress, IAHR-ASCE-EWRI, Vancouver, Canada, 9-14 Aug., 8 pages.
Rajaratnam, N. (1976). "Turbulent jets." Development in water science, Vol. 5. Elsevier Scientific, New
York, N.Y., USA.
Rajaratnam, N. (1990). "Skimming flow in stepped spillways." Journal of Hydraulic Engineering, ASCE,
Vol. 116, No. 4, pp. 587-591 (DOI: 10.1061/(asce)0733-9429(1990)116:4(587)).
Ruff, J.F., and Frizell, K.H. (1994). "Air Concentration Measurements in Highly-Turbulent Flow on a
Steeply-Sloping Chute." Proc. Hydraulic Engineering Conf., ASCE, Buffalo, USA, Vol. 2, pp. 999-1003.
Schlichting, H. (1979). "Boundary Layer Theory." McGraw-Hill, New York, USA, 7th edition.
Sevik M., Park S. H. (1973). "The splitting of drops and bubbles by turbulent fluid flow." Journal of Fluids
Engineering, Vol. 95, No. 1, pp. 53-60 (8 pages), (DOI:10.1115/1.3446958).
Sorensen, R.M. (1985). "Stepped spillway hydraulic model investigation." Journal of Hydraulic Engineering,
ASCE, Vol. 111, No.12, pp. 1461-1472 (DOI: 10.1061/(ASCE)0733-9429(1985)111:12(1461)).
Takahashi, M., Gonzalez, C.A., and Chanson, H. (2006). "Self-Aeration and Turbulence in a Stepped
Channel: Influence of Cavity Surface Roughness." International Journal of Multiphase Flow, Vol. 32, pp.
1370-1385 (DOI:10.1016/j.ijmultiphaseflow.2006.07.001).
Takahashi, M., and Ohtsu, I. (2012). "Aerated flow characteristics of skimming flow over stepped chutes."
Journal of Hydraulic Research, Vol. 50, Issue 4, pp. 427-434 (DOI: 10.1080/00221686.2012.702859).
Tennekes, H., and Lumley, J. L. (1972). "A first course in turbulence." MIT Press, USA, 300 pages.
Toombes, L. (2002). "Experimental study of air-water flow properties on low-gradient stepped cascades."
Ph.D. Thesis, Dept. of Civil Engineering, University of Queensland, Australia.
ZHANG, G., and CHANSON, H. (2016). "Interactions between Free-surface Aeration and Total Pressure on a Stepped Chute." Experimental Thermal and Fluid Science, Vol. 74, pp. 368-381 (DOI: 10.1016/j.expthermflusci.2015.12.011) (ISSN 0894-1777).
17
Toombes, L., and Chanson, H. (2008). "Interfacial aeration and bubble count rate distributions in a
supercritical flow past a backward-facing step." International Journal of Multiphase Flow, Vol. 34, No. 5,
pp. 427-436 (doi.org/10.1016/j.ijmultiphaseflow.2008.01.005).
Wang, H., Murzyn, F., and Chanson, H. (2014). "Total pressure fluctuations and two-phase flow turbulence
in hydraulic jumps." Experiments in Fluids, Vol. 55, No. 11, Paper 1847, 16 pages (DOI:
10.1007/s00348-014-1847-9).
Wuthrich, D, and Chanson, H. (2014). "Hydraulics, air entrainment and energy dissipation on gabion stepped
weir." Journal of Hydraulic Engineering, ASCE, Vol. 140, No. 9, Paper 04014046, 10 pages (DOI:
10.1061/(ASCE)HY.1943-7900.0000919).
Wygnanski, I., and Fiedler, H.E. 1970. "The two-dimensional mixing region." Journal of Fluid Mechanics,
Vol. 41, No 2, pp. 327–361 (10.1017/S0022112070000630).
Zhang, G., and Chanson, H. (2015). "Hydraulics of the developing flow region of stepped cascades: an
Experimental Investigation." Hydraulic Model Report No. CH97/15, School of Civil Engineering, The
University of Queensland, Brisbane, Australia, 76 pages.
Zhang, G., and Chanson, H. (2016). " Gabion Stepped Spillway: Interactions between 3 3 Free-Surface,
Cavity, and Seepage Flows." Journal of Hydraulic Engineering, ASCE, Vol. 142 (DOI:
10.1061/(ASCE)11 HY.1943-7900.0001120). (In Print)
ZHANG, G., and CHANSON, H. (2016). "Interactions between Free-surface Aeration and Total Pressure on a Stepped Chute." Experimental Thermal and Fluid Science, Vol. 74, pp. 368-381 (DOI: 10.1016/j.expthermflusci.2015.12.011) (ISSN 0894-1777).
18
Table 1 - Experimental flow conditions
Study Type Q (m3/s) dc/h Re Locations Flow Regime Remarks Visual
observations 0.001 –
0.24 0.045 –
1.8 4×10⁴ – 9.7×10⁵
Step edges 1 – 12 Nappe, transition, skimming
Clear water flow and aerated flow
Air-water flow measurements
0.057 – 0.216
0.7 – 1.7 2.3×10⁵ – 8.7×10⁵
Step edges 5 – 12 Transition, skimming
Aerated flow
0.083 – 0.179
0.9 – 1.5 3.3×10⁵ – 8.5×10⁵
Step cavities 7 – 9& 11 – 12
Skimming Aerated flow
Total pressure & air-water
measurements
0.083 – 0.216
0.9 – 1.7 3.3×10⁵ – 8.7×10⁵
Step edges 5 – 12 Skimming Aerated flow
Notes: Q: water discharge; Re: Reynolds number defined in terms of hydraulic diameter.
Table 2 - Relationship between interfacial turbulence intensity and bubble count rate in skimming flows on
stepped spillways: observed values of C1 and p (Eq. (9))
Reference θ (°) C1 p Remarks Present study 45.0 0.24 0.39 Flat steps. Re = 2.3105 – 8.8105
0.55 0.5 Flat steps Wuthrich & Chanson (2014) 26.6 0.25 0.25 Gabion steps
Felder (2013) 26.6 0.19 0.54 Flat steps Toombes & Chanson (2003) 21.8
15.9 - 1.5 Flat steps
ZHANG, G., and CHANSON, H. (2016). "Interactions between Free-surface Aeration and Total Pressure on a Stepped Chute." Experimental Thermal and Fluid Science, Vol. 74, pp. 368-381 (DOI: 10.1016/j.expthermflusci.2015.12.011) (ISSN 0894-1777).
19
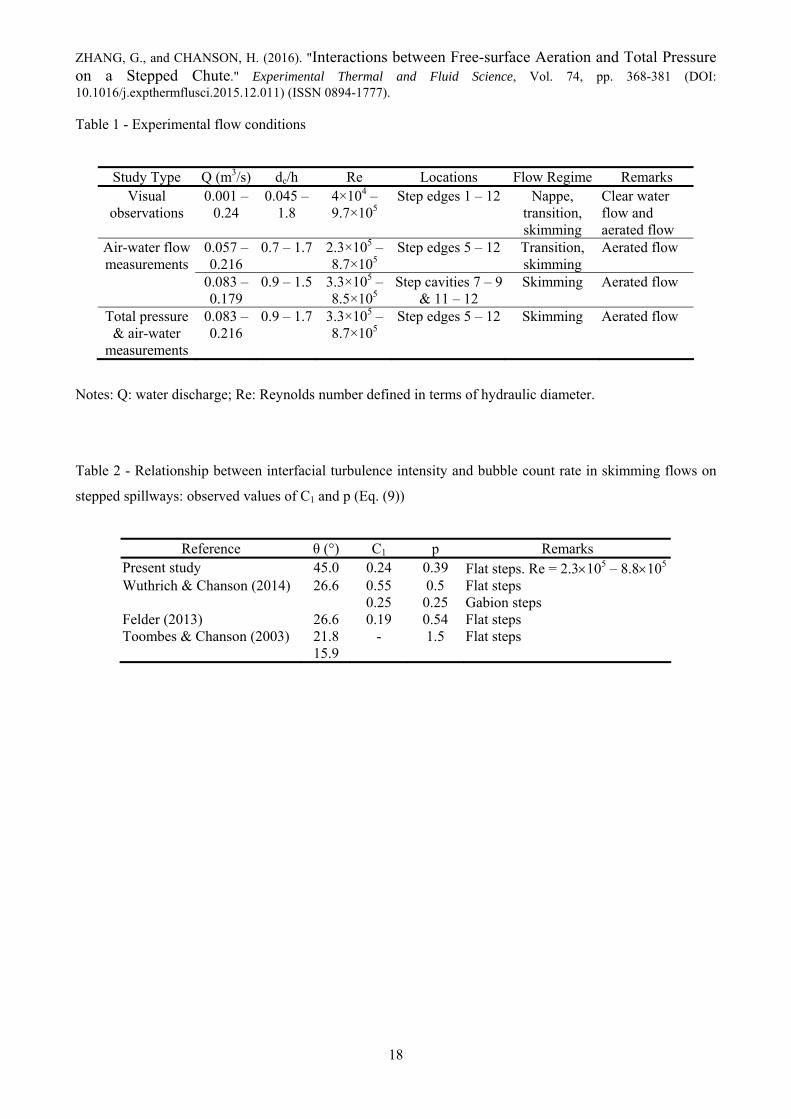
Fig. 1 - Hinze dam stepped spillway in operation on 2 May 2015 (θ = 51.3°, h = 1.2 m, q = 2.15 m2/s, Re =
8.5×10⁶)
(A) View from downstream
(B) View from the spillway crest
ZHANG, G., and CHANSON, H. (2016). "Interactions between Free-surface Aeration and Total Pressure on a Stepped Chute." Experimental Thermal and Fluid Science, Vol. 74, pp. 368-381 (DOI: 10.1016/j.expthermflusci.2015.12.011) (ISSN 0894-1777).
20
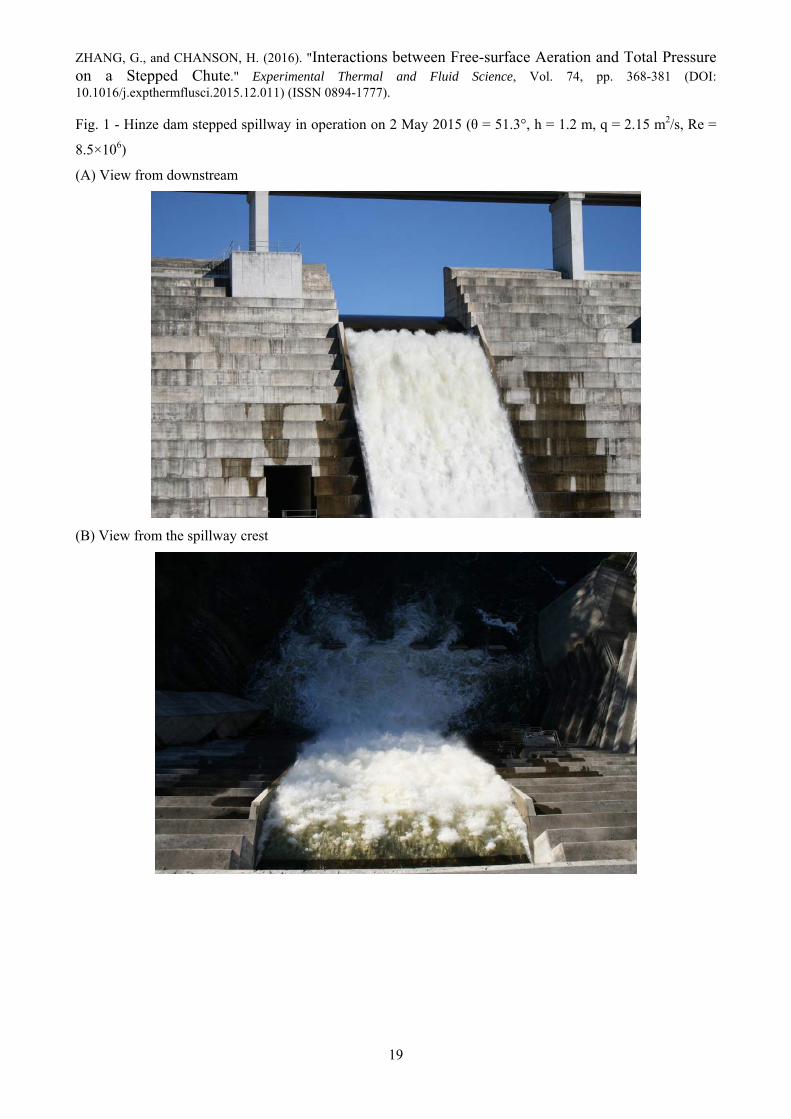
Fig. 2 - Skimming flows above the stepped spillway model ( = 45º, h = 0.1 m, l = 0.1 m)
(A) General view - Flow conditions: dc/h = 1.08, Re = 4.4×10⁵
(B) Skimming flow above cavity recirculations, with flow direction from right to left - Flow conditions: dc/h
= 1.2, Re = 5.2×10⁵
ZHANG, G., and CHANSON, H. (2016). "Interactions between Free-surface Aeration and Total Pressure on a Stepped Chute." Experimental Thermal and Fluid Science, Vol. 74, pp. 368-381 (DOI: 10.1016/j.expthermflusci.2015.12.011) (ISSN 0894-1777).
21
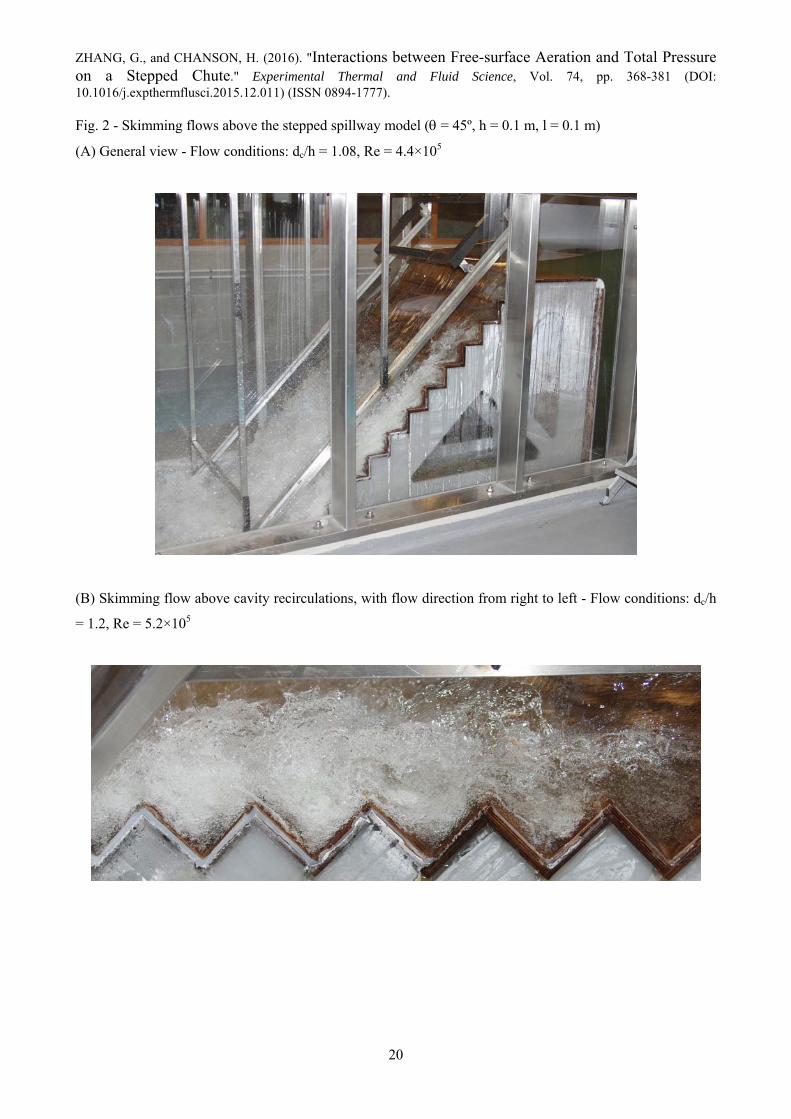
(C) Looking downstream at the upper spray region and splash structures, with the broad-crested weir
overflow in foreground - Flow conditions: dc/h = 1.5, Re = 7.2×10⁵
ZHANG, G., and CHANSON, H. (2016). "Interactions between Free-surface Aeration and Total Pressure on a Stepped Chute." Experimental Thermal and Fluid Science, Vol. 74, pp. 368-381 (DOI: 10.1016/j.expthermflusci.2015.12.011) (ISSN 0894-1777).
22
Fig. 3 - Definition sketch of stepped spillway model
Upstream rounding
Small rounding
Step edge 1
Tail race channel
45°
0 10 30 90 cm
2.4 cm
H1
Lcrest = 0.6 m
Outer edge of boundary layer
Inception point
ZHANG, G., and CHANSON, H. (2016). "Interactions between Free-surface Aeration and Total Pressure on a Stepped Chute." Experimental Thermal and Fluid Science, Vol. 74, pp. 368-381 (DOI: 10.1016/j.expthermflusci.2015.12.011) (ISSN 0894-1777).
23
Fig. 4 - Void fraction and bubble count rate distributions in the air-water flow region – Geometry: θ = 45°, h
= 0.10 m
(A) Void fraction, dc/h = 0.7, transition flow (B) Void fraction, dc/h = 1.3, skimming flow
C
y/Y
90
0 0.1 0.2 0.3 0.4 0.5 0.6 0.7 0.8 0.9 10
0.4
0.8
1.2
1.6
2Step 5Step 6Step 7Step 8Step 9
Step 10Step 11Step 12Theory: step 5Theory: step 12
C
y/Y
90
0 0.1 0.2 0.3 0.4 0.5 0.6 0.7 0.8 0.9 10
0.2
0.4
0.6
0.8
1
1.2
1.4
1.6 Step 7Step 8Step 9Step 10Step 11Step 12Theory: step 7Theory: step 12
(C) Bubble count rate, dc/h = 0.7, transition flow (B) Bubble count rate, dc/h = 1.3, skimming flow
Fdc/Vc
y/d c
0 3 6 9 12 15 18 21 24 27 300
0.4
0.8
1.2
1.6
2
Step 5Step 6Step 7Step 8Step 9Step 10Step 11Step 12
Fdc/Vc
y/d c
0 2.5 5 7.5 10 12.5 15 17.5 20 22.5 250
0.2
0.4
0.6
0.8
1 Step 7Step 8Step 9Step 10Step 11Step 12
ZHANG, G., and CHANSON, H. (2016). "Interactions between Free-surface Aeration and Total Pressure on a Stepped Chute." Experimental Thermal and Fluid Science, Vol. 74, pp. 368-381 (DOI: 10.1016/j.expthermflusci.2015.12.011) (ISSN 0894-1777).
24
Fig. 5 - Longitudinal variation of the velocity power law exponent N
(x-xi)/Lcav
N
0 2 4 6 80
5
10
15
20dc/h = 0.9dc/h = 1.0
dc/h = 1.1dc/h = 1.3
dc/h = 1.5dc/h = 1.7
Fig. 6 - Turbulence intensity distributions in air-water skimming flow - Flow conditions: θ = 45°, h = 0.10 m,
dc/h =0.9, Re = 3.3×10⁵, interfacial turbulence intensity
Tu
y/Y
90
0 0.4 0.8 1.2 1.6 2 2.4 2.8 3.20
0.2
0.4
0.6
0.8
1
1.2
1.4
1.6
1.8 Step edge 5Step edge 6Step edge 7Step edge 8Step edge 9Step edge 10Step edge 11Step edge 12
ZHANG, G., and CHANSON, H. (2016). "Interactions between Free-surface Aeration and Total Pressure on a Stepped Chute." Experimental Thermal and Fluid Science, Vol. 74, pp. 368-381 (DOI: 10.1016/j.expthermflusci.2015.12.011) (ISSN 0894-1777).
25
Fig. 7 - Distributions of total pressure and void fraction in air-water skimming flows - Comparison between
total pressure sensor and Equation (5)
(A) dc/h = 0.9, step edge 12 (B) dc/h = 1.7, step edge 9 (inception point)
Pt/(wgY90cos), 15C
y/Y
90
0 2 4 6 8 10 12 14 160
0.2
0.4
0.6
0.8
1
1.2
1.4Pt Eq. (5) C
Pt/(wgY90cos), 15C
y/Y
90
0 2 4 6 8 10 12 14 160
0.2
0.4
0.6
0.8
1
1.2
1.4Pt Eq. (5) C
ZHANG, G., and CHANSON, H. (2016). "Interactions between Free-surface Aeration and Total Pressure on a Stepped Chute." Experimental Thermal and Fluid Science, Vol. 74, pp. 368-381 (DOI: 10.1016/j.expthermflusci.2015.12.011) (ISSN 0894-1777).
26
Fig. 8 - Dimensionless distributions of total pressure fluctuations in the air-water flow region in skimming
flows
(A) Distributions of total pressure fluctuations - Flow conditions: dc/h = 1.7, Re = 8.7×10⁵
(pt2)0.5/(wgY90cos)
y/Y
90
0 1 2 3 4 5 6 7 8 9 100
0.2
0.4
0.6
0.8
1
1.2
1.4Step edge 5Step edge 6Step edge 7Step edge 8
(B) Relationship between dimensionless bubble count rate and total pressure fluctuations - Flow conditions:
dc/h = 0.9, Re = 3.3×10⁵
F/Fmax
(pt2 )0.
5 /(p t
2 ) max
0.5
0 0.2 0.4 0.6 0.8 10
0.2
0.4
0.6
0.8
1
Step edge 5Step edge 6Step edge 7Step edge 8
Step edge 9Step edge 10Step edge 11Step edge 12
ZHANG, G., and CHANSON, H. (2016). "Interactions between Free-surface Aeration and Total Pressure on a Stepped Chute." Experimental Thermal and Fluid Science, Vol. 74, pp. 368-381 (DOI: 10.1016/j.expthermflusci.2015.12.011) (ISSN 0894-1777).
27
Fig. 9 - Turbulence intensity in the water phase of air-water skimming flow - Flow conditions: θ = 45°, h =
0.10 m, dc/h =0/9, Re = 3.3×10⁵, water phase turbulence intensity
Tup
y/Y
90
0 0.1 0.2 0.3 0.4 0.5 0.60
0.2
0.4
0.6
0.8
1
1.2
1.4
1.6
1.8
Step edge 5Step edge 6Step edge 7Step edge 8Step edge 9Step edge 10Step edge 11Step edge 12
ZHANG, G., and CHANSON, H. (2016). "Interactions between Free-surface Aeration and Total Pressure on a Stepped Chute." Experimental Thermal and Fluid Science, Vol. 74, pp. 368-381 (DOI: 10.1016/j.expthermflusci.2015.12.011) (ISSN 0894-1777).
28
Fig. 10 - Void fraction distributions above step cavities in skimming flows - Flow conditions: dc/h = 0.9, Re
= 3.3×10⁵, inception point at step edge 5
(A) Void fraction distribution above step cavity
(B) Longitudinal variation of void fraction at pseudo-bottom (y = 0)
C
y/y 9
0
0.1 0.2 0.3 0.4 0.5 0.6 0.7 0.8 0.9 10
0.25
0.5
0.75
1
1.25
1.5
1.75
2
2.25xs/Lcav = 0.13xs/Lcav = 0.26xs/Lcav = 0.33xs/Lcav = 0.45xs/Lcav = 0.52xs/Lcav = 0.62xs/Lcav = 0.63xs/Lcav = 0.72xs/Lcav = 0.82Theory - xs/Lcav = 0.82
xs/Lcav
C0
0 0.1 0.2 0.3 0.4 0.5 0.6 0.7 0.80
0.05
0.1
0.15
0.2
0.25
0.3
(C) Void fraction contours between step edges 7 - 9 - Flow direction from left to right
ZHANG, G., and CHANSON, H. (2016). "Interactions between Free-surface Aeration and Total Pressure on a Stepped Chute." Experimental Thermal and Fluid Science, Vol. 74, pp. 368-381 (DOI: 10.1016/j.expthermflusci.2015.12.011) (ISSN 0894-1777).
29
Fig. 11 - Interfacial velocity distributions above step cavities in skimming flows
(A) Velocity contours between step edges 7 - 9 – Flow conditions: dc/h = 0.9, inception point at step edge 5,
flow direction from left to right
Vaw/Vc
(B) Velocity contours between step edges 7 - 9 – Flow conditions: dc/h = 1.3, inception point at step edge 7,
flow direction from left to right
Vaw/Vc
ZHANG, G., and CHANSON, H. (2016). "Interactions between Free-surface Aeration and Total Pressure on a Stepped Chute." Experimental Thermal and Fluid Science, Vol. 74, pp. 368-381 (DOI: 10.1016/j.expthermflusci.2015.12.011) (ISSN 0894-1777).
30
(C) Velocity profiles in the air-water shear layer – Flow conditions: h = 0.10 m, dc/h = 0.9, 1.1, 1.3, 1.5, θ =
45° - Comparison with Goertler and Tollmien solutions for developing shear layers
K(y-y50)/xs
Vx/
V0
-2 -1.5 -1 -0.5 0 0.5 1 1.5 2
0.2
0.4
0.6
0.8
1
-2 -1.5 -1 -0.5 0 0.5 1 1.5 2
0.2
0.4
0.6
0.8
1
Present study - all dataGoertlerTollmien
Fig. 12 - Turbulence intensity distributions over step cavities in skimming flow
(A) dc/h = 1.5, inception point at step edge 7 - Comparison with data of Gonzalez and Chanson (2004) and
Felder and Chanson (2011)
Tu
y/d c
0 0.5 1 1.5 2 2.5 3 3.5-0.4
-0.2
0
0.2
0.4
0.6
0.8
1
1.2
xs/Lcav = 0.24 (step cavity 10-11)xs/Lcav = 0.42 (step cavity 10-11)xs/Lcav = 0.57 (step cavity 10-11)xs/Lcav = 0.75 (step cavity 10-11)xs/Lcav = 0.17 (step cavity 11-12)xs/Lcav = 0.41 (step cavity 11-12)xs/Lcav = 0.66 (step cavity 11-12)xs/Lcav = 0.81 (step cavity 11-12)step edge 10step edge 11Felder & Chanson, =26.6, dc/h=1.33Gonzalez & Chanson, =15.9, dc/h=1.7
ZHANG, G., and CHANSON, H. (2016). "Interactions between Free-surface Aeration and Total Pressure on a Stepped Chute." Experimental Thermal and Fluid Science, Vol. 74, pp. 368-381 (DOI: 10.1016/j.expthermflusci.2015.12.011) (ISSN 0894-1777).
31
(B) Turbulence intensity contours above step cavities – Flow conditions: dc/h = 0.9, inception point at step
edge 5, Flow direction from left to rights
(C) Turbulence intensity contours above step cavities – Flow conditions: dc/h = 1.5, inception point at step
edge 7, Flow direction from left to rights
ZHANG, G., and CHANSON, H. (2016). "Interactions between Free-surface Aeration and Total Pressure on a Stepped Chute." Experimental Thermal and Fluid Science, Vol. 74, pp. 368-381 (DOI: 10.1016/j.expthermflusci.2015.12.011) (ISSN 0894-1777).
32
Fig. 13 - Relationship between dimensionless bubble count rate Fdc/Vc and interfacial turbulence intensity
Tu - Comparison with Equation (9)
Fdc/Vc
Tu
0 5 10 15 20 25 300
0.2
0.4
0.6
0.8
1
1.2
1.4
1.6
1.8All data (x-xi)/dc > 3Correlation
ZHANG, G., and CHANSON, H. (2016). "Interactions between Free-surface Aeration and Total Pressure on a Stepped Chute." Experimental Thermal and Fluid Science, Vol. 74, pp. 368-381 (DOI: 10.1016/j.expthermflusci.2015.12.011) (ISSN 0894-1777).
33
Fig. 14 - Dimensionless relationship between bubble count rate and Tu6/5C(1-C) in skimming flow:
comparison with Equations (15a) and (15b) - Arrows indicate trend of increasing elevation and increasing
time-averaged void fraction - Flow conditions: dc/h = 0.9, 1.0, 1.1, 1.3, θ = 45°, step edge 12
ZHANG, G., and CHANSON, H. (2016). "Interactions between Free-surface Aeration and Total Pressure on a Stepped Chute." Experimental Thermal and Fluid Science, Vol. 74, pp. 368-381 (DOI: 10.1016/j.expthermflusci.2015.12.011) (ISSN 0894-1777).
34
Fig. 15 -Dimensionless total head distributions in skimming flows - Black dots denote measurement
locations and thick black arrow points to the location of inception point of free-surface aeration
(A) dc/h = 0.9, inception point of free-surface aeration at x/Lcav = 4
(B) dc/h = 1.7, inception point of free-surface aeration at x/Lcav = 8
ZHANG, G., and CHANSON, H. (2016). "Interactions between Free-surface Aeration and Total Pressure on a Stepped Chute." Experimental Thermal and Fluid Science, Vol. 74, pp. 368-381 (DOI: 10.1016/j.expthermflusci.2015.12.011) (ISSN 0894-1777).
35
Fig. 16 - Energy dissipation along stepped chute
(A) Depth averaged total head along the chute (B) Residual head above the last step edge -
Comparison with Equations (18a) and (18b)
Step edge
Ht/H
t,cre
st
1 2 3 4 5 6 7 8 9 10 11 120
0.2
0.4
0.6
0.8
1
dc/h = 0.9dc/h = 1.1dc/h = 1.3dc/h = 1.7