Embed Size (px)
Citation preview
1
Zen and the Art ofPhylogenetically
Independent Contrasts
Theodore Garland, Jr.Department of Biology
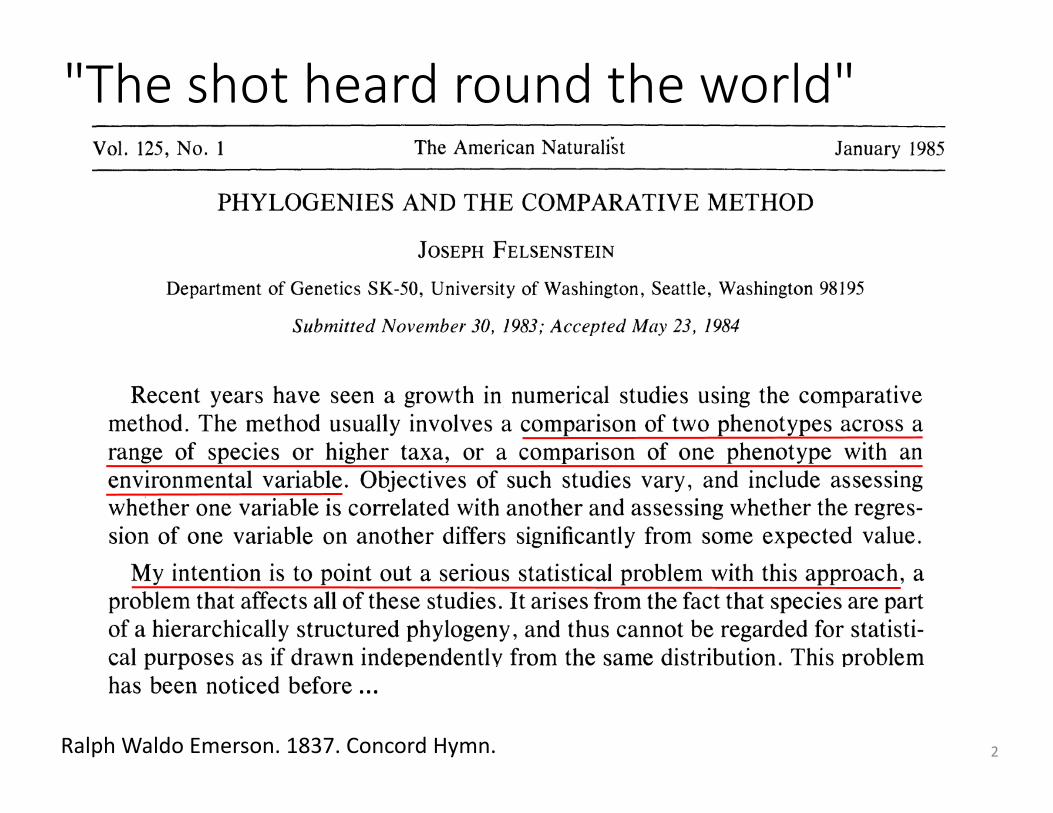
"The shot heard round the world"
2Ralph Waldo Emerson. 1837. Concord Hymn.
…
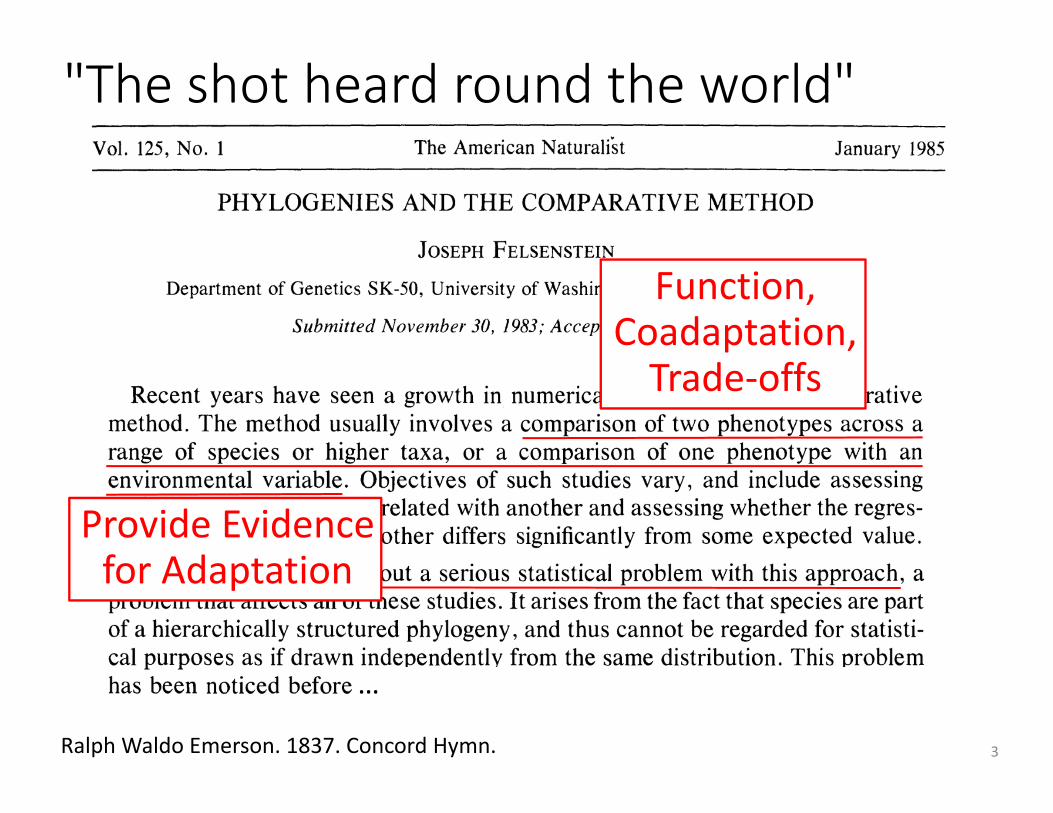
"The shot heard round the world"
3Ralph Waldo Emerson. 1837. Concord Hymn.
…
Function, Coadaptation, Trade‐offs
Provide Evidence for Adaptation
4
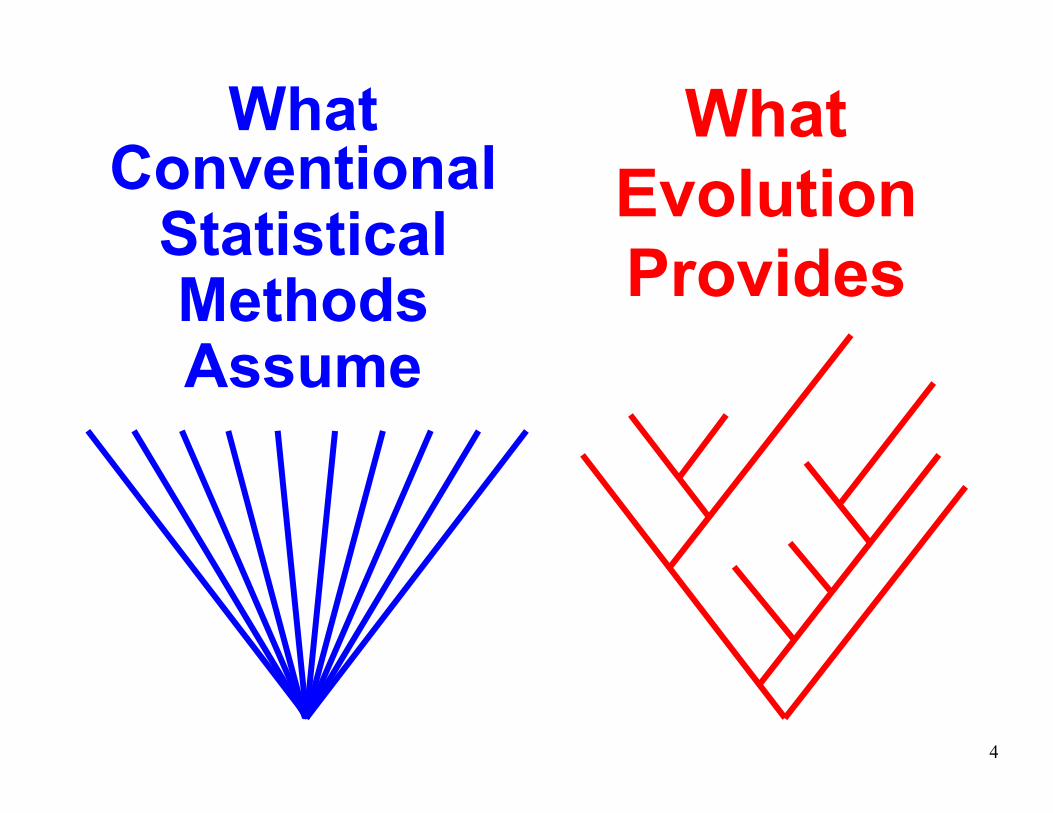
WhatConventional
StatisticalMethodsAssume
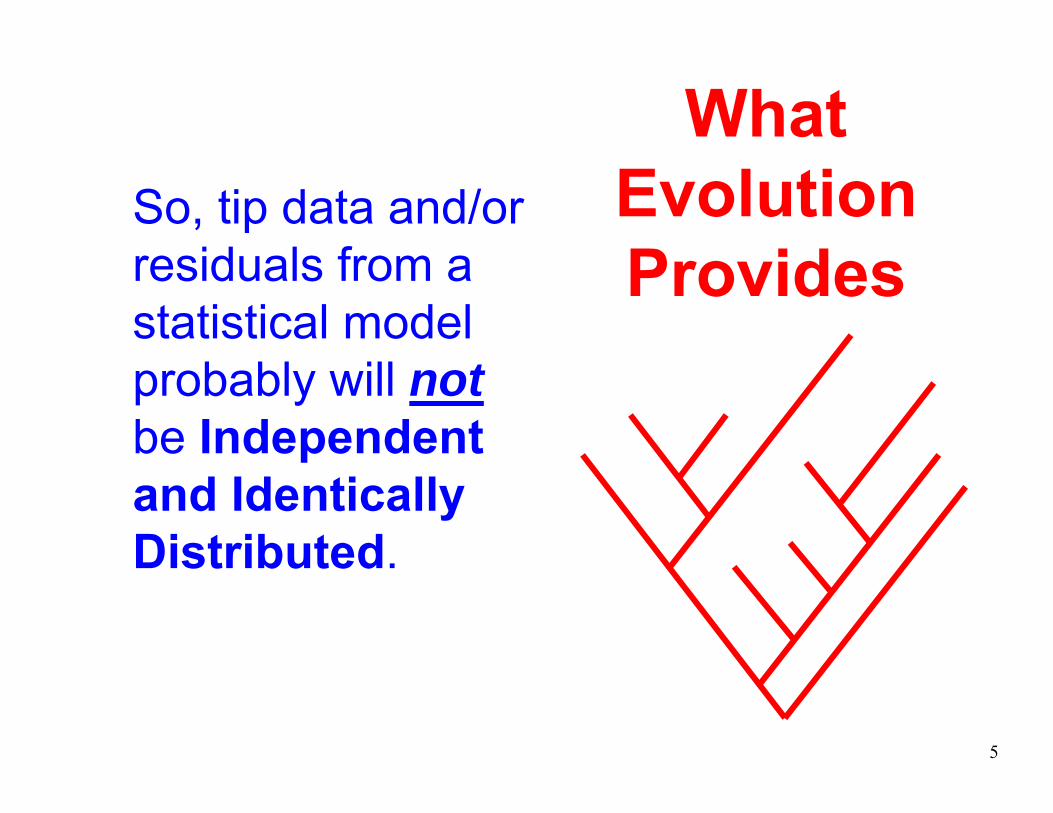
What Evolution Provides
5
So, tip data and/or residuals from a statistical model probably will notbe Independent and Identically Distributed.
What Evolution Provides
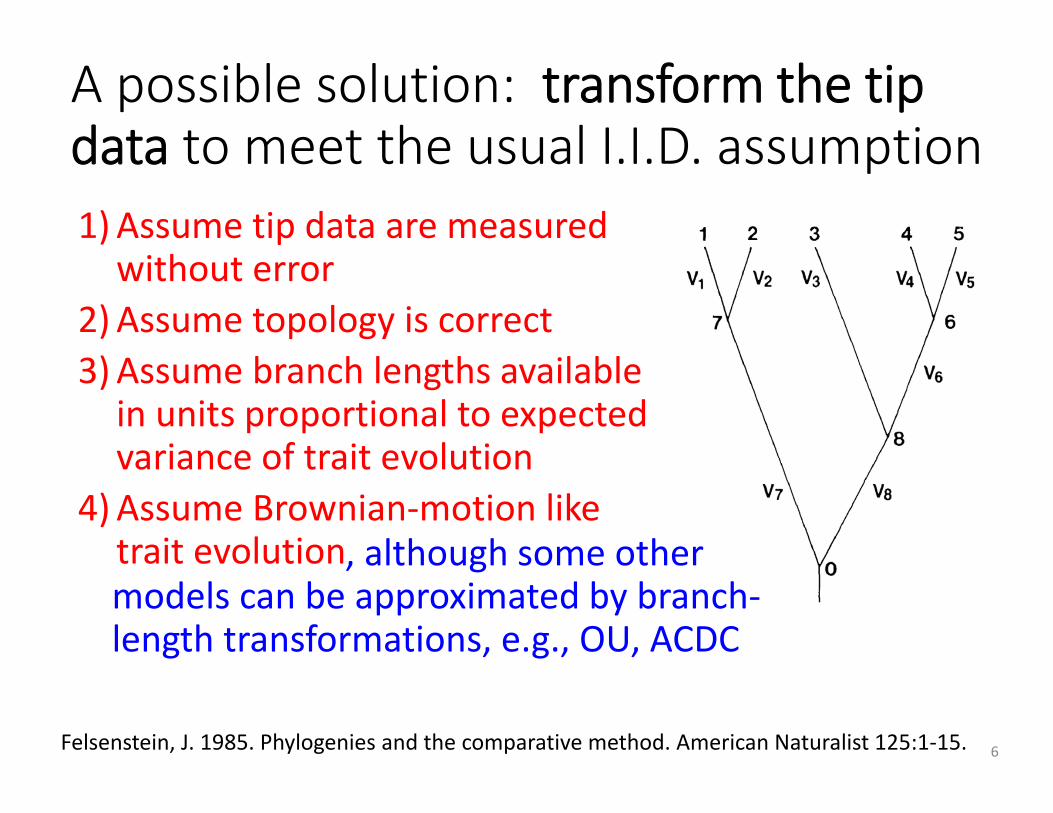
A possible solution: transform the tipdata to meet the usual I.I.D. assumption
6Felsenstein, J. 1985. Phylogenies and the comparative method. American Naturalist 125:1‐15.
1) Assume tip data are measured without error
2) Assume topology is correct3) Assume branch lengths available in units proportional to expected variance of trait evolution
4) Assume Brownian‐motion like trait evolution, although some other models can be approximated by branch‐length transformations, e.g., OU, ACDC
7
A
B
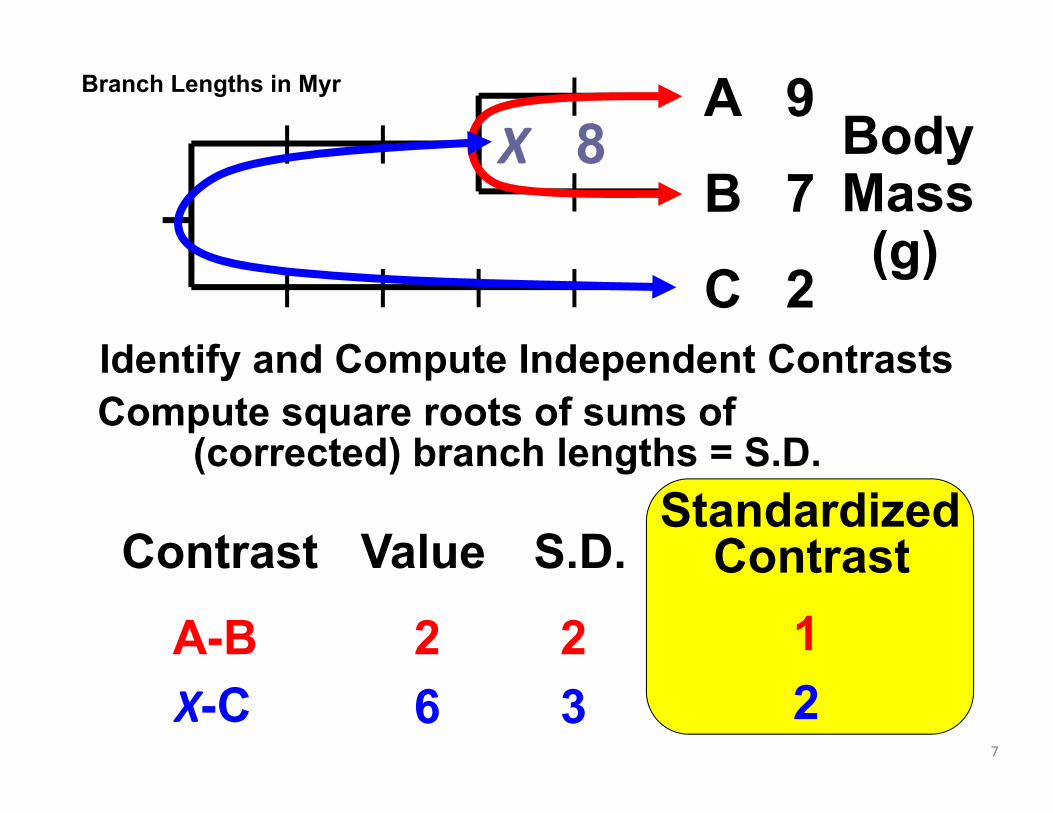
CIdentify and Compute Independent Contrasts
X 8
Contrast
A-BX-C
Value
26
StandardizedContrast
12
S.D.
23
Compute square roots of sums of(corrected) branch lengths = S.D.
9
7
2
BodyMass
(g)
Branch Lengths in Myr
8
A
B
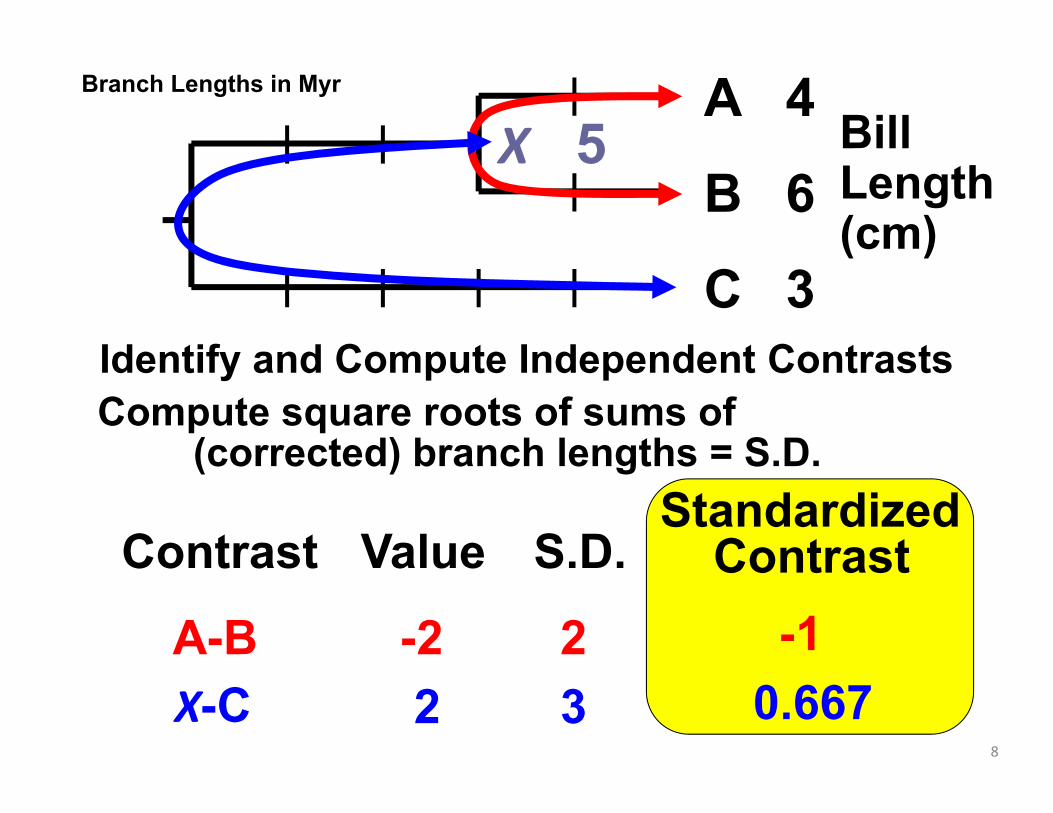
CIdentify and Compute Independent Contrasts
X 5
Contrast
A-BX-C
Value
-22
StandardizedContrast
-10.667
S.D.
23
Compute square roots of sums of(corrected) branch lengths = S.D.
4
6
3
Bill Length (cm)
Branch Lengths in Myr
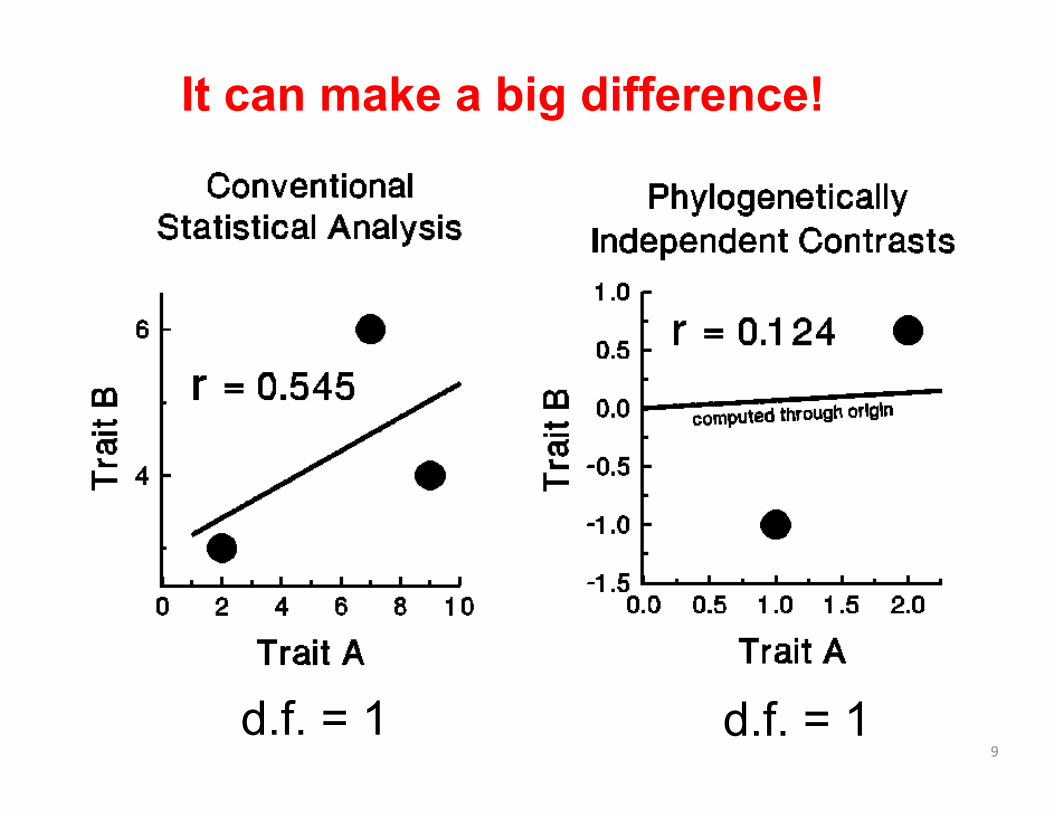
9
It can make a big difference!
d.f. = 1 d.f. = 1
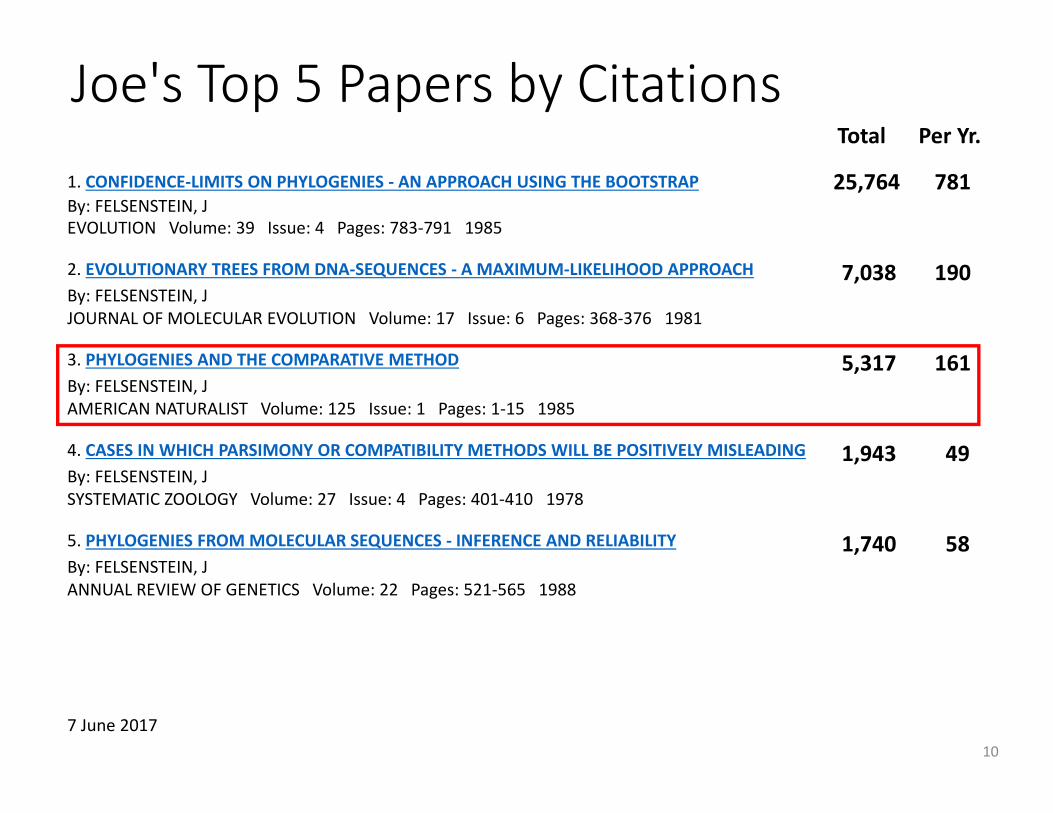
Joe's Top 5 Papers by Citations
10
Total Per Yr.
1. CONFIDENCE‐LIMITS ON PHYLOGENIES ‐ AN APPROACH USING THE BOOTSTRAP 25,764 781By: FELSENSTEIN, JEVOLUTION Volume: 39 Issue: 4 Pages: 783‐791 1985
2. EVOLUTIONARY TREES FROM DNA‐SEQUENCES ‐ A MAXIMUM‐LIKELIHOOD APPROACH 7,038 190By: FELSENSTEIN, JJOURNAL OF MOLECULAR EVOLUTION Volume: 17 Issue: 6 Pages: 368‐376 1981
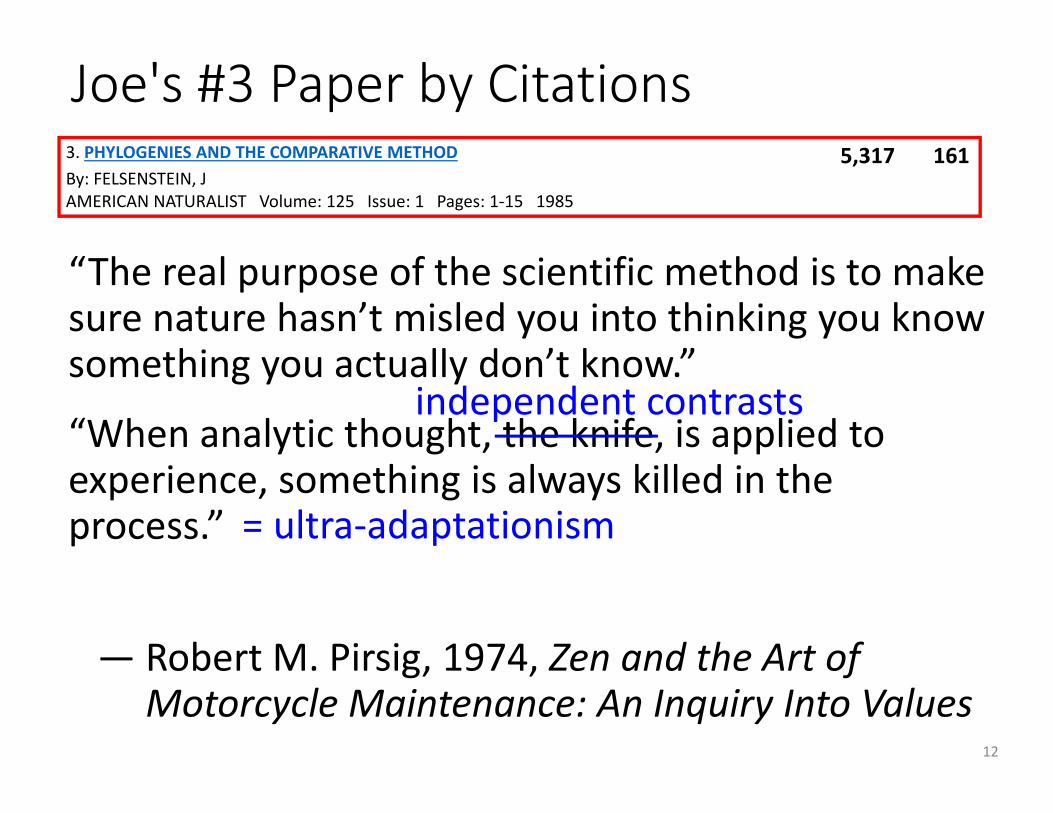
3. PHYLOGENIES AND THE COMPARATIVE METHOD 5,317 161By: FELSENSTEIN, JAMERICAN NATURALIST Volume: 125 Issue: 1 Pages: 1‐15 1985
4. CASES IN WHICH PARSIMONY OR COMPATIBILITY METHODS WILL BE POSITIVELY MISLEADING 1,943 49By: FELSENSTEIN, JSYSTEMATIC ZOOLOGY Volume: 27 Issue: 4 Pages: 401‐410 1978
5. PHYLOGENIES FROM MOLECULAR SEQUENCES ‐ INFERENCE AND RELIABILITY 1,740 58By: FELSENSTEIN, JANNUAL REVIEW OF GENETICS Volume: 22 Pages: 521‐565 1988
7 June 2017
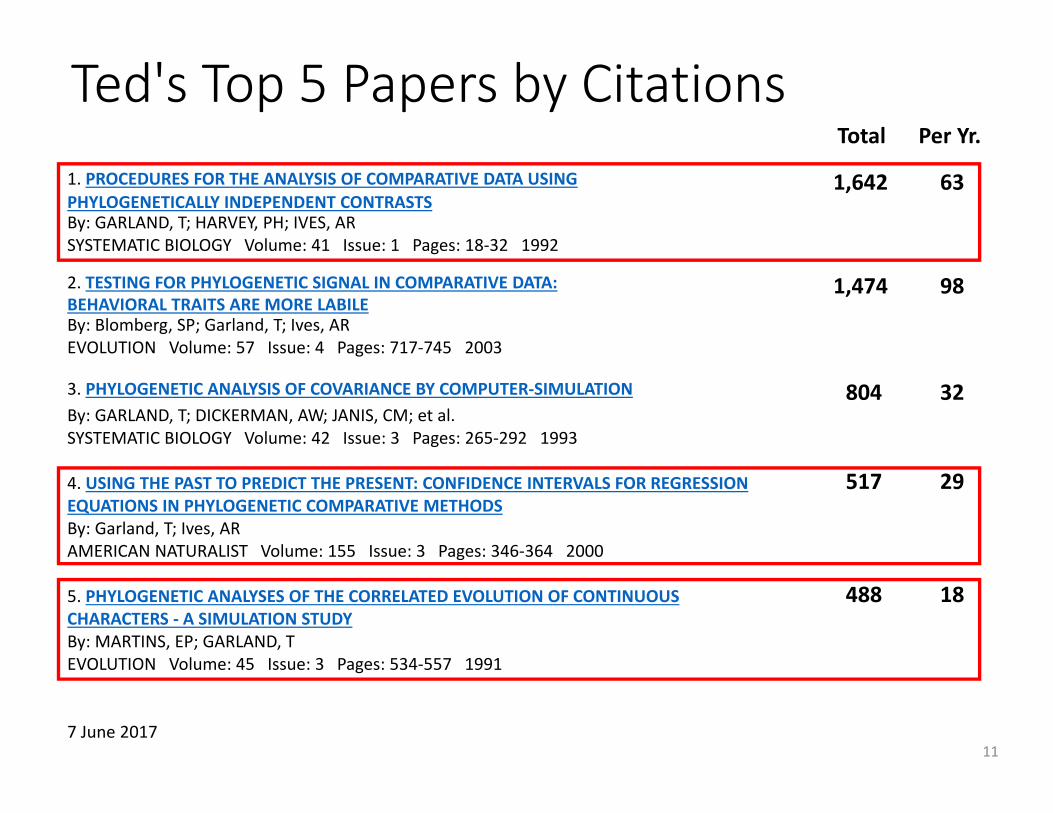
Ted's Top 5 Papers by Citations
11
Total Per Yr.
1. PROCEDURES FOR THE ANALYSIS OF COMPARATIVE DATA USING 1,642 63PHYLOGENETICALLY INDEPENDENT CONTRASTSBy: GARLAND, T; HARVEY, PH; IVES, ARSYSTEMATIC BIOLOGY Volume: 41 Issue: 1 Pages: 18‐32 1992
2. TESTING FOR PHYLOGENETIC SIGNAL IN COMPARATIVE DATA: 1,474 98BEHAVIORAL TRAITS ARE MORE LABILEBy: Blomberg, SP; Garland, T; Ives, AREVOLUTION Volume: 57 Issue: 4 Pages: 717‐745 2003
3. PHYLOGENETIC ANALYSIS OF COVARIANCE BY COMPUTER‐SIMULATION 804 32By: GARLAND, T; DICKERMAN, AW; JANIS, CM; et al.SYSTEMATIC BIOLOGY Volume: 42 Issue: 3 Pages: 265‐292 1993
4. USING THE PAST TO PREDICT THE PRESENT: CONFIDENCE INTERVALS FOR REGRESSION 517 29EQUATIONS IN PHYLOGENETIC COMPARATIVE METHODSBy: Garland, T; Ives, ARAMERICAN NATURALIST Volume: 155 Issue: 3 Pages: 346‐364 2000
5. PHYLOGENETIC ANALYSES OF THE CORRELATED EVOLUTION OF CONTINUOUS 488 18CHARACTERS ‐ A SIMULATION STUDYBy: MARTINS, EP; GARLAND, TEVOLUTION Volume: 45 Issue: 3 Pages: 534‐557 1991
7 June 2017
3. PHYLOGENIES AND THE COMPARATIVE METHOD 5,317 161By: FELSENSTEIN, JAMERICAN NATURALIST Volume: 125 Issue: 1 Pages: 1‐15 1985
Joe's #3 Paper by Citations
12
“The real purpose of the scientific method is to make sure nature hasn’t misled you into thinking you know something you actually don’t know.”
“When analytic thought, the knife, is applied to experience, something is always killed in the process.”
― Robert M. Pirsig, 1974, Zen and the Art ofMotorcycle Maintenance: An Inquiry Into Values
= ultra‐adaptationism
independent contrasts
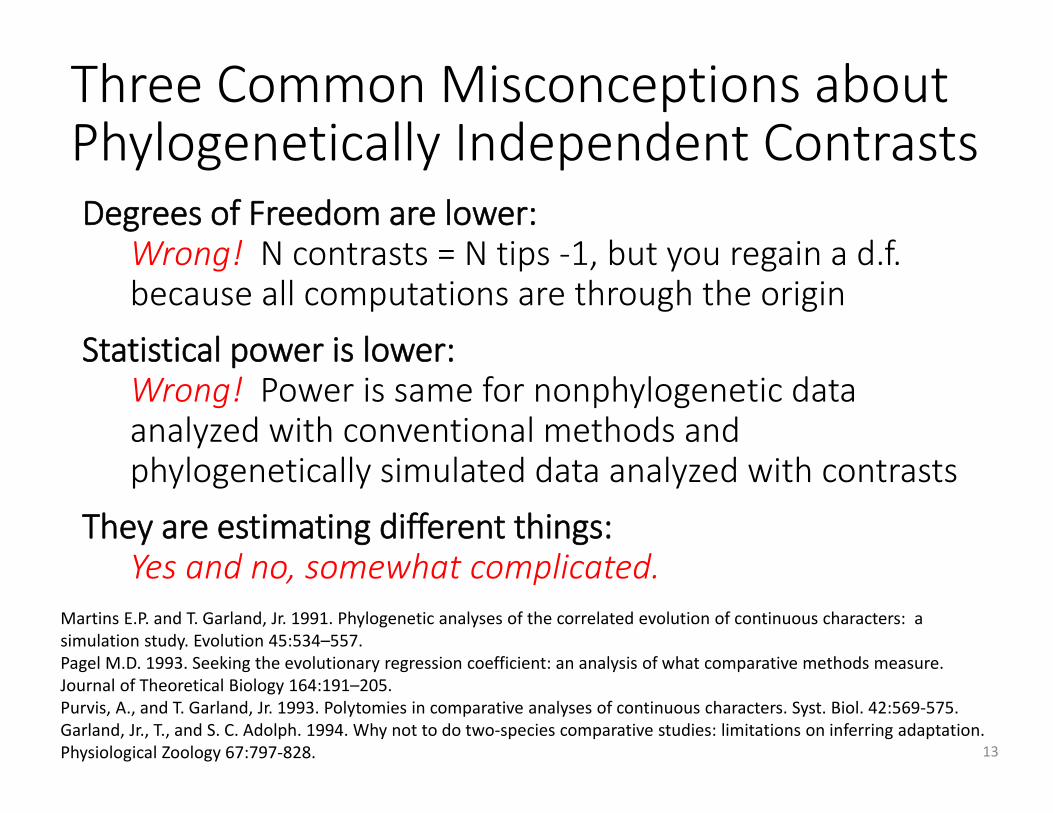
Three Common Misconceptions aboutPhylogenetically Independent Contrasts
13
Martins E.P. and T. Garland, Jr. 1991. Phylogenetic analyses of the correlated evolution of continuous characters: a simulation study. Evolution 45:534–557.Pagel M.D. 1993. Seeking the evolutionary regression coefficient: an analysis of what comparative methods measure. Journal of Theoretical Biology 164:191–205.Purvis, A., and T. Garland, Jr. 1993. Polytomies in comparative analyses of continuous characters. Syst. Biol. 42:569‐575.Garland, Jr., T., and S. C. Adolph. 1994. Why not to do two‐species comparative studies: limitations on inferring adaptation. Physiological Zoology 67:797‐828.
Degrees of Freedom are lower:Wrong! N contrasts = N tips ‐1, but you regain a d.f. because all computations are through the origin
Statistical power is lower:Wrong! Power is same for nonphylogenetic data analyzed with conventional methods and phylogenetically simulated data analyzed with contrasts
They are estimating different things:Yes and no, somewhat complicated.
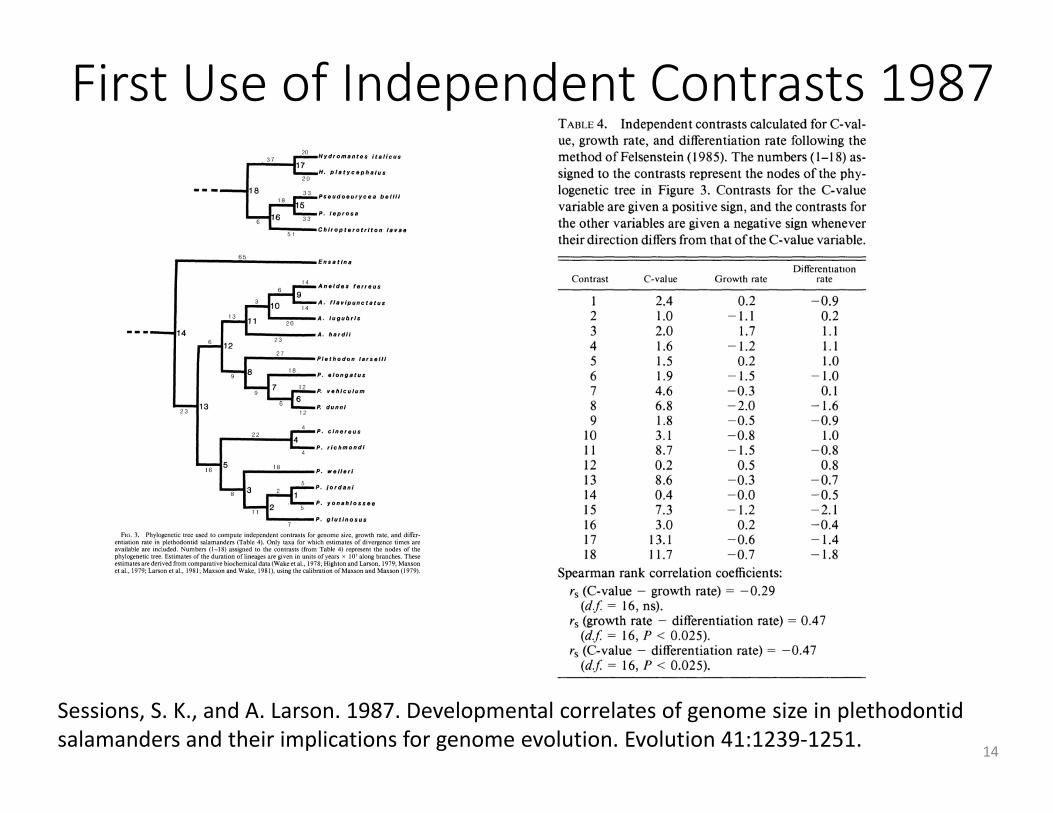
First Use of Independent Contrasts 1987
14
Sessions, S. K., and A. Larson. 1987. Developmental correlates of genome size in plethodontid salamanders and their implications for genome evolution. Evolution 41:1239‐1251.
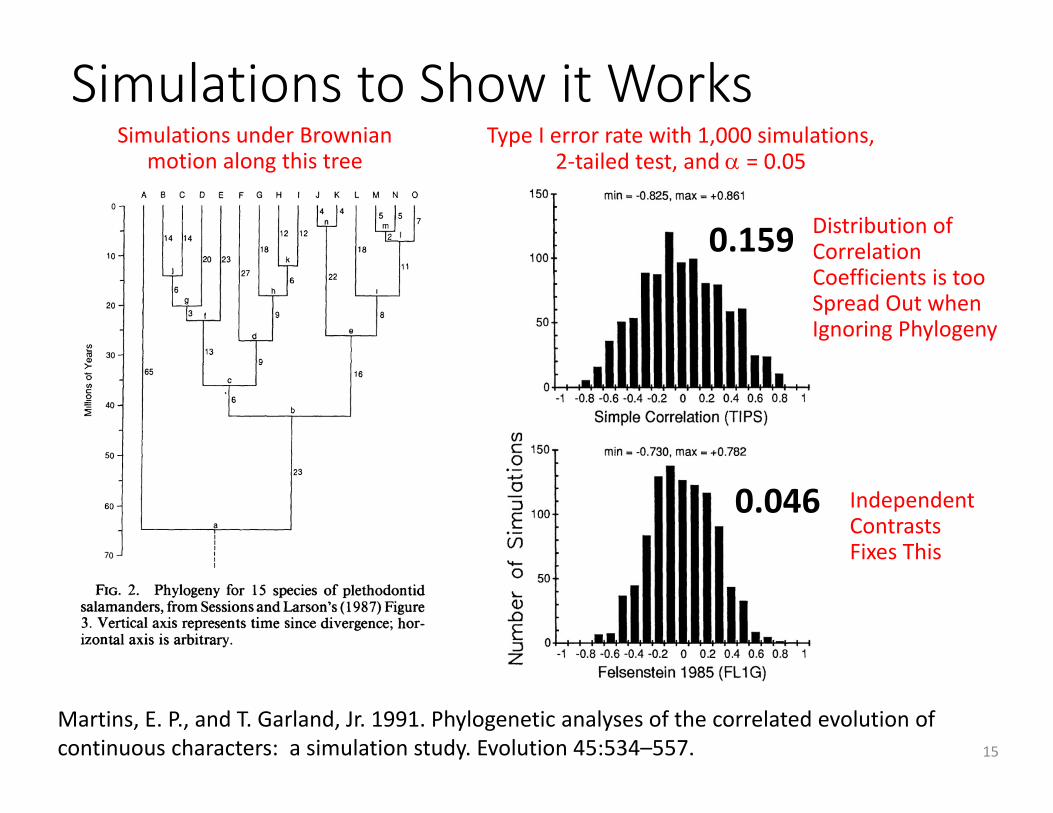
Simulations to Show it Works
15
Martins, E. P., and T. Garland, Jr. 1991. Phylogenetic analyses of the correlated evolution of continuous characters: a simulation study. Evolution 45:534–557.
Distribution of Correlation Coefficients is too Spread Out when Ignoring Phylogeny
Type I error rate with 1,000 simulations,2‐tailed test, and = 0.05
0.159
0.046
Simulations under Brownian motion along this tree
Independent Contrasts Fixes This
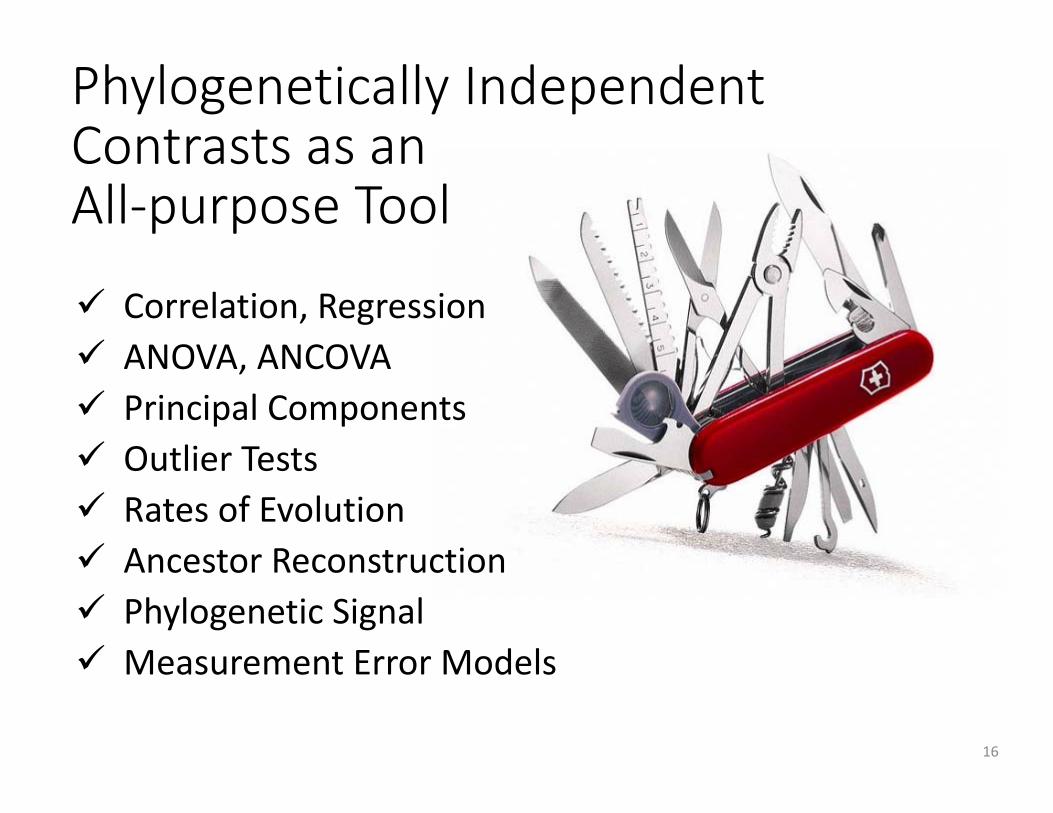
Phylogenetically IndependentContrasts as anAll‐purpose Tool
16
Correlation, Regression ANOVA, ANCOVA Principal Components Outlier Tests Rates of Evolution Ancestor Reconstruction Phylogenetic Signal Measurement Error Models
What did Joe know,and when did he know it?
17With apologies to Howard H. Baker, Jr., 1973
18
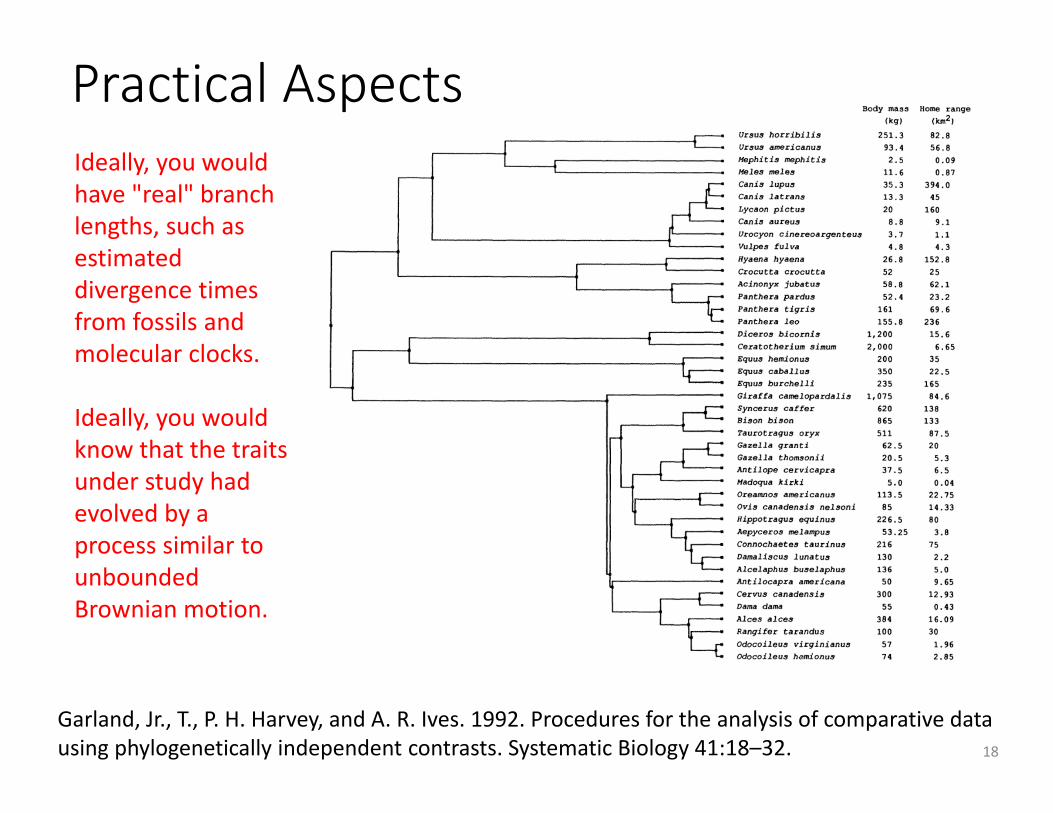
Garland, Jr., T., P. H. Harvey, and A. R. Ives. 1992. Procedures for the analysis of comparative data using phylogenetically independent contrasts. Systematic Biology 41:18–32.
Ideally, you would have "real" branch lengths, such as estimated divergence times from fossils and molecular clocks.
Ideally, you would know that the traits under study had evolved by a process similar to unbounded Brownian motion.
Practical Aspects
19
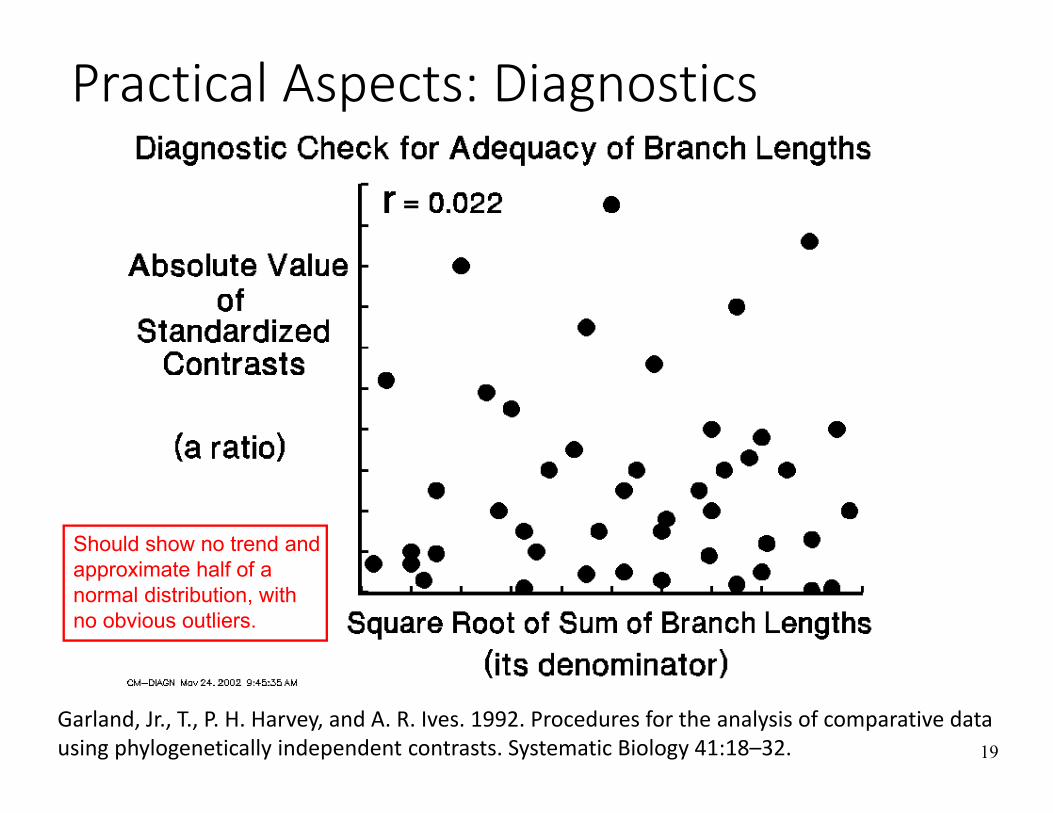
Should show no trend and approximate half of a normal distribution, with no obvious outliers.
Practical Aspects: Diagnostics
Garland, Jr., T., P. H. Harvey, and A. R. Ives. 1992. Procedures for the analysis of comparative data using phylogenetically independent contrasts. Systematic Biology 41:18–32.
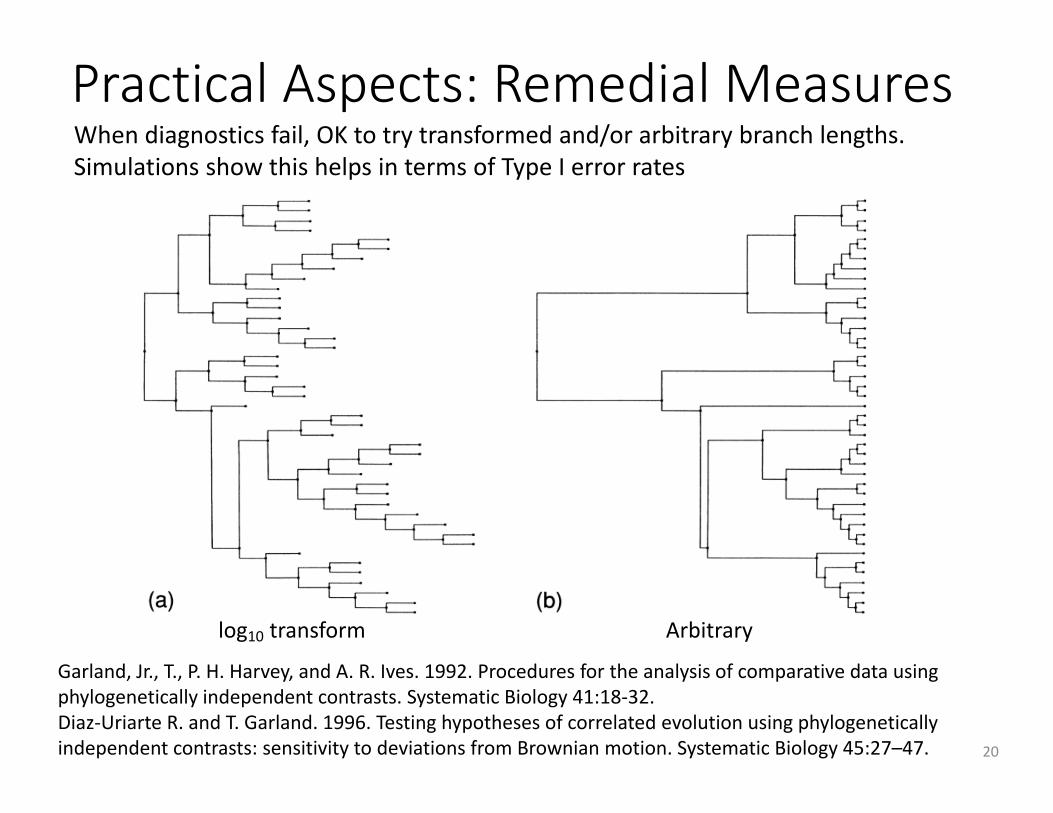
Practical Aspects: Remedial Measures
20
Garland, Jr., T., P. H. Harvey, and A. R. Ives. 1992. Procedures for the analysis of comparative data using phylogenetically independent contrasts. Systematic Biology 41:18‐32.Diaz‐Uriarte R. and T. Garland. 1996. Testing hypotheses of correlated evolution using phylogenetically independent contrasts: sensitivity to deviations from Brownian motion. Systematic Biology 45:27–47.
When diagnostics fail, OK to try transformed and/or arbitrary branch lengths.Simulations show this helps in terms of Type I error rates
log10 transform Arbitrary
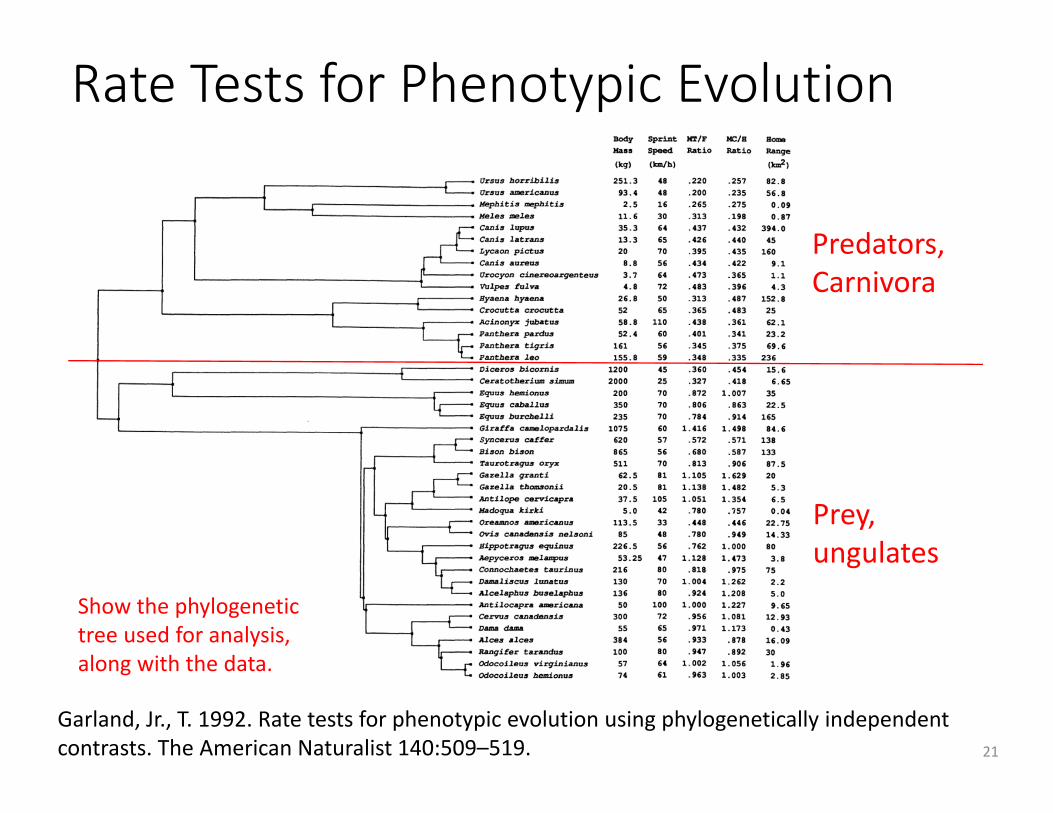
Rate Tests for Phenotypic Evolution
21
Garland, Jr., T. 1992. Rate tests for phenotypic evolution using phylogenetically independent contrasts. The American Naturalist 140:509–519.
Show the phylogenetic tree used for analysis, along with the data.
Predators,Carnivora
Prey,ungulates
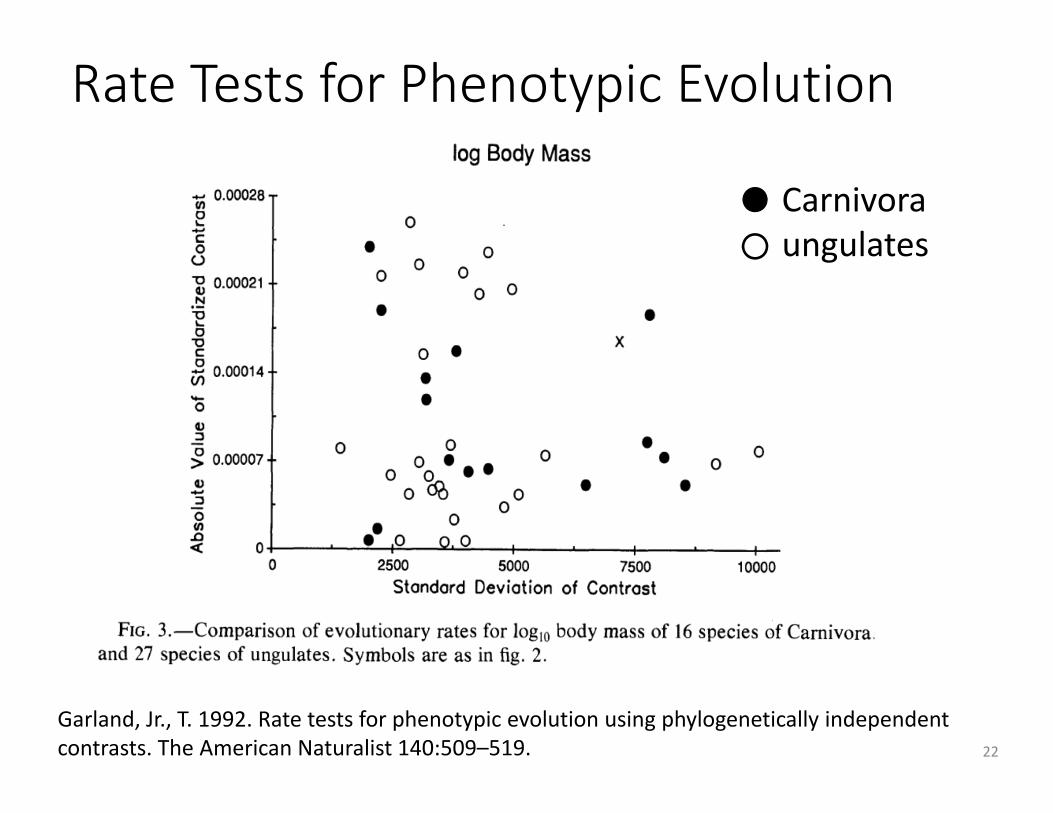
Rate Tests for Phenotypic Evolution
22
Garland, Jr., T. 1992. Rate tests for phenotypic evolution using phylogenetically independent contrasts. The American Naturalist 140:509–519.
Carnivoraungulates
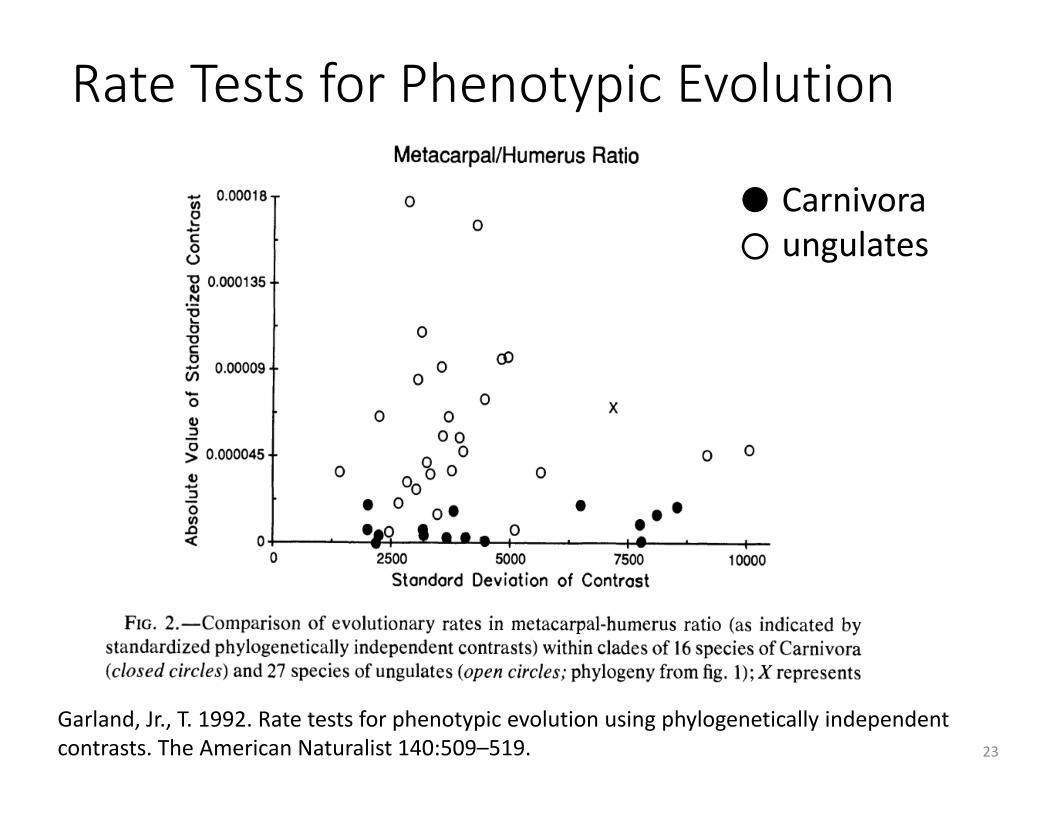
Rate Tests for Phenotypic Evolution
23
Garland, Jr., T. 1992. Rate tests for phenotypic evolution using phylogenetically independent contrasts. The American Naturalist 140:509–519.
Carnivoraungulates
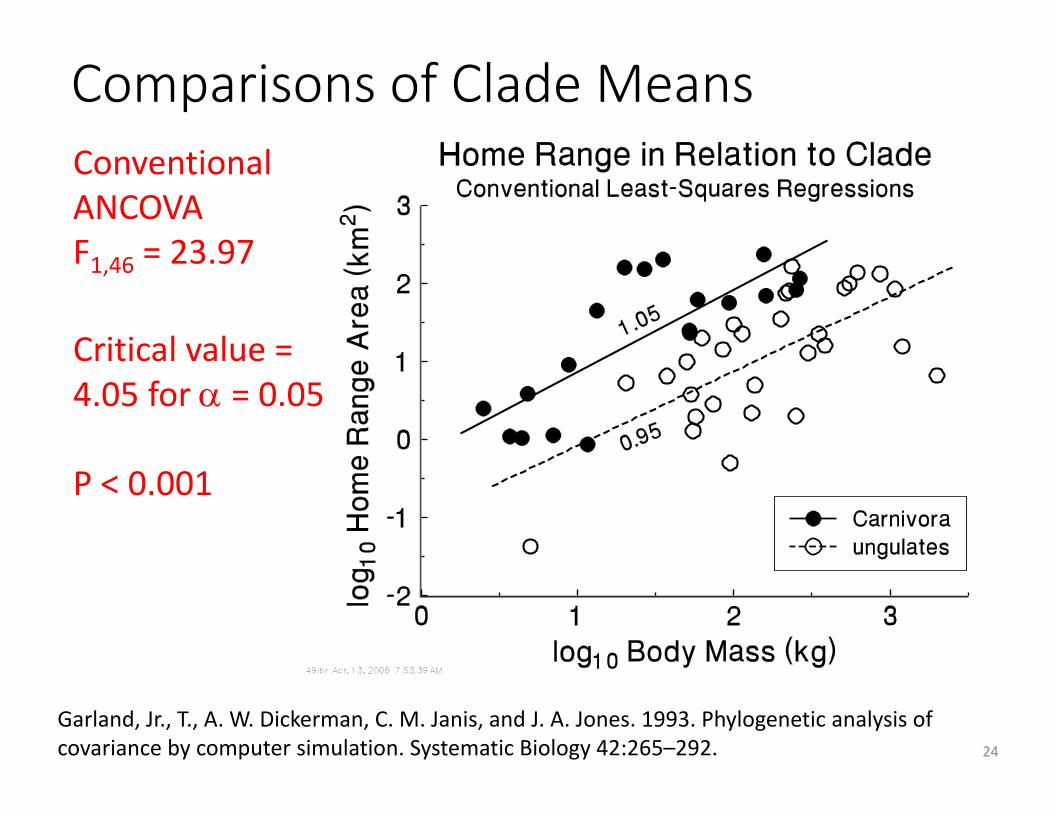
Comparisons of Clade Means
24
Garland, Jr., T., A. W. Dickerman, C. M. Janis, and J. A. Jones. 1993. Phylogenetic analysis of covariance by computer simulation. Systematic Biology 42:265–292.
ConventionalANCOVAF1,46 = 23.97
Critical value =4.05 for = 0.05
P < 0.001
25
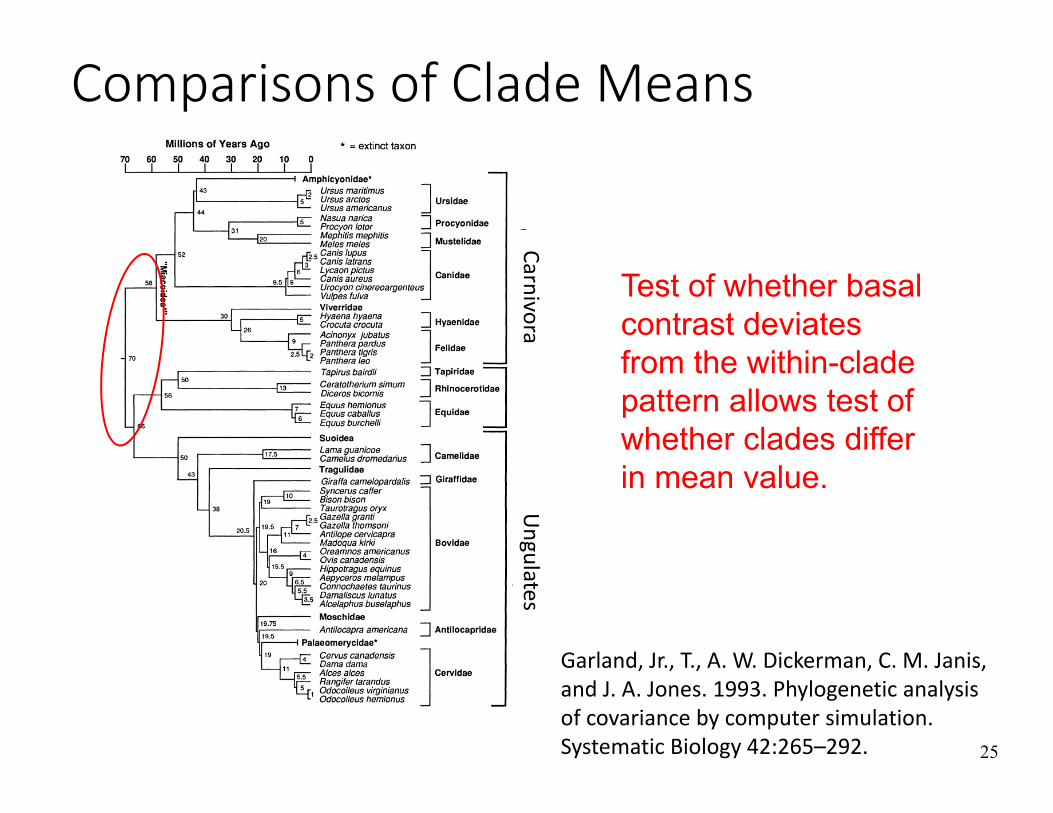
Comparisons of Clade Means
Carnivora Ungulates
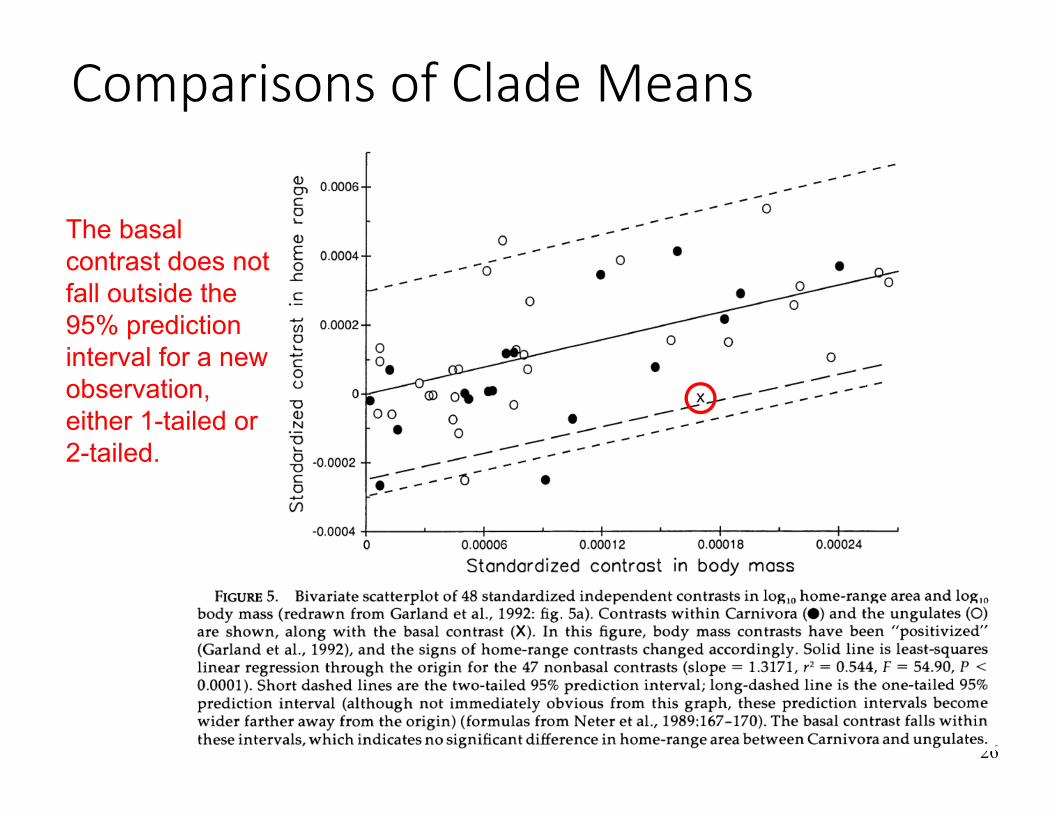
Garland, Jr., T., A. W. Dickerman, C. M. Janis, and J. A. Jones. 1993. Phylogenetic analysis of covariance by computer simulation. Systematic Biology 42:265–292.
Test of whether basal contrast deviates from the within-clade pattern allows test of whether clades differ in mean value.
26
Comparisons of Clade Means
The basal contrast does not fall outside the 95% prediction interval for a new observation, either 1-tailed or 2-tailed.
27
Important general point:you can perform statistical tests thatconcern unique evolutionary events!!!
Garland, T., Jr., and S. C. Adolph. 1994. Why not to do two-species comparative studies: limitations oninferring adaptation. Physiological Zoology 67:797-828.
Garland, T., Jr., and A. R. Ives. 2000. Using the past to predict the present: Confidence intervals forregression equations in phylogenetic comparative methods. American Naturalist 155:346-364.
Does a single species deviate from anallometric expectation?
28
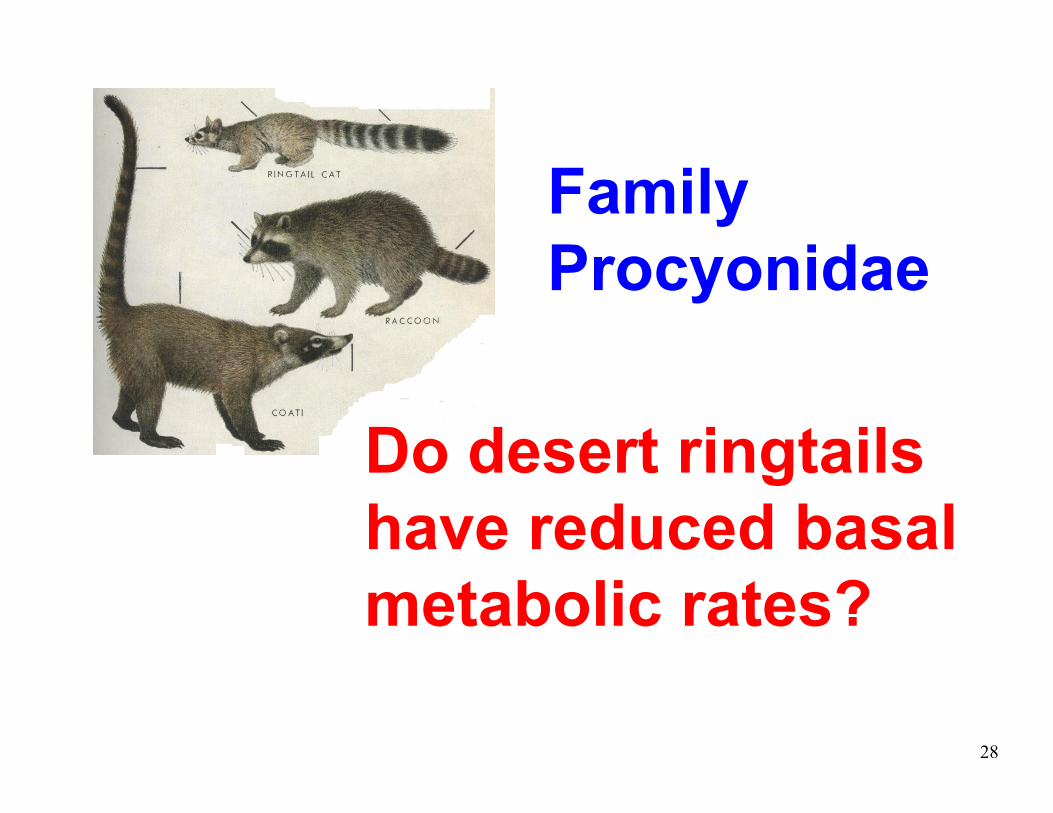
Do desert ringtails have reduced basal metabolic rates?
FamilyProcyonidae
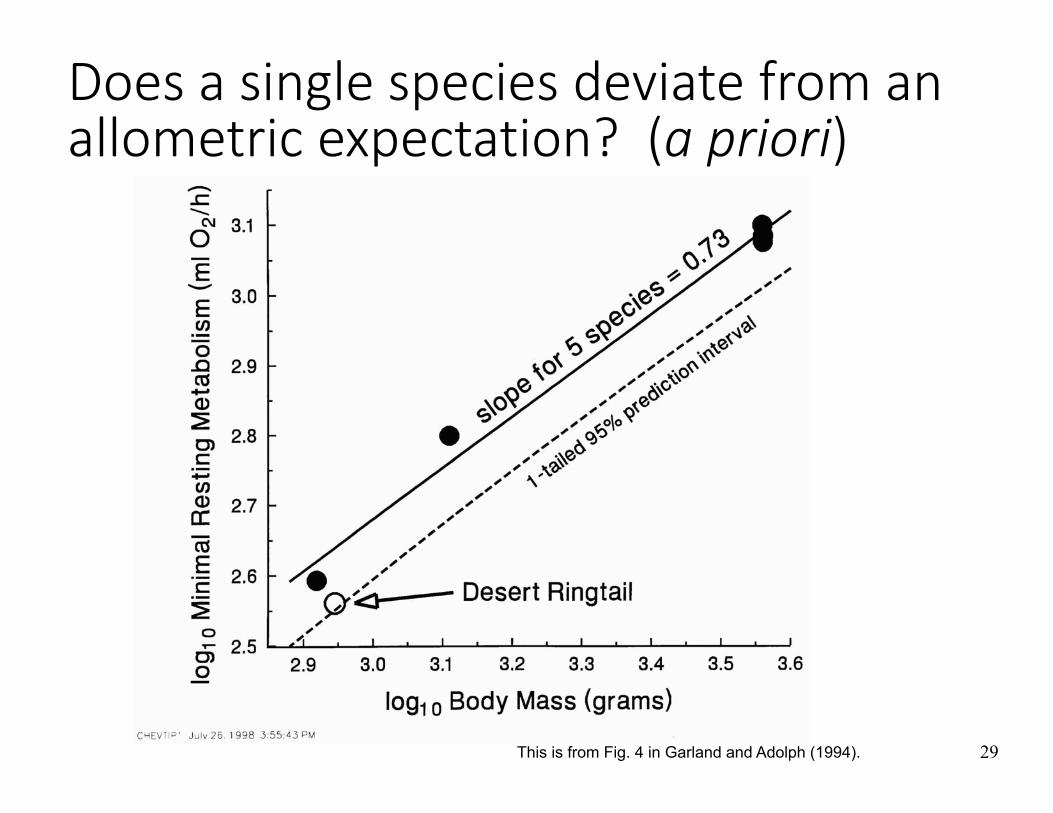
29This is from Fig. 4 in Garland and Adolph (1994).
Does a single species deviate from anallometric expectation? (a priori)
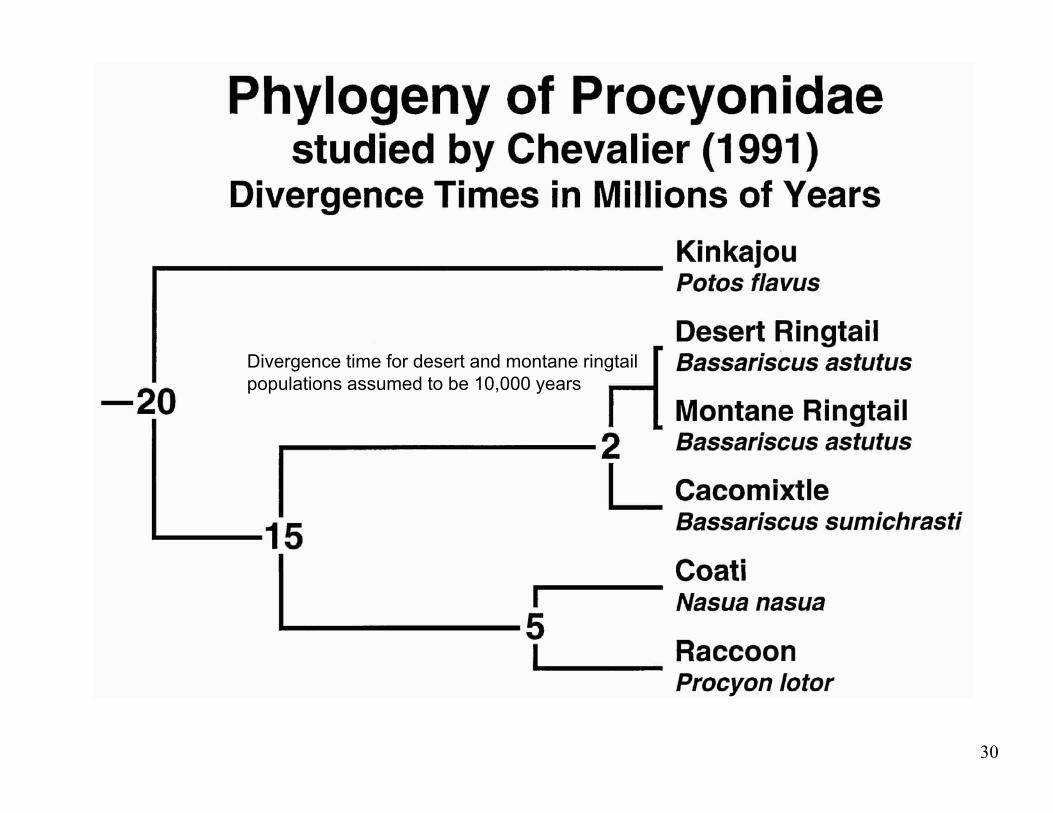
30
Divergence time for desert and montane ringtail populations assumed to be 10,000 years
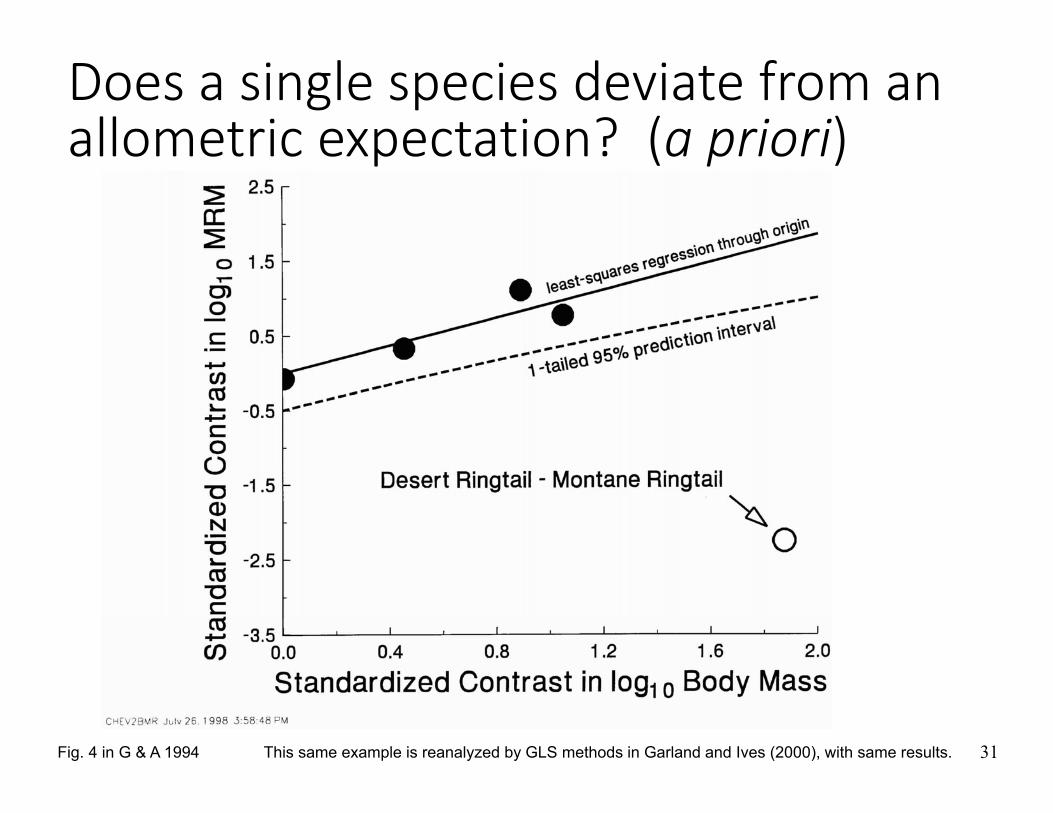
31This same example is reanalyzed by GLS methods in Garland and Ives (2000), with same results.Fig. 4 in G & A 1994
Does a single species deviate from anallometric expectation? (a priori)
32Garland, Jr., T., and C. M. Janis. 1993. Does metatarsal/femur ratio predict maximal running speed in
cursorial mammals? Journal of Zoology 229:133–151.
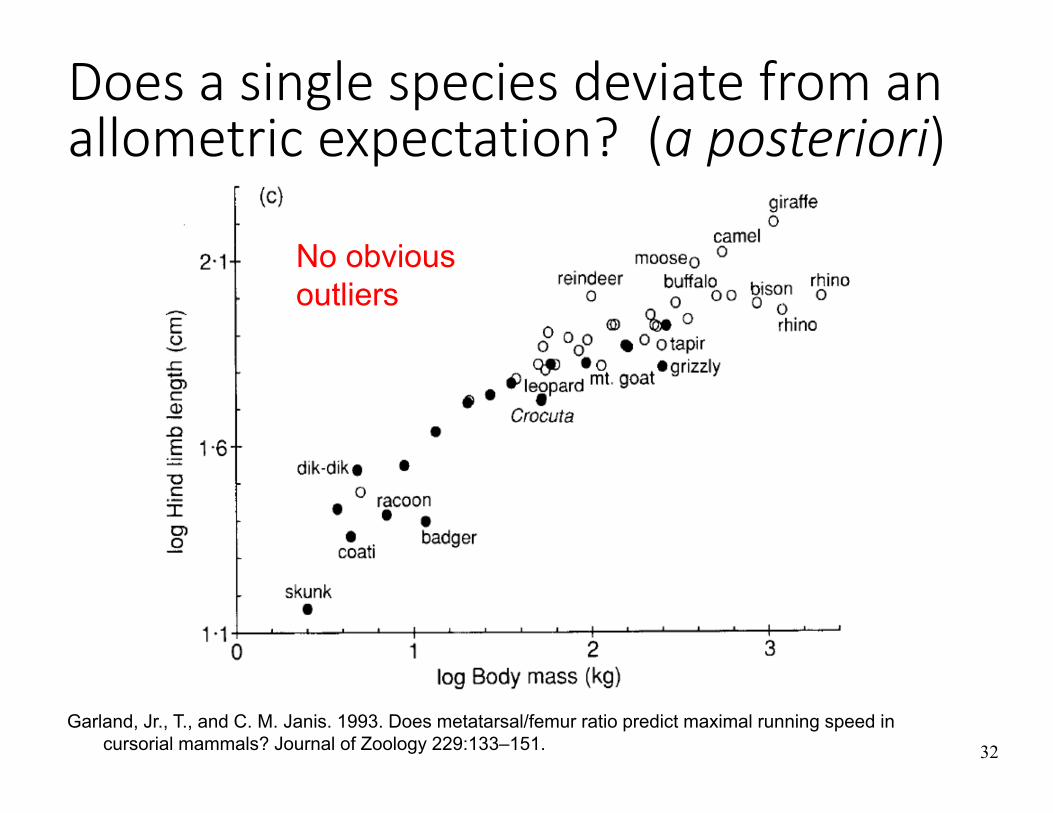
Does a single species deviate from anallometric expectation? (a posteriori)
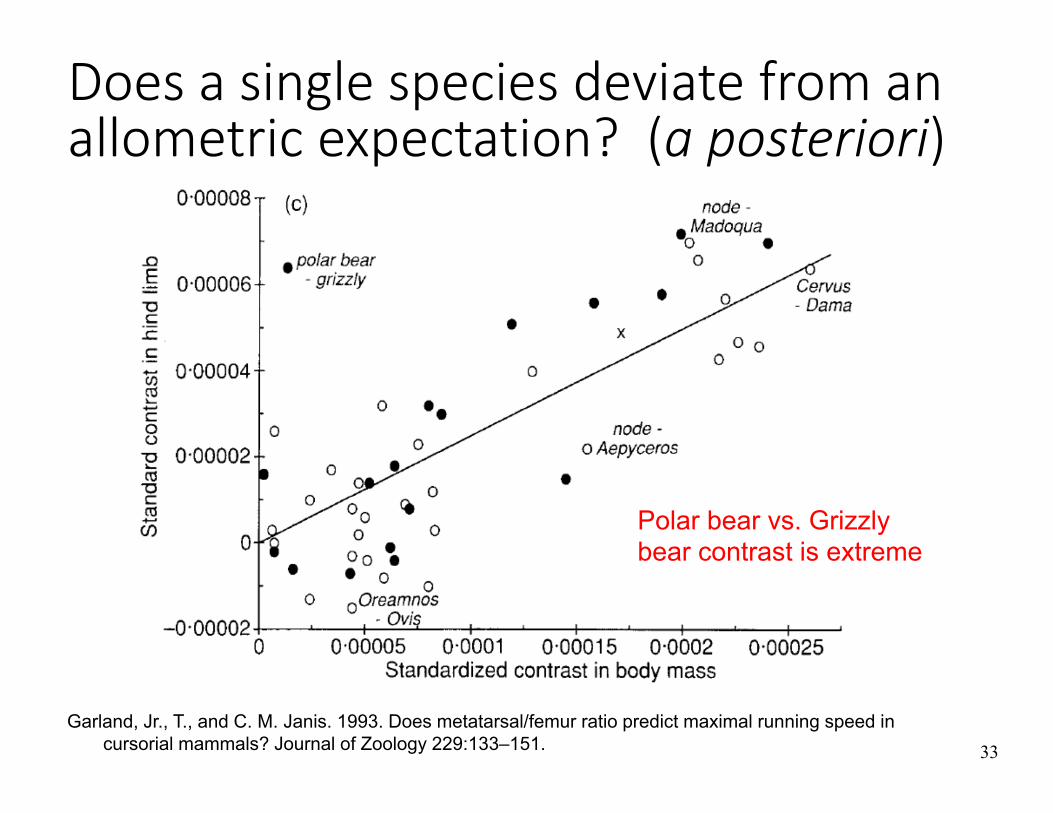
No obvious outliers
33
Does a single species deviate from anallometric expectation? (a posteriori)
Garland, Jr., T., and C. M. Janis. 1993. Does metatarsal/femur ratio predict maximal running speed incursorial mammals? Journal of Zoology 229:133–151.
Polar bear vs. Grizzly bear contrast is extreme
34
Garland, Jr., T., A. W. Dickerman, C. M. Janis, and J. A. Jones. 1993. Phylogenetic analysis of covariance by computersimulation. Systematic Biology 42:265-292.
Garland, T., P. E. Midford, and A. R. Ives. 1999. An introduction to phylogenetically based statistical methods, with a newmethod for confidence intervals on ancestral values. American Zoologist 39:374-388.
Bonine, K. E. 2005. Muscle fiber-type variation in lizards (Squamata) and phylogenetic reconstruction of hypothesizedancestral states. Journal of Experimental Biology 208:4529-4547.
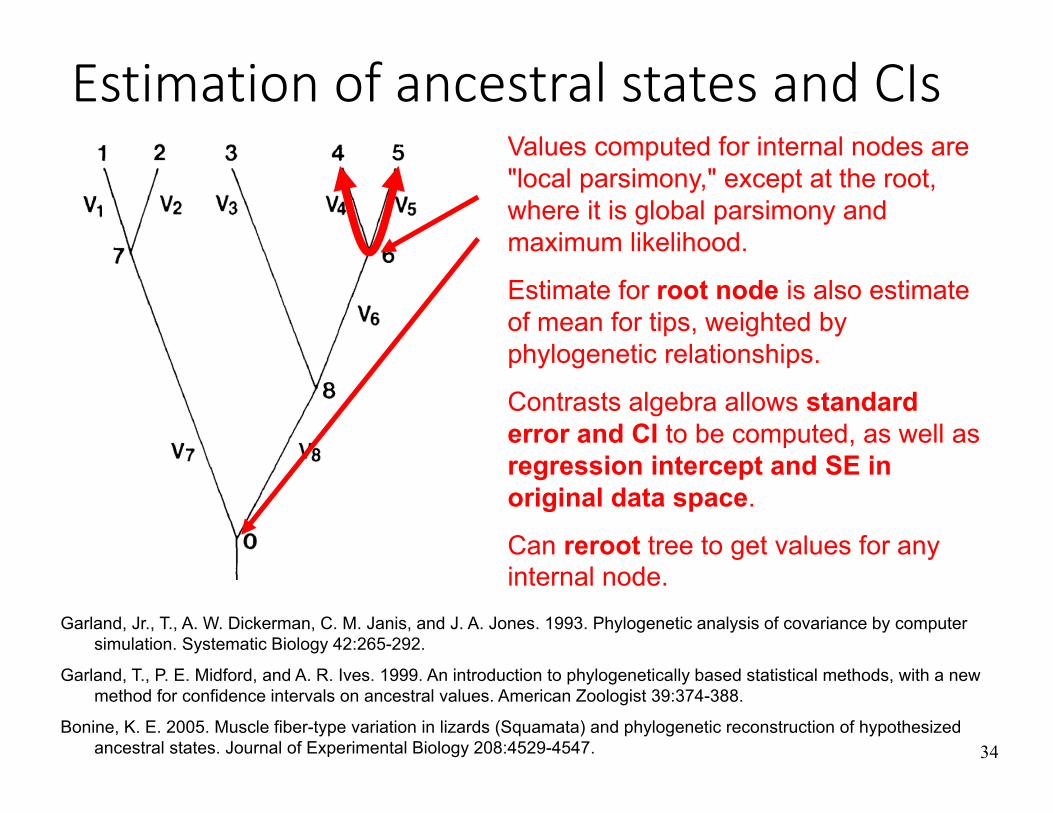
Estimation of ancestral states and CIsValues computed for internal nodes are "local parsimony," except at the root, where it is global parsimony and maximum likelihood.
Estimate for root node is also estimate of mean for tips, weighted by phylogenetic relationships.
Contrasts algebra allows standard error and CI to be computed, as well as regression intercept and SE in original data space.
Can reroot tree to get values for any internal node.
35
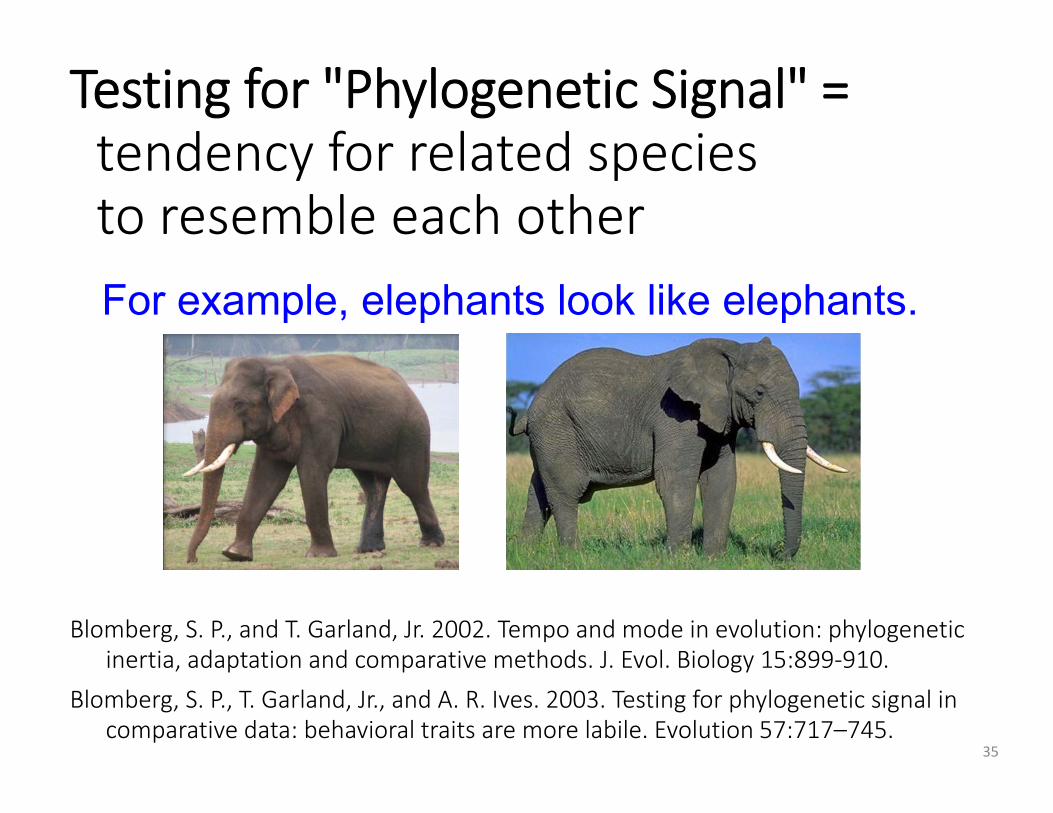
Testing for "Phylogenetic Signal" =tendency for related speciesto resemble each otherFor example, elephants look like elephants.
Blomberg, S. P., and T. Garland, Jr. 2002. Tempo and mode in evolution: phylogeneticinertia, adaptation and comparative methods. J. Evol. Biology 15:899‐910.
Blomberg, S. P., T. Garland, Jr., and A. R. Ives. 2003. Testing for phylogenetic signal incomparative data: behavioral traits are more labile. Evolution 57:717–745.
36
"Phylogenetic Signal"is not the same asphylogenetic inertiaor constraint.
These terms imply more than is easily estimated from comparative data alone, e.g., resistance to change.
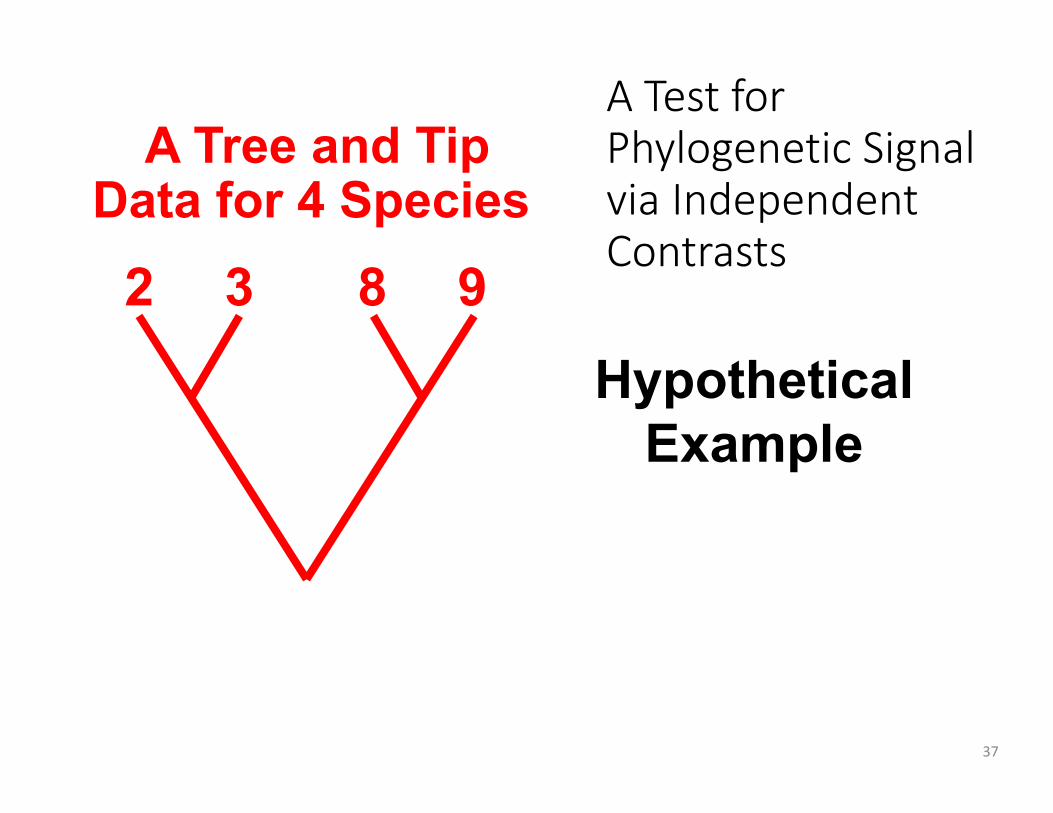
37
2 3 8 9
A Tree and Tip Datafor Four SpeciesA Tree and Tip
Data for 4 Species
Hypothetical Example
A Test for Phylogenetic Signal via Independent Contrasts
38
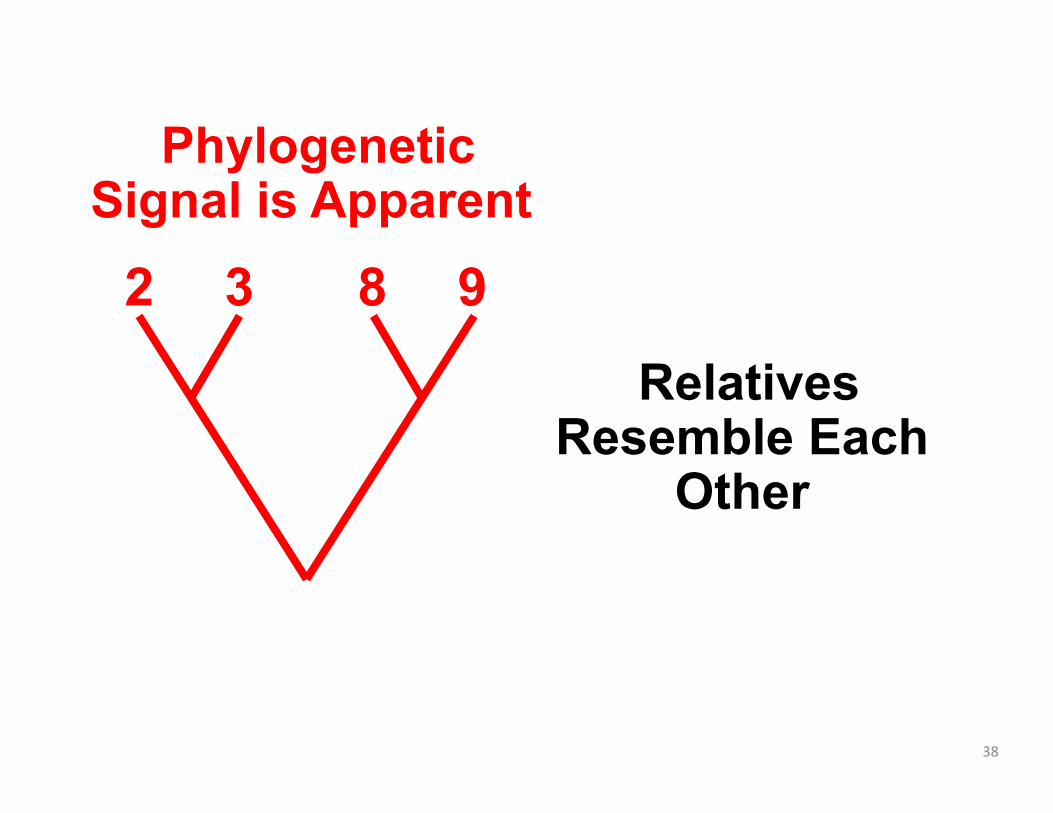
2 3 8 9
A Tree and Tip Datafor Four SpeciesPhylogenetic
Signal is Apparent
Relatives Resemble Each
Other
39
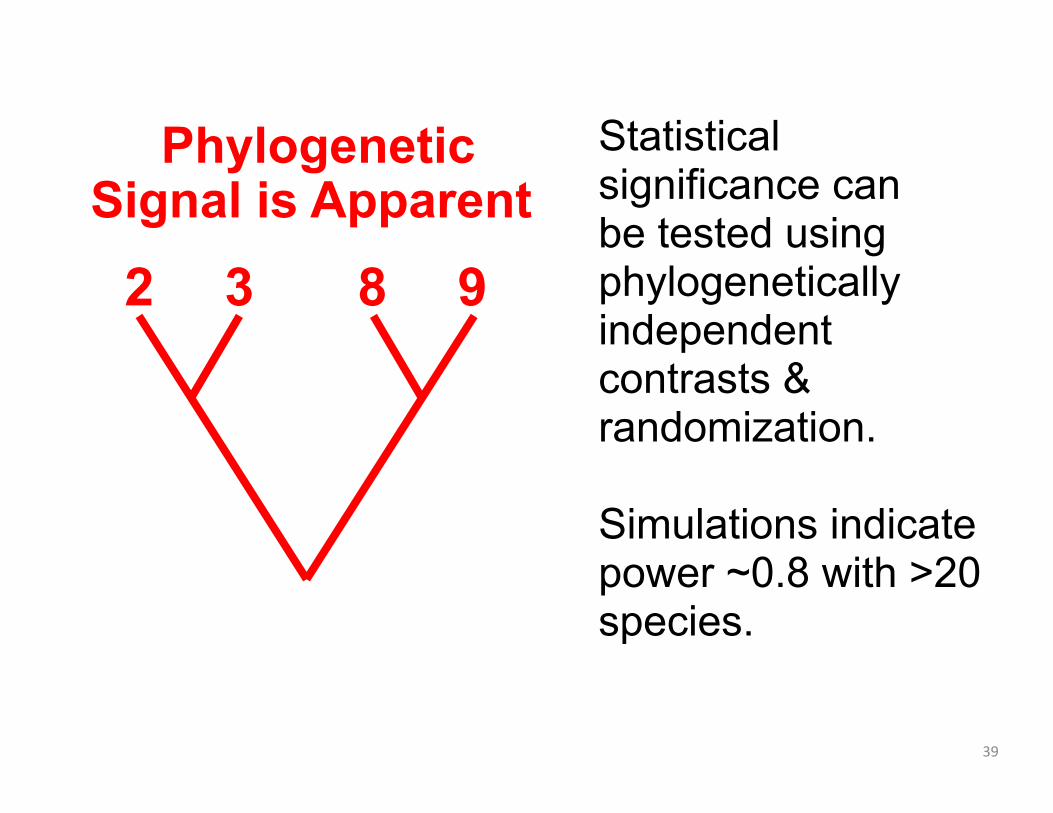
2 3 8 9
A Tree and Tip Datafor Four SpeciesPhylogenetic
Signal is ApparentStatistical significance canbe tested using phylogenetically independent contrasts & randomization.
Simulations indicate power ~0.8 with >20 species.
40
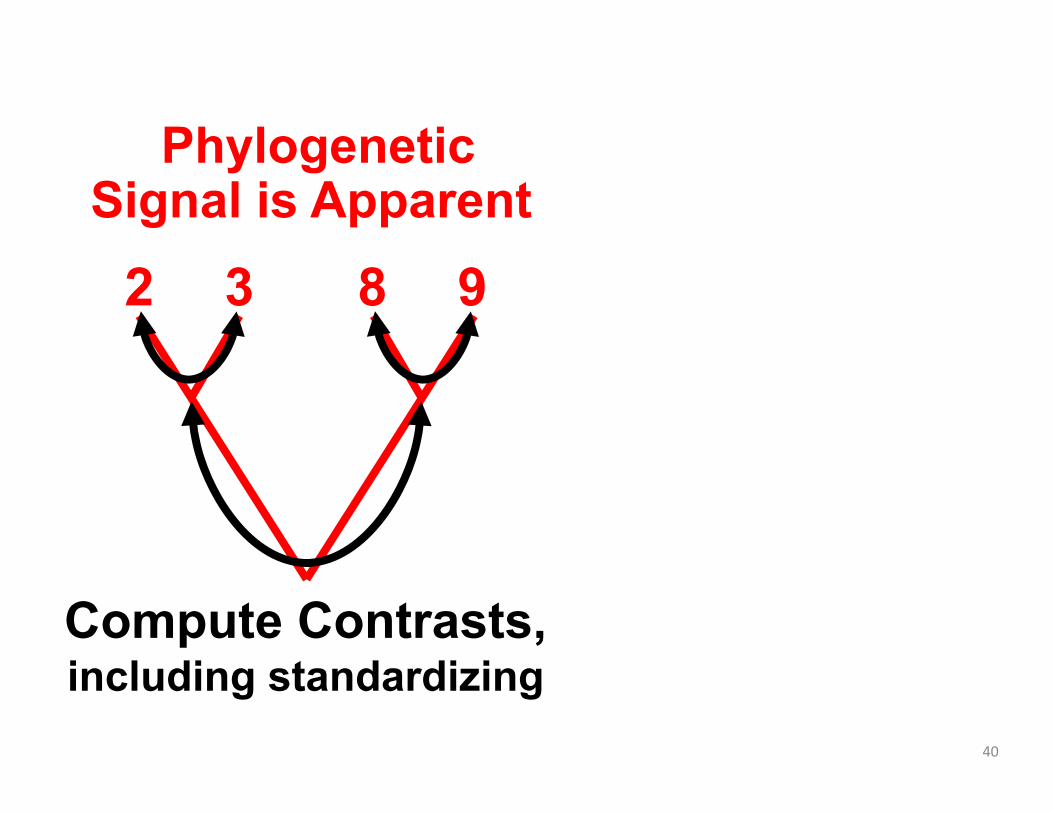
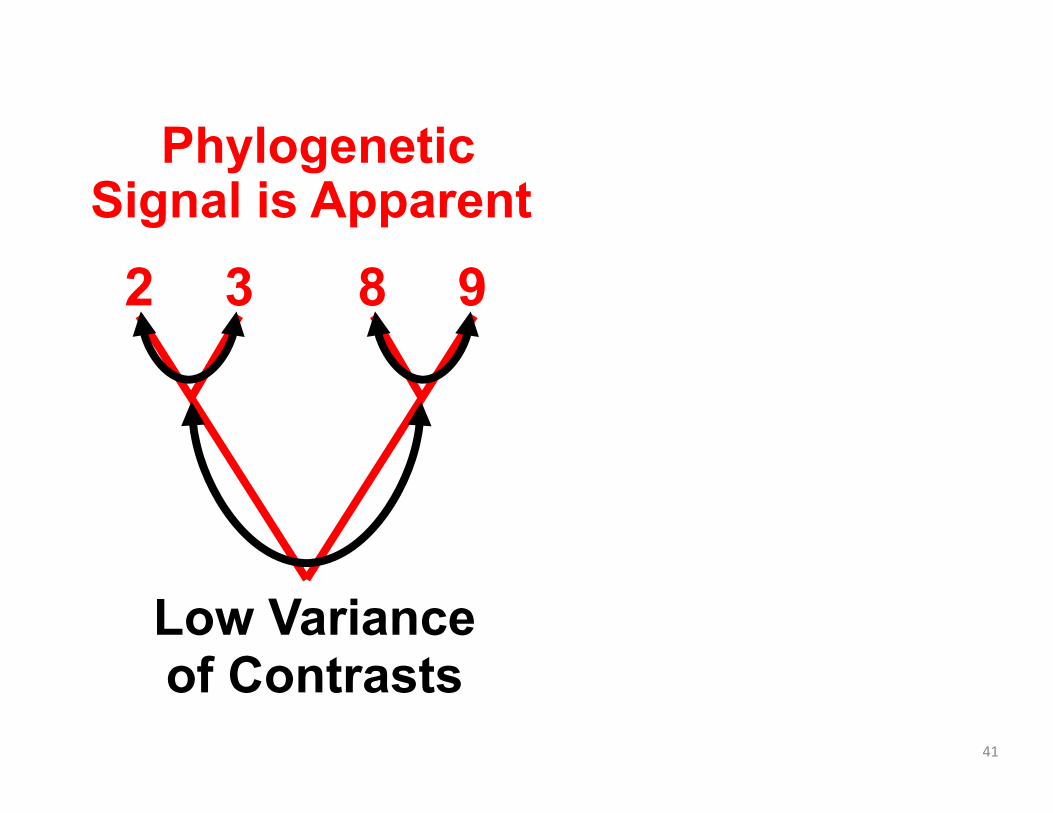
2 3 8 9
Phylogenetic Signal is Apparent
Compute Contrasts, including standardizing
41
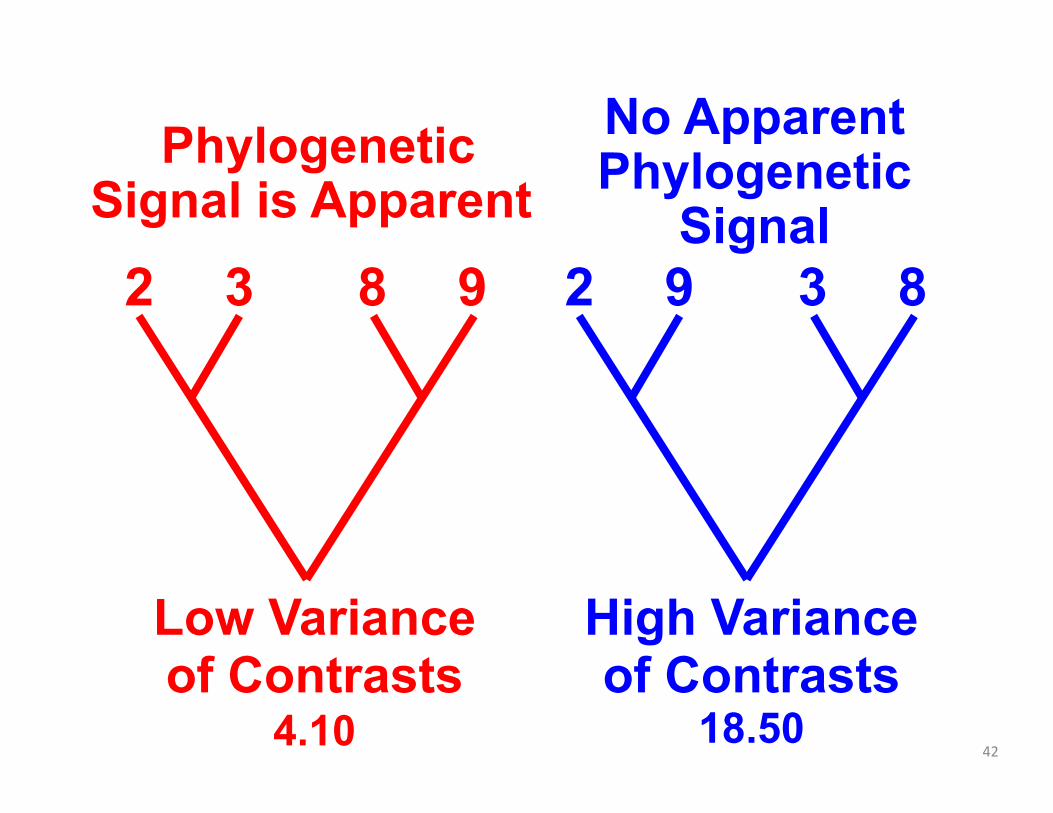
2 3 8 9
Phylogenetic Signal is Apparent
Low Variance of Contrasts
42
2 9 3 8
High Varianceof Contrasts
18.50
No Apparent Phylogenetic
Signal2 3 8 9
Low Varianceof Contrasts
4.10
Phylogenetic Signal is Apparent
43
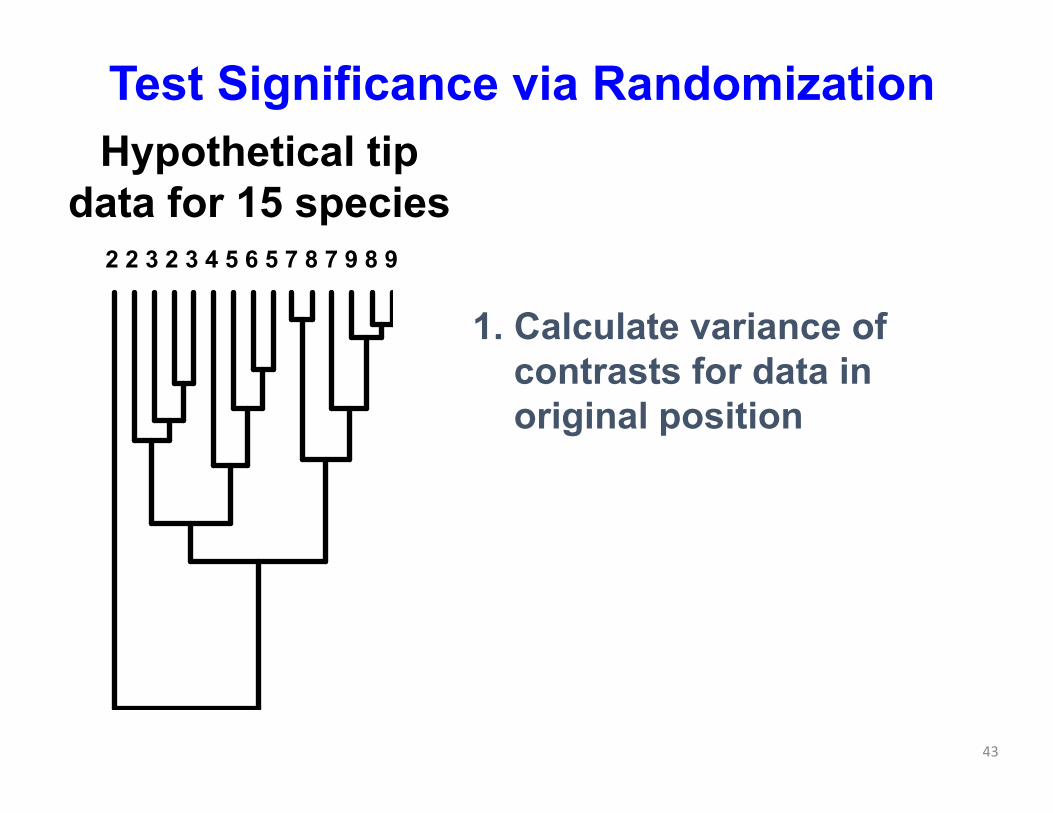
1. Calculate variance ofcontrasts for data inoriginal position
2 2 3 2 3 4 5 6 5 7 8 7 9 8 9
Hypothetical tip data for 15 species
Test Significance via Randomization
44
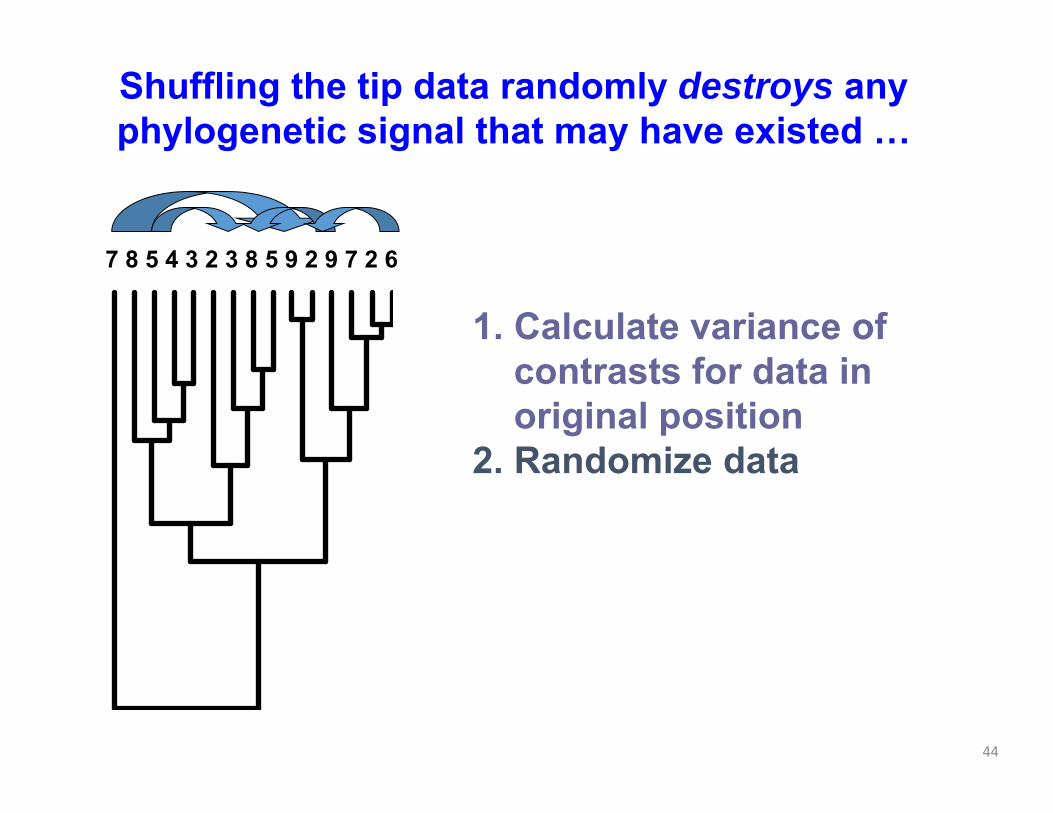
1. Calculate variance ofcontrasts for data inoriginal position
2. Randomize data
7 8 5 4 3 2 3 8 5 9 2 9 7 2 6
Shuffling the tip data randomly destroys any phylogenetic signal that may have existed …
45
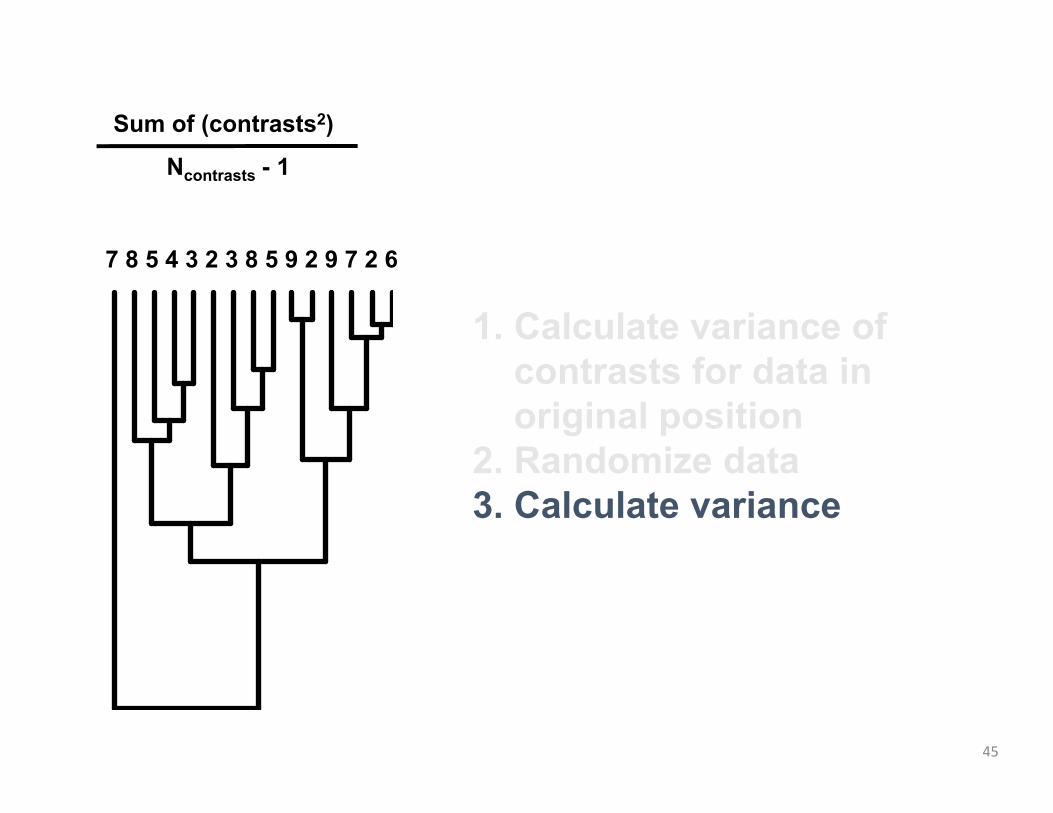
1. Calculate variance ofcontrasts for data inoriginal position
2. Randomize data3. Calculate variance
7 8 5 4 3 2 3 8 5 9 2 9 7 2 6
Sum of (contrasts2)
Ncontrasts - 1
46
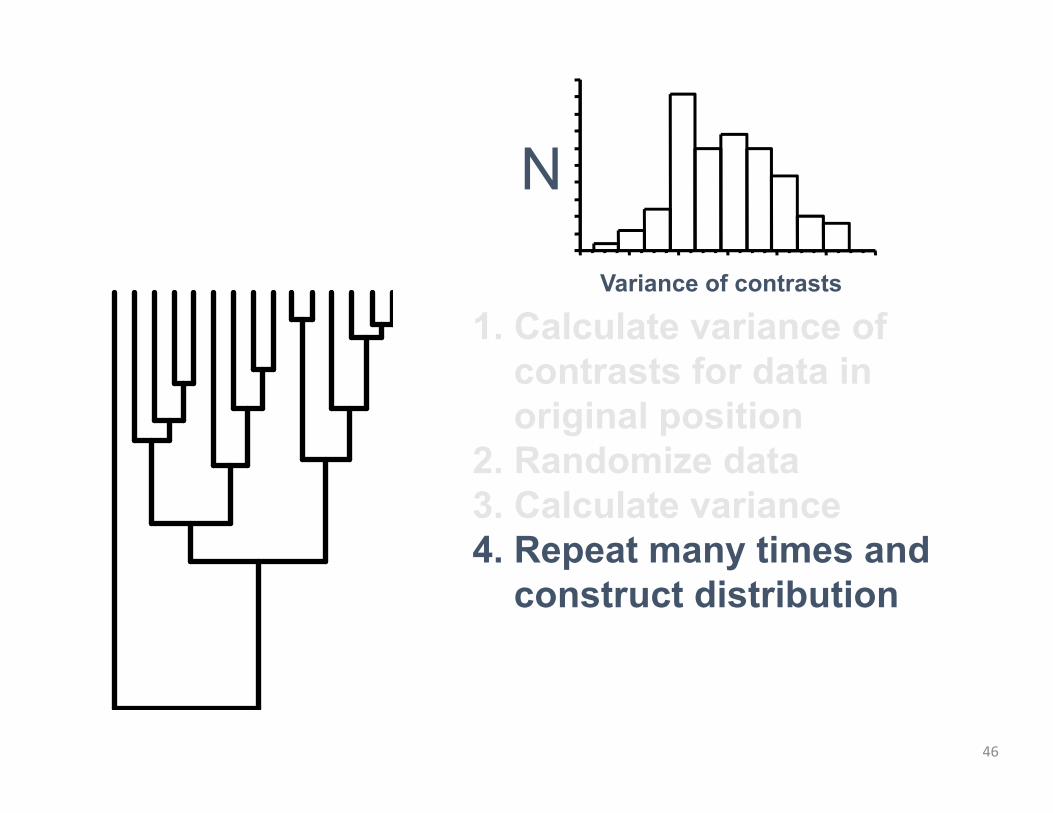
N
Variance of contrasts
1. Calculate variance ofcontrasts for data inoriginal position
2. Randomize data3. Calculate variance4. Repeat many times and
construct distribution
47
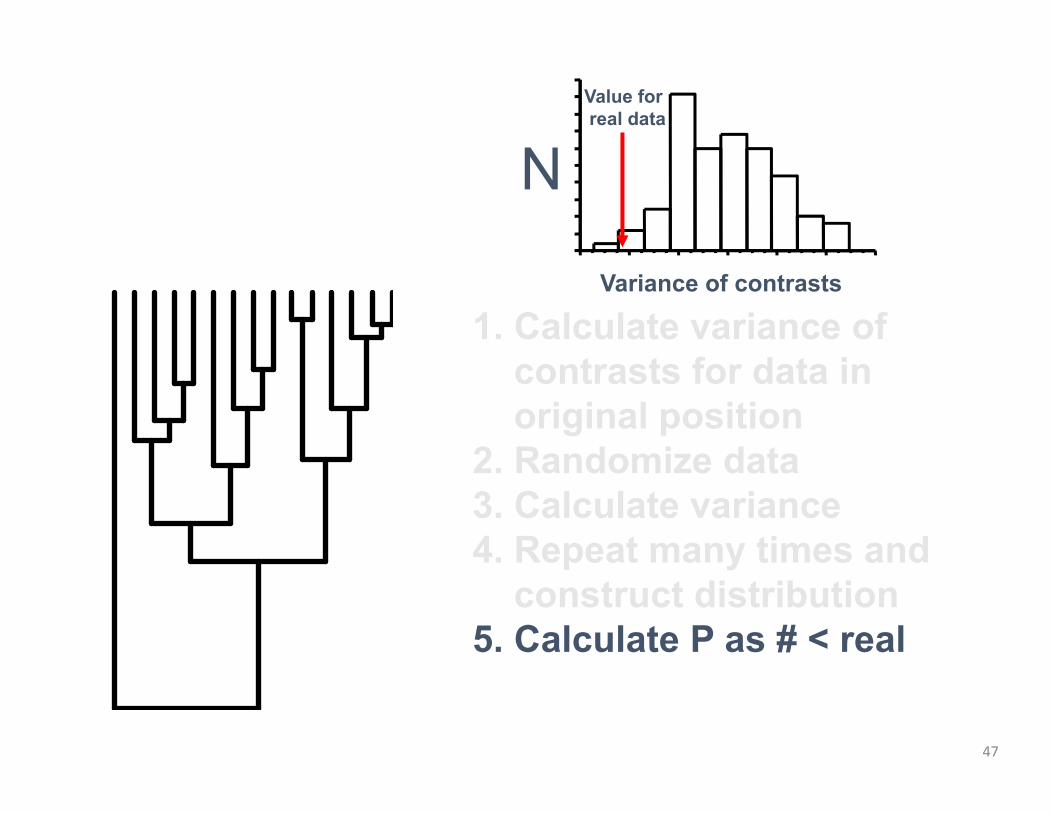
1. Calculate variance ofcontrasts for data inoriginal position
2. Randomize data3. Calculate variance4. Repeat many times and
construct distribution5. Calculate P as # < real
Value forreal data
N
Variance of contrasts
48
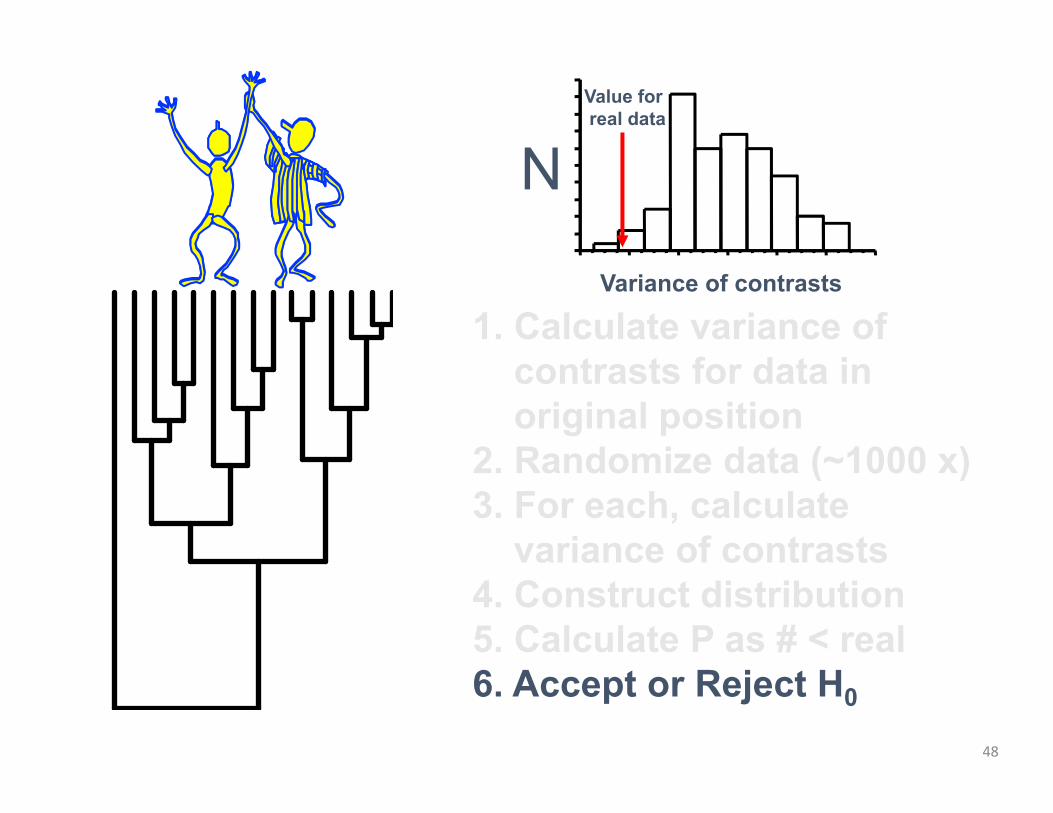
1. Calculate variance ofcontrasts for data inoriginal position
2. Randomize data (~1000 x)3. For each, calculate
variance of contrasts 4. Construct distribution5. Calculate P as # < real6. Accept or Reject H0
Value forreal data
N
Variance of contrasts
49
2325
2729
3133
3537
0.5
1.5
2.5
3.5
4.5
5.5
6.5
7.5
8.5
9.5
10.5
11.5
12.5
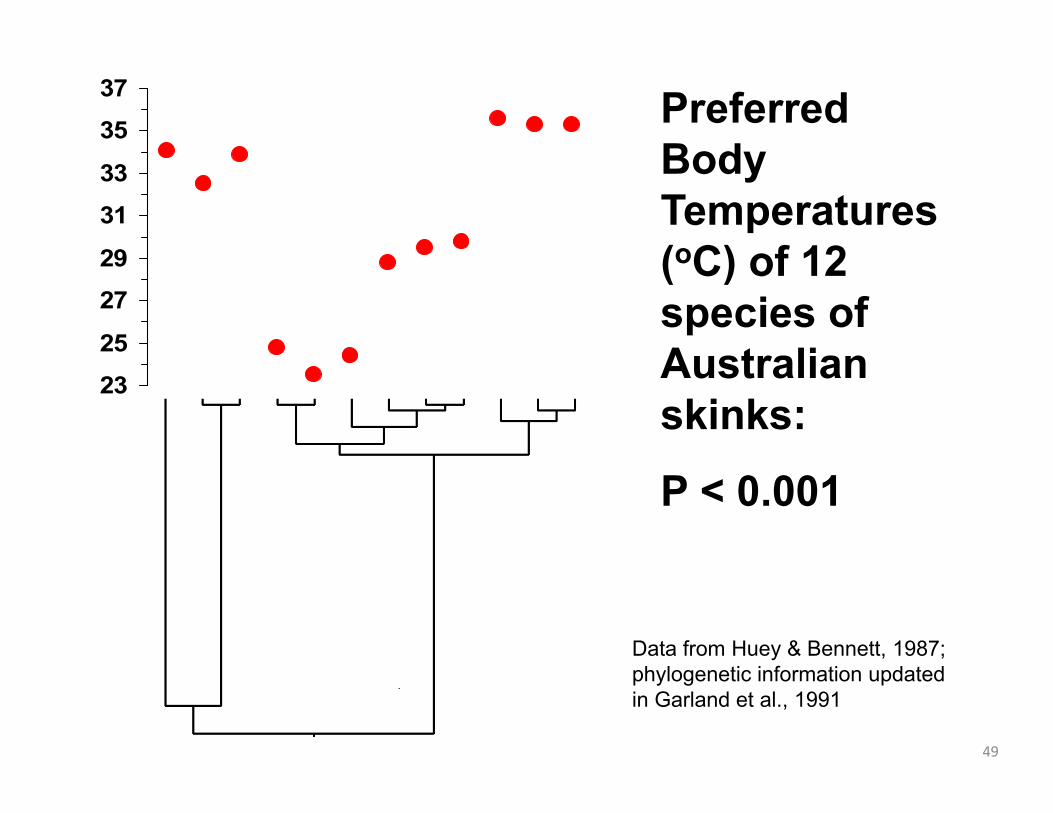
Preferred Body Temperatures (oC) of 12 species of Australian skinks:
P < 0.001
Data from Huey & Bennett, 1987; phylogenetic information updatedin Garland et al., 1991
50
2325
2729
3133
3537
0.5
1.5
2.5
3.5
4.5
5.5
6.5
7.5
8.5
9.5
10.5
11.5
12.5
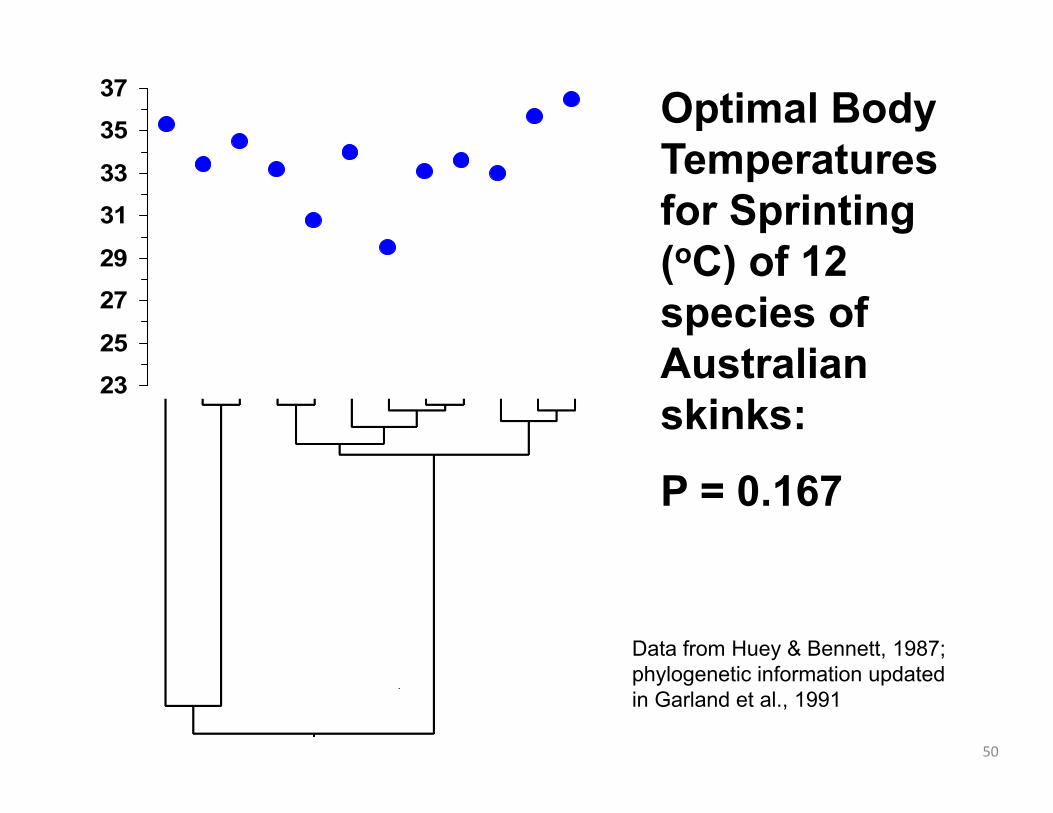
Optimal Body Temperatures for Sprinting (oC) of 12 species of Australian skinks:
P = 0.167
Data from Huey & Bennett, 1987; phylogenetic information updatedin Garland et al., 1991
51
Ives, A. R., P. E. Midford, and T. Garland. 2007. Within-species variation and measurement error in phylogenetic comparative methods. Systematic Biology 56:252-270.
Felsenstein, J. 2008. Comparative methods with sampling error and within-species variation: contrasts revisited and revised. The American Naturalist 171:713-725.
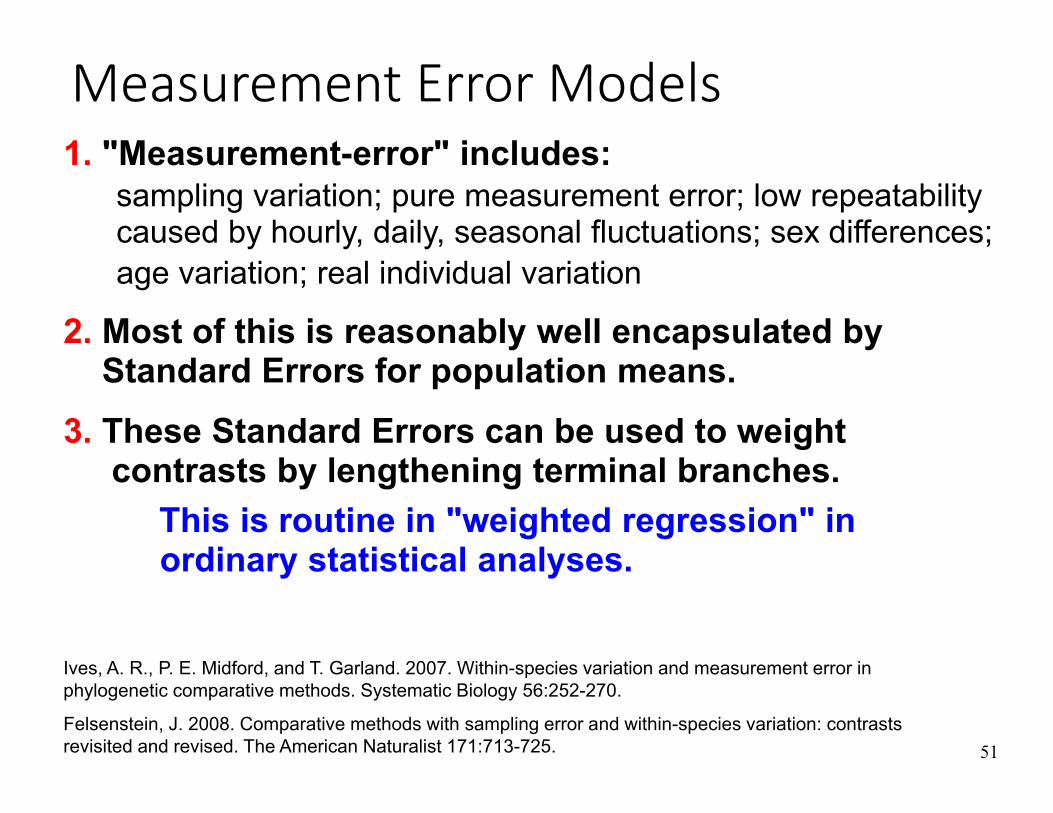
Measurement Error Models1. "Measurement-error" includes:
sampling variation; pure measurement error; low repeatabilitycaused by hourly, daily, seasonal fluctuations; sex differences;age variation; real individual variation
2. Most of this is reasonably well encapsulated byStandard Errors for population means.
3. These Standard Errors can be used to weightcontrasts by lengthening terminal branches.
This is routine in "weighted regression" inordinary statistical analyses.
52
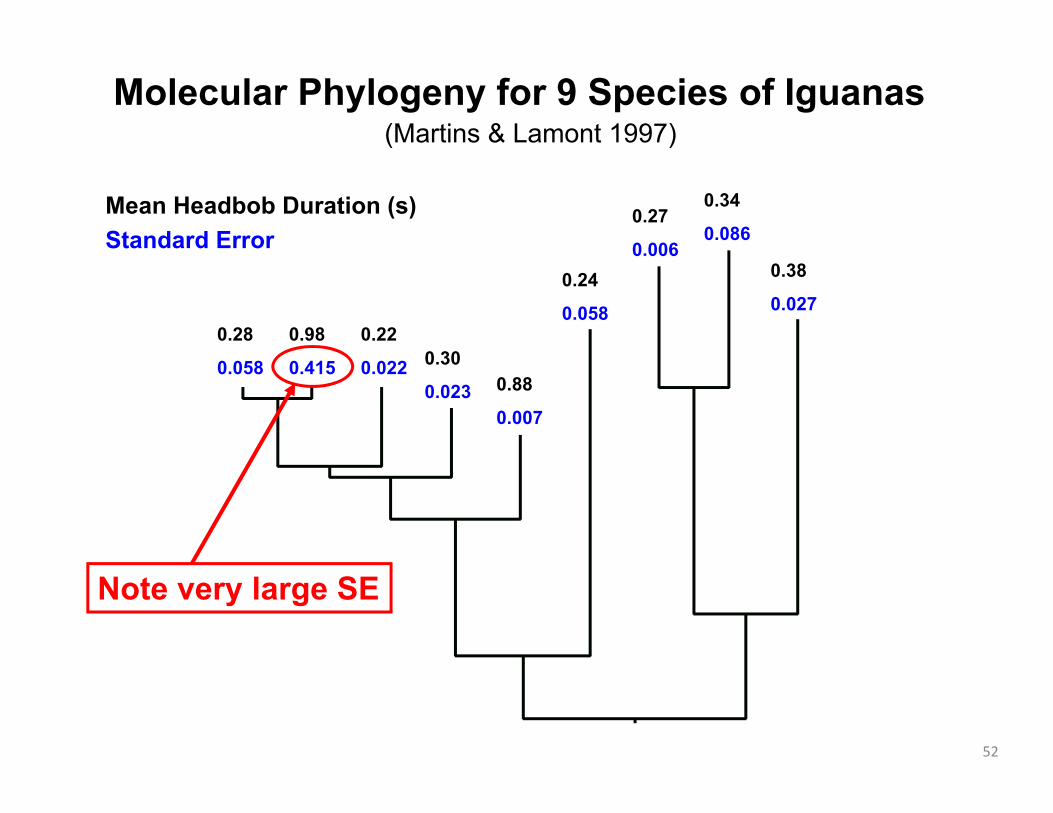
Molecular Phylogeny for 9 Species of Iguanas(Martins & Lamont 1997)
0.28
0.058
0.98
0.415
0.22
0.022 0.30
0.023 0.88
0.007
0.24
0.058
0.27
0.006
0.34
0.086
0.38
0.027
Mean Headbob Duration (s)Standard Error
Note very large SE
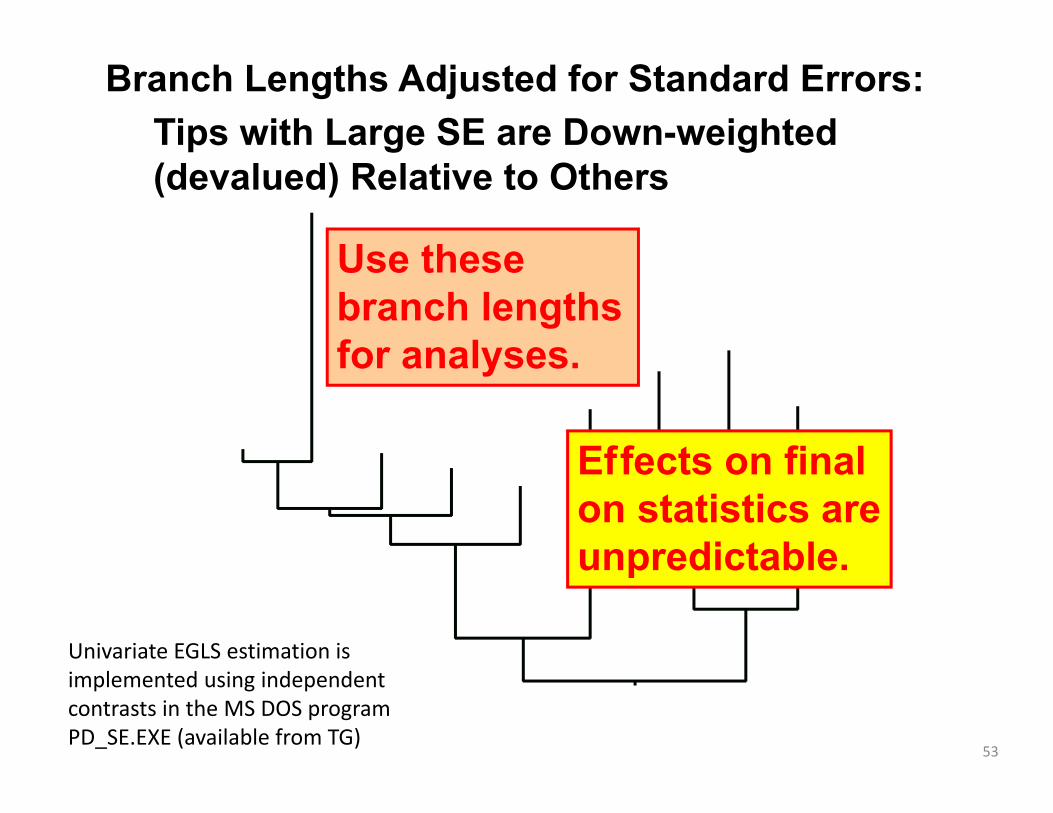
53
Branch Lengths Adjusted for Standard Errors:Tips with Large SE are Down-weighted (devalued) Relative to Others
Use these branch lengths for analyses.
Effects on final on statistics are unpredictable.
Univariate EGLS estimation is implemented using independent contrasts in the MS DOS program PD_SE.EXE (available from TG)
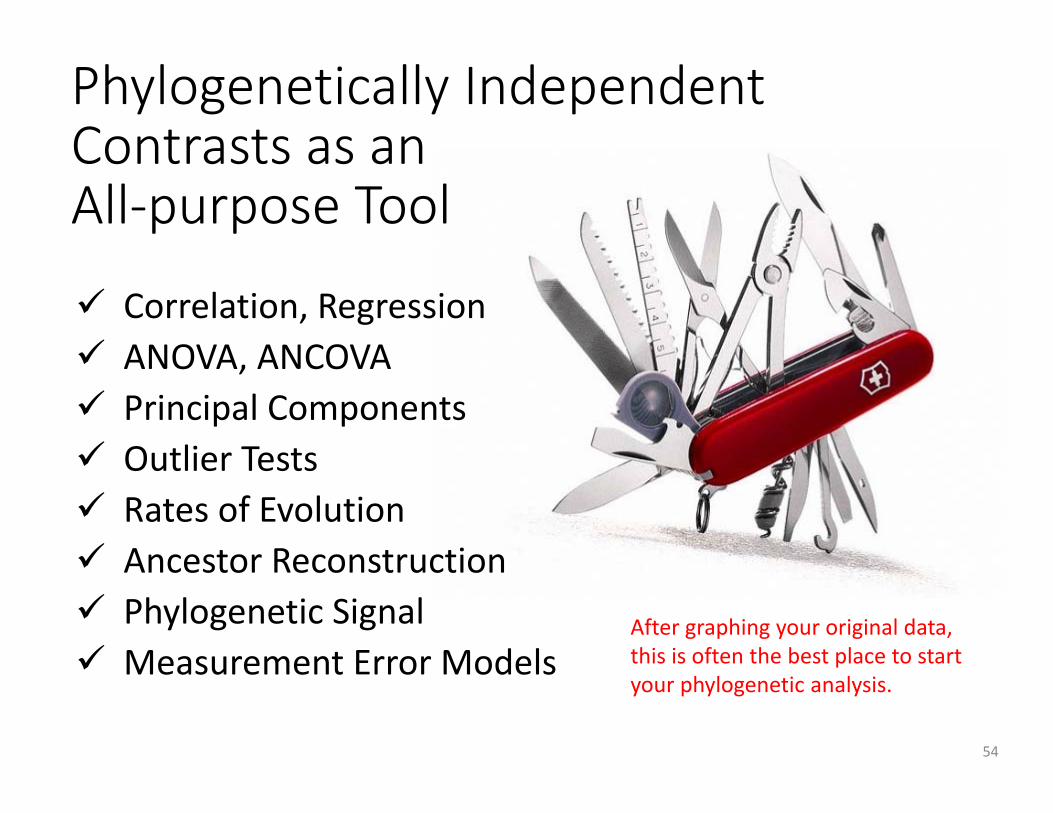
Phylogenetically IndependentContrasts as anAll‐purpose Tool
54
Correlation, Regression ANOVA, ANCOVA Principal Components Outlier Tests Rates of Evolution Ancestor Reconstruction Phylogenetic Signal Measurement Error Models
After graphing your original data, this is often the best place to start your phylogenetic analysis.