Embed Size (px)
Citation preview

4/26/2017
1
May 3, 2017
Measuring excess adiposity in children: What’s the best method?
12 noon – 1 PM EDTModerator: Lisa Diewald, MS, RD, LDN
Program ManagerMacDonald Center for Obesity Prevention & Education
Handouts of the slides are posted at: www.villanova.edu/COPE
Welcome to the COPE Webinar Series for Health Professionals!
MacDonald Center for Obesity Prevention and Education (COPE) Goals
Nursing/College Student Education
Continuing Education Programming
Research
Measuring excess adiposity in children:What’s the best method?
Objectives:
1. Gain a working knowledge of the changes in body composition that occur from birth to adulthood.
2. Understand the strengths and weaknesses of various body composition methods in children.
3. Identify the optimal method for body composition assessment in different patient populations in research and clinical care.
CE Credits
• Villanova University College of Nursing is accredited as a provider of continuing nursing education by the American Nurses Credentialing Center Commission on Accreditation
• Villanova University College of Nursing Continuing Education/COPE is a Continuing Professional Education (CPE) Accredited Provider with the Commission on Dietetic Registration
• The American College of Sports Medicine’s Professional Education Committee certifies that Villanova University College of Nursing Continuing Education, Center for Obesity Prevention and Education (COPE) meets the criteria for official ACSM Approved Provider status
(2015-December, 2018). Providership #698849
CE Credits
• This webinar awards 1 contact hour for nurses and 1 CPEU for dietitians
• Suggested CDR Learning Need Codes: 3010, 3030, 5070, and 5370
Babette Zemel, Ph.D.Professor of PediatricsDirector, Nutrition and Growth LaboratoryChildren’s Hospital of PhiladelphiaUniversity of Pennsylvania Perelman School of Medicine
Measuring excess adiposity in children: What’s the best method?
4/26/2017
2
Neither the planners or presenter have any conflicts of interest to disclose.
Accredited status does not imply endorsement by Villanova University, COPE or the American Nurses Credentialing Center of any commercial products or medical/nutrition advice displayed inconjunction with an activity.
DISCLOSURE
Measuring excess adiposity in children – what’s the best method?
BABETTE S. ZEMEL, PHD
Director, Nutrition And Growth Laboratory
The Children’s Hospital Of Philadelphia
University Of Pennsylvania Perelman School Of Medicine
Disclosures
Nothing to disclose
Overview
Have a working knowledge of the changes in body composition that occur from birth to adulthood
Understand the strengths and weaknesses of various body composition methods in children
Be able to identify the optimal method for body composition assessment in different patient populations in research and clinical care
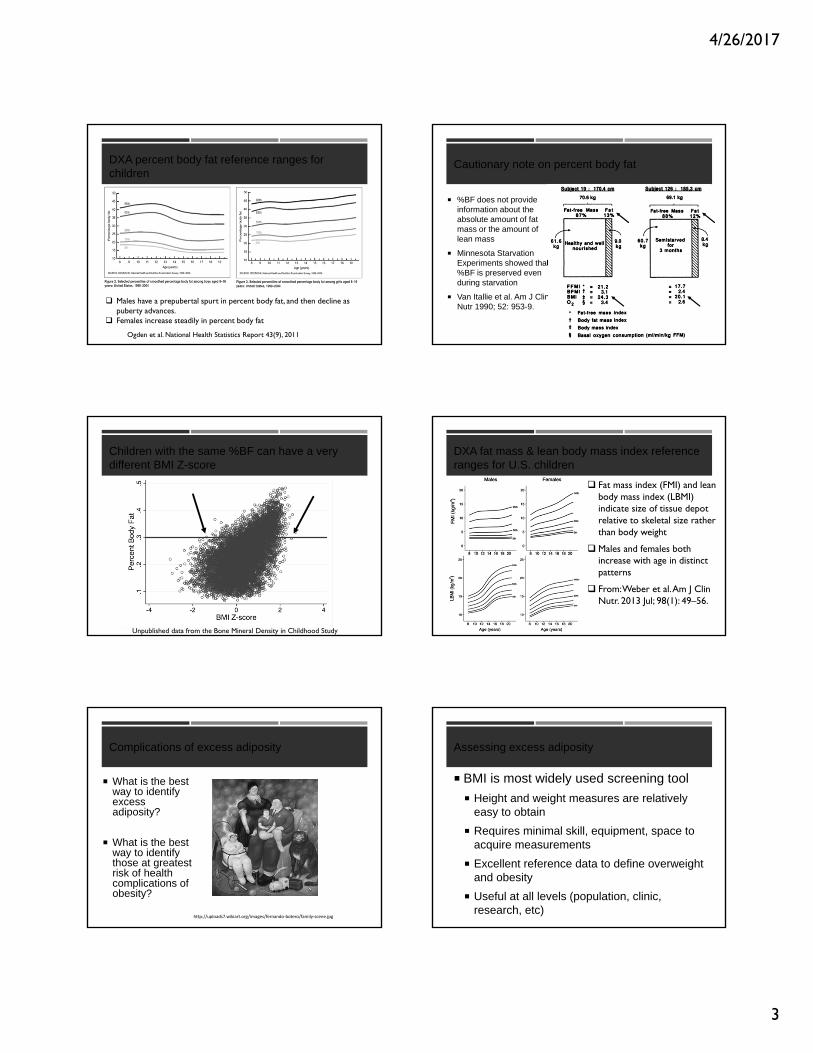
ECF Volume
Body Fat
Muscle Mass
Organ Wt
Relative proportion of body compartments changes through the life cycle
Adapted from Holliday MA 1986; Body composition and energy needs during growth.From Human Growth. Edited by Falkner F and Tanner JM
2
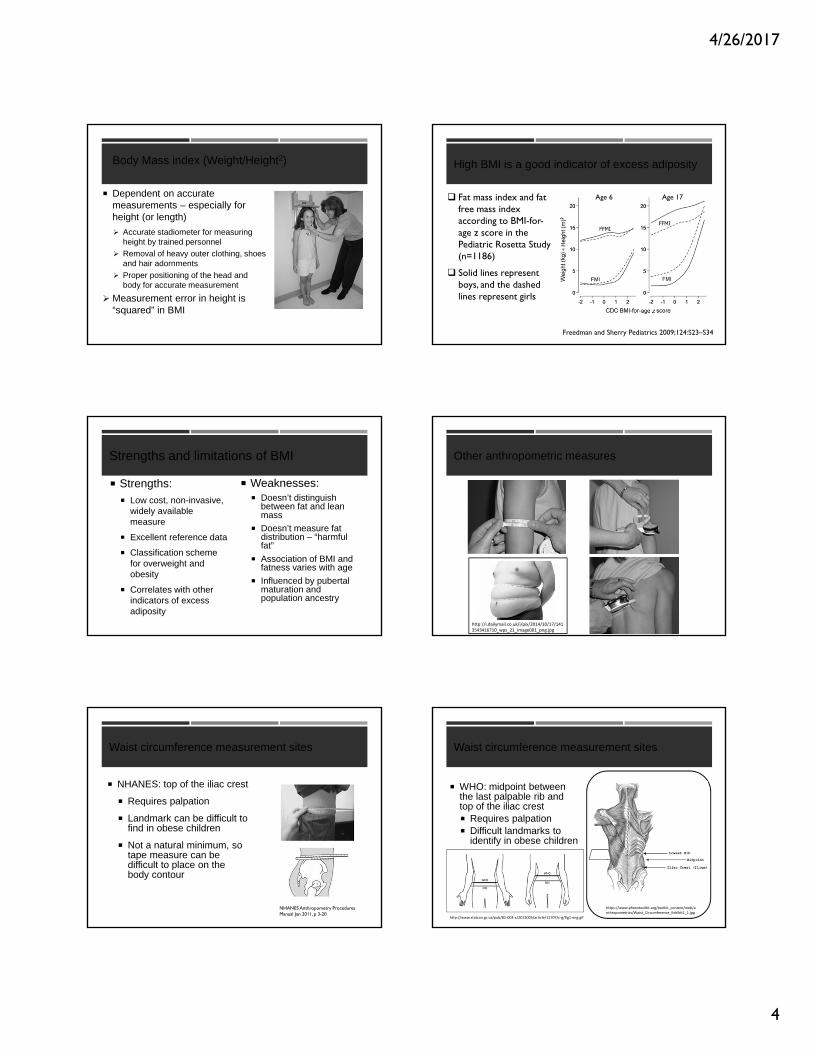
Body Composition during the First 2 Years of Life: An Updated Reference.BUTTE, NANCY; HOPKINSON, JUDY; WONG, WILLIAM; SMITH, E; ELLIS, KENNETHPediatric Research. 47(5):578‐585, May 2000.
Comparison of %BF in boys and girls, ages 0.5 to 24 mo (CNRC vs Fomon model)
Rapid increases in first few months
Girls>boys
Percent body fat (%BF) changes during infancy
4/26/2017
3
DXA percent body fat reference ranges for children
Ogden et al. National Health Statistics Report 43(9), 2011
Males have a prepubertal spurt in percent body fat, and then decline as puberty advances.
Females increase steadily in percent body fat
Cautionary note on percent body fat
%BF does not provide information about the absolute amount of fat mass or the amount of lean mass
Minnesota Starvation Experiments showed that %BF is preserved even during starvation
Van Itallie et al. Am J Clin Nutr 1990; 52: 953-9.
Children with the same %BF can have a very different BMI Z-score
Unpublished data from the Bone Mineral Density in Childhood Study
DXA fat mass & lean body mass index reference ranges for U.S. children
Fat mass index (FMI) and lean body mass index (LBMI) indicate size of tissue depot relative to skeletal size rather than body weight
Males and females both increase with age in distinct patterns
From: Weber et al. Am J Clin Nutr. 2013 Jul; 98(1): 49–56.
Complications of excess adiposity
What is the best way to identify excess adiposity?
What is the best way to identify those at greatest risk of health complications of obesity?
http://uploads7.wikiart.org/images/fernando‐botero/family‐scene.jpg
Assessing excess adiposity
BMI is most widely used screening tool
Height and weight measures are relatively easy to obtain
Requires minimal skill, equipment, space to acquire measurements
Excellent reference data to define overweight and obesity
Useful at all levels (population, clinic, research, etc)
4/26/2017
4
Body Mass index (Weight/Height2)
Dependent on accurate measurements – especially for height (or length)
Accurate stadiometer for measuring height by trained personnel
Removal of heavy outer clothing, shoes and hair adornments
Proper positioning of the head and body for accurate measurement
Measurement error in height is “squared” in BMI
High BMI is a good indicator of excess adiposity
Fat mass index and fat free mass index according to BMI-for-age z score in the Pediatric Rosetta Study (n=1186)
Solid lines represent boys, and the dashed lines represent girls
Age 6 Age 17
Freedman and Sherry Pediatrics 2009;124:S23–S34
Strengths and limitations of BMI
Strengths: Low cost, non-invasive,
widely available measure
Excellent reference data
Classification scheme for overweight and obesity
Correlates with other indicators of excess adiposity
Weaknesses: Doesn’t distinguish
between fat and lean mass
Doesn’t measure fat distribution – “harmful fat”
Association of BMI and fatness varies with age
Influenced by pubertal maturation and population ancestry
Other anthropometric measures
http://i.dailymail.co.uk/i/pix/2014/10/17/1413543416710_wps_21_image001_png.jpg
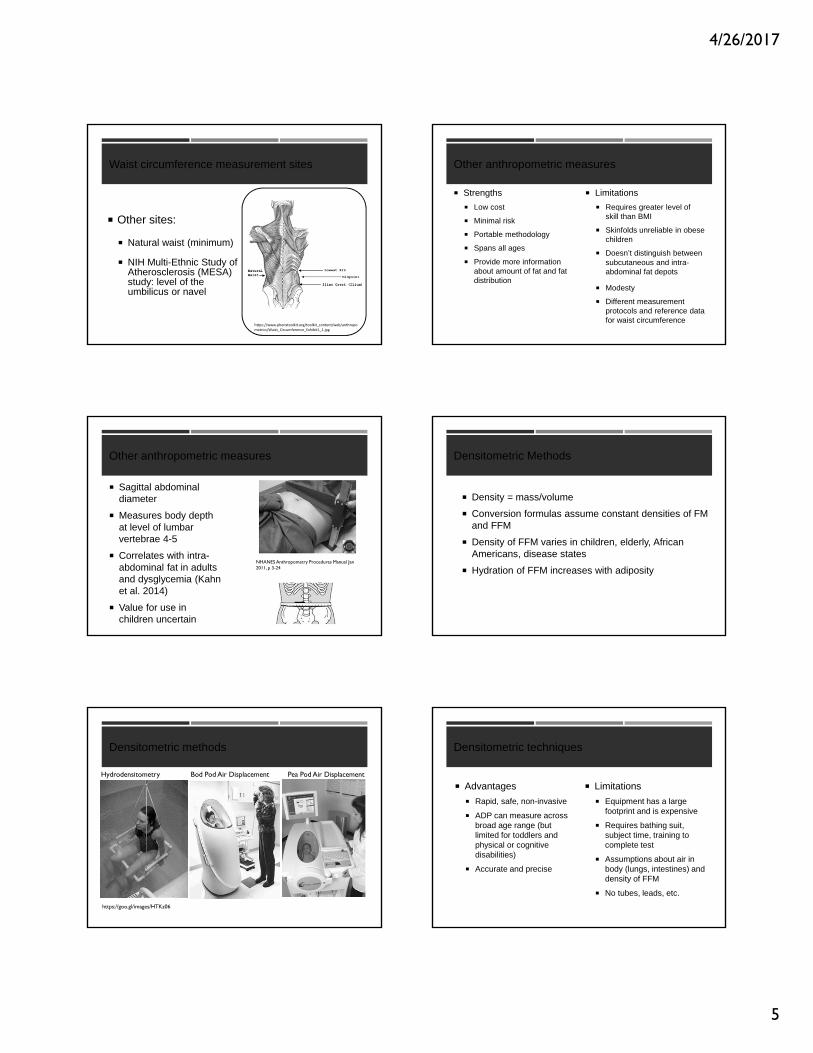
Waist circumference measurement sites
NHANES: top of the iliac crest
Requires palpation
Landmark can be difficult to find in obese children
Not a natural minimum, so tape measure can be difficult to place on the body contour
NHANES Anthropometry Procedures Manual Jan 2011, p 3-20
Waist circumference measurement sites
WHO: midpoint between the last palpable rib and top of the iliac crest Requires palpation Difficult landmarks to
identify in obese children
https://www.phenxtoolkit.org/toolkit_content/web/anthropometrics/Waist_Circumference_Exhibit1_1.jpg
http://www.statcan.gc.ca/pub/82‐003‐x/2012003/article/11707/c‐g/fig1‐eng.gif
4/26/2017
5
Waist circumference measurement sites
Other sites:
Natural waist (minimum)
NIH Multi‐Ethnic Study of Atherosclerosis (MESA) study: level of the umbilicus or navel
https://www.phenxtoolkit.org/toolkit_content/web/anthropometrics/Waist_Circumference_Exhibit1_1.jpg
Other anthropometric measures
Strengths
Low cost
Minimal risk
Portable methodology
Spans all ages
Provide more information about amount of fat and fat distribution
Limitations
Requires greater level of skill than BMI
Skinfolds unreliable in obese children
Doesn’t distinguish between subcutaneous and intra-abdominal fat depots
Modesty
Different measurement protocols and reference data for waist circumference
Other anthropometric measures
Sagittal abdominal diameter
Measures body depth at level of lumbar vertebrae 4-5
Correlates with intra-abdominal fat in adults and dysglycemia (Kahn et al. 2014)
Value for use in children uncertain
NHANES Anthropometry Procedures Manual Jan 2011, p 3-24
Densitometric Methods
Density = mass/volume
Conversion formulas assume constant densities of FM and FFM
Density of FFM varies in children, elderly, African Americans, disease states
Hydration of FFM increases with adiposity
Densitometric methods
https://goo.gl/images/HTKz06
Hydrodensitometry Bod Pod Air Displacement Pea Pod Air Displacement
Densitometric techniques
Advantages
Rapid, safe, non-invasive
ADP can measure across broad age range (but limited for toddlers and physical or cognitive disabilities)
Accurate and precise
Limitations
Equipment has a large footprint and is expensive
Requires bathing suit, subject time, training to complete test
Assumptions about air in body (lungs, intestines) and density of FFM
No tubes, leads, etc.
4/26/2017
6
Isotope Dilution Methods
Usually for measuring total body water (TBW), extracellular and intracellular water
Stable isotopes: naturally occurring, safe
Deuterium oxide (2H20)
Oxygen-18 (expensive, but accurate)
NaBR (extracellular water)
Stable Isotope Technique
Naturally occurring isotopes 18O2 and 2H2O
Baseline urine/saliva sample obtained to measure background quantities of isotopes
Oral dose administered to enrich total body water is with stable isotopes
Elimination of isotopes over time occurs through respiration and water loss
http://www.co2web.info/stabis-w.jpg
Isotope dilution
Advantages: Considered a criterion
(gold-standard) method
Useful for all ages, and most disease states
One of a few possible methods for toddlers
Free-living conditions (field or clinical setting)
Limitations: Lab analysis and some
isotopes are costly
Requires careful attention to measurement protocol
Accurate determination of dose
Results delayed
Assumptions about distribution of TBW in body
Bioelectrical Impedance Analysis
Electrical current flows through the body by the movement of ions through body fluids.
Impedance of a small electrical current passing through the body is proportional to the water and electrolytes in the body
Bioelectrical impedance analysis
Advantages Relatively inexpensive
Small space requirement
Minimal training
Rapid assessment
Good for population surveys
Disadvantages Proprietary predictions equations
Doesn’t perform better than using height and weight to estimate body composition
Standardization of body position, hydration status, consumption of food and beverages, skin and room temperature, and recent physical activity needed
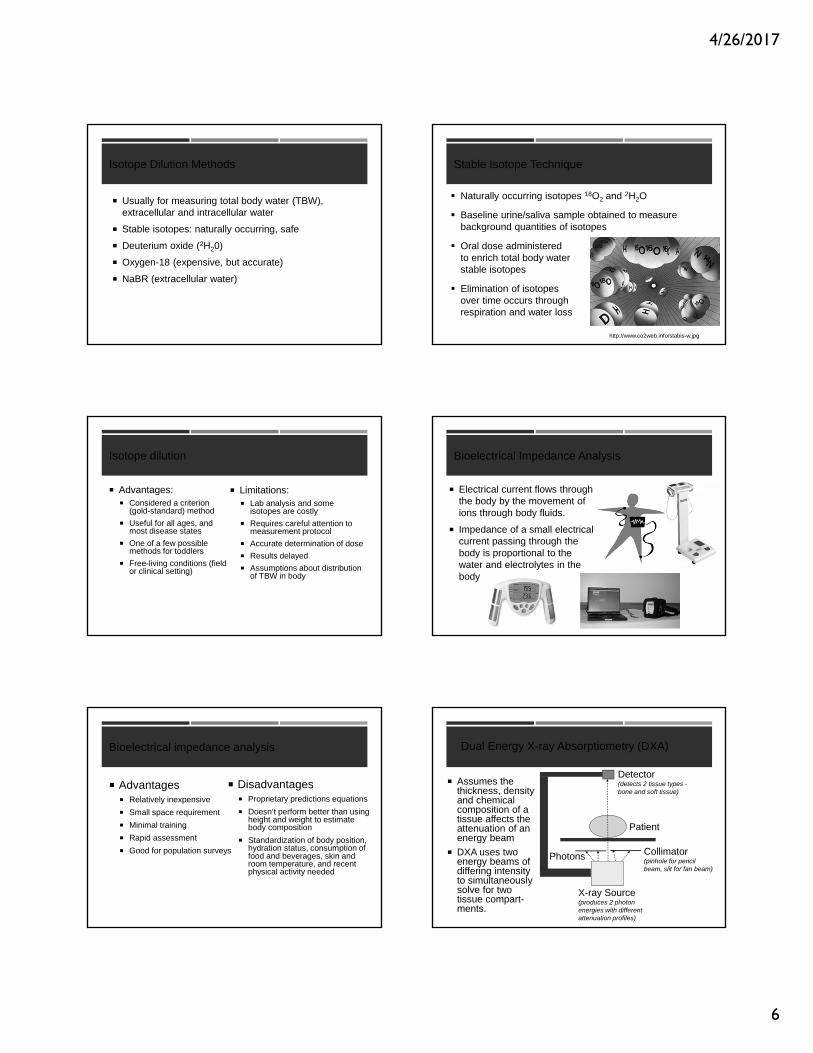
Dual Energy X-ray Absorptiometry (DXA)
Assumes the thickness, density and chemical composition of a tissue affects the attenuation of an energy beam
DXA uses two energy beams of differing intensity to simultaneously solve for two tissue compart-ments.
X-ray Source (produces 2 photon energies with different attenuation profiles)
Photons Collimator (pinhole for pencil beam, slit for fan beam)
Patient
Detector(detects 2 tissue types -bone and soft tissue)
4/26/2017
7
Dual energy x-ray absorptiometry (DXA) Dual energy x-ray absorptiometry (DXA)
Visceral adipose tissue
Indices of fat distribution
Android/gynoid
Trunk/limb fat ratio
Fat mass index
Indices of lean mass
Lean mass index
Appendicular lean mass index
Dual energy x-ray absorptiometry (DXA)
Advantages Measure 3 compartments (fat
mass, lean body mass, bone mass)
Rapid (3 minutes), safe (low x-ray exposure), excellent precision
Can be used for infants, children, adults
Provides regional and whole body measures
NHANES reference data for Hologic DXA
Limitations: Comparability across models,
manufacturers, software versions
Pregnancy test required for females with reproductive potential
Cost and space
Size and composition of marrow space and head not measured
Metal implants/movement artifact
Magnetic Resonance Imaging & Spectroscopy
MRI generates three-dimensional images to quantify volume and distribution of anatomic structures
MRS measures molecules or products of metabolism such as amino acids, lipids, lactate, choline and creatine.
Visceral vs subcutaneous fat
Fat partitioning patterns [transverse magnetic resonance imaging (MRI) slices (L2–L3)] in obese Caucasian (A) and African-American (B) females. Demographics: (A) 14.3-yr old, Tanner 4, body mass index (BMI) 34.7, and BMI Z-score 2.29. (B) 14.8-yr old, Tanner 4, BMI 37.2, and BMI Z-score 2.43. From Koren et al. Pediatric Diabetes 2013: 14: 575–584.
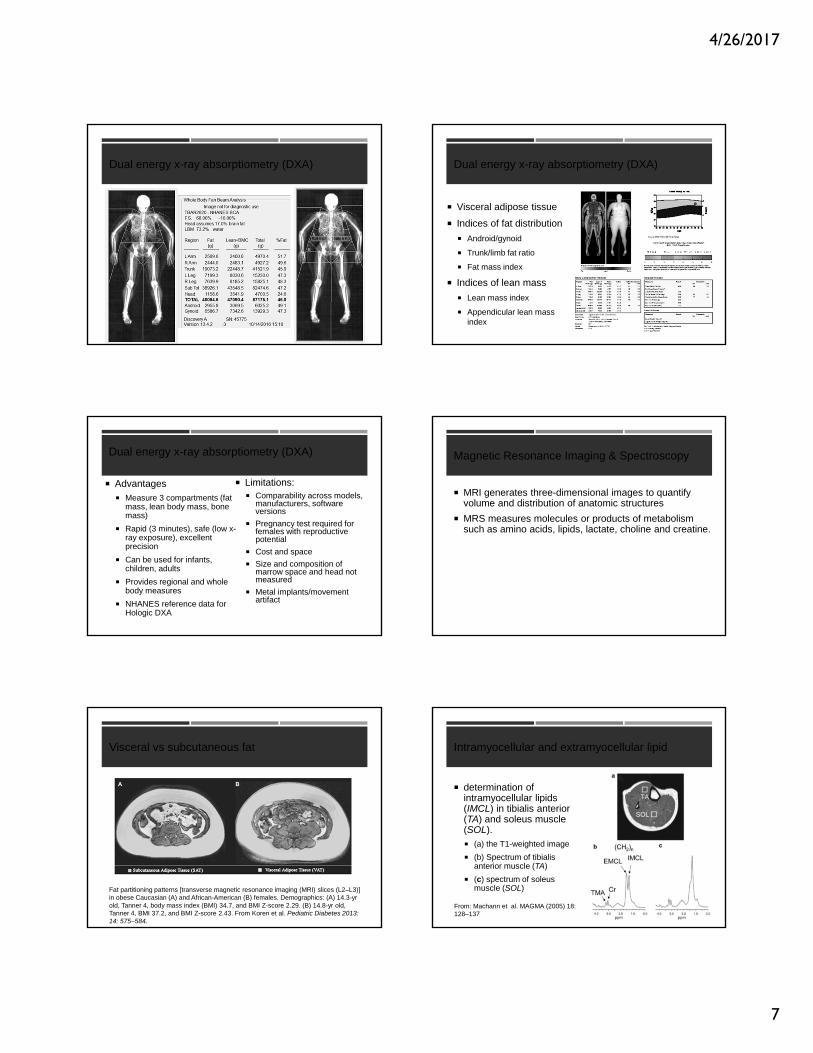
Intramyocellular and extramyocellular lipid
determination of intramyocellular lipids (IMCL) in tibialis anterior (TA) and soleus muscle (SOL). (a) the T1-weighted image
(b) Spectrum of tibialis anterior muscle (TA)
(c) spectrum of soleus muscle (SOL)
From: Machann et al. MAGMA (2005) 18: 128–137
4/26/2017
8
MRI / MRS body composition measures
Strengths
Non-invasive
Measures size and distribution of tissues/organs
Measures composition at tissue level
Limitations
Expense and availability
Useful in research setting
Body composition measures not used clinically (screening, diagnosis, treatment)
Complications of excess adiposity
What is the best way to identify excess adiposity?
What is the best way to identify those at greatest risk of health complications of obesity?
http://uploads7.wikiart.org/images/fernando‐botero/family‐scene.jpg
Visceral vs subcutaneous fat
Koren et al. Pediatric Diabetes 2013: 14: 575–584.
28 healthy weight and 44 obese adolescents
Visceral adipose tissue volume increases exponentially as BMI increases
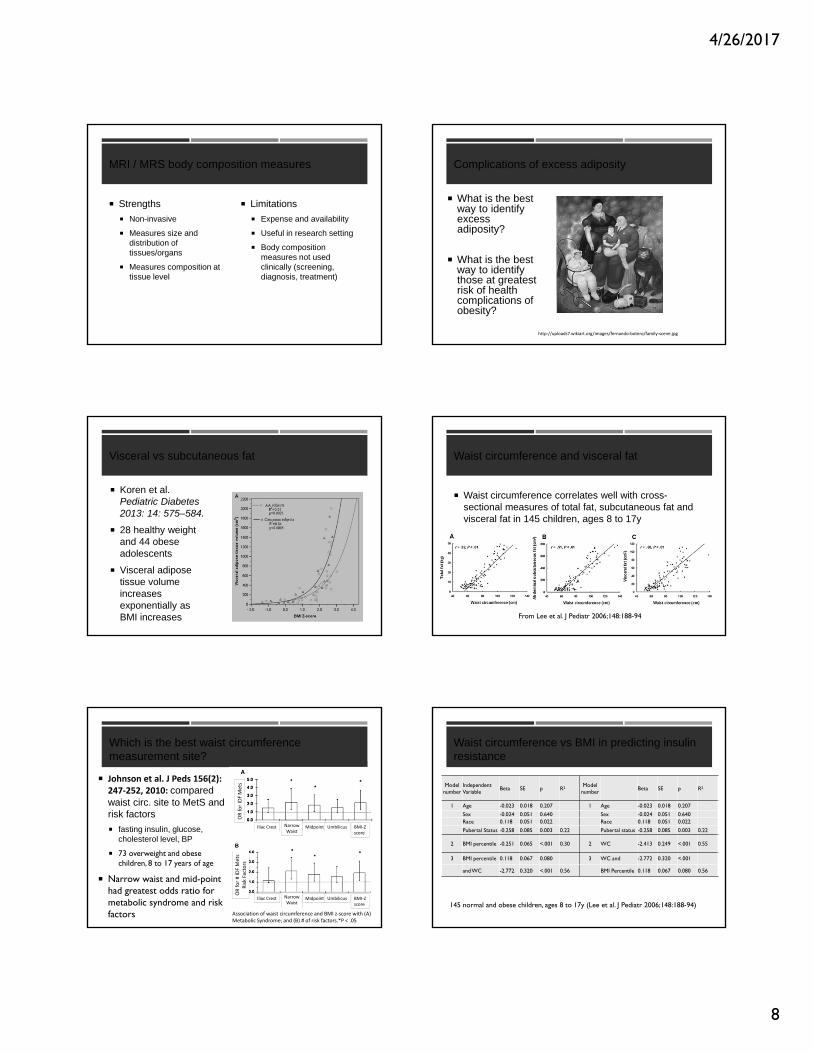
Waist circumference and visceral fat
Waist circumference correlates well with cross-sectional measures of total fat, subcutaneous fat and visceral fat in 145 children, ages 8 to 17y
From Lee et al. J Pediatr 2006;148:188-94
Which is the best waist circumference measurement site?
Johnson et al. J Peds 156(2): 247‐252, 2010: compared waist circ. site to MetS and risk factors
fasting insulin, glucose, cholesterol level, BP
73 overweight and obese children, 8 to 17 years of age
Narrow waist and mid-point had greatest odds ratio for metabolic syndrome and risk factors Association of waist circumference and BMI z‐score with (A)
Metabolic Syndrome; and (B) # of risk factors.*P < .05
Iliac Crest MidpointNarrowWaist
Umbilicus BMI‐Zscore
Iliac Crest MidpointNarrowWaist
Umbilicus BMI‐Zscore
OR fo
r IDF Mets
OR fo
r # ID
F Mets
Risk Factors
Waist circumference vs BMI in predicting insulin resistance
Model number
Independent Variable
Beta SE p R2 Model number
Beta SE p R2
1 Age -0.023 0.018 0.207 1 Age -0.023 0.018 0.207
Sex -0.024 0.051 0.640 Sex -0.024 0.051 0.640Race 0.118 0.051 0.022 Race 0.118 0.051 0.022
Pubertal Status -0.258 0.085 0.003 0.22 Pubertal status -0.258 0.085 0.003 0.22
2 BMI percentile -0.251 0.065 <.001 0.30 2 WC -2.413 0.249 <.001 0.55
3 BMI percentile 0.118 0.067 0.080 3 WC and -2.772 0.320 <.001
and WC -2.772 0.320 <.001 0.56 BMI Percentile 0.118 0.067 0.080 0.56
145 normal and obese children, ages 8 to 17y (Lee et al. J Pediatr 2006;148:188-94)
4/26/2017
9
Waist to Height Ratio vs BMI
From: Mokha et al. BMC Pediatrics 2010, 10:73
Among normal weight, those with high WHtR had increased odds of CMR risk
Waist to Height Ratio vs BMI
From: Mokha et al. BMC Pediatrics 2010, 10:73
Among healthy weight, those with high WHtR had increased odds of CMR riskAmong Overwt/Obese, those with low WHtR had reduced odds of CMR risk
Waist vs BMI as long term predictors of risk
Garnett et al. Am J Clin Nutr 2007;86:549 –55.
342 children measured at age 8 y and a subset of 290 were reevaluated at age 15y.
OR for CVD risk clustering at age 15: 6.9 (95% CI:2.5, 19.0) if overweight/obesity by BMI at age 8
3.6 (95% CI:1.0, 12.9) if increased waist circumference at age 8, but not independent of BMI
BMI was the best long-term predictor of CVD risk
Sagittal abdominal diameter (SAD)
SAD distribution among adults in NHANES (Kahn et al. PLoS One 2014).
SAD was associated with dysglycemia (HbA1c concentration >5.7%) independent of age, and of waist circumference or BMI
Not widely used in children
NHANES Anthropometry Procedures Manual Jan 2011, p 3-24
Sagittal abdominal diameter in children
Weber et al. Diabetes Research and Clinical Practice2014.
65 teen, ages 11-17y, referred for assessment of cardiometabolic risk.
SAD not superior to BMI, waist circumference or waist-to-hip ratio for detection of metabolic syndrome
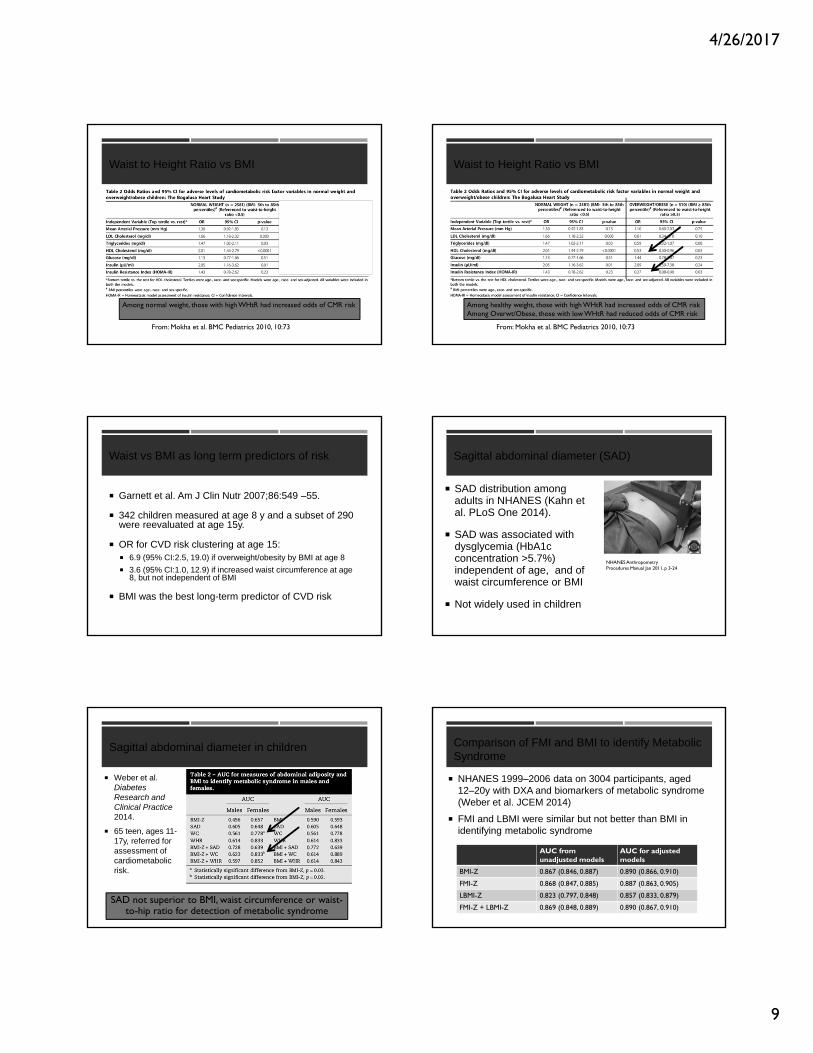
Comparison of FMI and BMI to identify Metabolic Syndrome
AUC from unadjusted models
AUC for adjustedmodels
BMI-Z 0.867 (0.846, 0.887) 0.890 (0.866, 0.910)
FMI-Z 0.868 (0.847, 0.885) 0.887 (0.863, 0.905)
LBMI-Z 0.823 (0.797, 0.848) 0.857 (0.833, 0.879)
FMI-Z + LBMI-Z 0.869 (0.848, 0.889) 0.890 (0.867, 0.910)
NHANES 1999–2006 data on 3004 participants, aged 12–20y with DXA and biomarkers of metabolic syndrome (Weber et al. JCEM 2014)
FMI and LBMI were similar but not better than BMI in identifying metabolic syndrome
4/26/2017
10
???????????????????????????????????????
Need consistent supporting evidence that visceral adipose tissue or waist
circumference measurements offer significant improvement over BMI in
identifying cardiometabolic complications of obesity in children
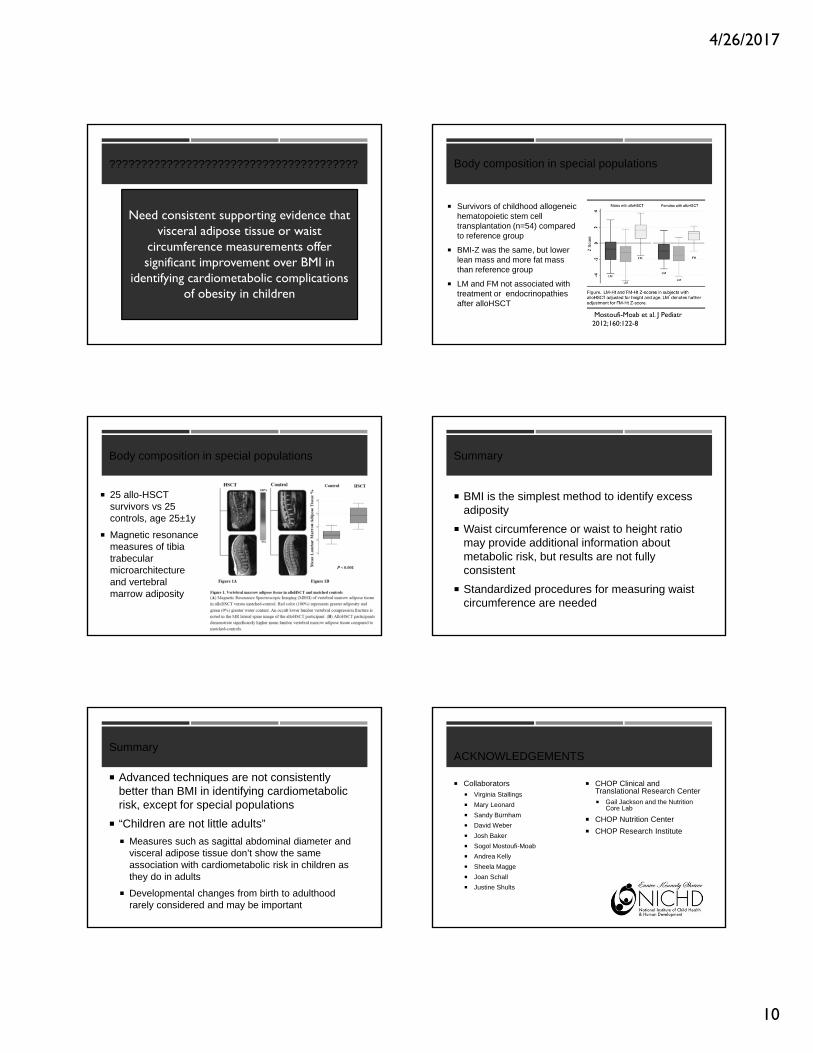
Body composition in special populations
Survivors of childhood allogeneic hematopoietic stem cell transplantation (n=54) compared to reference group
BMI-Z was the same, but lower lean mass and more fat mass than reference group
LM and FM not associated with treatment or endocrinopathies after alloHSCT
Mostoufi-Moab et al. J Pediatr 2012;160:122-8
Body composition in special populations
25 allo-HSCT survivors vs 25 controls, age 25±1y
Magnetic resonance measures of tibia trabecular microarchitecture and vertebral marrow adiposity
Summary
BMI is the simplest method to identify excess adiposity
Waist circumference or waist to height ratio may provide additional information about metabolic risk, but results are not fully consistent
Standardized procedures for measuring waist circumference are needed
Summary
Advanced techniques are not consistently better than BMI in identifying cardiometabolic risk, except for special populations
“Children are not little adults”
Measures such as sagittal abdominal diameter and visceral adipose tissue don’t show the same association with cardiometabolic risk in children as they do in adults
Developmental changes from birth to adulthood rarely considered and may be important
ACKNOWLEDGEMENTS
Collaborators Virginia Stallings
Mary Leonard
Sandy Burnham
David Weber
Josh Baker
Sogol Mostoufi-Moab
Andrea Kelly
Sheela Magge
Joan Schall
Justine Shults
CHOP Clinical and Translational Research Center Gail Jackson and the Nutrition
Core Lab
CHOP Nutrition Center
CHOP Research Institute
4/26/2017
11
Thank you for your attention!
Image from: http://www.boredpanda.com/happy-children-playing/?image_id=children-around-the-world-70.jpg
•Those completing the webinar will be emailed a link to the evaluation.
•The email will be sent to the email address that you used to register for the webinar.
•Complete the evaluation soon after you receive the email. The evaluation does expire after 3 weeks. Once expired, you cannot obtain a certificate.
•Once the evaluation is completed, the certificate will be emailed separately within 2 or 3 business days.
Evaluations and CE Certificates
To Register: Villanova.edu/cope
Upcoming FREE COPE Professional Webinar
Jena Shaw Tronieri, Ph.D.
Assistant Professor of PsychologyDirector of Clinical ServicesCenter for Weight and Eating DisordersDepartment of PsychiatryPerelman School of Medicine at the University of Pennsylvania
Can Acceptance and Commitment Therapy (ACT) Improve Adherence to Weight Loss Goals?
Monday, June 26, 201712:00 PM -1 PM EST1.0 Contact Hour, 1.0 CPEUTo register: villanova.edu/cope
Sponsored by
Moderator: Lisa K. Diewald MS, RD, LDNEmail: [email protected] site: www.villanova.edu/COPE
To receive monthly emails on upcoming COPE events, please join COPE’s Contacts on our website.
Thank you for your time and interest.
Questions and Answers