Embed Size (px)
Citation preview

ZEBRA TECHNOLOGIESSECOND-QUARTER 2017 RESULTS
AUGUST 8, 2017

2
Anders Gustafsson
Chief Executive Officer
Olivier Leonetti
Chief Financial Officer
Statements made in this presentation which are not statements of historical fact are forward-looking
statements and are subject to the safe harbor provisions created by the Private Securities Litigation
Reform Act of 1995. Actual results may differ from those expressed or implied in the company’s forward-
looking statements. Zebra may elect to update forward-looking statements but expressly disclaims any
obligation to do so, even if the company’s estimates change. These forward-looking statements are
based on current expectations, forecasts and assumptions and are subject to the risks and uncertainties
inherent in Zebra’s industry, market conditions, general domestic and international economic conditions,
and other factors. These factors include customer acceptance of Zebra’s hardware and software
products and competitors’ product offerings, and the potential effects of technological changes. The
continued uncertainty over future global economic conditions, the availability of credit, capital markets
volatility, may have adverse effects on Zebra, its suppliers and its customers. In addition, a disruption in
our ability to obtain products from vendors as a result of supply chain constraints, natural disasters or
other circumstances could restrict sales and negatively affect customer relationships. Profits and
profitability will be affected by Zebra’s ability to control manufacturing and operating costs. Because of
its debt, interest rates and financial market conditions will also have an impact on results. Foreign
exchange rates will have an effect on financial results because of the large percentage of our
international sales. The outcome of litigation in which Zebra may be involved is another factor. The
success of integrating acquisitions, including the Enterprise business, could also affect profitability,
reported results and the company’s competitive position in it industry. These and other factors could
have an adverse effect on Zebra’s sales, gross profit margins and results of operations. Descriptions of
the risks, uncertainties and other factors that could affect the company’s future operations and results
can be found in Zebra’s filings with the Securities and Exchange Commission. In particular, please refer
to Zebra’s latest filing of its Form 10-K. This presentation includes certain non-GAAP financial measures
and we refer to the reconciliations to the comparable GAAP financial measures and related information.
Safe Harbor Statement
3
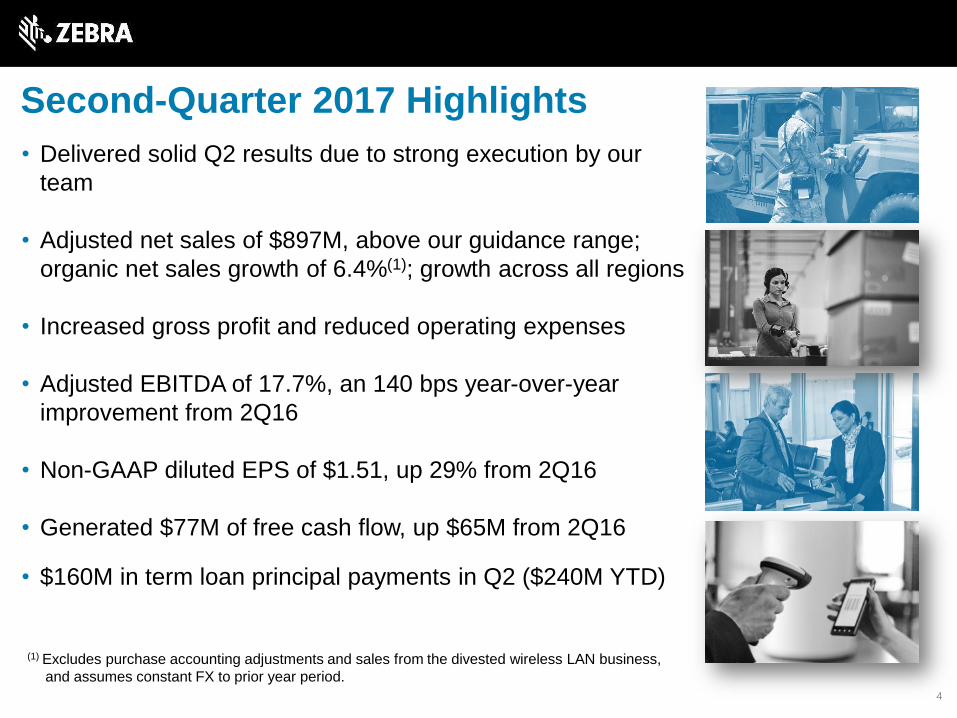
Second-Quarter 2017 Highlights
• Delivered solid Q2 results due to strong execution by our
team
• Adjusted net sales of $897M, above our guidance range;
organic net sales growth of 6.4%(1); growth across all regions
• Increased gross profit and reduced operating expenses
• Adjusted EBITDA of 17.7%, an 140 bps year-over-year
improvement from 2Q16
• Non-GAAP diluted EPS of $1.51, up 29% from 2Q16
• Generated $77M of free cash flow, up $65M from 2Q16
• $160M in term loan principal payments in Q2 ($240M YTD)
4
(1) Excludes purchase accounting adjustments and sales from the divested wireless LAN business,
and assumes constant FX to prior year period.
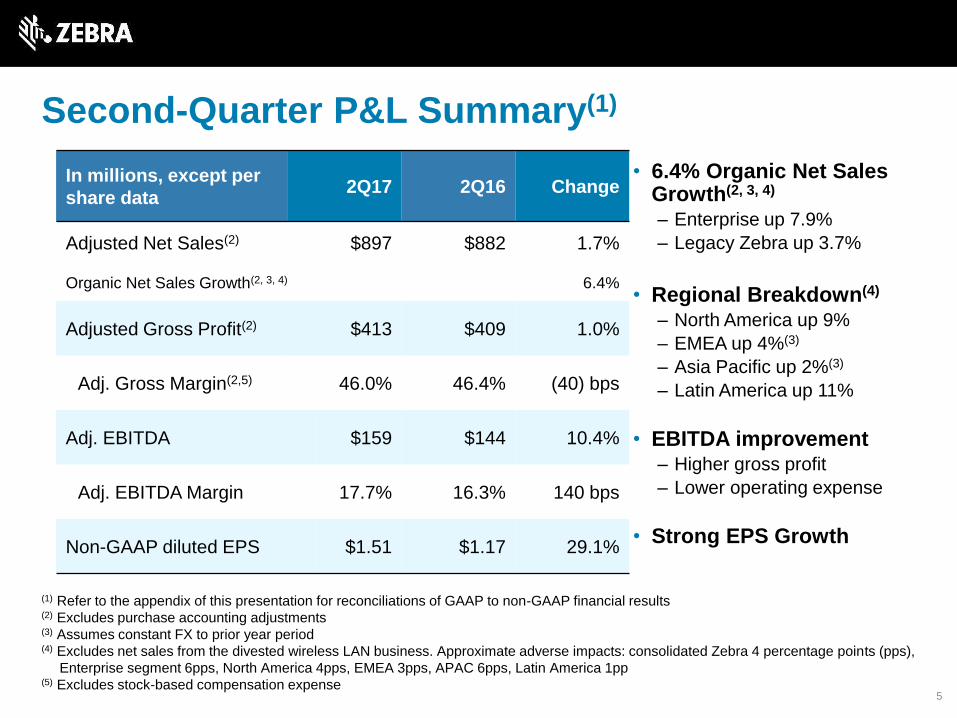
Second-Quarter P&L Summary(1)
In millions, except per
share data2Q17 2Q16 Change
Adjusted Net Sales(2) $897 $882 1.7%
Organic Net Sales Growth(2, 3, 4) 6.4%
Adjusted Gross Profit(2) $413 $409 1.0%
Adj. Gross Margin(2,5) 46.0% 46.4% (40) bps
Adj. EBITDA $159 $144 10.4%
Adj. EBITDA Margin 17.7% 16.3% 140 bps
Non-GAAP diluted EPS $1.51 $1.17 29.1%
5
• 6.4% Organic Net Sales Growth(2, 3, 4)
‒ Enterprise up 7.9%
‒ Legacy Zebra up 3.7%
• Regional Breakdown(4)
‒ North America up 9%
‒ EMEA up 4%(3)
‒ Asia Pacific up 2%(3)
‒ Latin America up 11%
• EBITDA improvement‒ Higher gross profit
‒ Lower operating expense
• Strong EPS Growth
(1) Refer to the appendix of this presentation for reconciliations of GAAP to non-GAAP financial results(2) Excludes purchase accounting adjustments(3) Assumes constant FX to prior year period(4) Excludes net sales from the divested wireless LAN business. Approximate adverse impacts: consolidated Zebra 4 percentage points (pps),
Enterprise segment 6pps, North America 4pps, EMEA 3pps, APAC 6pps, Latin America 1pp(5) Excludes stock-based compensation expense
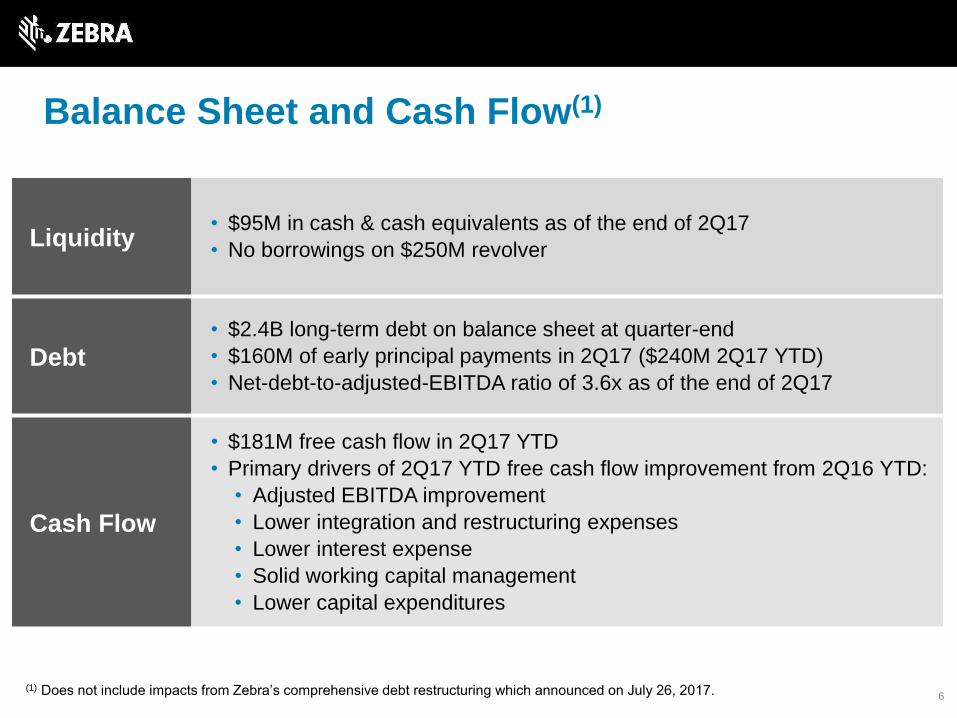
Balance Sheet and Cash Flow(1)
6
Liquidity• $95M in cash & cash equivalents as of the end of 2Q17
• No borrowings on $250M revolver
Debt• $2.4B long-term debt on balance sheet at quarter-end
• $160M of early principal payments in 2Q17 ($240M 2Q17 YTD)
• Net-debt-to-adjusted-EBITDA ratio of 3.6x as of the end of 2Q17
Cash Flow
• $181M free cash flow in 2Q17 YTD
• Primary drivers of 2Q17 YTD free cash flow improvement from 2Q16 YTD:
• Adjusted EBITDA improvement
• Lower integration and restructuring expenses
• Lower interest expense
• Solid working capital management
• Lower capital expenditures
(1) Does not include impacts from Zebra’s comprehensive debt restructuring which announced on July 26, 2017.
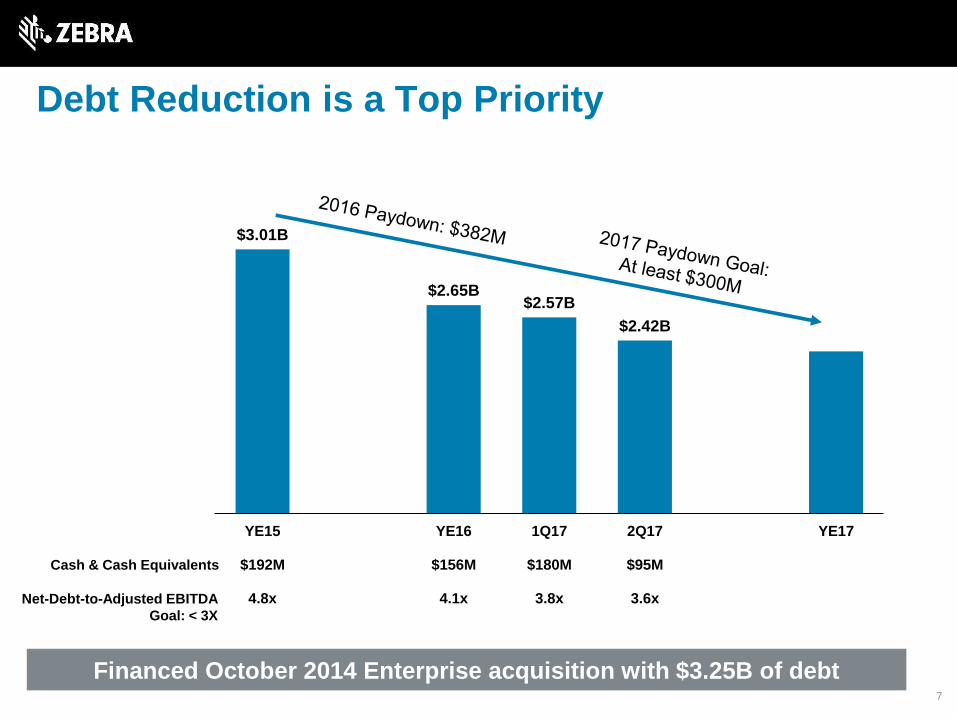
$3.01B
$2.65B$2.57B
$2.42B
100
120
140
160
180
200
220
240
260
1.3
1.5
1.7
1.9
2.1
2.3
2.5
2.7
2.9
3.1
YE15
$192M
4.8x
YE16
$156M
4.1x
1Q17
$180M
3.8x
2Q17
$95M
3.6x
YE17
Debt Reduction is a Top Priority
Financed October 2014 Enterprise acquisition with $3.25B of debt
Net-Debt-to-Adjusted EBITDA
Goal: < 3X
Cash & Cash Equivalents
7
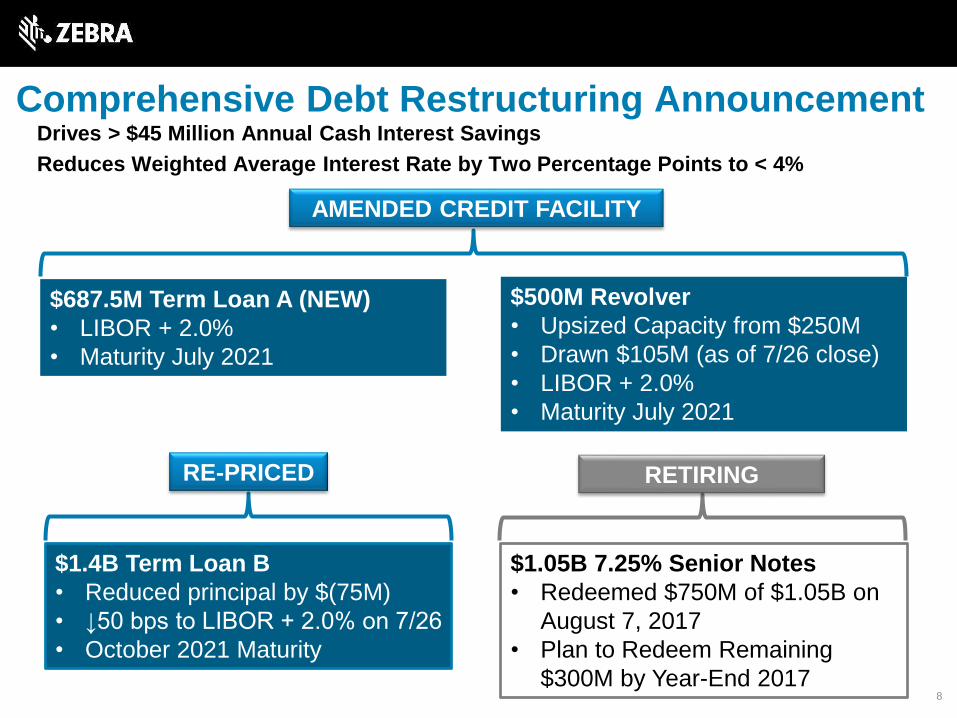
Comprehensive Debt Restructuring AnnouncementDrives > $45 Million Annual Cash Interest Savings
Reduces Weighted Average Interest Rate by Two Percentage Points to < 4%
$500M Revolver
• Upsized Capacity from $250M
• Drawn $105M (as of 7/26 close)
• LIBOR + 2.0%
• Maturity July 2021
$687.5M Term Loan A (NEW)
• LIBOR + 2.0%
• Maturity July 2021
AMENDED CREDIT FACILITY
$1.4B Term Loan B
• Reduced principal by $(75M)
• ↓50 bps to LIBOR + 2.0% on 7/26
• October 2021 Maturity
$1.05B 7.25% Senior Notes
• Redeemed $750M of $1.05B on
August 7, 2017
• Plan to Redeem Remaining
$300M by Year-End 2017
RE-PRICED RETIRING
8
Outlook
9
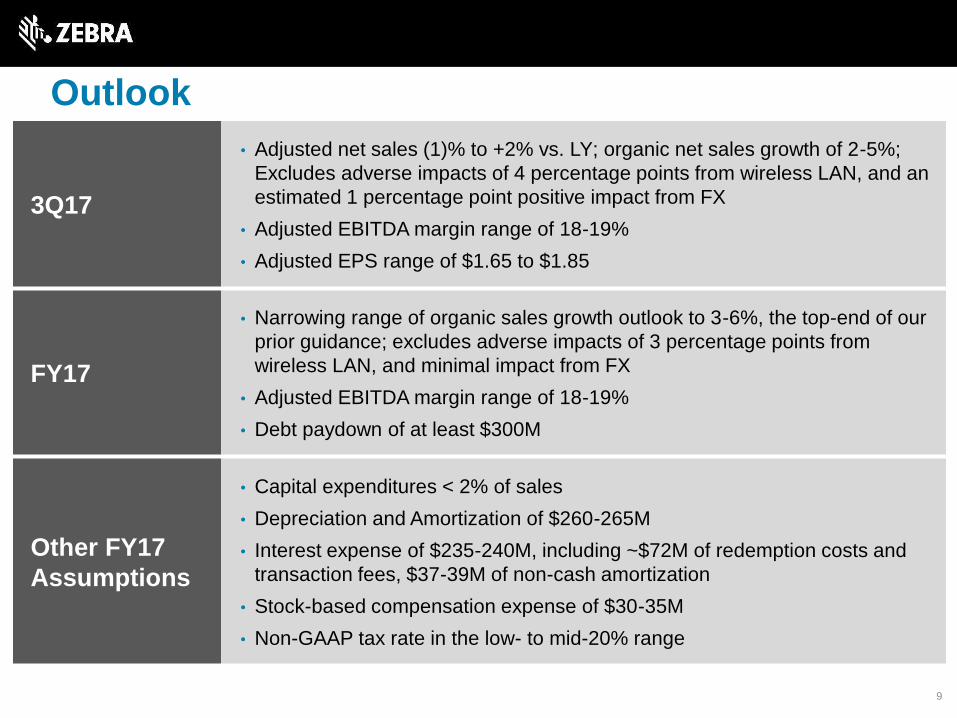
3Q17
• Adjusted net sales (1)% to +2% vs. LY; organic net sales growth of 2-5%;
Excludes adverse impacts of 4 percentage points from wireless LAN, and an
estimated 1 percentage point positive impact from FX
• Adjusted EBITDA margin range of 18-19%
• Adjusted EPS range of $1.65 to $1.85
FY17
• Narrowing range of organic sales growth outlook to 3-6%, the top-end of our
prior guidance; excludes adverse impacts of 3 percentage points from
wireless LAN, and minimal impact from FX
• Adjusted EBITDA margin range of 18-19%
• Debt paydown of at least $300M
Other FY17
Assumptions
• Capital expenditures < 2% of sales
• Depreciation and Amortization of $260-265M
• Interest expense of $235-240M, including ~$72M of redemption costs and
transaction fees, $37-39M of non-cash amortization
• Stock-based compensation expense of $30-35M
• Non-GAAP tax rate in the low- to mid-20% range
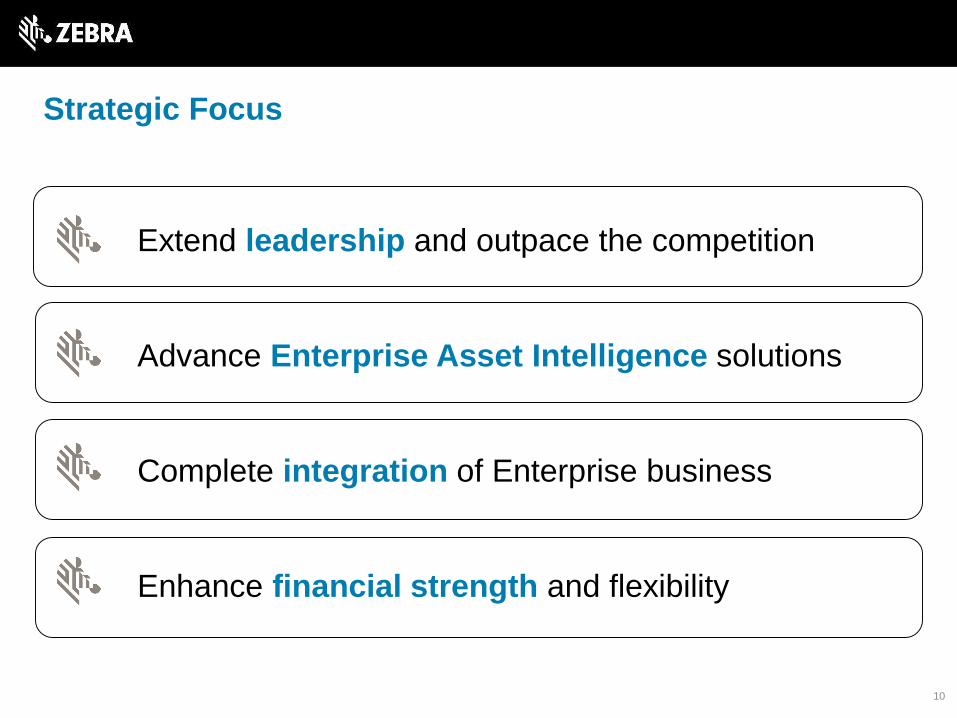
Strategic Focus
10
Extend leadership and outpace the competition
Advance Enterprise Asset Intelligence solutions
Complete integration of Enterprise business
Enhance financial strength and flexibility
11
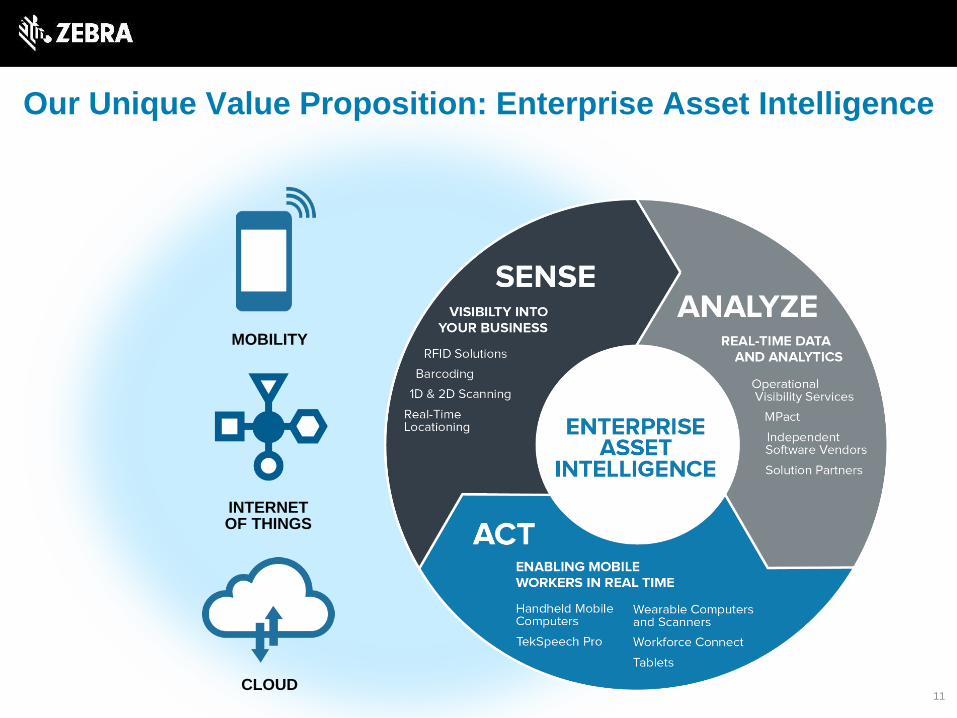
INTERNET OF THINGS
CLOUD
MOBILITY
Our Unique Value Proposition: Enterprise Asset Intelligence
11

Enabling Visibility Across Vertical MarketsFavorable Industry Dynamics Driving Growth
Simplify
Operations and
Comply with
Regulations
Empower Mobile
Workers
12
Enhance
Customer/Patient
Experience
Track Inventory /
Supply Chain
Locationing

QUESTIONS?

APPENDIX
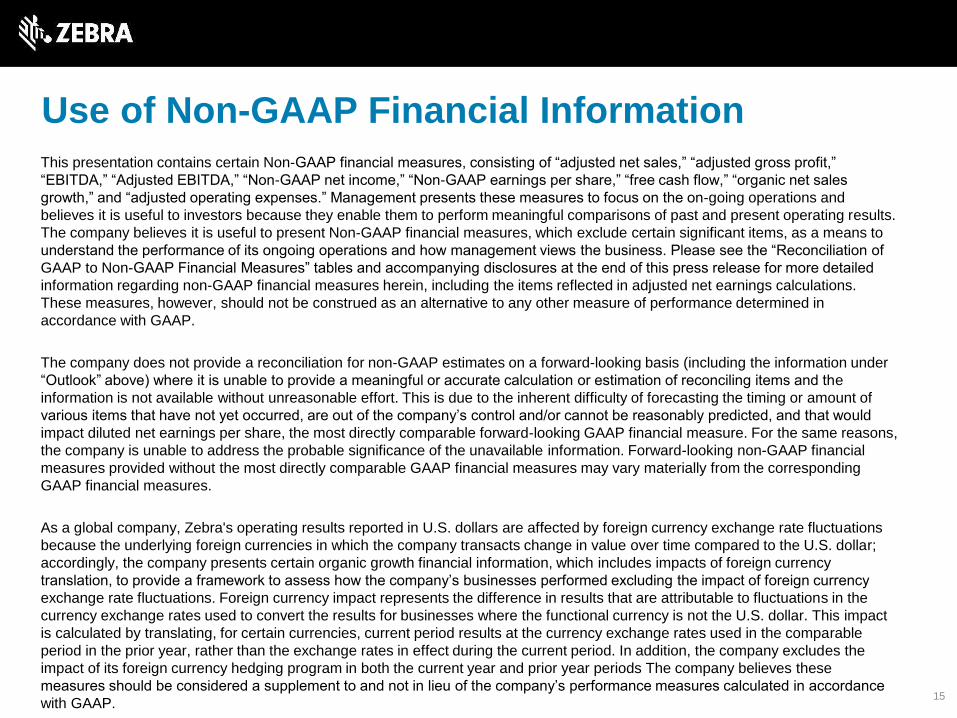
This presentation contains certain Non-GAAP financial measures, consisting of “adjusted net sales,” “adjusted gross profit,”
“EBITDA,” “Adjusted EBITDA,” “Non-GAAP net income,” “Non-GAAP earnings per share,” “free cash flow,” “organic net sales
growth,” and “adjusted operating expenses.” Management presents these measures to focus on the on-going operations and
believes it is useful to investors because they enable them to perform meaningful comparisons of past and present operating results.
The company believes it is useful to present Non-GAAP financial measures, which exclude certain significant items, as a means to
understand the performance of its ongoing operations and how management views the business. Please see the “Reconciliation of
GAAP to Non-GAAP Financial Measures” tables and accompanying disclosures at the end of this press release for more detailed
information regarding non-GAAP financial measures herein, including the items reflected in adjusted net earnings calculations.
These measures, however, should not be construed as an alternative to any other measure of performance determined in
accordance with GAAP.
The company does not provide a reconciliation for non-GAAP estimates on a forward-looking basis (including the information under
“Outlook” above) where it is unable to provide a meaningful or accurate calculation or estimation of reconciling items and the
information is not available without unreasonable effort. This is due to the inherent difficulty of forecasting the timing or amount of
various items that have not yet occurred, are out of the company’s control and/or cannot be reasonably predicted, and that would
impact diluted net earnings per share, the most directly comparable forward-looking GAAP financial measure. For the same reasons,
the company is unable to address the probable significance of the unavailable information. Forward-looking non-GAAP financial
measures provided without the most directly comparable GAAP financial measures may vary materially from the corresponding
GAAP financial measures.
As a global company, Zebra's operating results reported in U.S. dollars are affected by foreign currency exchange rate fluctuations
because the underlying foreign currencies in which the company transacts change in value over time compared to the U.S. dollar;
accordingly, the company presents certain organic growth financial information, which includes impacts of foreign currency
translation, to provide a framework to assess how the company’s businesses performed excluding the impact of foreign currency
exchange rate fluctuations. Foreign currency impact represents the difference in results that are attributable to fluctuations in the
currency exchange rates used to convert the results for businesses where the functional currency is not the U.S. dollar. This impact
is calculated by translating, for certain currencies, current period results at the currency exchange rates used in the comparable
period in the prior year, rather than the exchange rates in effect during the current period. In addition, the company excludes the
impact of its foreign currency hedging program in both the current year and prior year periods The company believes these
measures should be considered a supplement to and not in lieu of the company’s performance measures calculated in accordance
with GAAP.
Use of Non-GAAP Financial Information
15
GAAP to Non-GAAP Reconciliation
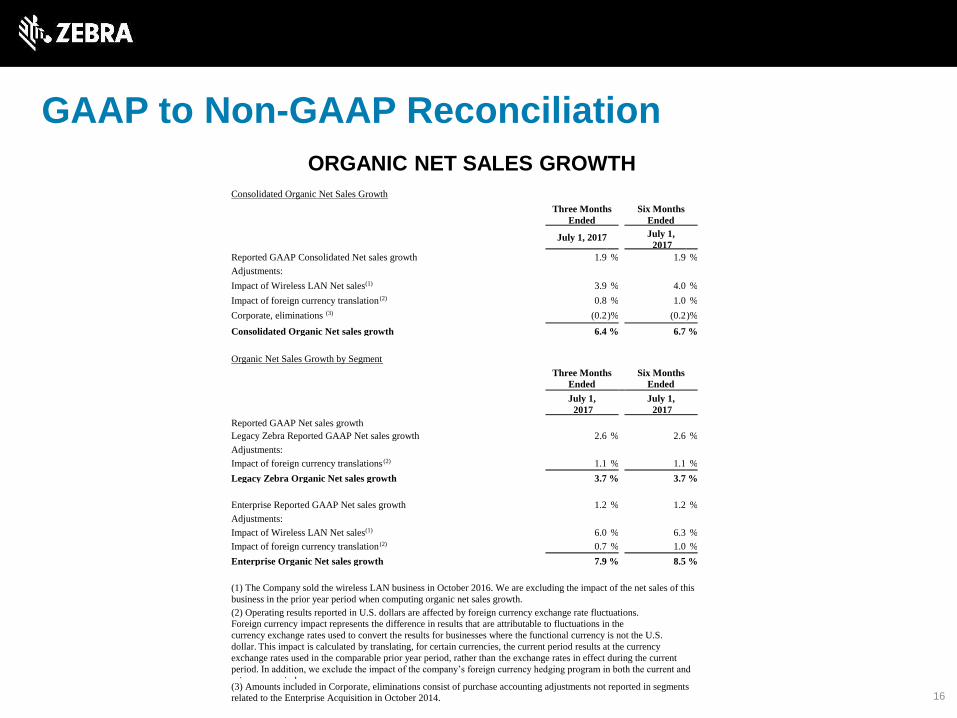
ORGANIC NET SALES GROWTH
Consolidated Organic Net Sales Growth
Three Months
Ended Six Months
Ended
July 1, 2017 July 1,
2017
Reported GAAP Consolidated Net sales growth 1.9 % 1.9 %
Adjustments:
Impact of Wireless LAN Net sales(1) 3.9 % 4.0 %
Impact of foreign currency translation (2) 0.8 % 1.0 %
Corporate, eliminations (3) (0.2 )% (0.2 )%
Consolidated Organic Net sales growth 6.4 % 6.7 %
Organic Net Sales Growth by Segment
Three Months
Ended Six Months
Ended
July 1,
2017 July 1,
2017
Reported GAAP Net sales growth
Legacy Zebra Reported GAAP Net sales growth 2.6 % 2.6 %
Adjustments:
Impact of foreign currency translations (2) 1.1 % 1.1 %
Legacy Zebra Organic Net sales growth 3.7 % 3.7 %
Enterprise Reported GAAP Net sales growth 1.2 % 1.2 %
Adjustments:
Impact of Wireless LAN Net sales(1) 6.0 % 6.3 %
Impact of foreign currency translation (2) 0.7 % 1.0 %
Enterprise Organic Net sales growth 7.9 % 8.5 %
(1) The Company sold the wireless LAN business in October 2016. We are excluding the impact of the net sales of this
business in the prior year period when computing organic net sales growth.
(2) Operating results reported in U.S. dollars are affected by foreign currency exchange rate fluctuations.
Foreign currency impact represents the difference in results that are attributable to fluctuations in the
currency exchange rates used to convert the results for businesses where the functional currency is not the U.S.
dollar. This impact is calculated by translating, for certain currencies, the current period results at the currency
exchange rates used in the comparable prior year period, rather than the exchange rates in effect during the current
period. In addition, we exclude the impact of the company’s foreign currency hedging program in both the current and
prior year periods. (3) Amounts included in Corporate, eliminations consist of purchase accounting adjustments not reported in segments
related to the Enterprise Acquisition in October 2014.
16
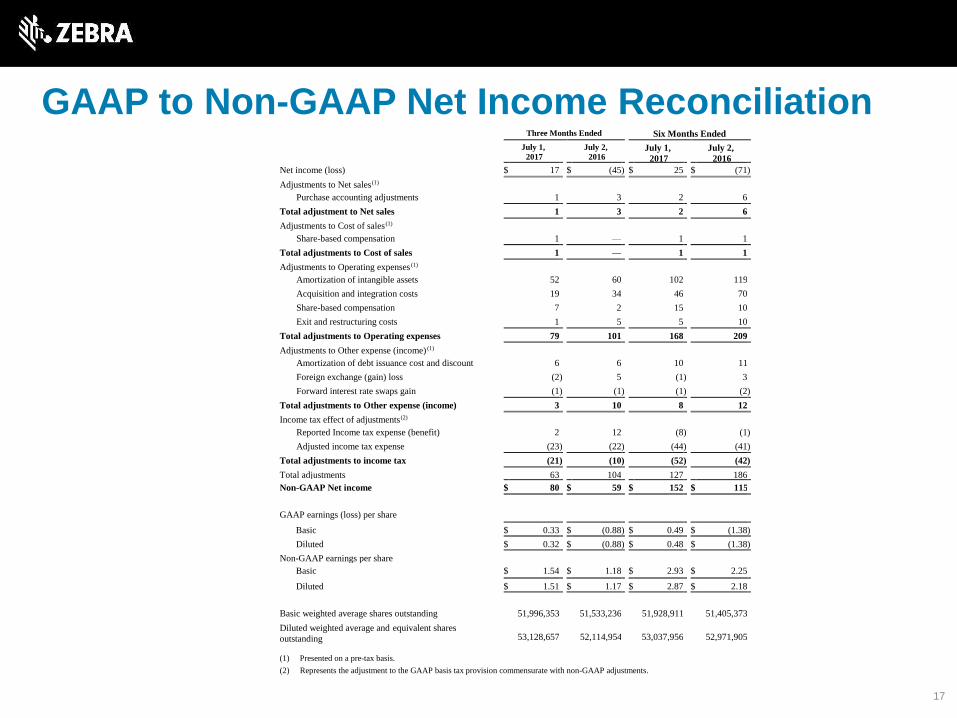
GAAP to Non-GAAP Net Income Reconciliation
17
Three Months Ended Six Months Ended
July 1,
2017 July 2,
2016 July 1,
2017 July 2,
2016
Net income (loss) $ 17 $ (45 ) $ 25 $ (71 )
Adjustments to Net sales(1)
Purchase accounting adjustments 1 3 2 6
Total adjustment to Net sales 1 3 2 6
Adjustments to Cost of sales (1)
Share-based compensation 1 — 1 1
Total adjustments to Cost of sales 1 — 1 1
Adjustments to Operating expenses (1)
Amortization of intangible assets 52 60 102 119
Acquisition and integration costs 19 34 46 70
Share-based compensation 7 2 15 10
Exit and restructuring costs 1 5 5 10
Total adjustments to Operating expenses 79 101 168 209
Adjustments to Other expense (income) (1)
Amortization of debt issuance cost and discount 6 6 10 11
Foreign exchange (gain) loss (2 ) 5 (1 ) 3
Forward interest rate swaps gain (1 ) (1 ) (1 ) (2 )
Total adjustments to Other expense (income) 3 10 8 12
Income tax effect of adjustments(2)
Reported Income tax expense (benefit) 2 12 (8 ) (1 )
Adjusted income tax expense (23 ) (22 ) (44 ) (41 )
Total adjustments to income tax (21 ) (10 ) (52 ) (42 )
Total adjustments 63 104 127 186
Non-GAAP Net income $ 80 $ 59 $ 152 $ 115
GAAP earnings (loss) per share
Basic $ 0.33 $ (0.88 ) $ 0.49 $ (1.38 )
Diluted $ 0.32 $ (0.88 ) $ 0.48 $ (1.38 )
Non-GAAP earnings per share
Basic $ 1.54 $ 1.18 $ 2.93 $ 2.25
Diluted $ 1.51 $ 1.17 $ 2.87 $ 2.18
Basic weighted average shares outstanding 51,996,353 51,533,236 51,928,911 51,405,373
Diluted weighted average and equivalent shares
outstanding 53,128,657
52,114,954
53,037,956
52,971,905
(1) Presented on a pre-tax basis.
(2) Represents the adjustment to the GAAP basis tax provision commensurate with non-GAAP adjustments.
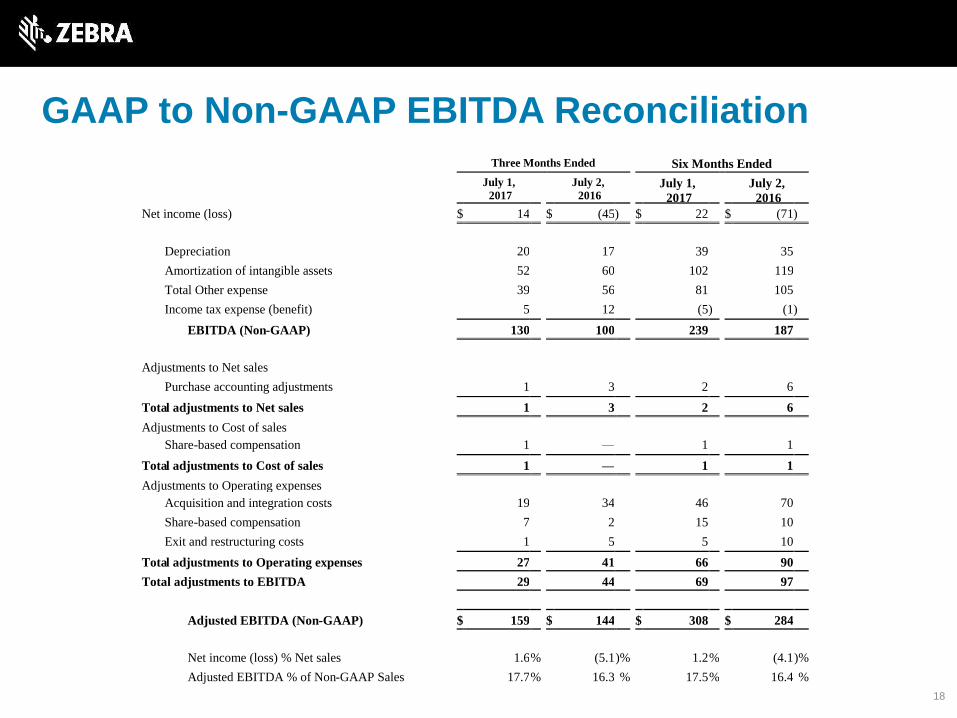
GAAP to Non-GAAP EBITDA Reconciliation
18
Three Months Ended Six Months Ended
July 1,
2017 July 2,
2016 July 1,
2017 July 2,
2016
Net income (loss) $ 14 $ (45 ) $ 22 $ (71 )
Depreciation 20 17 39 35
Amortization of intangible assets 52 60 102 119
Total Other expense 39 56 81 105
Income tax expense (benefit) 5 12 (5 ) (1 )
EBITDA (Non-GAAP) 130 100 239 187
Adjustments to Net sales
Purchase accounting adjustments 1 3 2 6
Total adjustments to Net sales 1 3 2 6
Adjustments to Cost of sales
Share-based compensation 1 — 1 1
Total adjustments to Cost of sales 1 — 1 1
Adjustments to Operating expenses
Acquisition and integration costs 19 34 46 70
Share-based compensation 7 2 15 10
Exit and restructuring costs 1 5 5 10
Total adjustments to Operating expenses 27 41 66 90
Total adjustments to EBITDA 29 44 69 97
Adjusted EBITDA (Non-GAAP) $ 159 $ 144 $ 308 $ 284
Net income (loss) % Net sales 1.6 % (5.1 )% 1.2 % (4.1 )%
Adjusted EBITDA % of Non-GAAP Sales 17.7 % 16.3 % 17.5 % 16.4 %
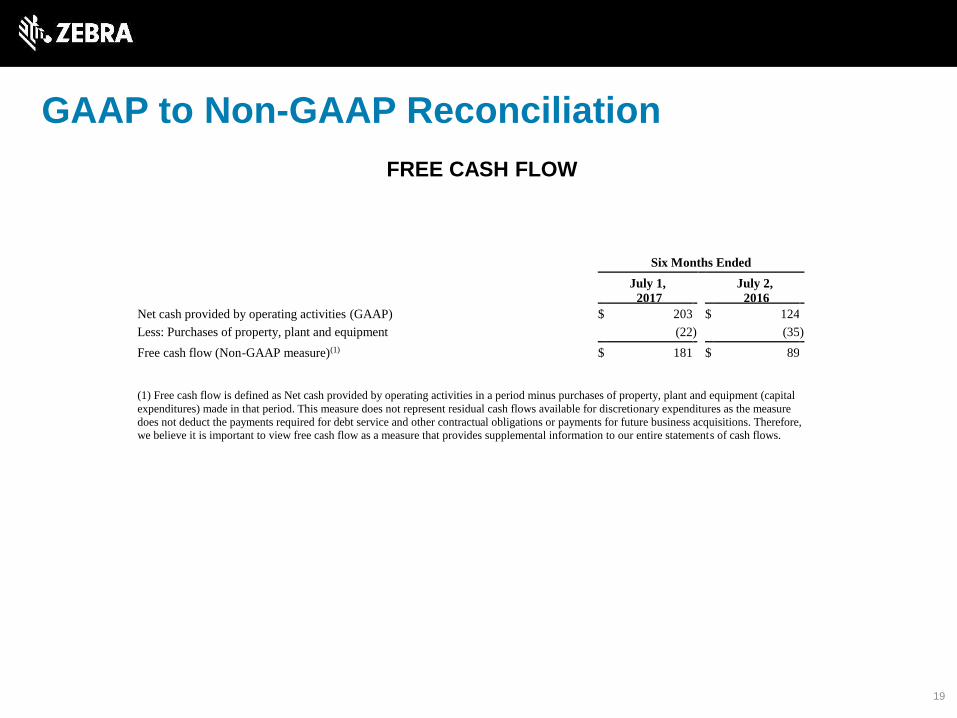
GAAP to Non-GAAP Reconciliation
19
FREE CASH FLOW
Six Months Ended
July 1,
2017 July 2,
2016
Net cash provided by operating activities (GAAP) $ 203 $ 124
Less: Purchases of property, plant and equipment (22 ) (35 )
Free cash flow (Non-GAAP measure)(1) $ 181 $ 89
(1) Free cash flow is defined as Net cash provided by operating activities in a period minus purchases of property, plant and equipment (capital
expenditures) made in that period. This measure does not represent residual cash flows available for discretionary expenditures as the measure
does not deduct the payments required for debt service and other contractual obligations or payments for future business acquisitions. Therefore, we believe it is important to view free cash flow as a measure that provides supplemental information to our entire statements of cash flows.