Embed Size (px)
Citation preview
© U
NIC
EF T
anza
nia/
Kate
Hol
t
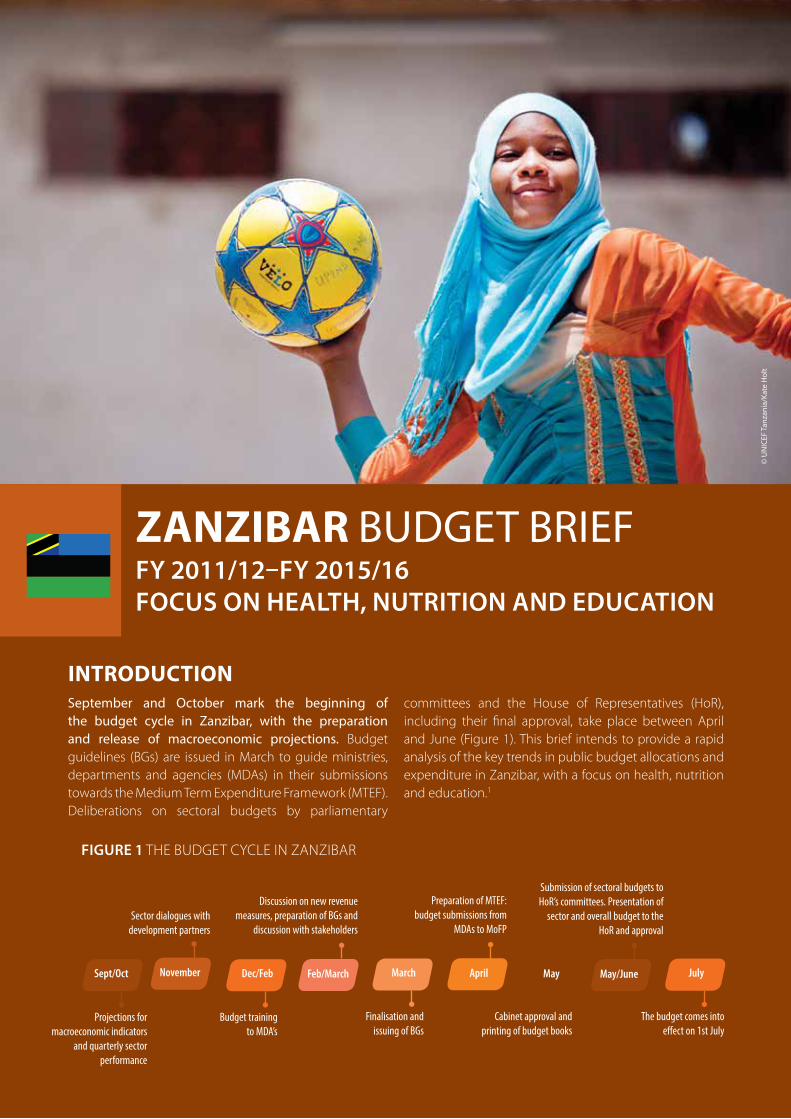
ZanZibar bUdgET brIEFFY 2011/12–FY 2015/16 Focus on health, nutrition and education
September and October mark the beginning of the budget cycle in Zanzibar, with the preparation and release of macroeconomic projections. Budget guidelines (BGs) are issued in March to guide ministries, departments and agencies (MDAs) in their submissions towards the Medium Term Expenditure Framework (MTEF). Deliberations on sectoral budgets by parliamentary
committees and the House of Representatives (HoR), including their final approval, take place between April and June (Figure 1). This brief intends to provide a rapid analysis of the key trends in public budget allocations and expenditure in Zanzibar, with a focus on health, nutrition and education.1
inTrODUCTiOn
Figure 1 THE BuDGET cyclE in ZAnZiBAR
Sept/Oct
Projections for macroeconomic indicators
and quarterly sector performance
November
Sector dialogues with development partners
Dec/Feb
Budget training to MDA’s
Feb/March
Discussion on new revenue measures, preparation of BGs and
discussion with stakeholders
March
Finalisation and issuing of BGs
April
Preparation of MTEF: budget submissions from
MDAs to MoFP
May
Cabinet approval and printing of budget books
May/June
Submission of sectoral budgets to HoR’s committees. Presentation of
sector and overall budget to the HoR and approval
July
The budget comes into effect on 1st July
2 | Zanzibar Budget Brief
» the government’s overall income3 has been growing at an average annual rate of 21 per cent since FY 2011/12.
» rising levels of borrowing, foreign grants and domestic revenue are behind this growth.
» domestic revenue has been bolstered by improved tax collection; Vat accounts for more than a third of total tax collection.
» Zanzibar outperforms its neighbours in the east african community by collecting on average tshs 20 in tax out of every tshs 100 generated in the economy.4
» increasing domestic revenue, together with foreign grants, are critical in the wake of declining resources from general budget support.
Zanzibar outperforms its
neighbours in the east african
community by collecting on
average tshs 16 in tax out of
every tshs 100 generated in
the economy.
© U
NIC
EF T
anza
nia/
Kate
Hol
t
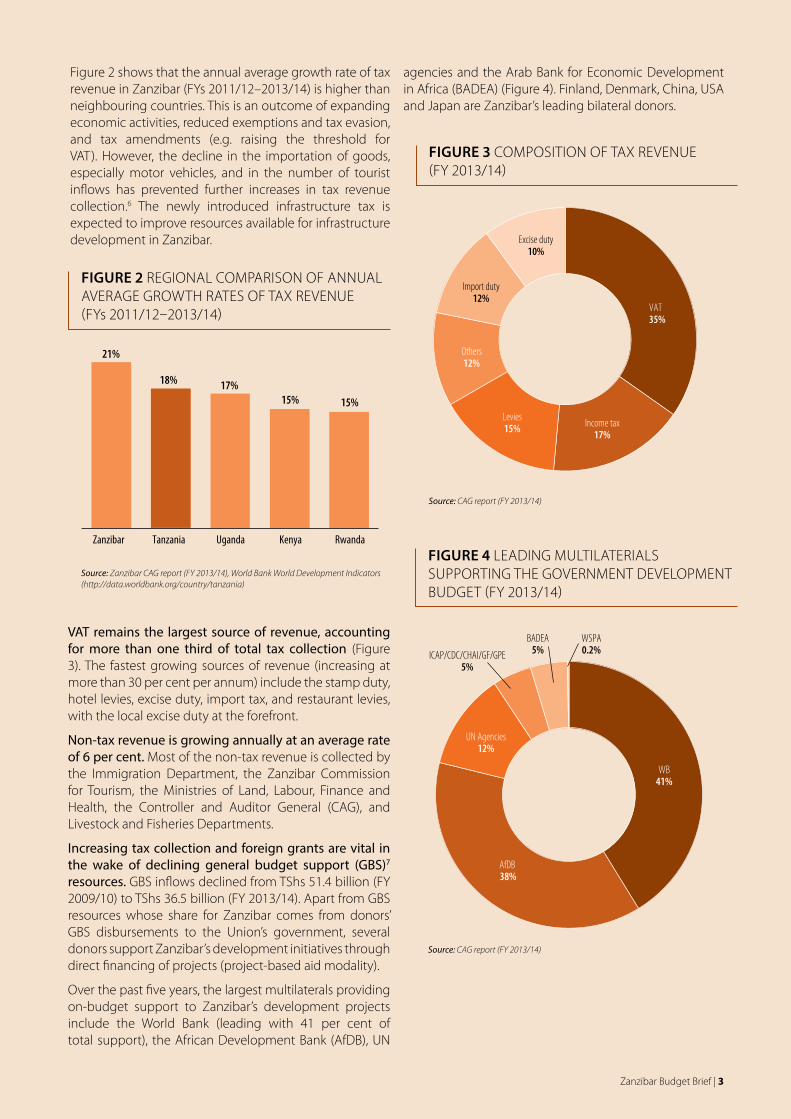
Tax revenue5 in Zanzibar is growing at an average annual rate of 21 per cent, far ahead of most East African Community (EAC) members. Zanzibar has outperformed its neighbours by collecting on average (over Fy 2010/11 - 2013/14) TShs 16 out of every TShs 100 generated in
the economy. The tax revenue to gross domestic product (GDP) ratio in Tanzania Mainland and uganda only stands at 12 per cent and 11 per cent, respectively. nevertheless more efforts are needed, as the norm in OEcD economies is a tax-GDP ratio of around 30 per cent.
The traditional budgeting structure of presenting expenditures by line item has been formally replaced by programme-based budgeting (Pbb) during FY 2015/16. The advantages of PBB include, among others, the ability to lay out government spending according to programmes being implemented, shifting emphasis from inputs (activities) and outputs to outcomes, service delivery
and results. in brief, the PBB framework ties objectives, programmes and budgets together. in Fy 2016/17, the PBB structure will be enhanced with the introduction of the un cOFOG2 budget classification codes. The codes will allow classification of the national budget by sectors (i.e. general public services, defence, social and economic services).
GOvernmenT inCOme
Key messages
Zanzibar Budget Brief | 3
Figure 2 shows that the annual average growth rate of tax revenue in Zanzibar (Fys 2011/12–2013/14) is higher than neighbouring countries. This is an outcome of expanding economic activities, reduced exemptions and tax evasion, and tax amendments (e.g. raising the threshold for VAT). However, the decline in the importation of goods, especially motor vehicles, and in the number of tourist inflows has prevented further increases in tax revenue collection.6 The newly introduced infrastructure tax is expected to improve resources available for infrastructure development in Zanzibar.
agencies and the Arab Bank for Economic Development in Africa (BADEA) (Figure 4). Finland, Denmark, china, uSA and Japan are Zanzibar’s leading bilateral donors.
Figure 2 REGiOnAl cOMPARiSOn OF AnnuAl AVERAGE GROWTH RATES OF TAx REVEnuE (Fys 2011/12–2013/14)
18% 17%15% 15%
Zanzibar Tanzania Uganda Kenya Rwanda
21%
Source: Zanzibar CAG report (FY 2013/14), World Bank World Development Indicators (http://data.worldbank.org/country/tanzania)
VAT remains the largest source of revenue, accounting for more than one third of total tax collection (Figure 3). The fastest growing sources of revenue (increasing at more than 30 per cent per annum) include the stamp duty, hotel levies, excise duty, import tax, and restaurant levies, with the local excise duty at the forefront.
Non-tax revenue is growing annually at an average rate of 6 per cent. Most of the non-tax revenue is collected by the immigration Department, the Zanzibar commission for Tourism, the Ministries of land, labour, Finance and Health, the controller and Auditor General (cAG), and livestock and Fisheries Departments.
Increasing tax collection and foreign grants are vital in the wake of declining general budget support (gbS)7
resources. GBS inflows declined from TShs 51.4 billion (Fy 2009/10) to TShs 36.5 billion (Fy 2013/14). Apart from GBS resources whose share for Zanzibar comes from donors’ GBS disbursements to the union’s government, several donors support Zanzibar’s development initiatives through direct financing of projects (project-based aid modality).
Over the past five years, the largest multilaterals providing on-budget support to Zanzibar’s development projects include the World Bank (leading with 41 per cent of total support), the African Development Bank (AfDB), un
Figure 3 cOMPOSiTiOn OF TAx REVEnuE (Fy 2013/14)
Income tax17%
Levies15%
Others12%
Import duty12%
Excise duty10%
VAT35%
Source: CAG report (FY 2013/14)
Figure 4 lEADinG MulTilATERiAlS SuPPORTinG THE GOVERnMEnT DEVElOPMEnT BuDGET (Fy 2013/14)
Source: CAG report (FY 2013/14)
ICAP/CDC/CHAI/GF/GPE5%
BADEA5%
WB41%
AfDB 38%
UN Agencies12%
WSPA0.2%
4 | Zanzibar Budget Brief
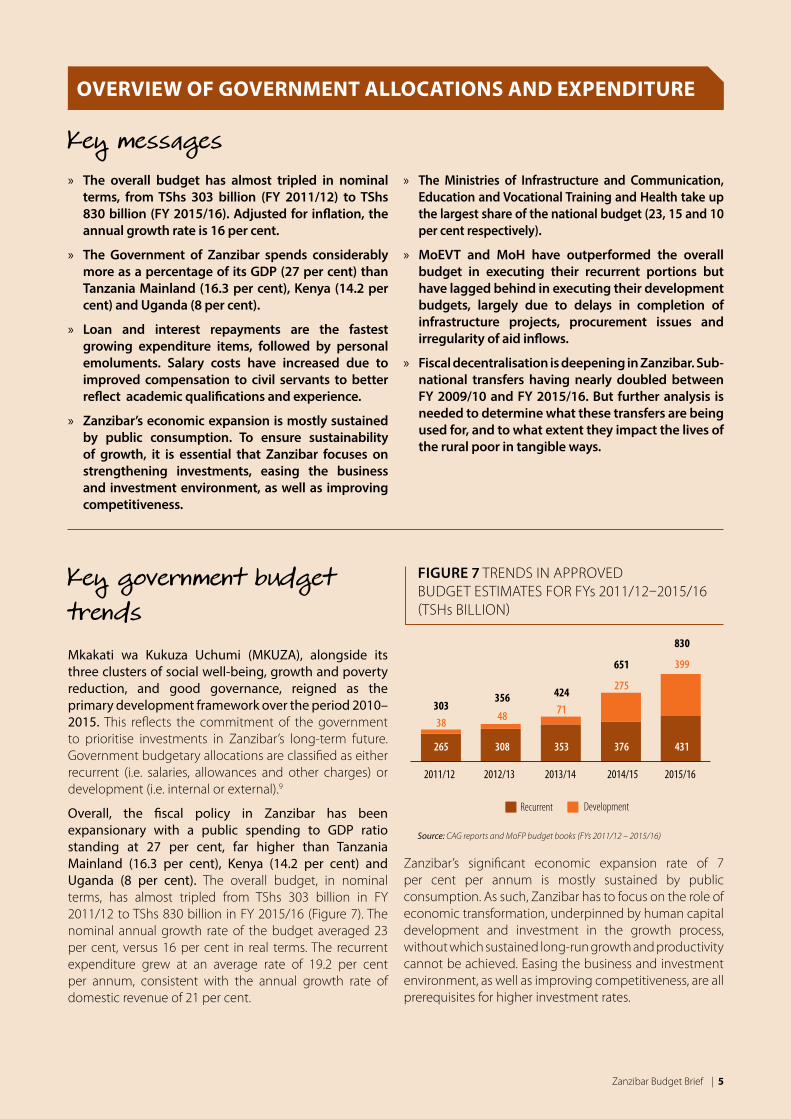
The government’s overall income has been growing at an average annual rate of 21 per cent since FY 2010/11. Domestic borrowing and foreign contributions grew at the fastest pace, with average annual growth rates of 87 per cent and 53 per cent respectively (Figure 5). Treasury bonds account for the largest share of domestic debt. The annual average growth of domestic borrowing is largely the result of a significant increase in Fy 2012/13, when TShs 39 billion was borrowed, as compared to TShs 10 billion in the previous financial year. Foreign contributions support around 35 per cent of the total budget with the remaining proportion coming from domestic resources (Figure 6).
The total national debt (foreign and domestic) is growing at an annual rate of 27 per cent with external debt growing at 41 per cent and domestic debt at 21 per cent. By 2014, the total national debt was TShs 300 billion, a sharp increase from TShs 118 billion in 2010. Around 88 per cent of the debt is guaranteed by the Government of the united Republic of Tanzania.
The increase in national debt is due in part to increased new loans, benefits for retirees and the need to finance expanding government budget. The government budget almost tripled between Fy 2011/12 and Fy 2015/16 (see Figure 7). External debt increased by an average rate of 41 per cent between 2010 and 2014 compared to the average annual growth rate of 21 per cent for domestic debt. yet, the debt sustainability criteria, i.e. the debt-GDP ratio, is only 17.3 per cent, leaving significant borrowing space.8 To strengthen its debt management system, the government in Zanzibar intends to introduce a framework that will rationalise loan contracting.
The increased borrowing caters for a number of needs, including increased investment in social sectors, such as the provision of free primary education and infrastructure development (e.g. upgrading of the Abeid Amani Karume Airport, clean and safe water, and road projects).
Figure 5 AVERAGE AnnuAl GROWTH RATE OF SOuRcES OF GOVERnMEnT incOME (Fys 2010/11–2013/14)
Source: CAG reports (FYs 2010/11–2013/14)
Domestic borrowing
53%Foreign contribution
87%
24%
20%
6%
Taxation (TRA)
Taxation (ZRB)
Non-transfer/Non tax
Figure 6 SOuRcES OF GOVERnMEnT incOME (Fy 2013/14)
Source: CAG report (FY 2013/14)
the government budget has
increased at an annual real
growth rate of 16 per cent and
absorbs 27 per cent of gdP.
© U
NIC
EF T
anza
nia/
Kate
Hol
t
Foreign contribution35%
Taxation (ZRB)28%
Taxation (TRA)24%
Domesticborrowing10%
Non-transfer/Non tax3%
Zanzibar Budget Brief | 5
» the overall budget has almost tripled in nominal terms, from tshs 303 billion (FY 2011/12) to tshs 830 billion (FY 2015/16). adjusted for inflation, the annual growth rate is 16 per cent.
» the government of Zanzibar spends considerably more as a percentage of its gdP (27 per cent) than tanzania Mainland (16.3 per cent), Kenya (14.2 per cent) and uganda (8 per cent).
» loan and interest repayments are the fastest growing expenditure items, followed by personal emoluments. salary costs have increased due to improved compensation to civil servants to better reflect academic qualifications and experience.
» Zanzibar’s economic expansion is mostly sustained by public consumption. to ensure sustainability of growth, it is essential that Zanzibar focuses on strengthening investments, easing the business and investment environment, as well as improving competitiveness.
» the Ministries of infrastructure and communication, education and Vocational training and health take up the largest share of the national budget (23, 15 and 10 per cent respectively).
» MoeVt and Moh have outperformed the overall budget in executing their recurrent portions but have lagged behind in executing their development budgets, largely due to delays in completion of infrastructure projects, procurement issues and irregularity of aid inflows.
» Fiscal decentralisation is deepening in Zanzibar. sub-national transfers having nearly doubled between FY 2009/10 and FY 2015/16. But further analysis is needed to determine what these transfers are being used for, and to what extent they impact the lives of the rural poor in tangible ways.
Key government budget trends Mkakati wa Kukuza Uchumi (MKUZA), alongside its three clusters of social well-being, growth and poverty reduction, and good governance, reigned as the primary development framework over the period 2010–2015. This reflects the commitment of the government to prioritise investments in Zanzibar’s long-term future. Government budgetary allocations are classified as either recurrent (i.e. salaries, allowances and other charges) or development (i.e. internal or external).9
Overall, the fiscal policy in Zanzibar has been expansionary with a public spending to gdP ratio standing at 27 per cent, far higher than Tanzania Mainland (16.3 per cent), Kenya (14.2 per cent) and Uganda (8 per cent). The overall budget, in nominal terms, has almost tripled from TShs 303 billion in Fy 2011/12 to TShs 830 billion in Fy 2015/16 (Figure 7). The nominal annual growth rate of the budget averaged 23 per cent, versus 16 per cent in real terms. The recurrent expenditure grew at an average rate of 19.2 per cent per annum, consistent with the annual growth rate of domestic revenue of 21 per cent.
Zanzibar’s significant economic expansion rate of 7 per cent per annum is mostly sustained by public consumption. As such, Zanzibar has to focus on the role of economic transformation, underpinned by human capital development and investment in the growth process, without which sustained long-run growth and productivity cannot be achieved. Easing the business and investment environment, as well as improving competitiveness, are all prerequisites for higher investment rates.
Figure 7 TREnDS in APPROVED BuDGET ESTiMATES FOR Fys 2011/12–2015/16(TSHs BilliOn)
Source: CAG reports and MoFP budget books (FYs 2011/12 – 2015/16)
265 308 353 376 431
38 48 71
275
399
303356 424
651
830
2011/12 2012/13 2013/14 2014/15 2015/16
Recurrent Development
Overview Of GOvernmenT allOCaTiOns anD expenDiTUre
Key messages
6 | Zanzibar Budget Brief
The Ministries of Infrastructure and Communication, Education and Vocational Training and Health enjoyed the largest budget shares in FY 2015/16 (Figure 8). The share of the Ministry of Empowerment, Social Welfare, youth, Women and children (now called Ministry of labour, Empowerment, Elders, youth, Women and children) was merely 1 per cent.
in the health sector, the salary bill increased from TShs 11.2 billion in Fy 2011/12 to TShs 13.7 billion in Fy 2014/15). By Fy 2014/15, 4,686 staff was working in the health sector, meeting 87.3 per cent of the minimum staff requirements set by the Essential Health care Package (EHcP)11. Despite these improvements, health facilities face severe staff shortages and low motivation as many staff are absent from work for various reasons.
The increasing personnel cost is leaving limited resources for development projects, although absorption issues exist. if aid flows slow down, in line with the achievement of middle income status, the government may be forced to streamline the large employment costs and seek greater efficiency, which involves doing more with less.
Budget execution This section compares approved estimates with actual spending for the three years where expenditure data are available (Fys 2011/12–2013/14). A ratio of the two categories gives the budget execution rate. Overall trends are indicated in Figure 9, which shows low levels of execution for the development budget, largely due to delays in completion of infrastructure projects, procurement issues and irregularity of aid inflows.
The Ministry of Health (MoH) and MoEVT outperformed most other ministries in executing their recurrent portion of the budget. On average, the two ministries
Fastest growing expenditure itemsIncreased public debt has led loan and interest payments to rise from TShs 8.6 billion during FY 2010/11 to TShs 23 billion in FY 2013/14. Expenditure on personal emoluments (salaries, wages and allowances) and transfers have increased significantly as well. For instance, expenditure on personal emolument has increased from TShs 84.5 billion (Fy 2010/11) to TShs 164.4 billion (Fy 2013/14).
due consideration of academic qualifications and experience and other salary enhancements are the main drivers of increases in salary costs. Personal emoluments are increasing at a higher pace (25 per cent per year) than the overall annual increase in recurrent expenditure (19 per cent).
in the Ministry of Education and Vocational Training (MoEVT), the salary bill has increased from TShs 36.7 billion in Fy 2011/12 to TShs 69.7 billion in Fy 2014/1510. Similarly
Figure 9 TREnDS in THE OVERAll BuDGET ExEcuTiOn RATE
Source: CAG reports (FYs 2011/12–2013/14)
2011/12 2012/13 2013/14
88%90%
93%94%
57% 60%
Recurrent Development
have executed, respectively, 97 per cent and 107 per cent of their recurrent budgets (Figure 10).
However, both ministries underperformed in executing their development budgets. MoH, for instance, spent only an average of 54 per cent of its development budget over Fys 2011/12–2013/14 (Figure 10). Weak budget execution hampers efforts to expand service coverage and quality, thereby negatively affecting child wellbeing.
Figure 8 BuDGETARy SHARES OF MiniSTRiES, DEPARTMEnTS AnD AGEnciES (Fy 2015/16)
Source: MoFP budget book (FY 2015/16)
Ministry of Infrastructure and Communication
23%
Other MDAs with less than 2% each
19%
Ministry of Education and Vocational Training
14%
Ministry of Health10%
Consolidated Fund Service
10%
Ministry of Finance and Planning
9%
Ministry of Agriculture and Natural Resources
6%
Ministry of Land, Housing, Water and Energy
4%
Ministry of Livestock and Fisheries
2% President's O�ce Planning Commission
2%
Ministry of Empowerment, Social Welfare, Youth,
Women & Children1%
Zanzibar Budget Brief | 7
About three quarters of the overall development budget is foreign financed (73 per cent in 2012/13—the most recently available financial year). Aid resources tend to be characterised by fluctuations and some degree of unpredictability12, which increase the risk of derailing performance against established expenditure targets. in this context, periodic reconciliation of aid data between sector ministries and the Ministry of Finance needs to be enhanced. Development partners also have a critical role to play by ensuring timely release of accurate aid estimates when BGs are prepared.
Over the three years where data are available, execution rates for both ministries declined. in Fy 2011/12, MoH and MoEVT executed 98 per cent and 90 per cent of their budgets, but the rates declined to 78 per cent and 68 per cent, respectively, by Fy 2013/14. This was largely the result of weak execution of the development budget.
Fiscal decentralisation and equityFiscal decentralisation is deepening in Zanzibar. It is closely linked to the population size, as evidenced by the positive correlation between regional variations in population size and the size of fiscal transfers.
Sub-national transfers have nearly doubled from the actual transfers of TShs 3.54 billion in Fy 2009/10 to TShs 5.69 billion in Fy 2013/14 (to approved estimates of TShs 7.66 billion in Fy 2015/16), with urban/West being the leading beneficiary (45 per cent of the entire Zanzibar population resides in this region, which is also the most affected by cholera). Further analysis is needed to understand what these transfers are used for and assess to what extent they impact the quality of life of the rural poor.
The establishment of the District Health Services Basket Fund in 2012 aims at enhancing equity in the distribution of resources and addressing the under-funding and
Figure 10 AVERAGE BuDGET ExEcuTiOn RATES (Fys 2011/12–2013/14)
Source: CAG reports (FY 2011/12 – FY 2013/14)
Overall budget execution rate
92%
Recurrent Development
69%
97%
60%
107%
54%
88%
66%
Ministry of Education and Vocational Training
Ministry of Health Ministry of Infrastructure and Communication
limited effectiveness of the health sector. Disbursements of resources from the District Health Services Basket Fund is based on agreed indicators which include population, the number of primary health care units, the poverty level and the disease burden.
A decentralisation policy and two bills have been approved in 2014 and 2015 and will further enhance resource allocations to lower levels. However, a roadmap for implementing the policy is yet to be released. At the local level, insufficient administrative and managerial skills needed to perform new responsibilities that come with decentralisation are common challenges for many developing countries engaging in decentralisation, and Zanzibar is no exception.
© U
NIC
EF T
anza
nia/
Kate
Hol
t
8 | Zanzibar Budget Brief
» the portion of the state budget that is allocated to the health sector in Zanzibar grew from 6.4 per cent in FY 2011/12 to 10.2 per cent in FY 2015/16.
» health spending has increased from 1.5 per cent of gdP in FY2011/12 to 3.1 per cent of gdP in FY2015/16.*
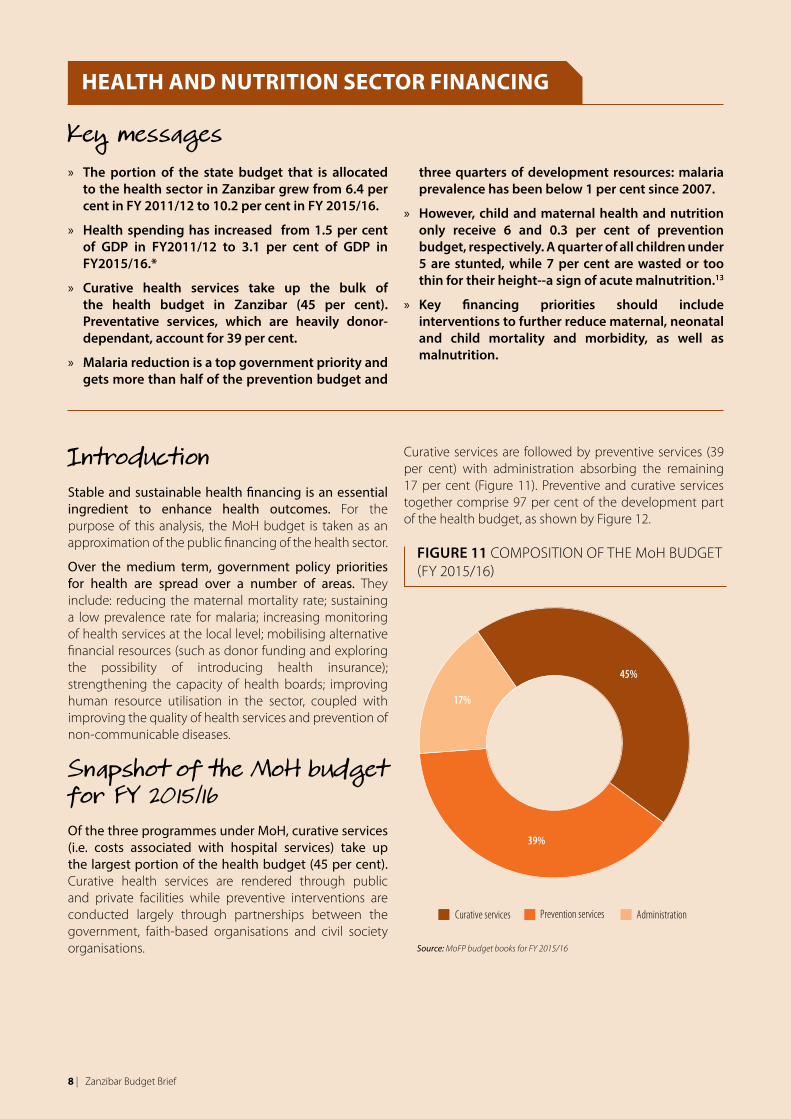
» curative health services take up the bulk of the health budget in Zanzibar (45 per cent). Preventative services, which are heavily donor-dependant, account for 39 per cent.
» Malaria reduction is a top government priority and gets more than half of the prevention budget and
three quarters of development resources: malaria prevalence has been below 1 per cent since 2007.
» however, child and maternal health and nutrition only receive 6 and 0.3 per cent of prevention budget, respectively. a quarter of all children under 5 are stunted, while 7 per cent are wasted or too thin for their height--a sign of acute malnutrition.13
» Key financing priorities should include interventions to further reduce maternal, neonatal and child mortality and morbidity, as well as malnutrition.
Introduction Stable and sustainable health financing is an essential ingredient to enhance health outcomes. For the purpose of this analysis, the MoH budget is taken as an approximation of the public financing of the health sector.
Over the medium term, government policy priorities for health are spread over a number of areas. They include: reducing the maternal mortality rate; sustaining a low prevalence rate for malaria; increasing monitoring of health services at the local level; mobilising alternative financial resources (such as donor funding and exploring the possibility of introducing health insurance); strengthening the capacity of health boards; improving human resource utilisation in the sector, coupled with improving the quality of health services and prevention of non-communicable diseases.
Snapshot of the MoH budget for FY 2015/16Of the three programmes under MoH, curative services (i.e. costs associated with hospital services) take up the largest portion of the health budget (45 per cent). curative health services are rendered through public and private facilities while preventive interventions are conducted largely through partnerships between the government, faith-based organisations and civil society organisations.
Figure 11 cOMPOSiTiOn OF THE MoH BuDGET (Fy 2015/16)
Source: MoFP budget books for FY 2015/16
Prevention services
45%
39%
17%
Curative services Administration
HealTH anD nUTriTiOn seCTOr finanCinG
Key messages
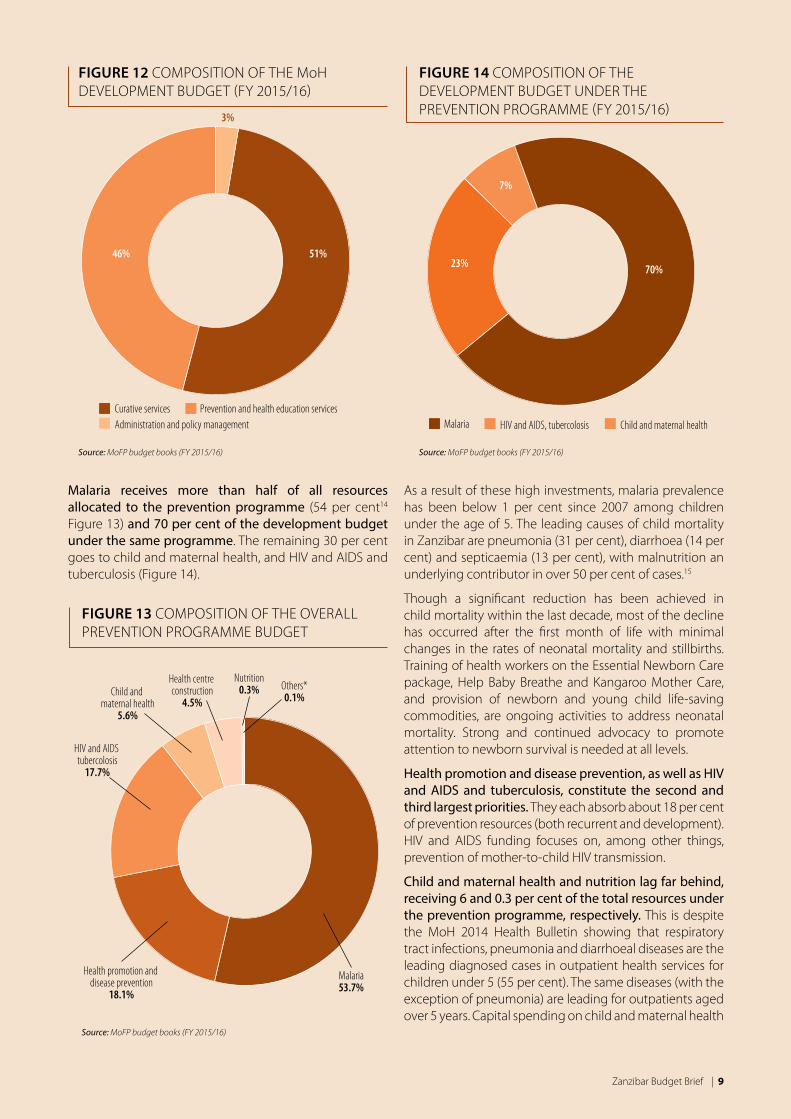
curative services are followed by preventive services (39 per cent) with administration absorbing the remaining 17 per cent (Figure 11). Preventive and curative services together comprise 97 per cent of the development part of the health budget, as shown by Figure 12.
Zanzibar Budget Brief | 9
Malaria receives more than half of all resources allocated to the prevention programme (54 per cent14
Figure 13) and 70 per cent of the development budget under the same programme. The remaining 30 per cent goes to child and maternal health, and HiV and AiDS and tuberculosis (Figure 14).
Figure 12 cOMPOSiTiOn OF THE MoH DEVElOPMEnT BuDGET (Fy 2015/16)
Source: MoFP budget books (FY 2015/16)
Figure 13 cOMPOSiTiOn OF THE OVERAll PREVEnTiOn PROGRAMME BuDGET
Source: MoFP budget books (FY 2015/16)
Figure 14 cOMPOSiTiOn OF THE DEVElOPMEnT BuDGET unDER THE PREVEnTiOn PROGRAMME (Fy 2015/16)
Source: MoFP budget books (FY 2015/16)
As a result of these high investments, malaria prevalence has been below 1 per cent since 2007 among children under the age of 5. The leading causes of child mortality in Zanzibar are pneumonia (31 per cent), diarrhoea (14 per cent) and septicaemia (13 per cent), with malnutrition an underlying contributor in over 50 per cent of cases.15
Though a significant reduction has been achieved in child mortality within the last decade, most of the decline has occurred after the first month of life with minimal changes in the rates of neonatal mortality and stillbirths. Training of health workers on the Essential newborn care package, Help Baby Breathe and Kangaroo Mother care, and provision of newborn and young child life-saving commodities, are ongoing activities to address neonatal mortality. Strong and continued advocacy to promote attention to newborn survival is needed at all levels.
Health promotion and disease prevention, as well as HIV and AIdS and tuberculosis, constitute the second and third largest priorities. They each absorb about 18 per cent of prevention resources (both recurrent and development). HiV and AiDS funding focuses on, among other things, prevention of mother-to-child HiV transmission.
Child and maternal health and nutrition lag far behind, receiving 6 and 0.3 per cent of the total resources under the prevention programme, respectively. This is despite the MoH 2014 Health Bulletin showing that respiratory tract infections, pneumonia and diarrhoeal diseases are the leading diagnosed cases in outpatient health services for children under 5 (55 per cent). The same diseases (with the exception of pneumonia) are leading for outpatients aged over 5 years. capital spending on child and maternal health
Prevention and health education servicesCurative servicesAdministration and policy management
46% 51%
3%
Malaria HIV and AIDS, tubercolosis
7%
70%23%
Child and maternal health
Health promotion and disease prevention
18.1%
HIV and AIDS tubercolosis17.7%
Malaria53.7%
Child and maternal health
5.6%
Health centre construction4.5%
Nutrition0.3% Others*
0.1%
10 | Zanzibar Budget Brief
accounts for 7 per cent of the prevention budget (Figure 14), with emphasis put on the Expanded Programme on immunisation (EPi). Vaccines consume a large share of the child and maternal health development programme (TShs 223 million out of TShs 1.8 billion).
nutrition is cross-sectoral, with spending being scattered across a number of other ministries (agriculture, education, livestock and fisheries and social welfare) as well as across various activities under MoH (e.g. integrated child reproductive health services). This means that the figure of 0.3 per cent of prevention resources allocated to nutrition is likely to be an underestimation of total resources allocated to nutrition. it will be important to refine the PBB approach to be able to capture nutrition spending in its entirety.
Persisting challenges remain in areas such as weak coordination of nutrition activities which span several MDAs, timely release of budgeted funds, the predominance of food security issues and inadequate human resources to deliver nutrition services (e.g. none of the districts have qualified nutritionists).
Additional challenges include a weak nutrition information system which contributes to a lack of quality data on nutrition; poor management of nutrition supplies, especially storage and distribution; and inadequate social and behaviour change communication activities. Effective coverage of treatment for severe acute malnutrition (SAM) is still low, reaching only 25 per cent of acutely malnourished children in 2015. Key bottlenecks include inconsistent provision of supplies; insufficiently trained health staff; and limited outreach activities to detect children with SAM.
Overall, despite a reduction in stunting prevalence from 30 per cent in 2010 to 24 per cent in 2014, and SAM from 4.5
per cent to 1.5 per cent over the same period, the absolute number of stunted children remains high, with more than 50,000 children stunted in Zanzibar. Furthermore, as many as 65 per cent of children are anaemic (2015).16
Preventive services are donor-dependent and this raises sustainability issues. leading financers of related development activities in Zanzibar include unicEF, the Global Fund to Fight AiDS, Tuberculosis and Malaria, the netherlands’ Facility for infrastructure Development (ORiO), the World Bank, unFPA, uSAiD and DAniDA. The uSA President’s Malaria initiative (PMi) and the Global Fund are major funders of malaria prevention.
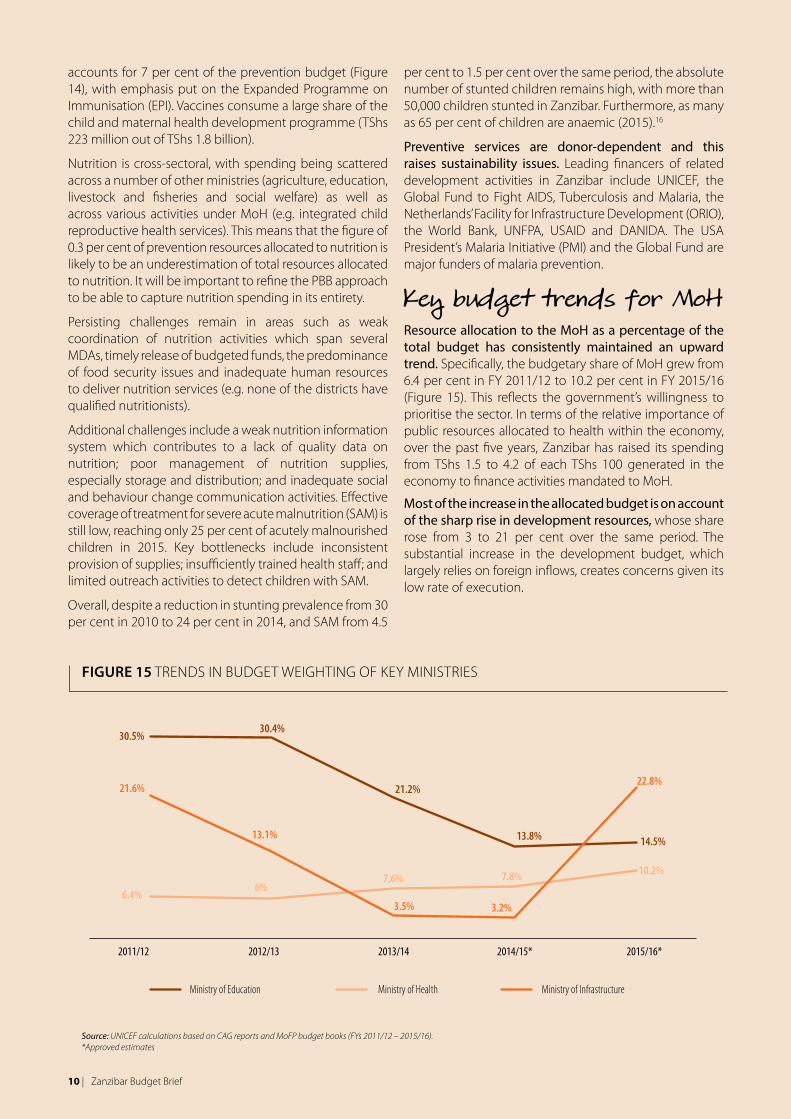
Key budget trends for MoH resource allocation to the MoH as a percentage of the total budget has consistently maintained an upward trend. Specifically, the budgetary share of MoH grew from 6.4 per cent in Fy 2011/12 to 10.2 per cent in Fy 2015/16 (Figure 15). This reflects the government’s willingness to prioritise the sector. in terms of the relative importance of public resources allocated to health within the economy, over the past five years, Zanzibar has raised its spending from TShs 1.5 to 4.2 of each TShs 100 generated in the economy to finance activities mandated to MoH.
Most of the increase in the allocated budget is on account of the sharp rise in development resources, whose share rose from 3 to 21 per cent over the same period. The substantial increase in the development budget, which largely relies on foreign inflows, creates concerns given its low rate of execution.
Figure 15 TREnDS in BuDGET WEiGHTinG OF KEy MiniSTRiES
Source: UNICEF calculations based on CAG reports and MoFP budget books (FYs 2011/12 – 2015/16). *Approved estimates
30.5%30.4%
21.2%
13.8% 14.5%
21.6%
13.1%
3.5% 3.2%
22.8%
6.4%6%
7.6% 7.8% 10.2%
2011/12 2012/13 2013/14 2014/15* 2015/16*
Ministry of Education Ministry of Health Ministry of Infrastructure
Zanzibar Budget Brief | 11
stable and sustainable
health financing is an essential
ingredient to enhance health
outcomes.
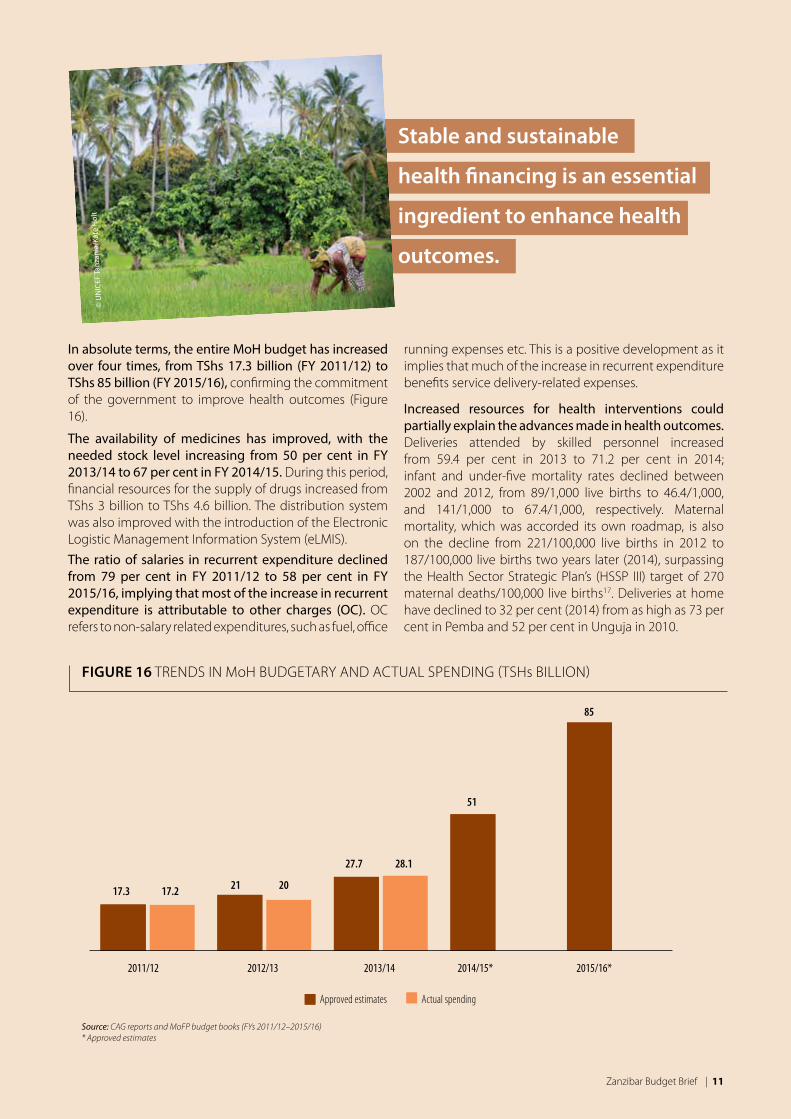
In absolute terms, the entire MoH budget has increased over four times, from TShs 17.3 billion (FY 2011/12) to TShs 85 billion (FY 2015/16), confirming the commitment of the government to improve health outcomes (Figure 16).
The availability of medicines has improved, with the needed stock level increasing from 50 per cent in FY 2013/14 to 67 per cent in FY 2014/15. During this period, financial resources for the supply of drugs increased from TShs 3 billion to TShs 4.6 billion. The distribution system was also improved with the introduction of the Electronic logistic Management information System (elMiS). The ratio of salaries in recurrent expenditure declined from 79 per cent in FY 2011/12 to 58 per cent in FY 2015/16, implying that most of the increase in recurrent expenditure is attributable to other charges (OC). Oc refers to non-salary related expenditures, such as fuel, office
running expenses etc. This is a positive development as it implies that much of the increase in recurrent expenditure benefits service delivery-related expenses.
Increased resources for health interventions could partially explain the advances made in health outcomes. Deliveries attended by skilled personnel increased from 59.4 per cent in 2013 to 71.2 per cent in 2014; infant and under-five mortality rates declined between 2002 and 2012, from 89/1,000 live births to 46.4/1,000, and 141/1,000 to 67.4/1,000, respectively. Maternal mortality, which was accorded its own roadmap, is also on the decline from 221/100,000 live births in 2012 to 187/100,000 live births two years later (2014), surpassing the Health Sector Strategic Plan’s (HSSP iii) target of 270 maternal deaths/100,000 live births17. Deliveries at home have declined to 32 per cent (2014) from as high as 73 per cent in Pemba and 52 per cent in unguja in 2010.
Figure 16 TREnDS in MoH BuDGETARy AnD AcTuAl SPEnDinG (TSHs BilliOn)
Source: CAG reports and MoFP budget books (FYs 2011/12–2015/16)* Approved estimates
Approved estimates Actual spending
17.3 17.2 21 20
27.7 28.1
51
85
2011/12 2012/13 2013/14 2014/15* 2015/16*
© U
NIC
EF T
anza
nia/
Kate
Hol
t
12 | Zanzibar Budget Brief
Over the same period, the proportion of births attended by skilled personnel reached 71 per cent from 45 per cent18. The proportion of pregnant women attending the first antenatal care (Anc) visit recommended within 16 weeks of pregnancy has also increased from 11 per cent to 18.9 per cent in unguja, and from 8.6 per cent to 26.5 per cent in Pemba over the period 2010–2014. Anc is one of the focus areas of the government roadmap to accelerate the reduction of maternal mortality rate.
Furthermore, household use of iodated salt has increased from 70 per cent in 2010 to 77 per cent in 2015. By 2015, 89 per cent of children were immunised against measles and 93 per cent against Penta 3.19
However, challenges remain across a number of areas as previously highlighted, including the high proportion of stunted children related, among other factors, to the decline in outreach initiatives on Vitamin A and de-worming. Between 2014 and 2015, the coverage of de-worming declined from 104.6 per cent to 76 per cent and for Vitamin A from 107.7 per cent to 76 per cent (i.e. below the target of reaching more than 90 per cent children20).
Increasing donor attention to vertical programmes in the health sector (focusing on a limited number of
health problems) raises concerns as to whether such initiatives give sufficient attention to the general health system. concerns also relate to the sustainability of vertical programmes after donor support comes to an end. Efficiency gains and sustainability will be enhanced if aid resources are prioritised for strengthening the existing general health system.
Overall, key financing priorities should include interventions to further reduce maternal, neonatal and child mortality and morbidity as well as reduce stunting. This can be realised through the following: health system strengthening, particularly at the district level; improving the quality of care (e.g. enhancing the skills of service providers and addressing the shortage of essential supplies); and linking families to facilities through health promotion at community level. community-level health promotion is important, for instance, to improve early postnatal care, as some community members perceive health services to be necessary only when obstetric complications occur.
» the education budget in Zanzibar increased from tshs 90 billion to tshs 120.7 billion between FY 2014/15 and FY 2015/16.
» But as a share of the national budget, education spending declined from 30.5 per cent in FY 2011/12 to 14.5 per cent in FY 2015/16.
» Pre-primary and primary education take up the largest share of the MoeVt budget (28 per cent). alternative education is the largest beneficiary of the MoeVt development budget (75 per cent). infrastructure development has remained a top priority.
» the education development budget is heavily reliant on external resources (80 per cent in FY 2015/16).
» increased investments are urgently needed to improve access to quality pre-primary education, reduce the number of children out of school, further develop school infrastructure and enhance quality, availability and equitable distribution of teachers.
Introduction The MoEVT budget is taken as an approximation of public financing of the education sector in Zanzibar. Similarly to health, education is among the priority sectors under MKuZA’s cluster ii (and Successor Strategy) and is therefore expected to be prioritised in resource allocation. The sector can have a direct impact on the future prospects of children and human capital development in Zanzibar, provided that adequate levels of quality are ensured.
currently the Government of Zanzibar provides free education for primary grades only (Standard i to Vi). in accordance with the 2006 Education Policy, the government is moving towards a system of compulsory education from pre-primary until Form iV. Except for the pre-primary level, the government is the dominant education provider.
Over the medium term, the government education policy priorities include a vast array of activities. They include the preparation of a new education development
eDUCaTiOn seCTOr finanCinG
Key messages
Zanzibar Budget Brief | 13
strategy (2015–2020), strengthening primary school infrastructure to make schools more child friendly and investing in alternative education and vocational training and the quality of teachers’ education (e.g. inspections, textbooks). The MoEVT budget comprises six programmes (pre-primary and primary education, secondary, higher education, alternative education and vocational training, quality aspects and administration). The 2006 Education Policy has changed the education structure, by declaring pre-primary education as part of compulsory basic education, as well as changing the structure of the formal education system to two years of pre-primary education, six years of primary education, four years of secondary education at ordinary level, two years of secondary education at advanced level and a minimum of three years of higher education.
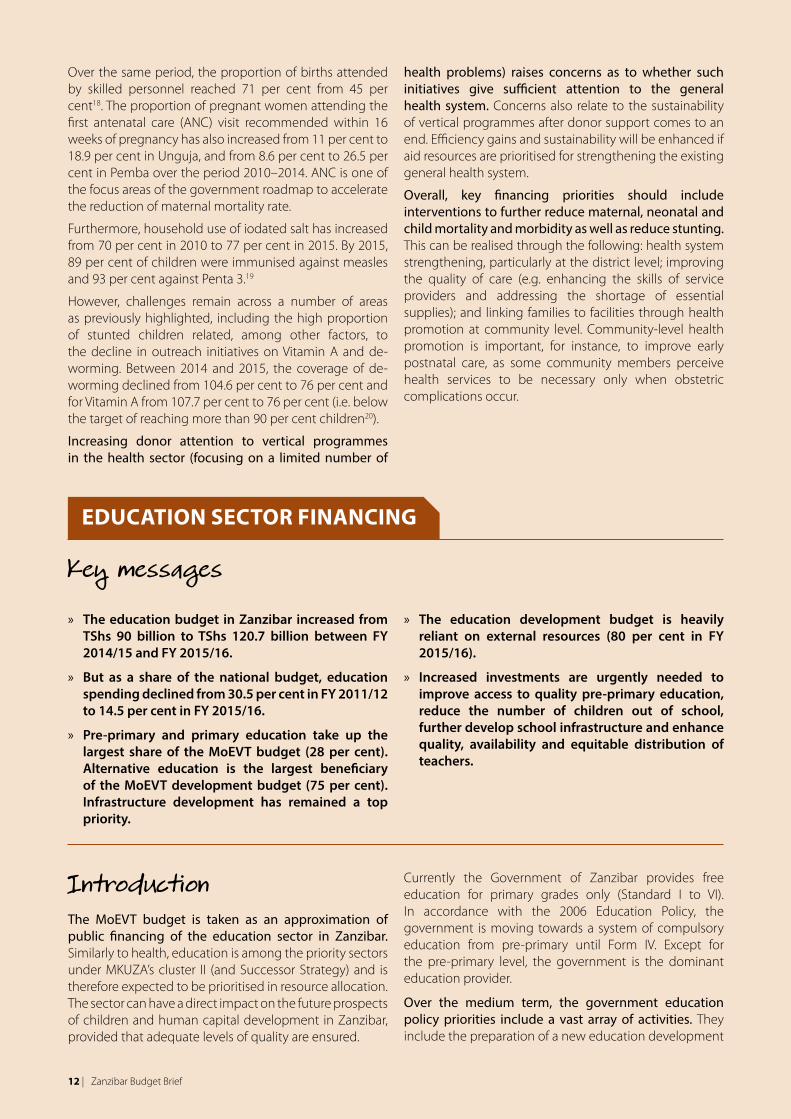
Snapshot of the MoEVT budget for FY 2015/16The combined pre-primary and primary education budget enjoys the largest share of MoEVT financial resources (28 per cent), as indicated by Figure 17. Of that allocation, 75 per cent is directed to the provision of pre-primary and primary education, and the remaining 25 per cent is used for strengthening delivery systems.
The relatively high allocation for pre-primary and primary education is in line with the 2006 Education Policy. At the primary education level, the government intends to ensure not only that all eligible primary school-aged children are enroled, but also that the primary school completion rate improves.
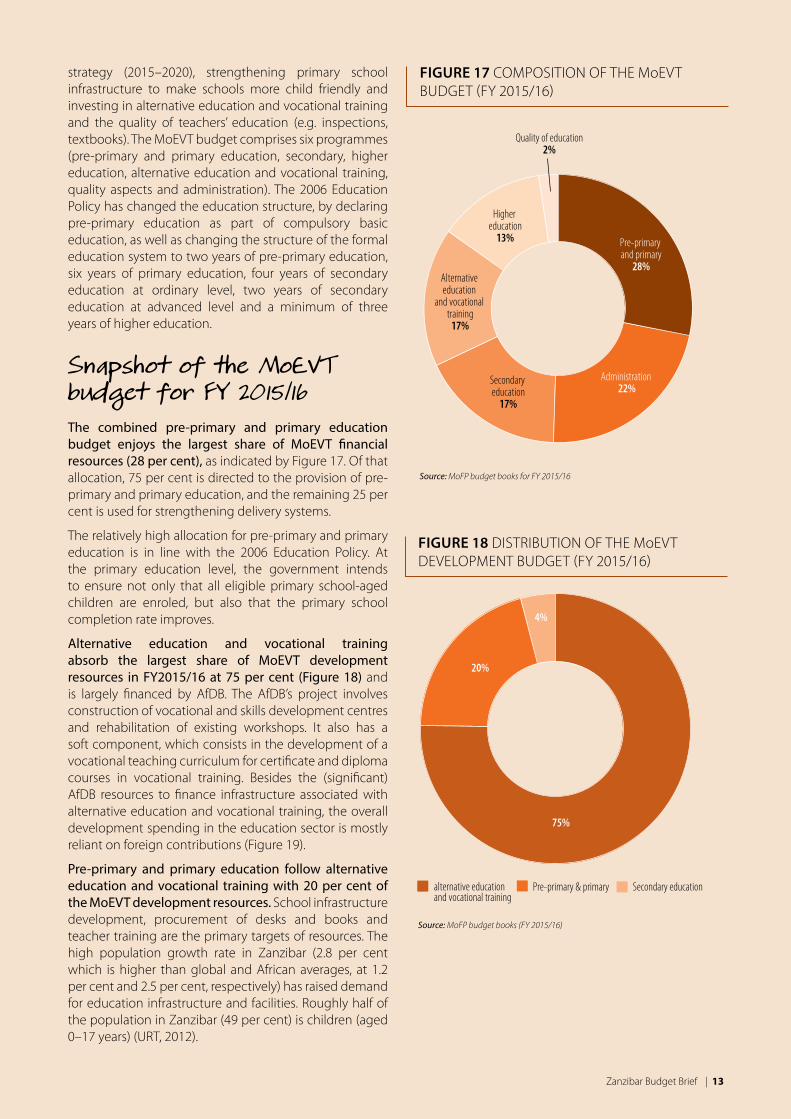
Alternative education and vocational training absorb the largest share of MoEVT development resources in FY2015/16 at 75 per cent (Figure 18) and is largely financed by AfDB. The AfDB’s project involves construction of vocational and skills development centres and rehabilitation of existing workshops. it also has a soft component, which consists in the development of a vocational teaching curriculum for certificate and diploma courses in vocational training. Besides the (significant) AfDB resources to finance infrastructure associated with alternative education and vocational training, the overall development spending in the education sector is mostly reliant on foreign contributions (Figure 19).
Pre-primary and primary education follow alternative education and vocational training with 20 per cent of the MoEVT development resources. School infrastructure development, procurement of desks and books and teacher training are the primary targets of resources. The high population growth rate in Zanzibar (2.8 per cent which is higher than global and African averages, at 1.2 per cent and 2.5 per cent, respectively) has raised demand for education infrastructure and facilities. Roughly half of the population in Zanzibar (49 per cent) is children (aged 0–17 years) (uRT, 2012).
Figure 17 cOMPOSiTiOn OF THE MoEVT BuDGET (Fy 2015/16)
Source: MoFP budget books for FY 2015/16
Figure 18 DiSTRiBuTiOn OF THE MoEVT DEVElOPMEnT BuDGET (Fy 2015/16)
Source: MoFP budget books (FY 2015/16)
75%
20%
Pre-primary & primary
4%
Secondary educationalternative education and vocational training
Pre-primary and primary28%
Administration 22%
Higher education13%
Secondary education17%
Quality of education2%
Alternative education
and vocational training17%
14 | Zanzibar Budget Brief
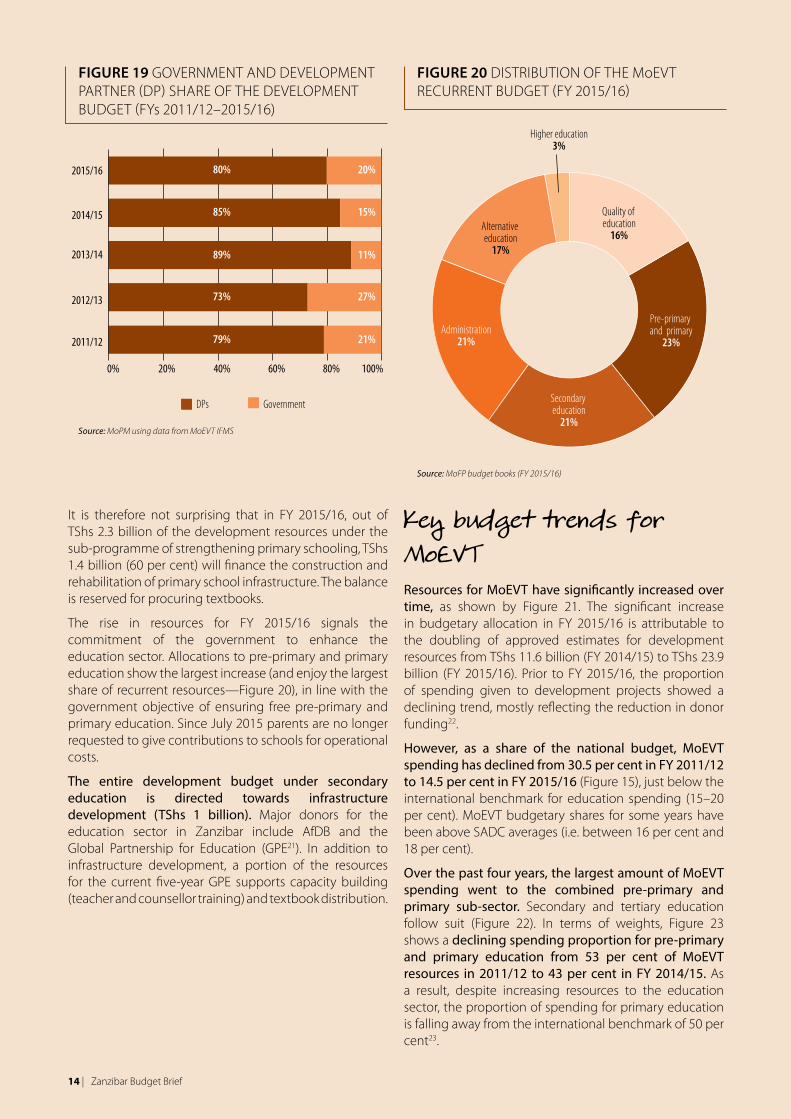
Figure 19 GOVERnMEnT AnD DEVElOPMEnT PARTnER (DP) SHARE OF THE DEVElOPMEnT BuDGET (Fys 2011/12–2015/16)
Source: MoPM using data from MoEVT IFMS
it is therefore not surprising that in Fy 2015/16, out of TShs 2.3 billion of the development resources under the sub-programme of strengthening primary schooling, TShs 1.4 billion (60 per cent) will finance the construction and rehabilitation of primary school infrastructure. The balance is reserved for procuring textbooks.
The rise in resources for Fy 2015/16 signals the commitment of the government to enhance the education sector. Allocations to pre-primary and primary education show the largest increase (and enjoy the largest share of recurrent resources—Figure 20), in line with the government objective of ensuring free pre-primary and primary education. Since July 2015 parents are no longer requested to give contributions to schools for operational costs.
The entire development budget under secondary education is directed towards infrastructure development (TShs 1 billion). Major donors for the education sector in Zanzibar include AfDB and the Global Partnership for Education (GPE21). in addition to infrastructure development, a portion of the resources for the current five-year GPE supports capacity building (teacher and counsellor training) and textbook distribution.
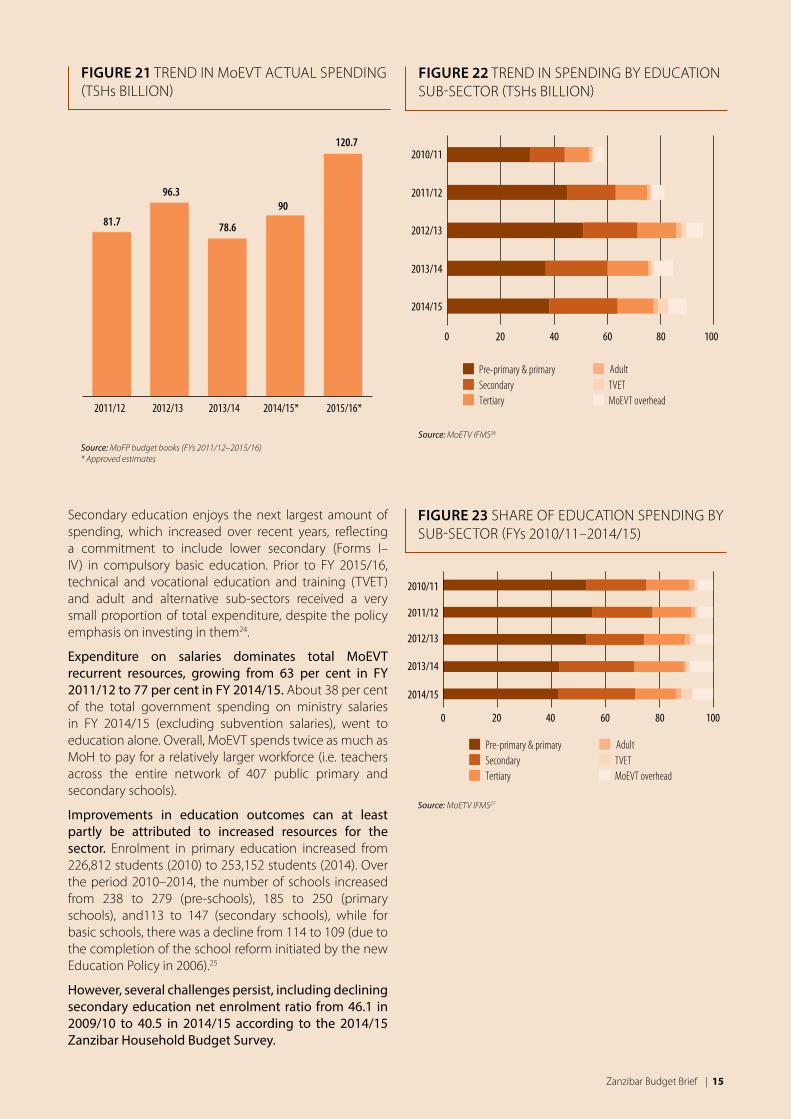
Key budget trends for MoEVTresources for MoEVT have significantly increased over time, as shown by Figure 21. The significant increase in budgetary allocation in Fy 2015/16 is attributable to the doubling of approved estimates for development resources from TShs 11.6 billion (Fy 2014/15) to TShs 23.9 billion (Fy 2015/16). Prior to Fy 2015/16, the proportion of spending given to development projects showed a declining trend, mostly reflecting the reduction in donor funding22.
However, as a share of the national budget, MoEVT spending has declined from 30.5 per cent in FY 2011/12 to 14.5 per cent in FY 2015/16 (Figure 15), just below the international benchmark for education spending (15–20 per cent). MoEVT budgetary shares for some years have been above SADc averages (i.e. between 16 per cent and 18 per cent).
Over the past four years, the largest amount of MoEVT spending went to the combined pre-primary and primary sub-sector. Secondary and tertiary education follow suit (Figure 22). in terms of weights, Figure 23 shows a declining spending proportion for pre-primary and primary education from 53 per cent of MoEVT resources in 2011/12 to 43 per cent in FY 2014/15. As a result, despite increasing resources to the education sector, the proportion of spending for primary education is falling away from the international benchmark of 50 per cent23.
Figure 20 DiSTRiBuTiOn OF THE MoEVT REcuRREnT BuDGET (Fy 2015/16)
Source: MoFP budget books (FY 2015/16)
80% 20%
85% 15%
89% 11%
73% 27%
79% 21%
0% 20% 40% 60% 80% 100%
2011/12
2012/13
2013/14
2014/15
2015/16
DPs Government
Pre-primary and primary
23%
Secondary education21%
Higher education3%
Administration21%
Quality of education16%
Alternative education17%
Zanzibar Budget Brief | 15
Secondary education enjoys the next largest amount of spending, which increased over recent years, reflecting a commitment to include lower secondary (Forms i–iV) in compulsory basic education. Prior to Fy 2015/16, technical and vocational education and training (TVET) and adult and alternative sub-sectors received a very small proportion of total expenditure, despite the policy emphasis on investing in them24.
Expenditure on salaries dominates total MoEVT recurrent resources, growing from 63 per cent in FY 2011/12 to 77 per cent in FY 2014/15. About 38 per cent of the total government spending on ministry salaries in Fy 2014/15 (excluding subvention salaries), went to education alone. Overall, MoEVT spends twice as much as MoH to pay for a relatively larger workforce (i.e. teachers across the entire network of 407 public primary and secondary schools).
Improvements in education outcomes can at least partly be attributed to increased resources for the sector. Enrolment in primary education increased from 226,812 students (2010) to 253,152 students (2014). Over the period 2010–2014, the number of schools increased from 238 to 279 (pre-schools), 185 to 250 (primary schools), and113 to 147 (secondary schools), while for basic schools, there was a decline from 114 to 109 (due to the completion of the school reform initiated by the new Education Policy in 2006).25
However, several challenges persist, including declining secondary education net enrolment ratio from 46.1 in 2009/10 to 40.5 in 2014/15 according to the 2014/15 Zanzibar Household budget Survey.
Figure 21 TREnD in MoEVT AcTuAl SPEnDinG (TSHs BilliOn)
Source: MoFP budget books (FYs 2011/12–2015/16)* Approved estimates
Figure 22 TREnD in SPEnDinG By EDucATiOn SuB-SEcTOR (TSHs BilliOn)
Source: MoETV IFMS26
2011/12 2012/13 2013/14 2014/15* 2015/16*
81.7
96.3
78.6
90
120.72010/11
2011/12
2012/13
2013/14
2014/15
0 20 40 60 80 100
Pre-primary & primarySecondary TVETTertiary MoEVT overhead
Adult
Figure 23 SHARE OF EDucATiOn SPEnDinG By SuB-SEcTOR (Fys 2010/11–2014/15)
Source: MoETV IFMS27
2010/11
2011/12
2012/13
2013/14
2014/15
0 20 40 60 80 100
Pre-primary & primarySecondary TVETTertiary MoEVT overhead
Adult
16 | Zanzibar Budget Brief
Other challenges include: inadequate equipment for laboratories and libraries, and the general unfriendly learning environment in schools such as overcrowded classes, poor school hygiene and sanitation services, and inadequate desks and other furniture.
As in the health sector, significant donor resources for education are spent “off-budget”. These resources must be included in the budget as there are several advantages: (1) it would allow for parliamentary supervision of development aid as recommended by the Paris, Accra, and Busan declarations; (2) it would increase transparency in funds utilisation; and (3) it would give the government a clearer vision of the volume of resources needed to maintain a certain level of social services.
lastly, the following priorities should guide the allocation of government spending to education: » Invest in improving access to quality pre-primary
education, including the development of cost-effective models for pre-primary expansion.
» reduce the number of children out of school through a comprehensive multi-sectoral programme.
» Further invest in infrastructure development, ensuring construction designs that take into account severe land shortages; and completing and equipping the large number of schools built by communities that remain unfinished.
» Invest in teachers (their availability, quality training, equitable distribution and motivation), especially for schools in remote areas, to improve learning outcomes and reduce the number of out-of-school children and adolescents.
» Improve school environments, especially access to water, sanitation and hygiene facilities and school meals and prevent corporal punishment.
» Invest in parenting education and raising awareness among caregivers of family practices that develop young children’s readiness for school and increase every child’s chance of success.
» Complementary programmes in family planning and other reproductive health services, as well as environmental awareness.
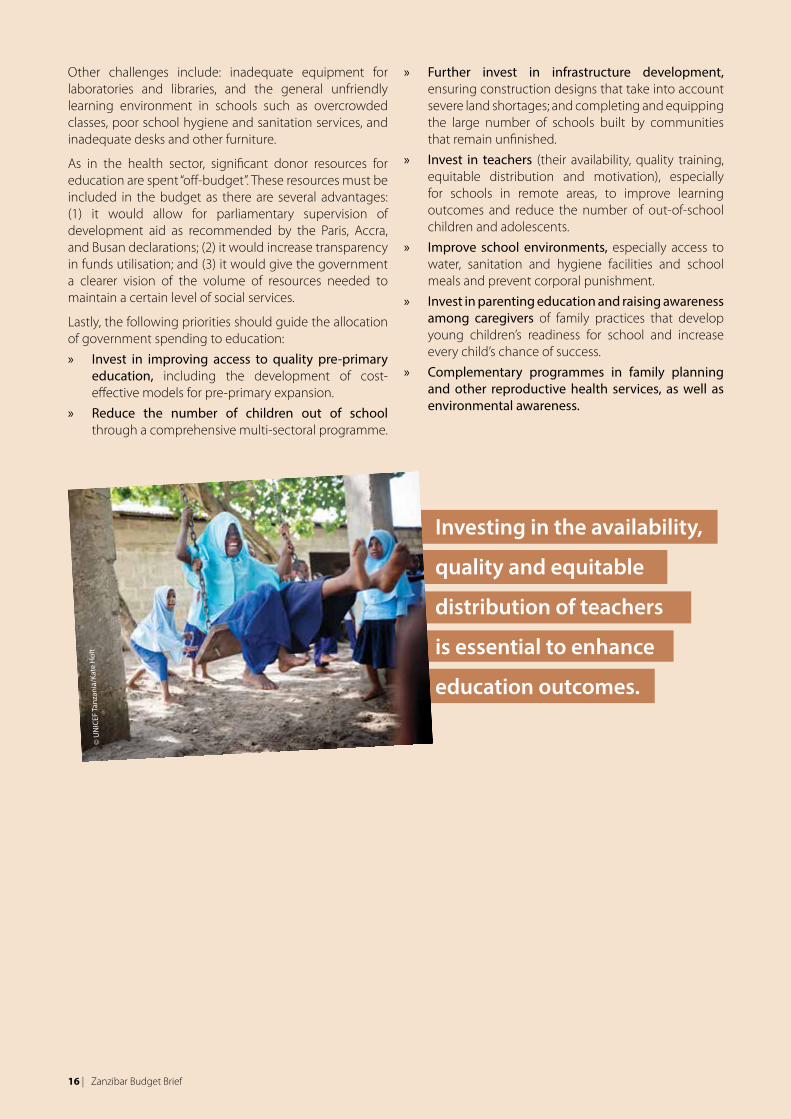
investing in the availability,
quality and equitable
distribution of teachers
is essential to enhance
education outcomes.
© U
NIC
EF T
anza
nia/
Kate
Hol
t
Zanzibar Budget Brief | 17
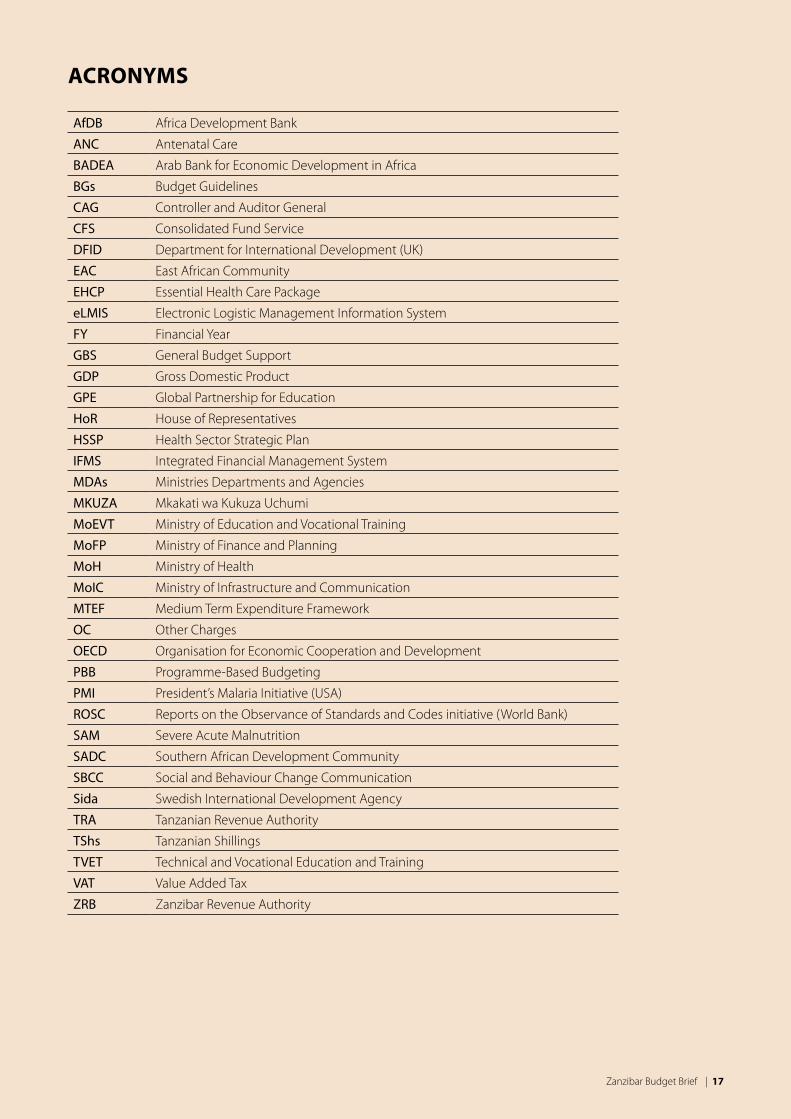
aCrOnyms
Afdb Africa Development Bank
ANC Antenatal care
bAdEA Arab Bank for Economic Development in Africa
bgs Budget Guidelines
CAg controller and Auditor General
CFS consolidated Fund Service
dFId Department for international Development (uK)
EAC East African community
EHCP Essential Health care Package
eLMIS Electronic logistic Management information System
FY Financial year
gbS General Budget Support
gdP Gross Domestic Product
gPE Global Partnership for Education
Hor House of Representatives
HSSP Health Sector Strategic Plan
IFMS integrated Financial Management System
MdAs Ministries Departments and Agencies
MKUZA Mkakati wa Kukuza uchumi
MoEVT Ministry of Education and Vocational Training
MoFP Ministry of Finance and Planning
MoH Ministry of Health
MoIC Ministry of infrastructure and communication
MTEF Medium Term Expenditure Framework
OC Other charges
OECd Organisation for Economic cooperation and Development
Pbb Programme-Based Budgeting
PMI President’s Malaria initiative (uSA)
rOSC Reports on the Observance of Standards and codes initiative (World Bank)
SAM Severe Acute Malnutrition
SAdC Southern African Development community
SbCC Social and Behaviour change communication
Sida Swedish international Development Agency
TrA Tanzanian Revenue Authority
TShs Tanzanian Shillings
TVET Technical and Vocational Education and Training
VAT Value Added Tax
Zrb Zanzibar Revenue Authority
18 | Zanzibar Budget Brief
GlOssary Of bUDGeT Terms
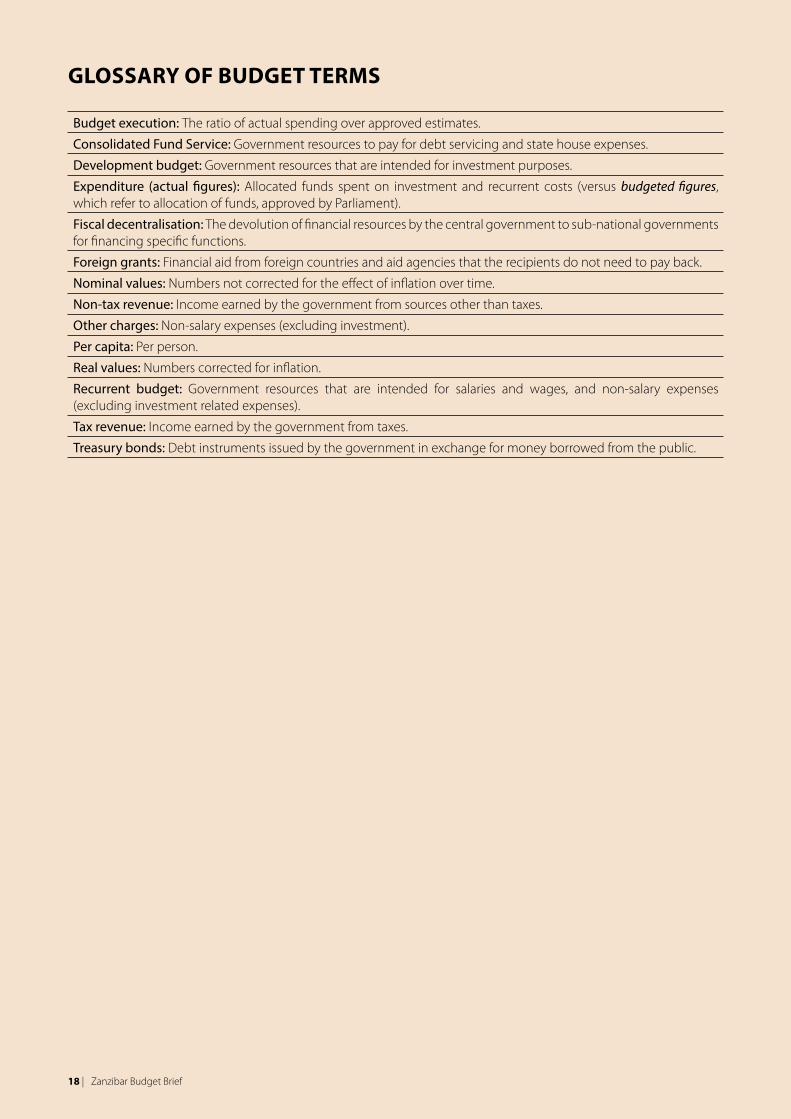
budget execution: The ratio of actual spending over approved estimates.
Consolidated Fund Service: Government resources to pay for debt servicing and state house expenses.
development budget: Government resources that are intended for investment purposes.
Expenditure (actual figures): Allocated funds spent on investment and recurrent costs (versus budgeted figures, which refer to allocation of funds, approved by Parliament).
Fiscal decentralisation: The devolution of financial resources by the central government to sub-national governments for financing specific functions.
Foreign grants: Financial aid from foreign countries and aid agencies that the recipients do not need to pay back.
Nominal values: numbers not corrected for the effect of inflation over time.
Non-tax revenue: income earned by the government from sources other than taxes.
Other charges: non-salary expenses (excluding investment).
Per capita: Per person.
real values: numbers corrected for inflation.
recurrent budget: Government resources that are intended for salaries and wages, and non-salary expenses (excluding investment related expenses).
Tax revenue: income earned by the government from taxes.
Treasury bonds: Debt instruments issued by the government in exchange for money borrowed from the public.
Zanzibar Budget Brief | 19
enDnOTes
1 The budget analysis within this budget brief covers a five-year period from Fy 2011/12 to Fy 2015/16. The latter two years (Fy 2014/15 and Fy 2015/16) are approved estimates, while the former three years (Fy 2011/12 to Fy 2013/14) reflect actual spending.2 un cOFOG refers to the united nations classification of the Functions of Government.3 Sources of government income are primarily tax and non-tax revenue, borrowing (domestic and foreign), foreign grants (including 4.5 per cent of the GBS, which is remitted from the united Republic of Tanzania) and dividends from the Bank of Tanzania.4 Revolutionary Government of Zanzibar (2013). consolidated Financial statements for the year ended 30 June 2013.5 Tax collection in Zanzibar is administered by the Tanzania Revenue Authority (TRA) and the Zanzibar Revenue Board (ZRB) with minimal differences in the actual value of the collected amount. TRA is an entity of the united Republic of Tanzania administering federal taxes (income tax and customs duties), while ZRB is mandated to oversee all internal taxes (VAT, stamp duty, hotel levies, petroleum tax and port fees).6 Government budget speech to HoR, Fy 2016/17.7 GBS is non-targeted budget aid on the condition that funds are used for poverty reduction in priority sectors.8 Government budget speech to HoR, Fy 2016/17.9 unlike internal resources that are strictly investment, not all external resources are investment. 10 Zanzibar Education Sector Analysis, Oxford Policy Management (OPM), 2015.11 All graduates from the Mbweni Science college find government employment each year (e.g. as environmental health officers and clinical officers). in Fy 2014/15, the pool of new recruits was further expanded with 36 medical graduates trained by Matansas university of cuba through a partnership with the Government of Zanzibar. 12 Further, due to incomplete information on foreign resources, the level of expenditure needs to be interpreted care-fully as a high probability exists of understating the actual flow of such resources (Source: Report of the controller and Auditor General).13 Tanzania Demographic and Health Survey and Malaria indicator Survey 2015-16 (TDHS-MiS 2015/16).14 Strategic government interventions to sustain a low prevalence rate of malaria include distribution of nets, indoor residual spraying, and mapping and treating of breeding sites.15 Zanzibar Annual Health Bulletin 2014, Ministry of Health.16 TDHS-MiS 2015/1617 MoH’s Health Bulletin, 2014.18 ibid.19 TDHS-MiS 2015/1620 Ministry of Health21 A consortium comprising the World Bank, DFiD, and Sida.22 Zanzibar Education Sector Analysis, Oxford Policy Management (OPM), 2015.23 Given that limited pre-primary services exist, we can assume that most of the resources finance primary education.24 Zanzibar Education Sector Analysis, Oxford Policy Management (OPM), 2015.25 Ministry of Education and Vocational Training, Education Statistical Abstract 201426 ibid.27 ibid.
• Estimates

unite for children