Embed Size (px)
Citation preview
Yutaka Kano, Osaka University, Japan
IMPS2015Beijing Normal U. ChinaJuly 13 – 16, 2015
1
Congratulations on the 80th anniversary of the Psychometric Society! Part I. Bias of the observed-likelihood (FIML) MLE
for NMAR missingness Effects of auxiliary variables in the analysis of missing data
Approximate population bias (APB) of the MLE in the analysis of nonignorable missing data Joint work with Yoshiharu Takagi
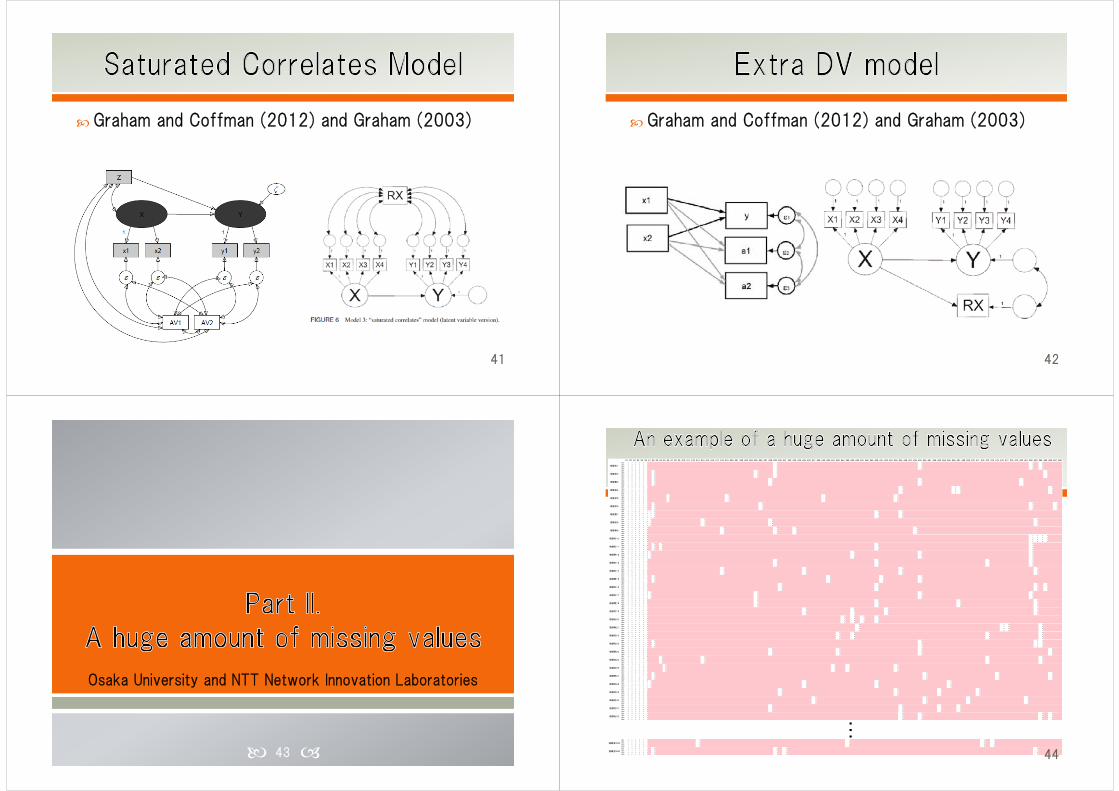
Part II. A huge amount of missing values Full information maximum likelihood estimation in factor
analysis with a large number of missing values To appear in Journal of Statistical Computation and Simulation,
2015
Kei Hirose, Yutaka Kano (Osaka U, Japan)
Sunyong Kim, Miyuki Imada, Manabu Yoshida and Masato Matsuo (NTT, Japan)
2
Publication Manual of the APA (2010, 6th edition) Similarly, missing data can have a detrimental effect on the
legitimacy of the inferences drawn by statistical tests. For this reason, it is critical that the frequency or percentages of missing data be reported along with any empirical evidence and/or theoretical arguments for the causes of data that are missing. For example, data might be described as MCAR; MAR; or NMAR. It is also important to describe the methods for addressing missing data, if any were used (e.g., multiple imputation).
Publication Manual of the Japanese Psychological Association (revised in 2015) データの欠測は分析の結果に大きな影響をしばしば与える。欠
測を伴うデータを分析する場合には,欠測の頻度や件数を示すとともに,欠測の発生について経験的あるいは理論的な説明を記述する。分析において採用した欠測モデルの性質(MCAR,MAR,NMAR の区分)や,欠測に対応するために採用した方法(多重埋め合わせなど)について記述することが望ましい。 3
Yutaka kano and Yoshiharu Takagi
4
5
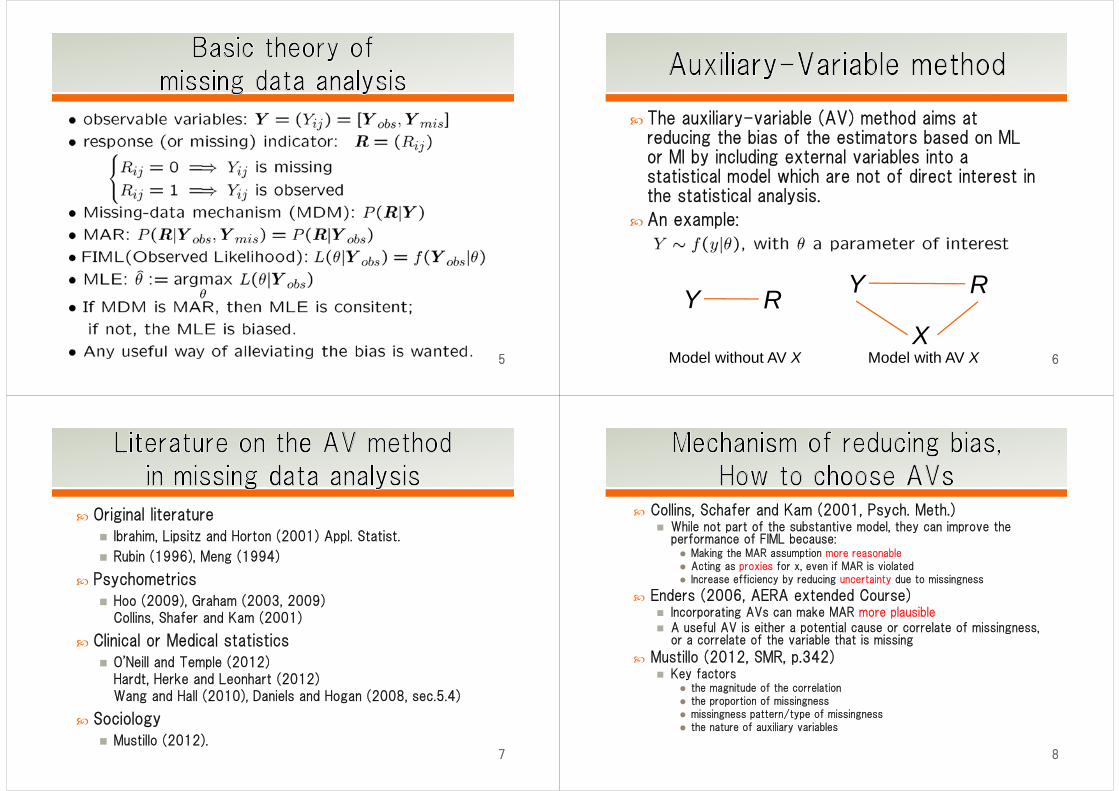
The auxiliary-variable (AV) method aims at reducing the bias of the estimators based on ML or MI by including external variables into a statistical model which are not of direct interest in the statistical analysis.
An example:
6
Y R Y R
XModel without AV X Model with AV X
Original literature Ibrahim, Lipsitz and Horton (2001) Appl. Statist.
Rubin (1996), Meng (1994)
Psychometrics Hoo (2009), Graham (2003, 2009)
Collins, Shafer and Kam (2001)
Clinical or Medical statistics O'Neill and Temple (2012)
Hardt, Herke and Leonhart (2012)Wang and Hall (2010), Daniels and Hogan (2008, sec.5.4)
Sociology Mustillo (2012).
7
Collins, Schafer and Kam (2001, Psych. Meth.) While not part of the substantive model, they can improve the
performance of FIML because: Making the MAR assumption more reasonable Acting as proxies for x, even if MAR is violated Increase efficiency by reducing uncertainty due to missingness
Enders (2006, AERA extended Course) Incorporating AVs can make MAR more plausible A useful AV is either a potential cause or correlate of missingness,
or a correlate of the variable that is missing
Mustillo (2012, SMR, p.342) Key factors
the magnitude of the correlation the proportion of missingness missingness pattern/type of missingness the nature of auxiliary variables
8
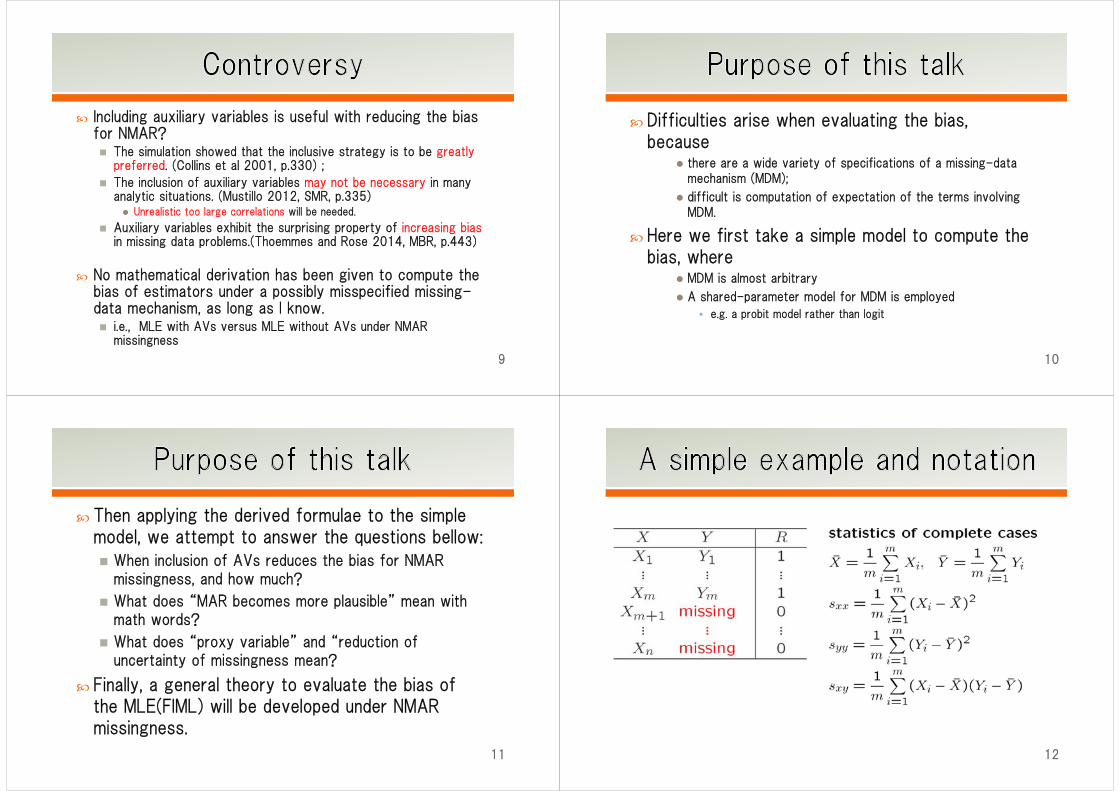
Including auxiliary variables is useful with reducing the bias for NMAR? The simulation showed that the inclusive strategy is to be greatly
preferred. (Collins et al 2001, p.330) ;
The inclusion of auxiliary variables may not be necessary in many analytic situations. (Mustillo 2012, SMR, p.335) Unrealistic too large correlations will be needed.
Auxiliary variables exhibit the surprising property of increasing bias in missing data problems.(Thoemmes and Rose 2014, MBR, p.443)
No mathematical derivation has been given to compute the bias of estimators under a possibly misspecified missing-data mechanism, as long as I know. i.e., MLE with AVs versus MLE without AVs under NMAR
missingness
9
Difficulties arise when evaluating the bias, because
there are a wide variety of specifications of a missing-data mechanism (MDM);
difficult is computation of expectation of the terms involving MDM.
Here we first take a simple model to compute the bias, where
MDM is almost arbitrary
A shared-parameter model for MDM is employed
• e.g. a probit model rather than logit
10
Then applying the derived formulae to the simple model, we attempt to answer the questions bellow:
When inclusion of AVs reduces the bias for NMAR missingness, and how much?
What does “MAR becomes more plausible” mean with math words?
What does “proxy variable” and “reduction of uncertainty of missingness mean?
Finally, a general theory to evaluate the bias of the MLE(FIML) will be developed under NMAR missingness.
11 12
13 14
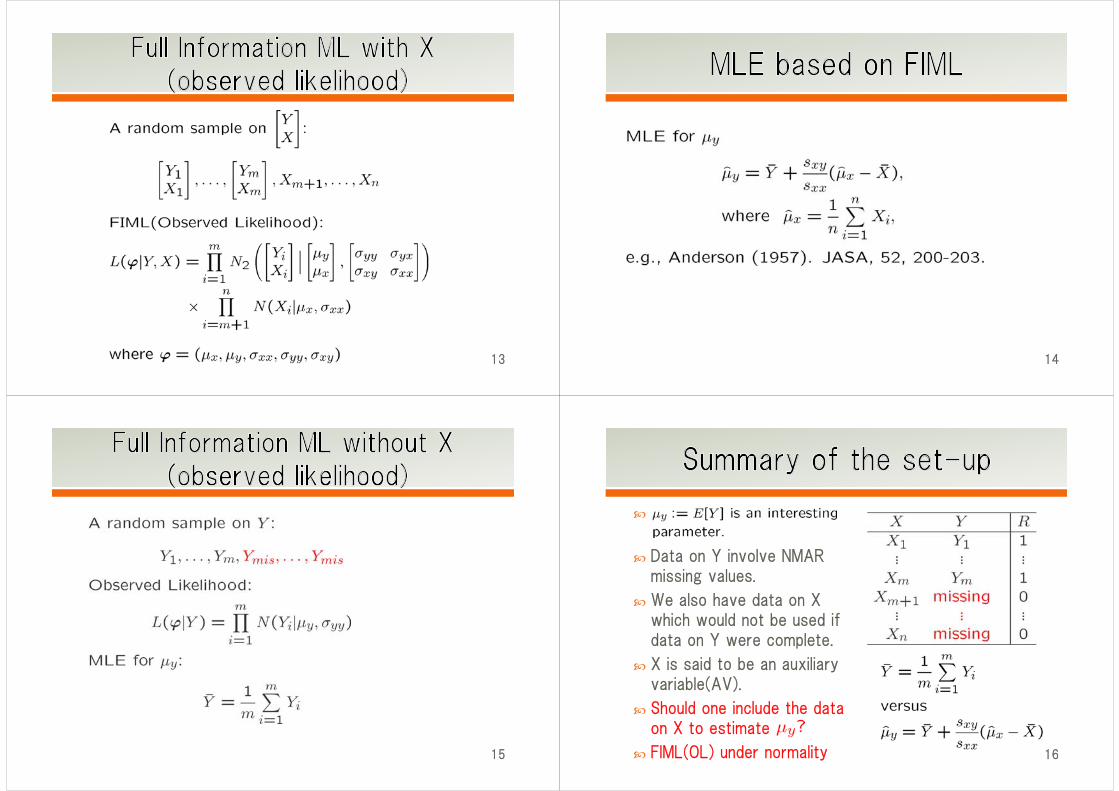
15
Data on Y involve NMAR missing values.
We also have data on X which would not be used if data on Y were complete.
X is said to be an auxiliary variable(AV).
Should one include the data on X to estimate
FIML(OL) under normality 16
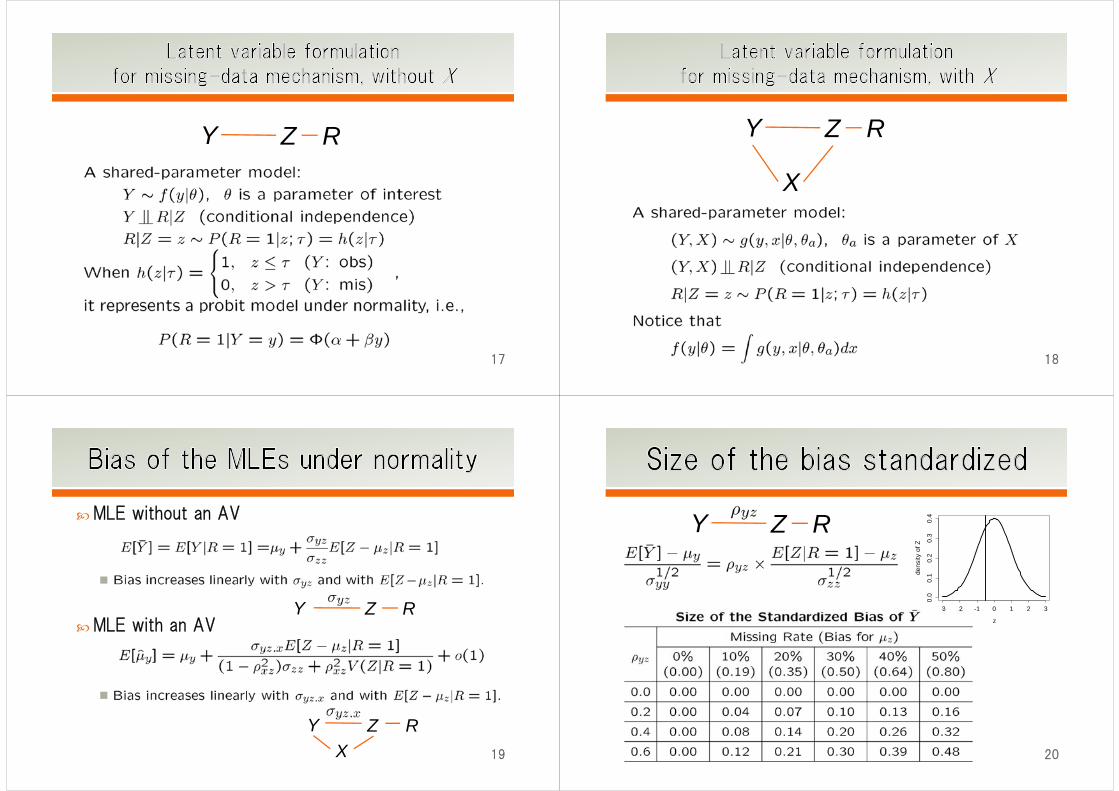
Y RZ
17
Y RZ
X
18
MLE without an AV
MLE with an AV
19
Y RZ X
Y R Z
20
Y RZ
-3 -2 -1 0 1 2 3
0.0
0.1
0.2
0.3
0.4
z
dens
ity o
f Z
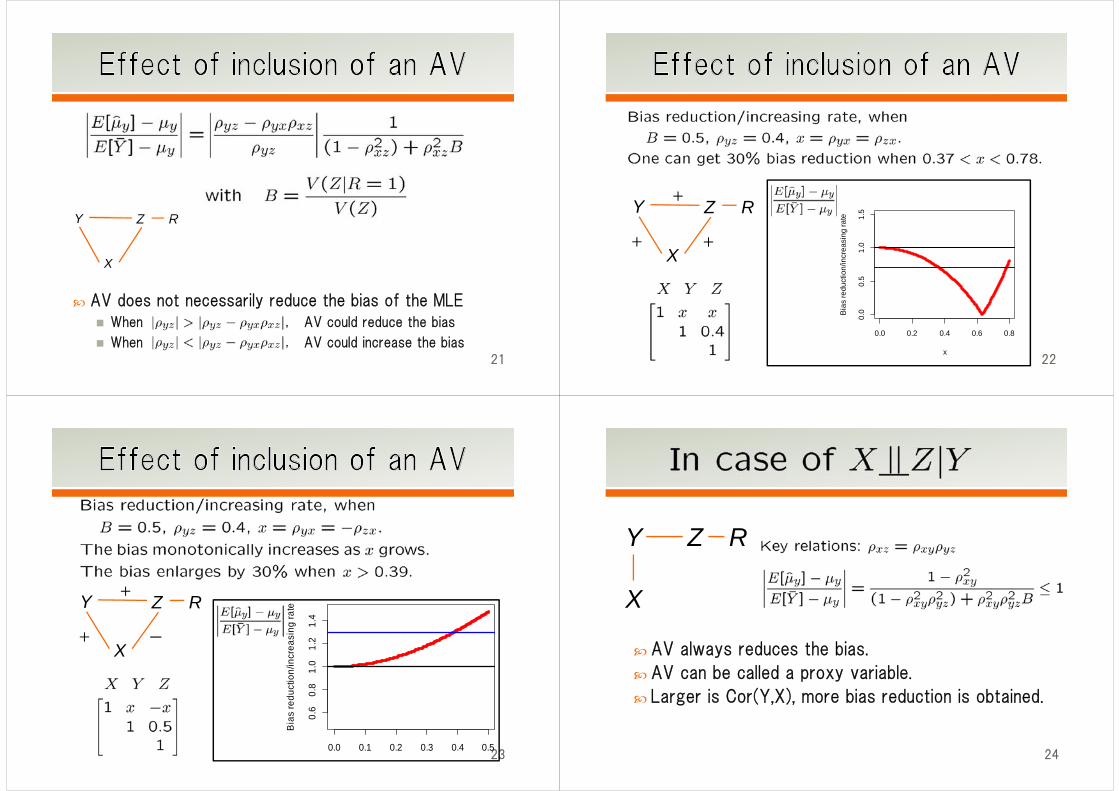
AV does not necessarily reduce the bias of the MLE When AV could reduce the bias
When AV could increase the bias 21
Y R Z
X
22
Y R Z
X
+
+ +
0.0 0.2 0.4 0.6 0.8
0.0
0.5
1.0
1.5
x
Bia
s re
duct
ion/
incr
easi
ng ra
te
23
Y R Z
X
+
+ ー
0.0 0.1 0.2 0.3 0.4 0.5
0.6
0.8
1.0
1.2
1.4
Bia
s re
duct
ion/
incr
easi
ng ra
te
Y RZ
X
AV always reduces the bias.
AV can be called a proxy variable.
Larger is Cor(Y,X), more bias reduction is obtained.
24
25
Y R Z
X
0.0 0.2 0.4 0.6 0.8 1.0
0.0
0.2
0.4
0.6
0.8
1.0
Bia
s re
duct
ion/
incr
easi
ng ra
te
Y RZ
X
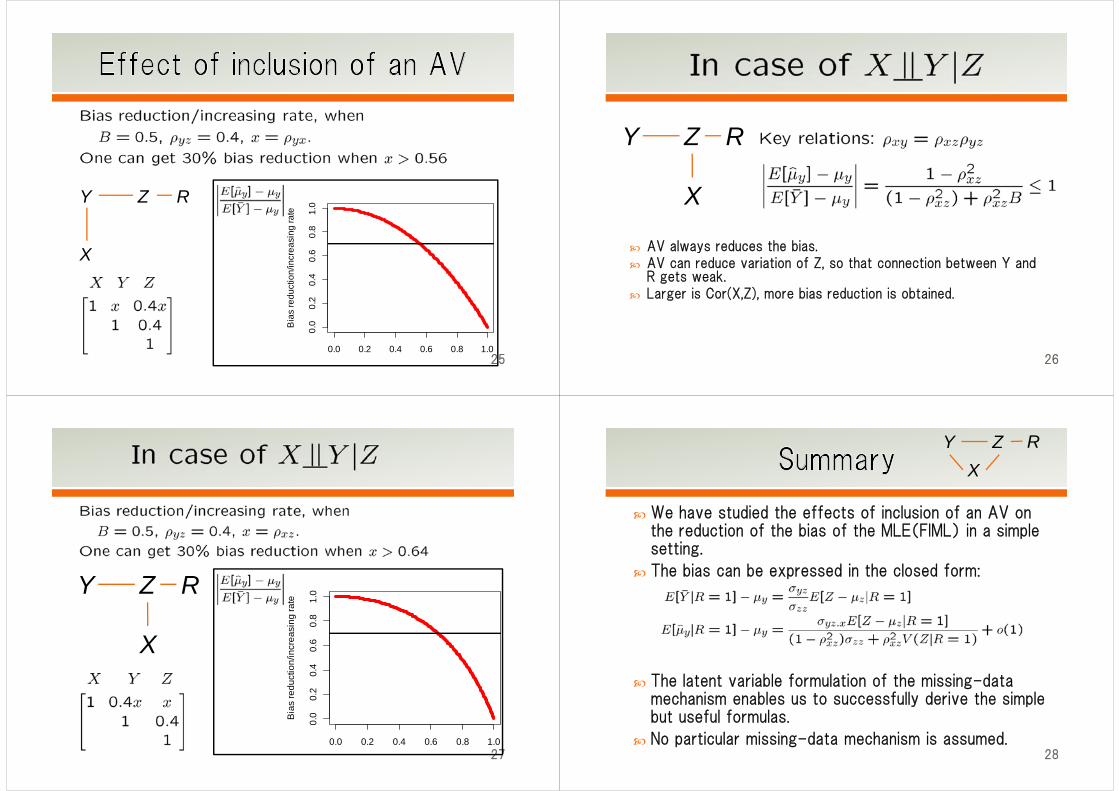
AV always reduces the bias. AV can reduce variation of Z, so that connection between Y and
R gets weak. Larger is Cor(X,Z), more bias reduction is obtained.
26
Y RZ
X
270.0 0.2 0.4 0.6 0.8 1.0
0.0
0.2
0.4
0.6
0.8
1.0
Bia
s re
duct
ion/
incr
easi
ng ra
te
We have studied the effects of inclusion of an AV on the reduction of the bias of the MLE(FIML) in a simple setting.
The bias can be expressed in the closed form:
The latent variable formulation of the missing-data mechanism enables us to successfully derive the simple but useful formulas.
No particular missing-data mechanism is assumed.28
Y R Z X
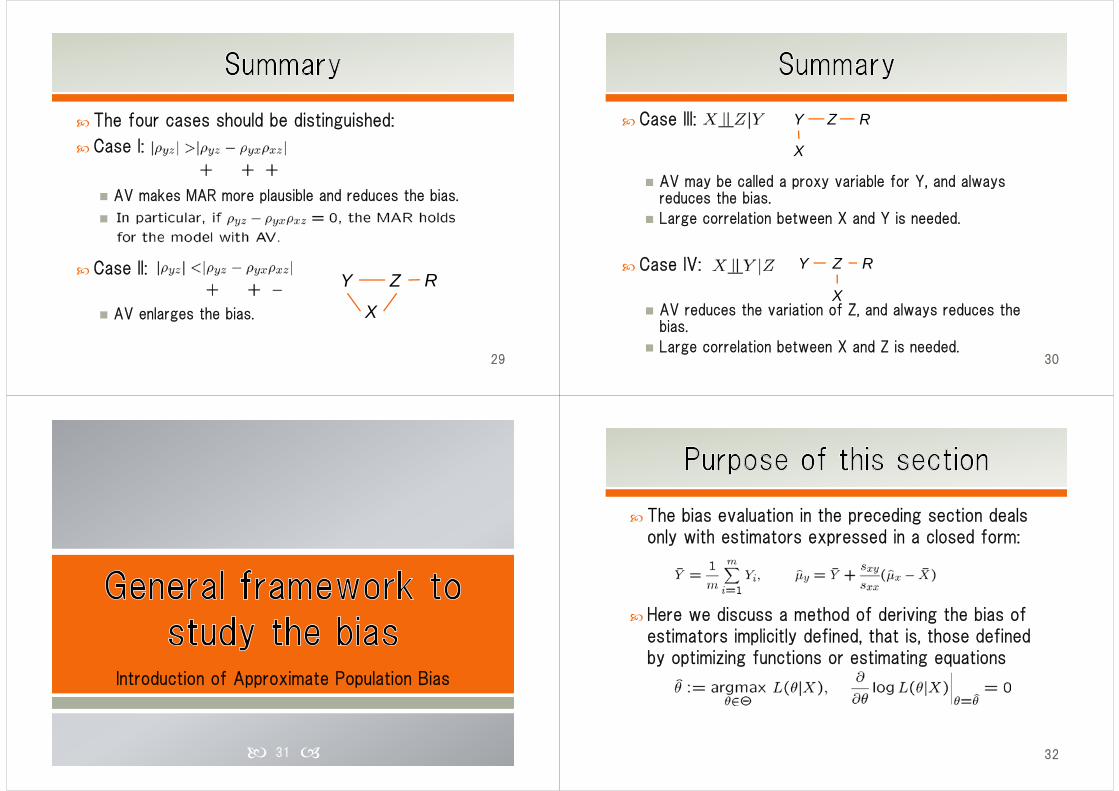
The four cases should be distinguished:
Case I:
AV makes MAR more plausible and reduces the bias.
Case II:
AV enlarges the bias.
29
Y R Z
X
Case III:
AV may be called a proxy variable for Y, and always reduces the bias.
Large correlation between X and Y is needed.
Case IV:
AV reduces the variation of Z, and always reduces the bias.
Large correlation between X and Z is needed.30
Y R Z
X
Y R Z
X
Introduction of Approximate Population Bias
31
The bias evaluation in the preceding section deals only with estimators expressed in a closed form:
Here we discuss a method of deriving the bias of estimators implicitly defined, that is, those defined by optimizing functions or estimating equations
32
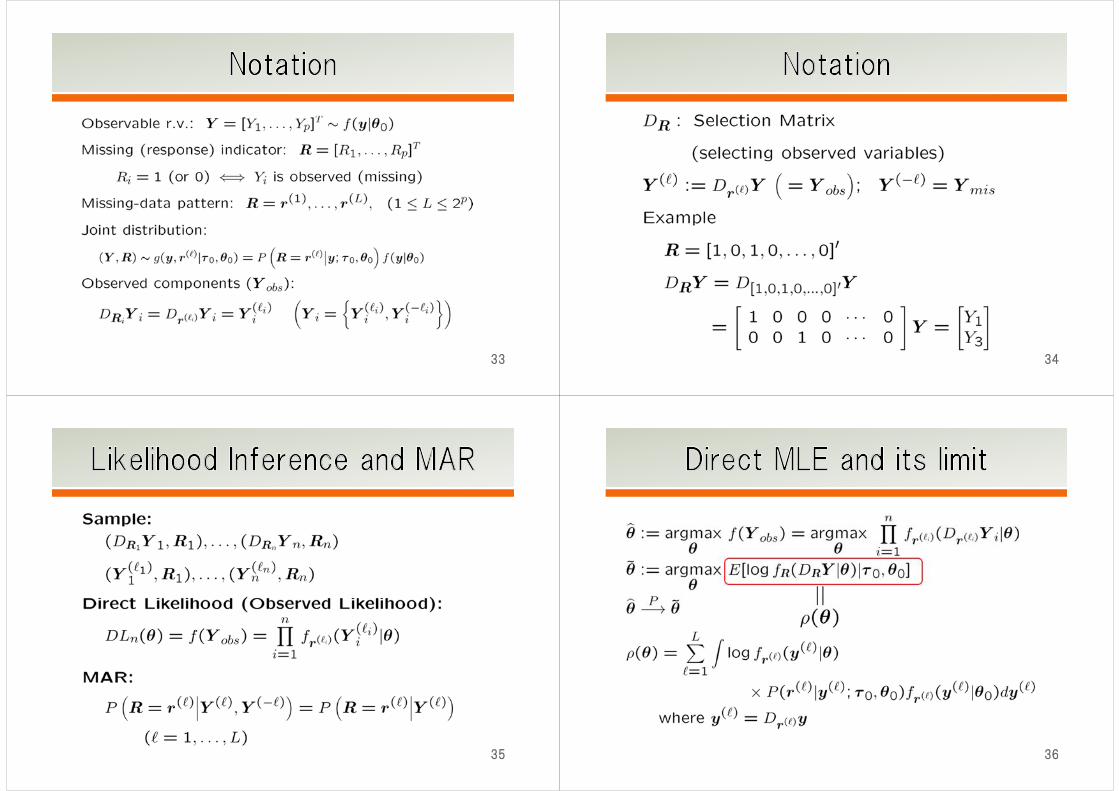
33 34
35 36
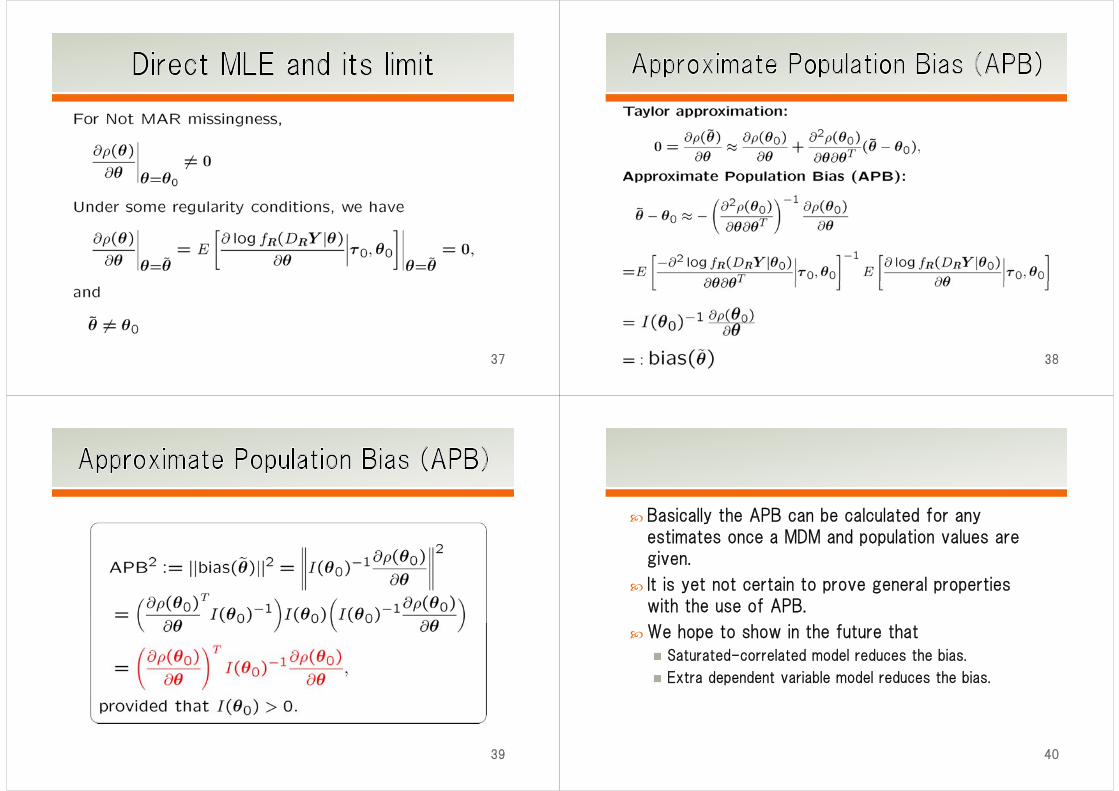
37 38
39
Basically the APB can be calculated for any estimates once a MDM and population values are given.
It is yet not certain to prove general properties with the use of APB.
We hope to show in the future that
Saturated-correlated model reduces the bias.
Extra dependent variable model reduces the bias.
40
Graham and Coffman (2012) and Graham (2003)
41
Graham and Coffman (2012) and Graham (2003)
42
Osaka University and NTT Network Innovation Laboratories
43
X1 X2 X3 X4 X5 X6 Z1 Z2 Z3 Z4 Z5 Z6 Z7 Z8 Z9 Z10 Z11 Z12 Z13 Z14 Z15 Z16 Z17 Z18 Z19 Z20 Z21 Z22 Z23 Z24 Z25 Z26 Z27 Z28 Z29 Z30 Z31 Z32 Z33 Z34 Z35 Z36 Z37 Z38 Z39 Z40 Z41 Z42 Z43 Z44 Z45 Z46 Z47 Z48 Z49 Z50 Z51 Z52 Z53 Z54 Z55 Z56 Z57 Z58 Z59 Z60 Z61 Z62 Z63 Z64 Z65 Z66 Z67 Z68 Z69 Z70 Z71 Z72 Z73 Z74 Z75 Z76 Z77 Z78 Z79 Z80 Z81 Z82 Z83 Z84 Z85 Z86 Z87 Z88人物1 3 3 3 3 3 3 3 2 3 3
人物2 3 3 3 3 3 3 3 3 3 3
人物3 3 3 3 3 3 3 3 3 3 3
人物4 3 3 3 3 3 3 3 2 2 3
人物1 4 4 5 4 2 2 4 3 4 4
人物2 2 1 3 2 3 3 4 2 2 4
人物3 4 4 4 3 3 2 4 4 3 3
人物4 2 2 3 2 3 3 4 2 2 2
人物1 3 3 4 3 2 2 4 3 4 4
人物2 2 2 2 2 3 3 3 4 4 3
人物3 3 3 3 2 2 2 4 3 3 2
人物4 2 2 4 3 3 3 3 4 4 3
人物1 4 4 3 3 2 1 3 3 2 4
人物2 1 1 1 1 4 4 1 5 5 1
人物3 4 3 2 3 2 2 2 2 3 5
人物4 2 2 4 1 4 3 1 5 5 1
人物1 2 3 4 3 1 3 1 3 2 1
人物2 3 2 3 4 4 3 2 1 2 3
人物3 3 2 3 4 4 3 2 1 2 3
人物4 3 2 3 4 4 3 2 1 2 3
人物1 1 3 2 2 3 1 5 2 3 1
人物2 2 2 3 2 3 2 4 2 2 2
人物3 2 2 3 2 3 3 4 3 3 3
人物4 1 1 3 3 3 3 5 3 2 3
人物1 3 3 4 4 1 1 1 4 2 3
人物2 3 3 2 3 4 4 2 4 4 2
人物3 2 3 4 4 1 1 1 4 1 3
人物4 2 2 3 3 2 3 3 4 1 2
人物1 4 4 4 4 1 1 2 2 2 4
人物2 2 1 2 2 3 4 3 2 4 2
人物3 4 3 3 3 1 1 2 1 2 4
人物4 2 1 3 2 2 3 2 1 4 1
人物1 3 2 2 4 2 1 2 4 3 2
人物2 3 4 2 4 2 2 4 2 2 2
人物3 4 3 1 4 1 2 3 4 1 2
人物4 2 2 2 3 4 3 3 2 3 2
人物1 4 3 3 3 2 2 3 3 3 4
人物2 2 2 2 3 4 4 3 2 2 2
人物3 3 4 3 2 2 2 2 2 2 4
人物4 4 4 4 3 2 3 5 5 5 5
人物1 3 3 5 4 2 1 4 4 2 3
人物2 3 3 2 3 4 4 4 3 4 3
人物3 2 2 3 3 1 1 2 4 1 4
人物4 3 4 1 3 4 4 3 3 4 4
人物1 2 2 3 3 2 2 2 3 2 3
人物2 2 2 2 2 3 3 2 1 2 2
人物3 3 3 3 4 3 3 3 2 4 3
人物4 2 2 3 3 3 3 3 2 3 3
人物1 5 5 4 4 1 1 5 3 4 5
人物2 2 2 2 1 4 3 2 4 4 3
人物3 5 4 3 4 1 1 2 2 4 4
人物4 2 1 2 2 4 3 2 1 2 2
人物1 5 4 5 4 1 1 1 3 4 4
人物2 2 2 2 2 4 4 2 2 2 2
人物3 4 4 3 3 2 2 1 5 5 5
人物4 2 2 4 3 4 4 3 2 2 2
人物1 4 3 5 4 2 1 3 2 3 4
人物2 1 4 2 2 3 3 3 4 4 1
人物3 3 4 2 3 1 1 4 5 3 4
人物4 4 2 4 3 2 1 5 2 4 3
人物1 3 3 3 3 2 2 3 3 4 4
人物2 3 2 3 3 3 4 3 4 3 2
人物3 2 3 2 2 2 1 4 2 3 3
人物4 2 2 3 3 3 3 3 2 3 2
人物1 5 4 4 4 2 3 1 3 5 4
人物2 4 3 1 1 2 4 3 2 1 4
人物3 5 5 2 5 1 1 1 2 4 3
人物4 4 3 4 4 3 4 2 3 4 3
人物1 3 3 4 3 2 2 3 2 3 4
人物2 3 3 3 2 4 3 2 3 3 3
人物3 3 3 4 4 2 2 4 3 3 4
人物4 3 3 3 3 3 3 3 3 4 3
人物1 5 5 5 5 1 1 3 2 3 5
人物2 1 1 1 1 2 4 1 4 4 1
人物3 5 5 5 5 1 1 4 1 2 4
人物4 2 2 4 4 2 4 1 1 2 3
人物1 3 3 5 4 3 1 1 2 5 1
人物2 2 2 1 2 5 4 5 4 1 3
人物3 5 5 5 1 2 1 2 2 5 3
人物4 3 3 1 2 4 4 5 3 2 3
人物1 3 3 3 3 4 2 4 4 3 4
人物2 2 3 3 2 3 3 2 3 3 3
人物3 4 3 3 3 2 2 3 4 3 4
人物4 2 3 3 3 3 3 3 4 2 2
人物1 4 2 4 4 1 1 4 2 2 4
人物2 2 3 1 2 4 5 2 4 5 2
人物3 4 4 2 2 2 1 4 2 4 4
人物4 2 1 2 2 3 3 2 2 4 2
人物1 2 3 4 3 2 1 5 4 3 3
人物2 2 2 3 2 3 3 4 5 3 3
人物3 3 3 2 2 2 1 5 3 3 3
人物4 2 2 3 2 2 3 4 1 2 3
人物1 3 4 3 3 2 3 3 2 3 3
人物2 2 3 2 2 3 3 4 2 2 2
人物3 2 3 3 2 2 3 4 2 2 2
人物4 3 3 3 4 2 2 3 3 3 3
人物1 4 2 3 3 2 4 5 2 3 3
人物2 3 5 2 2 4 3 3 3 4 3
人物3 3 5 1 1 1 4 4 2 3 3
人物4 4 4 3 4 4 4 4 2 3 3
人物1 4 4 4 3 1 1 3 5 1 4
人物2 1 2 1 3 4 4 2 4 3 4
人物3 3 3 2 2 2 1 2 2 2 1
人物4 2 2 4 5 2 3 3 4 2 4
人物1 2 2 2 2 1 1 5 4 4 3
人物2 2 2 1 1 4 5 4 1 3 1
人物3 5 5 3 2 1 1 5 4 4 4
人物4 2 2 1 2 1 4 5 2 2 1
人物1 2 2 2 2 2 2 3 3 3 3
人物2 1 1 1 1 1 1 1 1 2 1
人物3 3 4 2 3 2 1 2 3 3 4
人物4 1 1 1 1 1 1 1 1 1 1
人物1 2 2 2 3 2 1 5 2 3 5
人物2 3 3 3 3 2 3 3 3 3 2
人物3 4 4 4 4 3 3 3 2 4 2
人物4 2 2 3 2 3 4 4 2 3 2
人物1 4 2 2 4 2 3 3 2 3 3
人物2 3 2 2 3 2 3 3 2 2 3
人物3 2 2 3 2 3 2 2 3 3 2
人物4 3 3 2 3 3 3 2 3 3 3
人物1 3 3 4 3 2 2 3 4 2 3
人物2 2 2 2 2 3 3 4 2 3 4
人物3 3 3 3 3 2 2 3 4 3 3
人物4 3 3 4 3 2 2 3 4 2 3
人物1 4 4 3 4 3 3 4 5 5 4
人物2 2 3 3 2 3 3 2 1 3 2
人物3 4 5 3 4 2 2 5 5 4 4
人物4 2 2 3 3 3 3 2 4 4 2
被験者31
被験者32
被験者25
被験者26
被験者27
被験者28
被験者29
被験者30
被験者19
被験者20
被験者21
被験者22
被験者23
被験者24
被験者13
被験者14
被験者15
被験者16
被験者17
被験者18
被験者7
被験者8
被験者9
被験者10
被験者11
被験者12
被験者1
被験者2
被験者3
被験者4
被験者5
被験者6
…
人物1 4 2 4 4 2 2 2 1 3 3
人物2 2 2 3 2 3 3 4 3 4 3
人物3 2 2 4 3 2 1 4 2 4 3
人物4 1 1 3 2 3 4 3 2 4 4
人物1 4 3 4 4 1 1 5 4 5 2
人物2 2 1 2 2 3 4 3 5 5 1
人物3 3 4 3 2 2 2 5 3 4 4
人物4 2 2 4 3 2 2 3 3 2 3
被験者8543
被験者8544
44
One should avoid responders to be forced to respond
too many questionnaire items
questionnaire Items that do not interest responders;
That will cause the troubles:
Nonresponses (missing values)
One particular choice in many items, such as the neutral response
Random choice in many items
…45
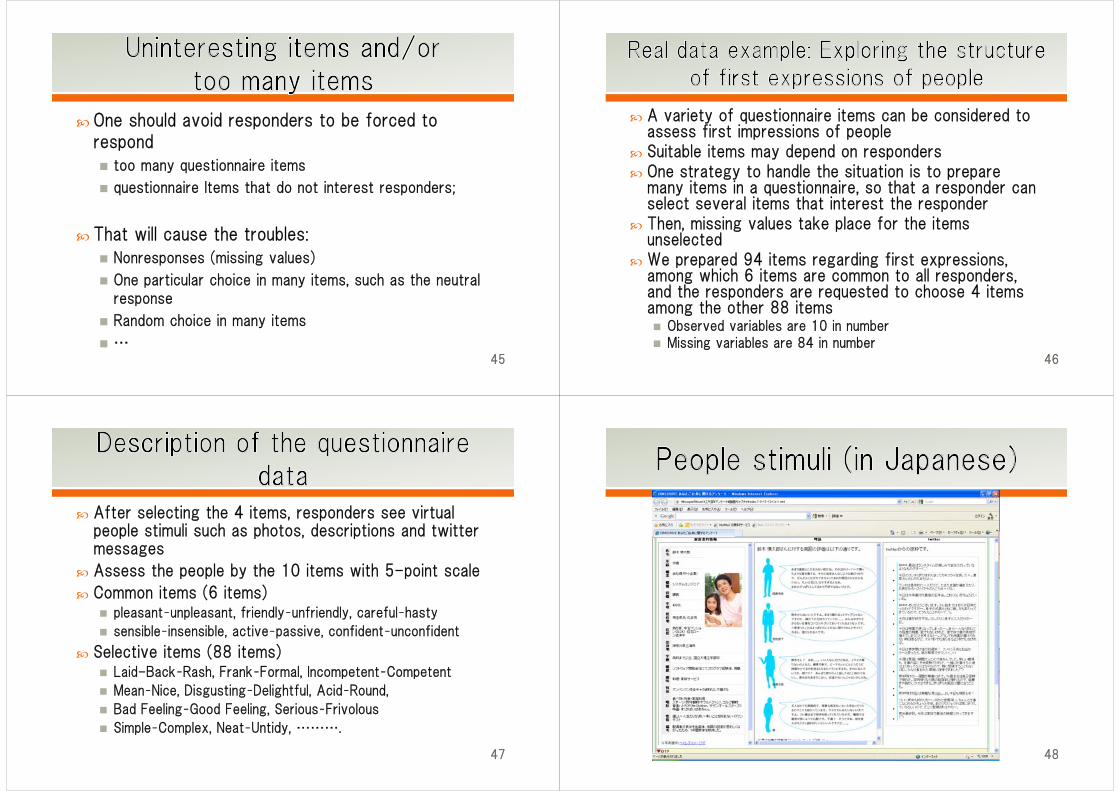
A variety of questionnaire items can be considered to assess first impressions of people
Suitable items may depend on responders One strategy to handle the situation is to prepare
many items in a questionnaire, so that a responder can select several items that interest the responder
Then, missing values take place for the items unselected
We prepared 94 items regarding first expressions, among which 6 items are common to all responders, and the responders are requested to choose 4 items among the other 88 items Observed variables are 10 in number Missing variables are 84 in number
46
After selecting the 4 items, responders see virtual people stimuli such as photos, descriptions and twitter messages
Assess the people by the 10 items with 5-point scale
Common items (6 items) pleasant–unpleasant, friendly–unfriendly, careful–hasty
sensible–insensible, active–passive, confident–unconfident
Selective items (88 items) Laid-Back–Rash, Frank–Formal, Incompetent–Competent
Mean–Nice, Disgusting–Delightful, Acid–Round,
Bad Feeling–Good Feeling, Serious–Frivolous
Simple–Complex, Neat–Untidy, ……….
47 48
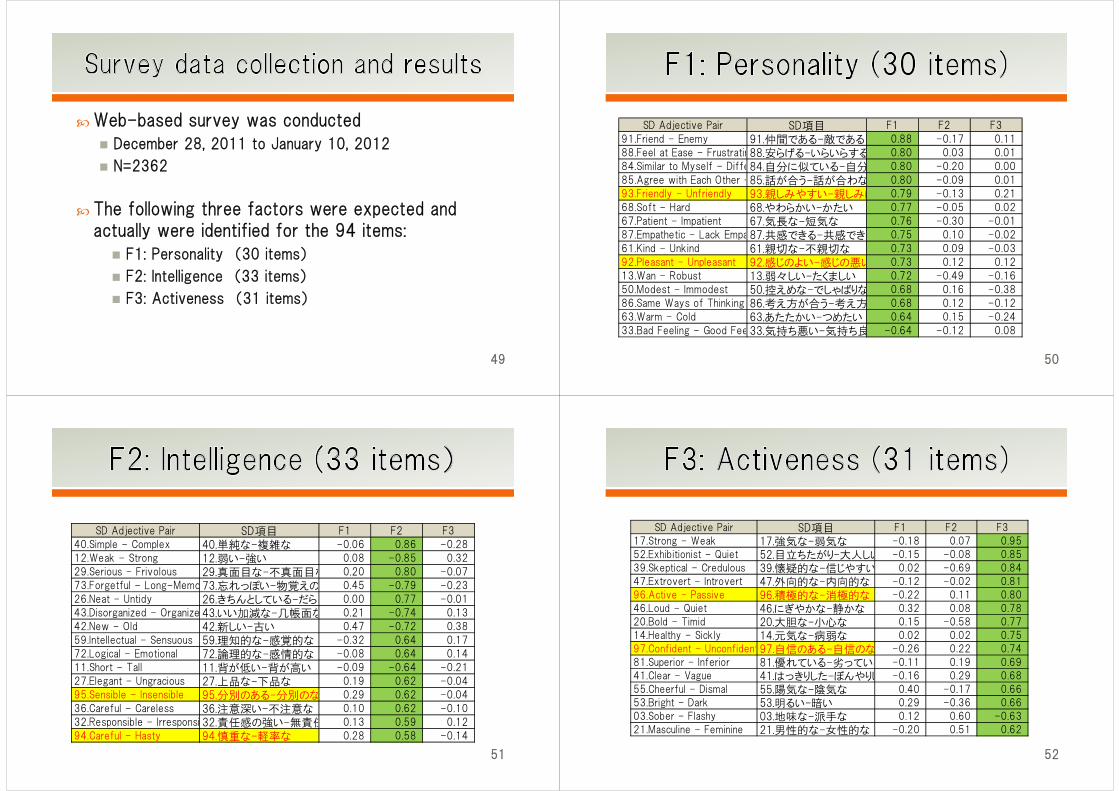
Web-based survey was conducted
December 28, 2011 to January 10, 2012
N=2362
The following three factors were expected and actually were identified for the 94 items:
F1: Personality (30 items)
F2: Intelligence (33 items)
F3: Activeness (31 items)
49 50
SD Adjective Pair SD項目 F1 F2 F3
91.Friend - Enemy 91.仲間である-敵である 0.88 -0.17 0.11
88.Feel at Ease - Frustratin88.安らげる-いらいらする 0.80 0.03 0.01
84.Similar to Myself - Diffe84.自分に似ている-自分 0.80 -0.20 0.00
85.Agree with Each Other -85.話が合う-話が合わな 0.80 -0.09 0.01
93.Friendly - Unfriendly 93.親しみやすい-親しみに 0.79 -0.13 0.21
68.Soft - Hard 68.やわらかい-かたい 0.77 -0.05 0.02
67.Patient - Impatient 67.気長な-短気な 0.76 -0.30 -0.01
87.Empathetic - Lack Empa87.共感できる-共感できな 0.75 0.10 -0.02
61.Kind - Unkind 61.親切な-不親切な 0.73 0.09 -0.03
92.Pleasant - Unpleasant 92.感じのよい-感じの悪い 0.73 0.12 0.12
13.Wan - Robust 13.弱々しい-たくましい 0.72 -0.49 -0.16
50.Modest - Immodest 50.控えめな-でしゃばりな 0.68 0.16 -0.38
86.Same Ways of Thinking 86.考え方が合う-考え方 0.68 0.12 -0.12
63.Warm - Cold 63.あたたかい-つめたい 0.64 0.15 -0.24
33.Bad Feeling - Good Fee33.気持ち悪い-気持ち良 -0.64 -0.12 0.08
51
SD Adjective Pair SD項目 F1 F2 F3
40.Simple - Complex 40.単純な-複雑な -0.06 0.86 -0.28
12.Weak - Strong 12.弱い-強い 0.08 -0.85 0.32
29.Serious - Frivolous 29.真面目な-不真面目な 0.20 0.80 -0.07
73.Forgetful - Long-Memo73.忘れっぽい-物覚えの 0.45 -0.79 -0.23
26.Neat - Untidy 26.きちんとしている-だらし 0.00 0.77 -0.01
43.Disorganized - Organize 43.いい加減な-几帳面な 0.21 -0.74 0.13
42.New - Old 42.新しい-古い 0.47 -0.72 0.38
59.Intellectual - Sensuous 59.理知的な-感覚的な -0.32 0.64 0.17
72.Logical - Emotional 72.論理的な-感情的な -0.08 0.64 0.14
11.Short - Tall 11.背が低い-背が高い -0.09 -0.64 -0.21
27.Elegant - Ungracious 27.上品な-下品な 0.19 0.62 -0.04
95.Sensible - Insensible 95.分別のある-分別のな 0.29 0.62 -0.04
36.Careful - Careless 36.注意深い-不注意な 0.10 0.62 -0.10
32.Responsible - Irresponsi 32.責任感の強い-無責任 0.13 0.59 0.12
94.Careful - Hasty 94.慎重な-軽率な 0.28 0.58 -0.14
52
SD Adjective Pair SD項目 F1 F2 F3
17.Strong - Weak 17.強気な-弱気な -0.18 0.07 0.95
52.Exhibitionist - Quiet 52.目立ちたがり-大人しい -0.15 -0.08 0.85
39.Skeptical - Credulous 39.懐疑的な-信じやすい 0.02 -0.69 0.84
47.Extrovert - Introvert 47.外向的な-内向的な -0.12 -0.02 0.81
96.Active - Passive 96.積極的な-消極的な -0.22 0.11 0.80
46.Loud - Quiet 46.にぎやかな-静かな 0.32 0.08 0.78
20.Bold - Timid 20.大胆な-小心な 0.15 -0.58 0.77
14.Healthy - Sickly 14.元気な-病弱な 0.02 0.02 0.75
97.Confident - Unconfident97.自信のある-自信のな -0.26 0.22 0.74
81.Superior - Inferior 81.優れている-劣っている -0.11 0.19 0.69
41.Clear - Vague 41.はっきりした-ぼんやりし -0.16 0.29 0.68
55.Cheerful - Dismal 55.陽気な-陰気な 0.40 -0.17 0.66
53.Bright - Dark 53.明るい-暗い 0.29 -0.36 0.66
03.Sober - Flashy 03.地味な-派手な 0.12 0.60 -0.63
21.Masculine - Feminine 21.男性的な-女性的な -0.20 0.51 0.62
53
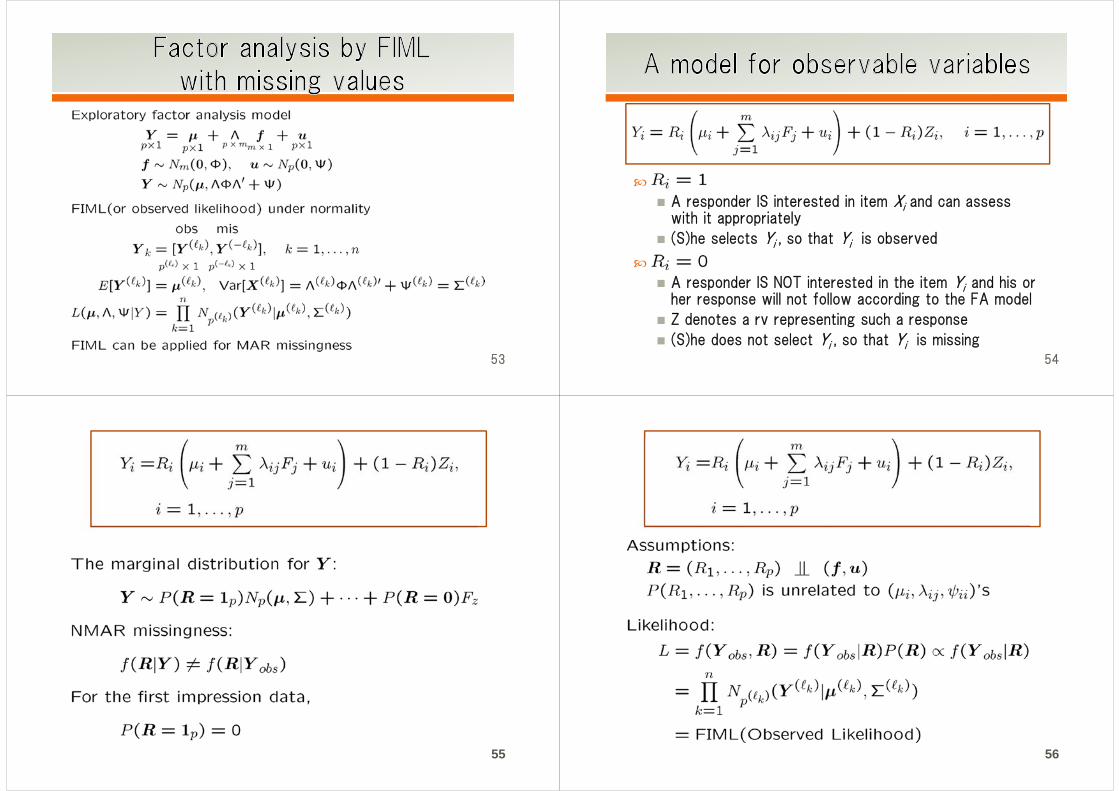
A responder IS interested in item Xi and can assess with it appropriately
(S)he selects Yi , so that Yi is observed
A responder IS NOT interested in the item Yi and his or her response will not follow according to the FA model
Z denotes a rv representing such a response
(S)he does not select Yi , so that Yi is missing54
55 56
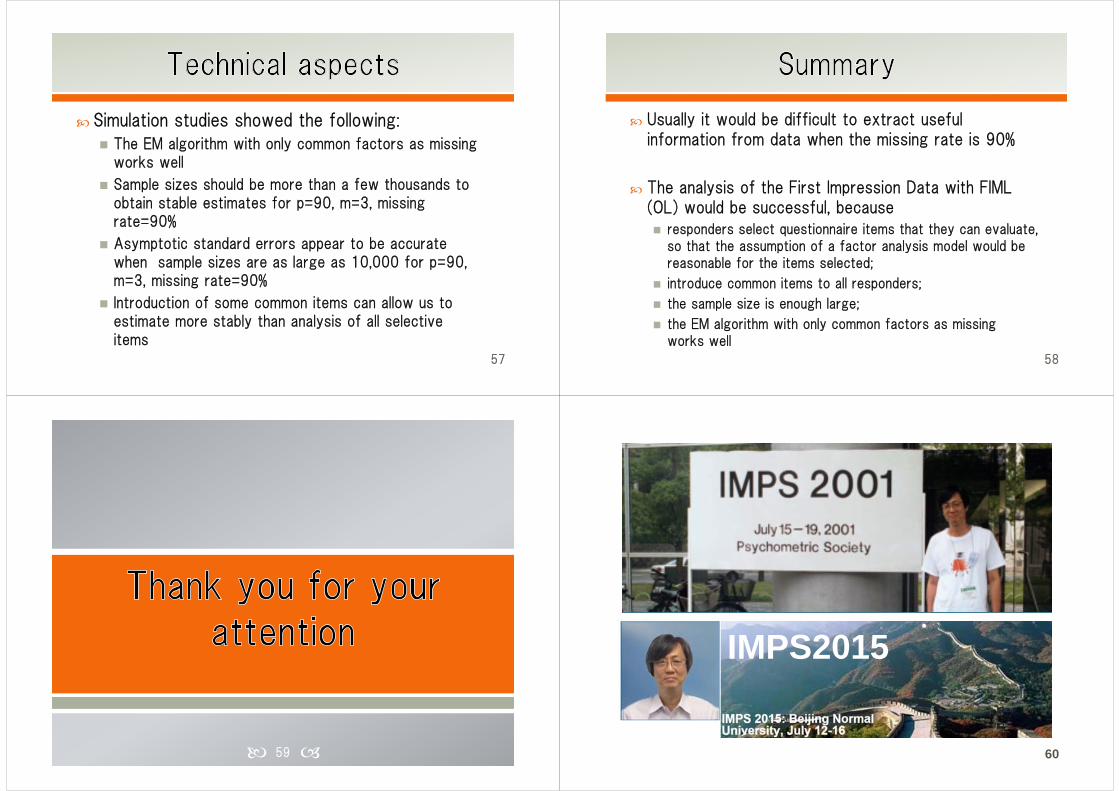
Simulation studies showed the following:
The EM algorithm with only common factors as missing works well
Sample sizes should be more than a few thousands to obtain stable estimates for p=90, m=3, missing rate=90%
Asymptotic standard errors appear to be accurate when sample sizes are as large as 10,000 for p=90, m=3, missing rate=90%
Introduction of some common items can allow us to estimate more stably than analysis of all selective items
57
Usually it would be difficult to extract useful information from data when the missing rate is 90%
The analysis of the First Impression Data with FIML (OL) would be successful, because responders select questionnaire items that they can evaluate,
so that the assumption of a factor analysis model would be reasonable for the items selected;
introduce common items to all responders;
the sample size is enough large;
the EM algorithm with only common factors as missing works well
58
59 60
IMPS2015