Embed Size (px)
Citation preview
Stem Cell Reports, Volume 10
Supplemental Information
IGF-1R Promotes Symmetric Self-Renewal and Migration of Alkaline
Phosphatase+ Germ Stem Cells through HIF-2a-OCT4/CXCR4 Loop
under Hypoxia
Yung-Che Kuo, Heng-Kien Au, Jue-Liang Hsu, Hsiao-Feng Wang, Chiung-Ju Lee, Syue-Wei Peng, Ssu-Chuan Lai, Yu-Chih Wu, Hong-Nerng Ho, and Yen-Hua Huang
1
Supplemental information 1
2
Supplemental Figures: 3
4
5
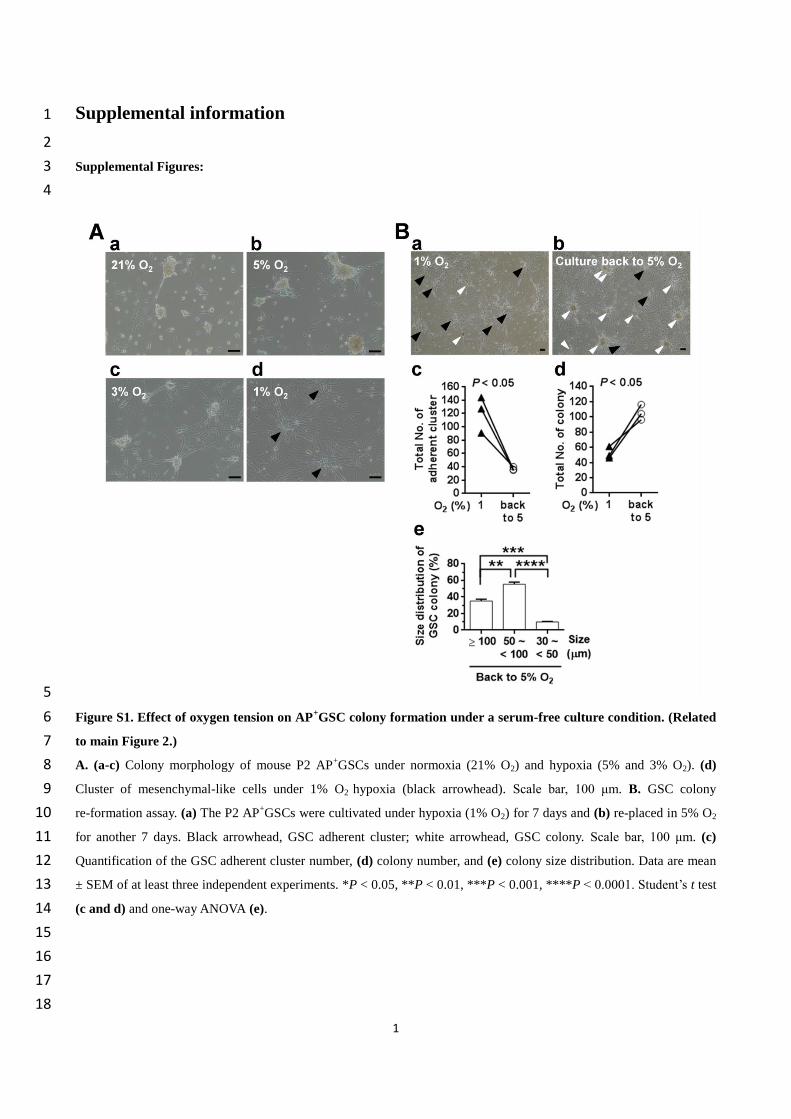
Figure S1. Effect of oxygen tension on AP+GSC colony formation under a serum-free culture condition. (Related 6
to main Figure 2.) 7
A. (a-c) Colony morphology of mouse P2 AP+GSCs under normoxia (21% O2) and hypoxia (5% and 3% O2). (d) 8
Cluster of mesenchymal-like cells under 1% O2 hypoxia (black arrowhead). Scale bar, 100 μm. B. GSC colony 9
re-formation assay. (a) The P2 AP+GSCs were cultivated under hypoxia (1% O2) for 7 days and (b) re-placed in 5% O2 10
for another 7 days. Black arrowhead, GSC adherent cluster; white arrowhead, GSC colony. Scale bar, 100 μm. (c) 11
Quantification of the GSC adherent cluster number, (d) colony number, and (e) colony size distribution. Data are mean 12
± SEM of at least three independent experiments. *P < 0.05, **P < 0.01, ***P < 0.001, ****P < 0.0001. Student’s t test 13
(c and d) and one-way ANOVA (e). 14
15
16
17
18
2
1
2 3
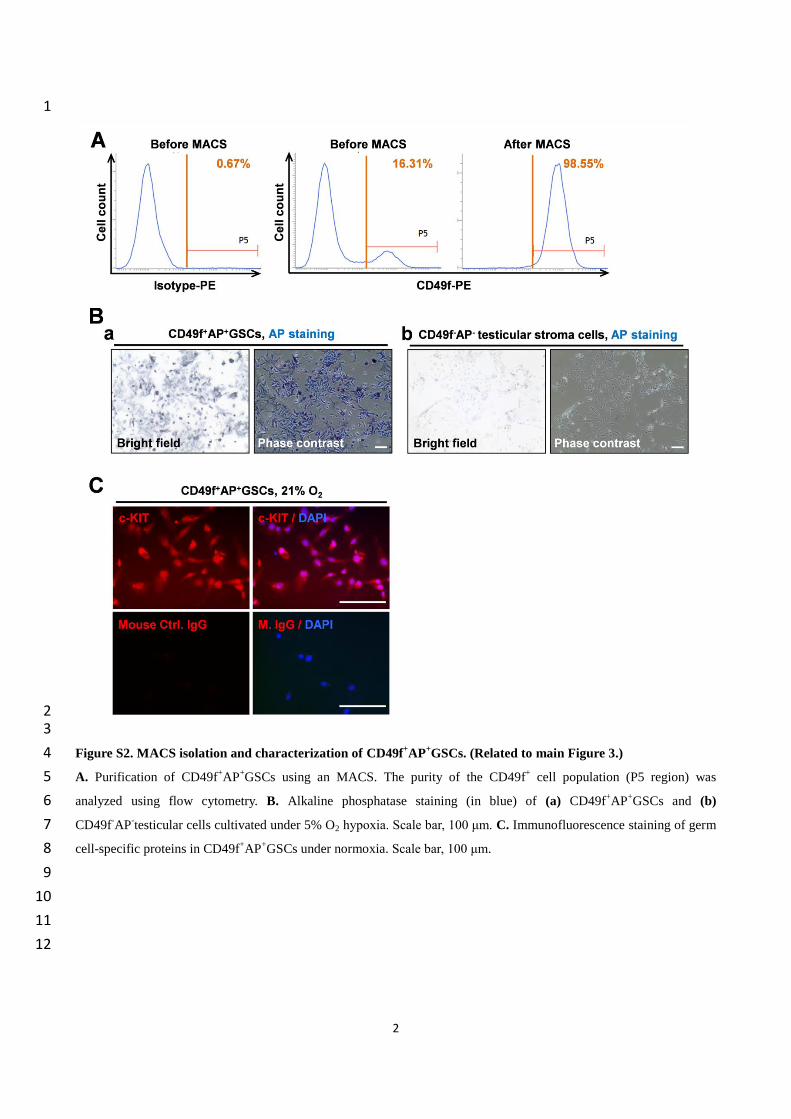
Figure S2. MACS isolation and characterization of CD49f+AP
+GSCs. (Related to main Figure 3.) 4
A. Purification of CD49f+AP
+GSCs using an MACS. The purity of the CD49f
+ cell population (P5 region) was 5
analyzed using flow cytometry. B. Alkaline phosphatase staining (in blue) of (a) CD49f+AP
+GSCs and (b) 6
CD49f-AP
-testicular cells cultivated under 5% O2 hypoxia. Scale bar, 100 μm. C. Immunofluorescence staining of germ 7
cell-specific proteins in CD49f+AP
+GSCs under normoxia. Scale bar, 100 μm. 8
9
10
11
12
3
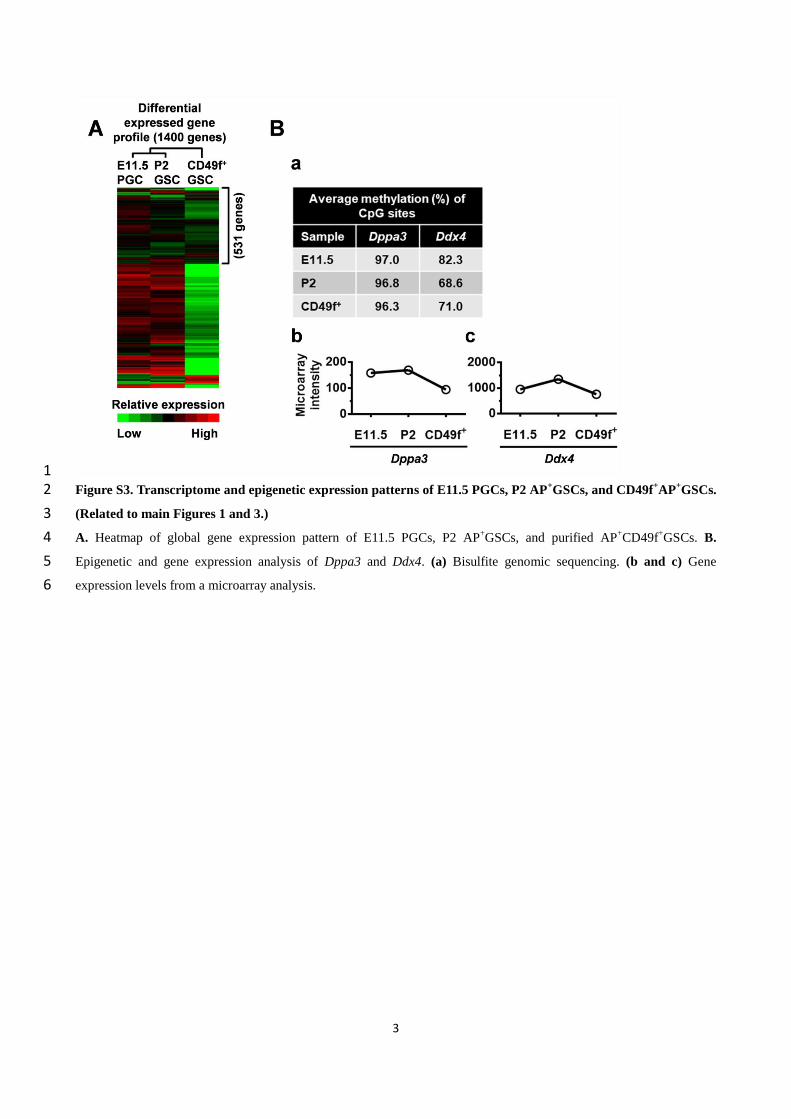
1 Figure S3. Transcriptome and epigenetic expression patterns of E11.5 PGCs, P2 AP
+GSCs, and CD49f
+AP
+GSCs. 2
(Related to main Figures 1 and 3.) 3
A. Heatmap of global gene expression pattern of E11.5 PGCs, P2 AP+GSCs, and purified AP
+CD49f
+GSCs. B. 4
Epigenetic and gene expression analysis of Dppa3 and Ddx4. (a) Bisulfite genomic sequencing. (b and c) Gene 5
expression levels from a microarray analysis. 6

4
1
Figure S4. Immunostaining of SDF-1 and c-KIT in AP+GSC colonies and CD49f
+AP
+GSCs. (Related to main 2
Figure 3.) 3
Immunofluorescence staining of SDF-1 and c-KIT in (A) AP+GSC colonies and (B) CD49f
+AP
+GSCs under 5% O2 4
hypoxia. Negative immunostaining controls (IgG) are shown. Scale bar, 100 μm. 5
6
7

5
1
Figure S5. Effect of hypoxia on c-KIT, phospho-STAT3, and OCT4 expression in CD49f+AP
+GSCs. (Related to 2
main Figures 2 and 3.) 3
A. Effect of different oxygen tension (21%, 5%, and 1% O2 for 24 h) on c-KIT expression levels of CD49f+AP
+GSCs 4
(Western blot analysis). B. Quantitative analysis of (A). Data are the means ± SEM of at least three independent 5
experiments. One-way ANOVA. **P < 0.01, ****P < 0.0001. C. Cells were cultivated under different oxygen tension 6
of 21%, 5%, and 1% O2 for 24 h. The protein levels of STAT3, phospho-STAT3 (pY705), and OCT4 of 7
CD49f+AP
+GSCs are shown. Western blot analysis. D. Quantitative analysis of (C). Data are the means ± SEM of at 8
least three independent experiments. One-way ANOVA. *P < 0.05. 9
10
11
6
1
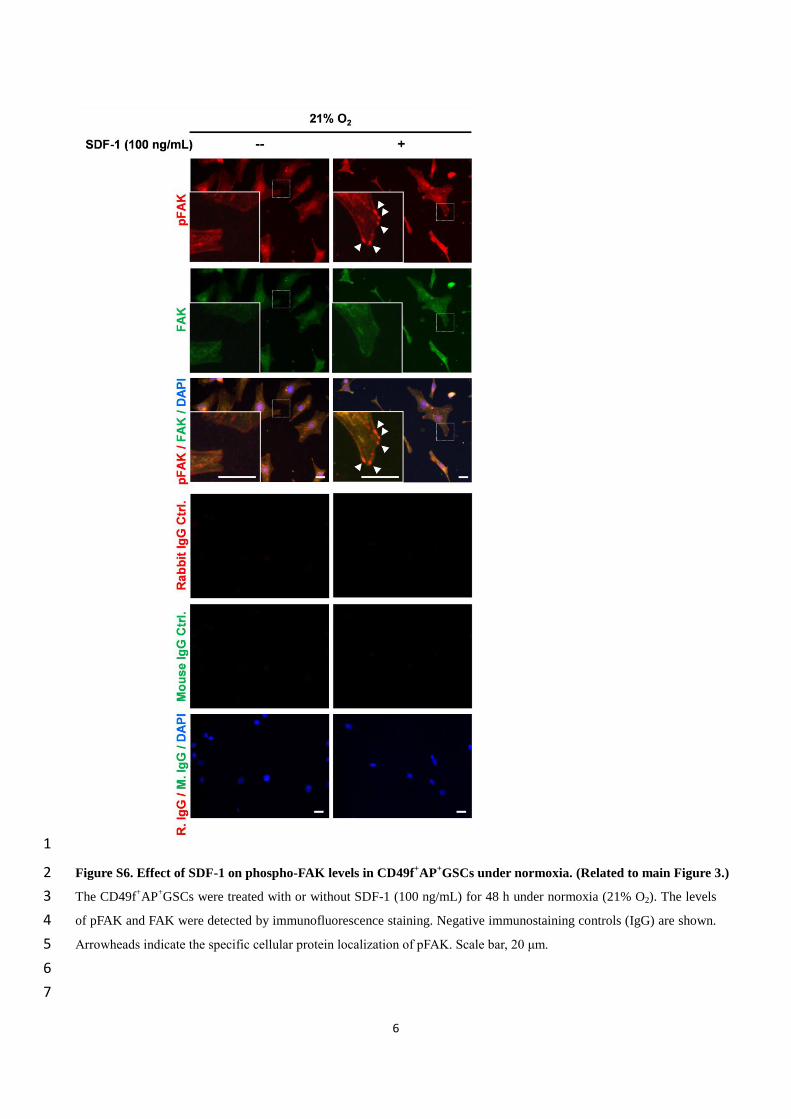
Figure S6. Effect of SDF-1 on phospho-FAK levels in CD49f+AP
+GSCs under normoxia. (Related to main Figure 3.) 2
The CD49f+AP
+GSCs were treated with or without SDF-1 (100 ng/mL) for 48 h under normoxia (21% O2). The levels 3
of pFAK and FAK were detected by immunofluorescence staining. Negative immunostaining controls (IgG) are shown. 4
Arrowheads indicate the specific cellular protein localization of pFAK. Scale bar, 20 μm. 5
6
7

7
1
Figure S7. Effect of IGF-1/IGF-1R activation on the cell adhesion and migration of mouse CD49f+AP
+GSCs. 2
(Related to main Figures 4 and 5.) 3
A. Effect of IGF-1 (0, 1, 10, and 50 ng/mL) on the cell morphology of CD49f+AP
+GSCs under hypoxia (5% O2). (a) 4
Cell adhesion and morphology. Scale bar, 100 μm. (b) Quantitative analysis of (a). Data are the means ± SEM of at 5
least three independent experiments. *P < 0.05. One-way ANOVA. B. Migration assay of CD49f+AP
+GSCs under 6
hypoxia (1% O2, 18h) with or without PPP treatment. (a) Wound closure assay. (b) Quantitative analysis of (a). Data are 7
the means ± SEM of at least three independent experiments. ***P < 0.001. Student’s t test. Scale bars, 100 μm. 8
9
10
11
12
13
14
15
16
17
18
19
20
21

8
Supplemental Tables: 1
2
Table S1. List of protein classes upregulated in hypoxic AP+GSCs. 3
(Related to main Figure 2) 4
5
6
7
8
9
10
11
12
13
14
15
16
17
18
19
20
21
9
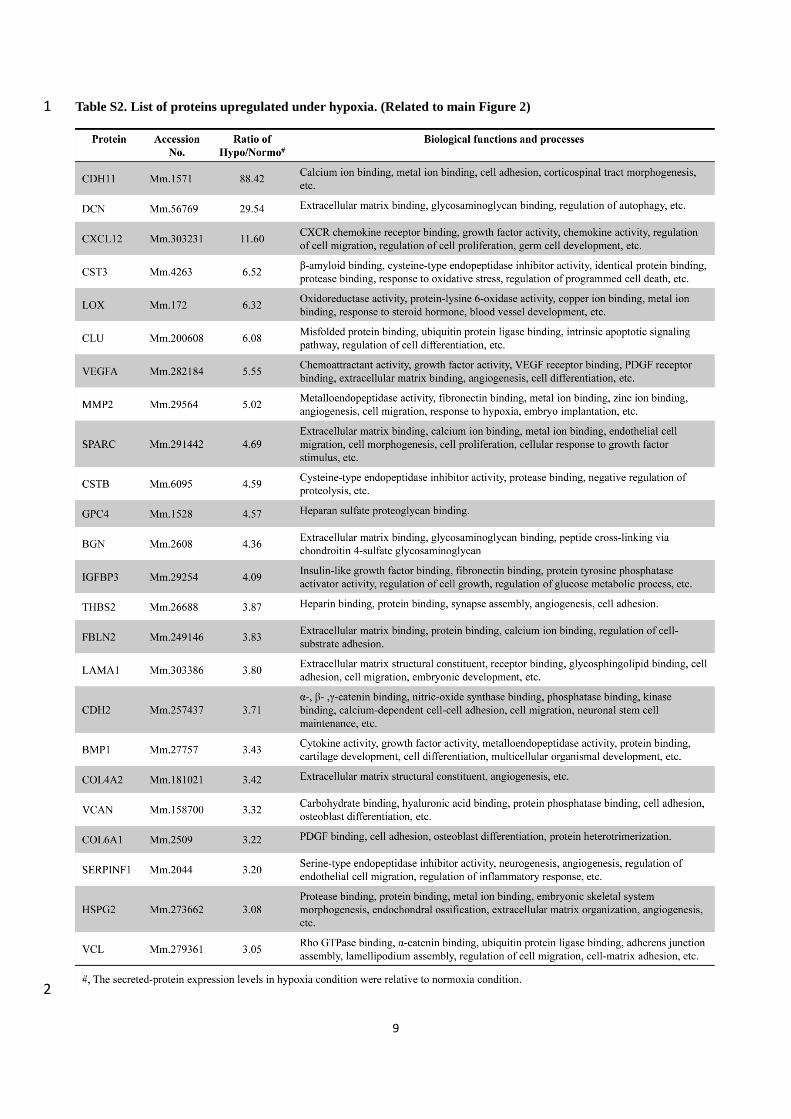
Table S2. List of proteins upregulated under hypoxia. (Related to main Figure 2) 1
2
10
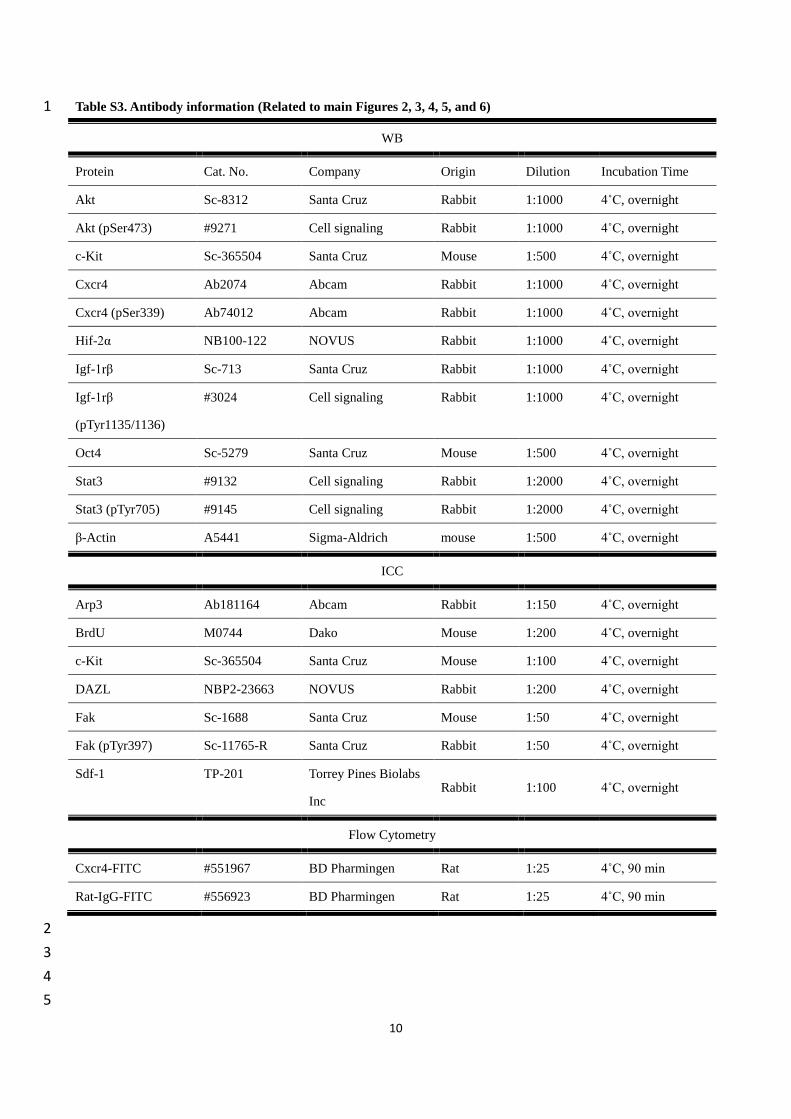
Table S3. Antibody information (Related to main Figures 2, 3, 4, 5, and 6) 1
WB
Protein Cat. No. Company Origin Dilution Incubation Time
Akt Sc-8312 Santa Cruz Rabbit 1:1000 4˚C, overnight
Akt (pSer473) #9271 Cell signaling Rabbit 1:1000 4˚C, overnight
c-Kit Sc-365504 Santa Cruz Mouse 1:500 4˚C, overnight
Cxcr4 Ab2074 Abcam Rabbit 1:1000 4˚C, overnight
Cxcr4 (pSer339) Ab74012 Abcam Rabbit 1:1000 4˚C, overnight
Hif-2α NB100-122 NOVUS Rabbit 1:1000 4˚C, overnight
Igf-1rβ Sc-713 Santa Cruz Rabbit 1:1000 4˚C, overnight
Igf-1rβ
(pTyr1135/1136)
#3024 Cell signaling Rabbit 1:1000 4˚C, overnight
Oct4 Sc-5279 Santa Cruz Mouse 1:500 4˚C, overnight
Stat3 #9132 Cell signaling Rabbit 1:2000 4˚C, overnight
Stat3 (pTyr705) #9145 Cell signaling Rabbit 1:2000 4˚C, overnight
β-Actin A5441 Sigma-Aldrich mouse 1:500 4˚C, overnight
ICC
Arp3 Ab181164 Abcam Rabbit 1:150 4˚C, overnight
BrdU M0744 Dako Mouse 1:200 4˚C, overnight
c-Kit Sc-365504 Santa Cruz Mouse 1:100 4˚C, overnight
DAZL NBP2-23663 NOVUS Rabbit 1:200 4˚C, overnight
Fak Sc-1688 Santa Cruz Mouse 1:50 4˚C, overnight
Fak (pTyr397) Sc-11765-R Santa Cruz Rabbit 1:50 4˚C, overnight
Sdf-1 TP-201 Torrey Pines Biolabs
Inc Rabbit 1:100 4˚C, overnight
Flow Cytometry
Cxcr4-FITC #551967 BD Pharmingen Rat 1:25 4˚C, 90 min
Rat-IgG-FITC #556923 BD Pharmingen Rat 1:25 4˚C, 90 min
2
3
4
5
11
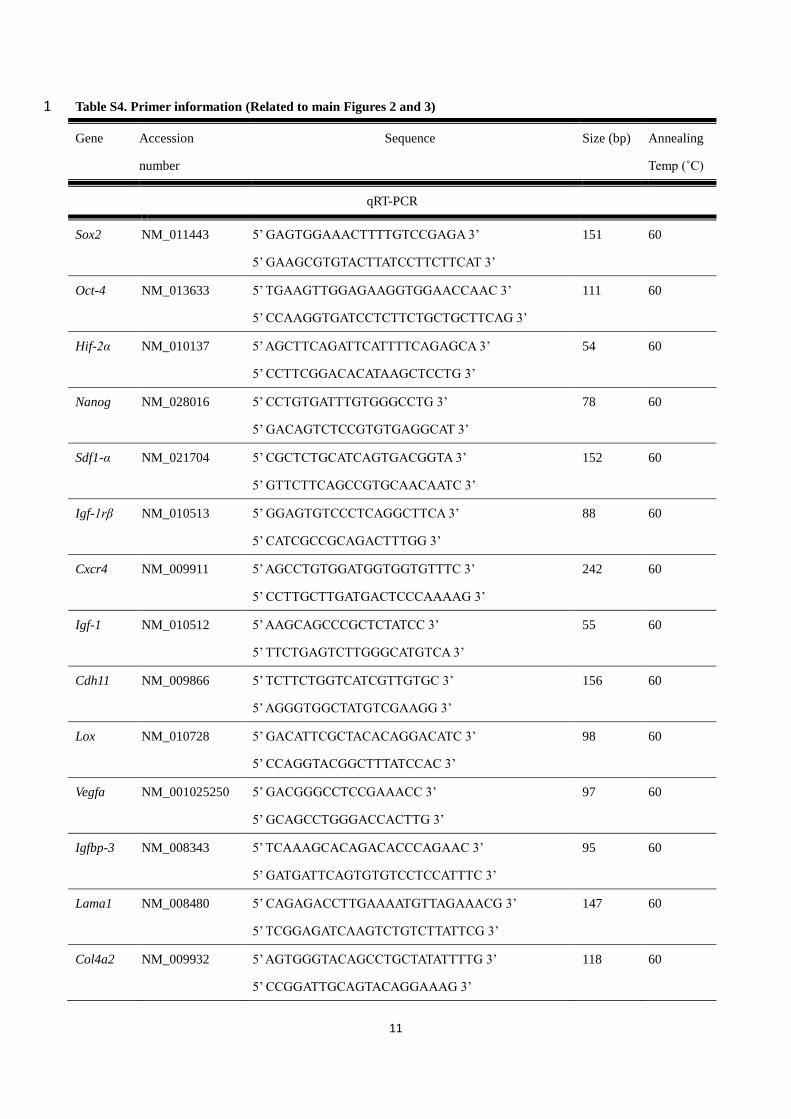
Table S4. Primer information (Related to main Figures 2 and 3) 1
Gene Accession
number
Sequence Size (bp) Annealing
Temp (˚C)
qRT-PCR
Sox2 NM_011443 5’ GAGTGGAAACTTTTGTCCGAGA 3’
5’ GAAGCGTGTACTTATCCTTCTTCAT 3’
151 60
Oct-4 NM_013633 5’ TGAAGTTGGAGAAGGTGGAACCAAC 3’
5’ CCAAGGTGATCCTCTTCTGCTGCTTCAG 3’
111 60
Hif-2α NM_010137 5’ AGCTTCAGATTCATTTTCAGAGCA 3’
5’ CCTTCGGACACATAAGCTCCTG 3’
54 60
Nanog NM_028016 5’ CCTGTGATTTGTGGGCCTG 3’
5’ GACAGTCTCCGTGTGAGGCAT 3’
78 60
Sdf1-α NM_021704 5’ CGCTCTGCATCAGTGACGGTA 3’
5’ GTTCTTCAGCCGTGCAACAATC 3’
152 60
Igf-1rβ NM_010513 5’ GGAGTGTCCCTCAGGCTTCA 3’
5’ CATCGCCGCAGACTTTGG 3’
88 60
Cxcr4 NM_009911 5’ AGCCTGTGGATGGTGGTGTTTC 3’
5’ CCTTGCTTGATGACTCCCAAAAG 3’
242 60
Igf-1 NM_010512 5’ AAGCAGCCCGCTCTATCC 3’
5’ TTCTGAGTCTTGGGCATGTCA 3’
55 60
Cdh11 NM_009866 5’ TCTTCTGGTCATCGTTGTGC 3’
5’ AGGGTGGCTATGTCGAAGG 3’
156 60
Lox NM_010728 5’ GACATTCGCTACACAGGACATC 3’
5’ CCAGGTACGGCTTTATCCAC 3’
98 60
Vegfa NM_001025250 5’ GACGGGCCTCCGAAACC 3’
5’ GCAGCCTGGGACCACTTG 3’
97 60
Igfbp-3 NM_008343 5’ TCAAAGCACAGACACCCAGAAC 3’
5’ GATGATTCAGTGTGTCCTCCATTTC 3’
95 60
Lama1 NM_008480 5’ CAGAGACCTTGAAAATGTTAGAAACG 3’
5’ TCGGAGATCAAGTCTGTCTTATTCG 3’
147 60
Col4a2 NM_009932 5’ AGTGGGTACAGCCTGCTATATTTTG 3’
5’ CCGGATTGCAGTACAGGAAAG 3’
118 60

12
β-2m NM_009735 5’ CCGAACATACTGAACTGC 3’
5’ AGAAAGACCAGTCCTTGC 3’
185 60
Methylation Specific PCR and Pyrosequencing
Dppa3 NM_139218 5’ GGTGGTTATTATTGTTAGGTTTGAAGT 3’
5’ ACCCAATCTACCCCCAAACTACTTTA 3’
Pyro seq. 5’ GGAATTGGTTGGGAT 3’
Ddx4 NM_001145885 5’ GAATTGATGAGTTTTTGGAGAGAGAA 3’
5’ ACCTCTCCCCTCCAAACTCCCC 3’
Pyro seq. 5’ GGTTTAGGTTTTAATAAAGGTGG 3’
Nanog NM_028016 5’ GGATTTTGTAGGTGGGATTAATTG 3’
5’ CGCCAGGGTTTTCCCAGTCACGACCTACCCTACCCACCCCCTATTCT 3’
Pyro seq. 5’ TGAATTTATAGGGTTGGTG 3’
Oct4 NM_013633 5’ TTAAGGTTAGAGGGTGGGATTG 3’
5’ CGCCAGGGTTTTCCCAGTCACGACTCTAAAACCAAATATCCAACCATA 3’
Pyro seq. 5’ GGAGGGAGAGGTGAAAT 3’
Prdm14 NM_001081209 5’ GTTTAGGTTTAGGGAGGGTAGAATGTA3’
5’ CCCTTTAAAACCCCATAAACTAATTCT 3’
Pyro seq. 5’ AGGGTAGAATGTATTGTT 3’
1
13
Supplemental Experimental Procedures: 1
2
Alkaline phosphatase activity assay 3
Clumped germline stem cell (GSC) colonies cultivated under 21%, 5%, 3%, or 1% O2 atmosphere were fixed 4
with 4% paraformaldehyde for 30 min at room temperature. The alkaline phosphatase (AP) activity of these GSCs was 5
examined using an AP detection kit (Chemicon, Hampshire, UK), and Nitro Blue Tetrazolium/ 6
5-Bromo-4-chloro-3-indolyl phosphate (NBT/BCIP) substrate (Sigma-Aldrich, St. Louis, MO, USA) according to the 7
manufacturer’s instructions. 8
9
Identification of protein expression profiles using LC-MS/MS and the Mascot Distiller search engine 10
Peptide mixtures obtained from the conditioned medium of AP+GSC colonies cultivated under 21% O2 (normoxia 11
control) and 5% O2 (hypoxia) was separated using a BioBasic C18 column (150 mm × 2.1 mm, particle size 5 µm) with a 12
gradient from 5% to 70% acetonitrile in 0.1% formic acid over 90 min at a flow rate of 200 µL/min. The MS/MS 13
analysis was performed using a LTQ Velos system (Thermo Fisher Scientific) in the positive electrospray ionization 14
mode with a survey scan for the precursor ion that ranged from m/z = 400–1600. The MS/MS raw data acquired from 15
either the control or hypoxia-treated sample were processed into an MGF file using Mascot Distiller v2.3.2.0 (Matrix 16
Science, London, UK). The resulting MGF files of the control or hypoxia-treated samples were searched using the 17
Mascot search engine v2.3 (Matrix Science) with the following search parameters: (1) the protein database was set to 18
Swiss-Prot; (2) the taxonomy was set as Mus musculus (house mouse); (3) one trypsin missed cleavage was allowed; (4) 19
the precursor and product ion mass tolerance were set to 1.20 Da and 0.60 Da, respectively; (5) carbamidomethyl (C) 20
was chosen for fixed modification; (6) oxidation (M) was chosen for the variable modification; and (7) the significance 21
threshold was P < 0.05. The relative quantitative analysis of protein expression in the control or hypoxia-treated 22
samples was performed using Mascot Distiller v2.3.2.0 and the label-free quantitation mode. The parameters of the 23
Mascot Distiller were set as follows: (1) report ratio: C1/Ref (C1 and Ref represent hypoxia-treated and control samples, 24
respectively); (2) protocol: replicate; (3) integration method: Simpson’s; (4) integration source: survey (precursor peak 25
area from survey scan); (5) correlation threshold: 0.6; (6) Std. Err. threshold: 999 (threshold on the standard error for a 26
straight line fit of the component intensities from each of the scans in the XIC peak); (7) XIC threshold: 0.1; (8) max 27
XIC width (upper limit on the number of survey scans in an XIC peak): 250; (9) XIC smoothing: 3; (10) peptide 28
threshold type: at least identity; and (11) outlier method: auto (using Dioxon’s or Rosner’s outlier method according to 29
the number of values). The relative quantitation result was then normalized using the ratio of the internal standard 30
(β-ACTIN). 31
32
Trypsin digestion of proteins extracted from PGC-like AP+GSCs with and without hypoxia treatment 33
Either hypoxia-treated or control PGC-like AP+GSCs proteins (100 μg) dissolved in deionized water (60 μL) were 34
denatured and reduced at 95°C for 5 min using 7.5% SDS (9.3 μL) and 1M 1,4-dithiothreitol (0.7 μL). Subsequently, 35
0.5 M iodoacetamide (8 μL) was added to the protein mixture, which was then incubated at room temperature in the 36
dark for 30 min. Afterward, 50% trichloroacetic acid (52 μL) was added and the precipitate was washed with deionized 37
water (200 μL × 3). The resulting protein precipitate was dissolved in 50 mM ammonium bicarbonate (100 μL) and 2% 38
14
N-octyl-β-D-glucopyranoside (5 μL). Sequencing-grade trypsin (2 μg) was added and the mixture was incubated at 1
37°C for 18 h. The resulting tryptic digest was acidified with 2% formic acid (10 μL) to stop the enzymatic reaction, 2
and the resulting digest was lyophilized and maintained at -20°C. 3
4
Gene ontology (GO) analysis 5
The differential protein secretion profiles of mouse AP+GSCs were analyzed by the PANTHER classification 6
system (Mi et al., 2016) for gene ontology secretome analysis. Four selected items of the signaling pathway category 7
were pluripotency regulation of stem cells (KEGG pathway map No.: mmu04550), PI3K-AKT signaling pathway 8
(mmu04151), Chemokine-associated signaling pathway (mmu04512), and HIF signaling pathway (mmu04066). 9
STRING program (Szklarczyk et al., 2015) was used for protein network analysis. 10
11
RNA extraction, reverse transcription, and quantitative real-time polymerase chain reaction 12
The AP+GSC colonies and CD49f
+AP
+GSC cultivated under 21% and 5% O2 atmosphere were collected. Total 13
RNA was extracted using the Trizol Kit (Invitrogen, Frederick, MD, USA), and complementary DNA was synthesized 14
using Moloney murine leukemia virus reverse transcriptase (Thermo Fisher Scientific) according to the manufacturer’s 15
instructions. Quantitative real-time polymerase chain reaction (qRT-PCR) was performed using the FastStart Universal 16
SYBR Green Master Mix (Roche, Indianapolis, IN, USA) in a LightCycler 480 instrument (Roche), and the qRT-PCR 17
results were recorded and analyzed using the instrument’s application software. Gene expression levels were normalized 18
by β-2 microglobulin (β-2m). Primer sequences are listed in Table S4. 19
20
Transcriptome analysis 21
Total RNA was extracted from the E11.5 PGC colony, P2 AP+GSC colony, and CD49f
+AP
+GSCs using the Trizol 22
reagent (Invitrogen). The quality of the total RNA was assessed using an Agilent 2100 Bioanalyzer (Agilent 23
Technologies, Santa Clara, CA, USA). Fluorescent aRNA targets were prepared from 1 μg of total RNA samples using a 24
OneArray® Amino Allyl aRNA Amplification Kit (Phalanx Biotech Group, Hsinchu, Taiwan) and Cy5 dye (GE 25
Healthcare). Fluorescent targets were hybridized to a Mouse Whole Genome OneArray® with Phalanx hybridization 26
buffer using the Phalanx Hybridization System. The Mouse Whole Genome OneArray® v2 (Phalanx Biotech Group) 27
contains 27,307 DNA oligonucleotide probes. Among the probes, 26,423 correspond to the annotated genes in the 28
RefSeq v42 and Ensembl v59 databases. In addition, 884 control probes are included. Briefly, after hybridization and 29
washing, the slides were scanned using a DNA Microarray Scanner (Model G2505C, Agilent Technologies). The Cy5 30
fluorescent intensity of each spot was analyzed using the GenePix 4.1 software (Molecular Devices). Each single 31
sample was analyzed at least twice in terms of technical or biological replicates, with a reproducibility of more than 32
0.975. The signal intensity was loaded into the Rosetta Resolver System® (Rosetta Biosoftware, WA, USA) to perform 33
data preprocessing and applied to a 75 percentile centering normalization. The errors of the sample were estimated 34
using an error-weighted approach simultaneously. Both the fold change and P value for the pair-wise sample 35
comparison were calculated to evaluate the differentially expressed genes. A fold change of ≥2 or ≤-2 and a P value of 36
<0.05 are strongly recommended for further analysis. 37
38
15
Bisulphite conversion, methylation-specific PCR, and pyrosequencing 1
Total genomic DNA was isolated from the E11.5 PGC colony, P2 AP+GSC colony, and CD49f
+AP
+GSCs. First, 2
500 ng of genomic DNA was bisulphite-converted using the EpiTect Fast bisulphite conversion kit according to the 3
manufacturer’s instructions (QIAGEN, Germantown, MD, USA). Bisulfate Specific PCR was performed using a 4
PyroMark PCR kit (QIAGEN), followed by PCR product purification. The purified PCR product was hybridized with a 5
pyrosequence primer using PyroMark Gold Q24 reagent according to the Pyromark Q24 vacuum workstation guide 6
(QIAGEN). The methylation percentage per CpG position was determined using the PyroMark Q24 software 7
(QIAGEN). Briefly, the methylation percentage was assessed by the ratio of real-time incorporated C and T nucleotides 8
into the growing DNA strand, resulting in an enzymatic cascade of pyrophosphate release and the production of a light 9
signal. Nanog and Oct4 pyrosequence primer information was according to a study conducted by Rugg-Gunn et al. 10
(2010). Primer sequences are listed in Table S4. 11
12
Flow cytometry 13
For the hypoxia experiment, CD49f+AP
+GSCs were cultivated under 1%, 5%, or 21% O2 atmosphere for 3 days. 14
For the flow cytometry analysis of cell surface CXCR4, the culture medium was replaced every day to eliminate the 15
secreted SDF-1 in the medium, which may lead to cell surface CXCR4 internalization (Signoret et al., 1998). For the 16
IGF-1R signaling inhibition experiment, the cells were treated with or without the IGF-1R phosphorylation inhibitor 17
cyclolignan picropodophyllin (PPP, 1 μM, Enzo Life Sciences, Farmingdale, NY, USA) under 1% O2 atmosphere for 3 18
days. Cells were detached using Accutase® treatment (Innovative Cell Technologies, San Diego, CA, USA), followed 19
by immunostaining with antibodies against specific surface markers for flow cytometry analysis. Briefly, 2 × 10⁵ cells 20
were incubated with 1% BSA/PBS blocking solution for 30 min and then interacted with a fluorescein 21
isothiocyanate-conjugated CXCR4 antibody or isotype control (BD Pharmingen, San Jose, CA, USA) at 4°C for 90 min. 22
After resuspension in PBS buffer, the CXCR4+
cell percentage was analyzed using a BD FACSVerse cytometer and the 23
instrument’s application FACSuite software (BD Biosciences, San Jose, CA, USA). The primary antibodies used in the 24
experiment are listed in Table S3 25
26
Western blot analysis 27
For oxygen tension experiments, CD49f+AP
+GSCs were cultivated under 1%, 5%, or 21% O2 atmosphere for 3 28
days; for IGF-1 experiments, the cells were treated with IGF-1 (0–50 ng/mL, PeproTech, Rocky Hill, NJ, USA) under 29
21% O2 for 3 days. For HIF-2α knockdown experiments, the cells were transfected with a high-efficiency shHIF-2α 30
clone (NM_010137, 5’-ggagacggaggtcttctat-3’) (Huang et al., 2014) or shCtrl (TRCN0000072246, National RNAi Core, 31
Taiwan) for 24 h and then treated with or without IGF-1 (10 ng/mL) for an additional 24 h. For receptor crosstalk 32
experiments, the cells were pretreated with or without PPP (1 μM) or AMD3100 (50 μM, Sigma-Aldrich) for 6 h and 33
then treated with IGF-1 (50 ng/mL) or SDF-1 (400 ng/mL, PeproTech) for 0, 2, and 5 min. The cell lysates of 34
CD49f+AP
+GSCs were collected and extracted using reducing 2× Laemmli sample buffer and subjected to 10% 35
SDS-PAGE electrophoresis; western blotting analysis was then performed. The primary antibodies used in the 36
experiments are listed in Table S3, and horseradish peroxidase-conjugated anti-mouse or anti-rabbit IgG (1:2000) 37
served as the secondary antibody. HRP enzyme activity was detected using an enhanced chemiluminescence system 38
16
according to the manufacturer’s instructions (Amersham Pharmacia Biotech, Buckinghamshire, UK). Quantifications of 1
the protein bands were performed using the SPOT DENSO software on an AlphaImager2200 instrument (Alpha 2
Innotech Corporation, CA, USA). 3
4
Immunocytochemical staining 5
For the BrdU incorporation assay, GSC colonies were cultivated under 5% O2 atmosphere at 37°C for 7 days, and 6
BrdU (0.1 mM) was added to the medium for further 24 h incubation. Excess BrdU in the medium was removed by 7
three washes with PBS, and the BrdU-incorporated cells were fixed with 4% paraformaldehyde and treated with 2 N 8
HCl, followed by neutralization with 0.1 M sodium borate. For hypoxia experiments, CD49f+AP
+GSCs were cultivated 9
under 1%–21% O2 atmosphere for 3 days, and AP+GSCs were cultivated under a 5% O2 atmosphere for 7 days; for PPP 10
inhibition experiments, the cells were treated with or without PPP (1 μM) under 1% O2 oxygen concentration for 3 days. 11
All experiments were performed using immunocytochemical analysis. Cells were fixed in 4% paraformaldehyde, 12
permeabilized with 0.5% triton X-100 in PBS, and then blocked with 3% BSA in 0.5% triton X-100 in PBS. Cells were 13
incubated with a primary antibody (Table S3) at 4°C overnight and then interacted with Alexa 488- or Alexa 14
594-conjugated secondary antibodies (Invitrogen). The nuclei of all cells were counterstained with 15
4',6-diamidino-2-phenylindole (Sigma-Aldrich) and analyzed using a fluorescence microscope (Leica, Buffalo Grove, 16
IL, USA) or a laser confocal microscope (Leica). 17
18
Migration assay and wound healing assay 19
Transwell assays were performed using an 8-μm pore transwell insert in 24-well plates (Corning, Corning, NY, 20
USA). The upper chambers were seeded with CD49f+AP
+GSCs (1.5 × 10
5/100 μL), followed by treatment with IGF-1 21
(0–50 ng/mL) in lower chambers as an attractant for 3 days. For hypoxia experiments, the PPP groups of 22
CD49f+AP
+GSCs were pretreated with PPP (1 μM) for 2 h. All experimental cells were treated with PPP (1 μM) or 23
SDF-1 (100 ng/mL) in the upper chamber and then treated with IGF-1 (50 ng/mL) in the lower chamber under 21%, 5%, 24
and/or 1% O2 atmosphere for 3 days. Migrated cells were stained with crystal violet and counted in six random fields 25
under a light microscope. For the wound healing assay, CD49f+AP
+GSCs (1 × 10
5/well) were seeded into a culture 26
insert (Ibidi, Martinsried, Germany). Adherent cells were treated with IGF-1 (50 ng/mL), SDF-1 (100 ng/mL), or PPP (1 27
μM) under different culture conditions. At the end point, cells were stained with crystal violet. The photos of the cells 28
were taken at each time point, and the gap area was measured and quantified. 29
30
31
32
33
34
35
36
37
38
17
Supplemental References: 1
Huang, Y.H., Lin, M.H., Wang, P.C., Wu, Y.C., Chiang, H.L., Wang, Y.L., Chang, J.H., Huang, Y.K., Gu, S.Y., Ho, H.N. 2
et al. (2014). Hypoxia inducible factor 2alpha/insulin-like growth factor receptor signal loop supports the proliferation 3
and Oct-4 maintenance of mouse germline stem cells. Mol Hum Reprod. 20, 526-537. 4
5
Mi, H., Poudel, S., Muruganujan, A., Casagrande, J.T., Thomas, P.D. (2016). PANTHER version 10: expanded protein 6
families and functions, and analysis tools. Nucleic Acids Res. 44, D336-342. 7
8
Rugg-Gunn, P.J., Cox, B.J., Ralston, A., Rossant, J. (2010). Distinct histone modifications in stem cell lines and tissue 9
lineages from the early mouse embryo. Proc Natl Acad Sci U S A. 107, 10783-10790. 10
11
Signoret, N., Rosenkilde, M.M., Klasse, P.J., Schwartz, T.W., Malim, M.H., Hoxie, J.A., Marsh, M. (1998). Differential 12
regulation of CXCR4 and CCR5 endocytosis. J Cell Sci. 111 ( Pt 18), 2819-2830. 13
14
Szklarczyk, D., Franceschini, A., Wyder, S., Forslund, K., Heller, D., Huerta-Cepas, J., Simonovic, M., Roth, A., Santos, 15
A., Tsafou, K.P. et al. (2015). STRING v10: protein-protein interaction networks, integrated over the tree of life. 16
Nucleic Acids Res. 43, D447-452. 17
18
19