Embed Size (px)
Citation preview

YULA BOYS - Mrs. Bellomo 2017-18 Required Summer Assignment AP Biology Dear Future Biologist, Welcome to AP Biology! I am looking forward to working with you next school year in AP Biology. Our pace will be quick; we have a great deal of material to consider. I hope that we will have time to be reflective and to appreciate the broad concepts of biology, the interconnections, and the relevance of biology in our everyday lives. This course will be demanding and requires a lot of time. Please consider carefully before committing to this course.
Please purchase the textbook ASAP! Campbell Biology ISBN: 9780321739759 EDITION: 9th AUTHORS: Jane B. Reece, Lisa A. Urry, Michael L. Cain, Steven A. Wasserman
You should also look into purchasing a AP Biology prep book. I recommend Cliffs AP Biology Fourth Edition or Princeton Review.
First day of boot camp: 1-Summer Assignment due 2-Exam Chapters 2-8 AND Surface Area/Volume Calculations You must score an 85% or better on the summer assignment AND 70% or better on the exam to remain in this course. No exceptions. No excuses. BE PREPARED.
-Homework-Safety/Equipment AND QUIZ on Haiku opens at 1:00pm-will close at 11:59 pm on the day of Boot Camp -PreLab Enzyme Catalysis
Second day of boot camp: Lab Enzyme Catalysis. Lab due first day of school.

Summer Preparation/Assignment Begin by reading Chapters 1-6, 8 Campbell Biology 9th edition. Any older edition does not correlate.
Follow the directions carefully for each assignment below. 1- LEARN and STUDY. This material will be on your first test during Boot Camp. Ch-1 Introduction: Themes in the Study of Life (not on test, but please read) Ch-2 The Chemical Context of Life Ch-3 Water and the Fitness of the Environment Ch-4 Carbon and the Molecular Diversity of Life Ch-5 The Structure and Function of Biological Molecules Ch-6 A Tour of the Cell Ch-7 Membrane Structure and Function Ch-8 An Introduction to Metabolism Surface area to volume calculations.
2- Math/Calculations for AP Bio
A. Complete Surface area to volume lab AND Cell size is limited by surface area worksheet.
For extra review: Surface area to volume ratio, use the animation to check your answers. http://www.shodor.org/interactivate/activities/SurfaceAreaAndVolume/
B. Complete Math and Statistics in AP Bio Worksheet
3- Chapter 6- Tour of the Cell. Review the parts of the animal and plant cells: http://www.wisc-online.com/Objects/ViewObject.aspx?ID=AP11403 http://learn.genetics.utah.edu/content/begin/cells/insideacell/
Create a visual representation: diagram with annotation explaining how four organelles work together to perform a specific function in a cell of your choice. Predict how a defect in the function of one of the organelles can affect the overall function of the cell. Make sure to also distinguish between prokaryotic and eukaryotic cells. You can create your own artistic drawing or use digital photos. Use 8.5” x 11” paper.
4- Chapter 7 - Membrane Structure and Function
A. Print Membrane worksheet and complete as directed.
5- Chapter 8-An Introduction to Metabolism
A- Complete Intro to Metabolism worksheet and complete as directed.
B- Complete Enzymes worksheet and complete questions 1-23 as directed.
6- AP Biology curriculum is designed to focus on depth and conceptual understanding of biological processes and to see the “Big Picture”.
The curriculum is focused on four “Big Ideas”. The Big Ideas: Big idea 1: The process of evolution drives the diversity and unity of life.
Big idea 2: Biological systems utilize free energy and molecular building blocks to grow, to reproduce and to maintain dynamic homeostasis.
Big idea 3: Living systems sort, retrieve, transmit and respond to information essential to life processes.
Big idea 4: Biological systems interact, and these systems and their interactions processes complex properties. Digital Scavenger Hunt Over the course of AP Biology we will learn and discuss many new terms. To get you familiar with these terms you will begin exploring our natural world and relate how these terms apply to your everyday life. Using your cell phone or digital camera take an original picture of something that represents one of the terms. Specifically describe how your image fits the definition of the term and the function or use of that item in nature and relate to one of the BIG IDEAS.
Pictures may not be taken by someone else, publication, or found on the internet. Each picture should include a small post-it with your name, term used, and date written on it. See below.
Choose 16 terms from the list below and use each picture only once. Choose 4 terms/pictures for each of the Big Ideas.
Present your terms as follows: Create a booklet. Print (in color) all your pictures. Below each picture include the term, definition, and its function or use in nature. Terms: amniotic egg keratin fermentation annelid meristem ethylene autotrophs monocot endosperm biological magnification dicot connective tissue carbohydrate mycorrhizae gravitropism nymph stage of larvae Cnidarian unicellular organism phototropism conifer taxis anther & filament Porifera radial symmetry auxin producing area of a plant rhizome bone bryophyte coelamate Phosphorous cycle cambium vascular tissue algae angiosperm cuticle pollinator arthropod leaf-gymnosperm protist basidiomycete parasite decay C 4 plant myosin niche cellulose echinoderm mycelium bacteria enzyme protein Batesian mimicry water cycle osmosis chitin animal with 2 chambered heart Chlorophyta animal with 3 chambered heart commensalism eukaryote epithelial tissue frond exoskeleton spore ovary gastropod genetically modified mollusk organism insect haploid chromosome number littoral zone organism K-strategist mutualism lichen pollen long-day plant r-strategist modified stem of a plant lipid Examples: If the vocabulary word is an internal part to an organism such as “tendon” you don’t have to dissect your little brother’s Achilles tendon and take a picture of it. A photo of his heel, and what the tendon does would suffice, but you must apply the term

to the specimen you find and briefly explain in your document how this specimen represents the term. Then relate to one of the 4 Big Ideas. If you choose the term “phloem,” you could submit a photograph you have taken of a plant leaf or a plant stem and then explain in your document what phloem is and specifically where phloem is in your specimen. Relate to one of the 4 Big Ideas.
Assignment modified from: http://rpsdhigh.sharpschool.net/common/pages/DisplayFile.aspx?itemId=1496317
Make sure you have completed all of the above assignments. Please read the directions carefully. If you have any questions during your learning or about the upcoming test, please email me: [email protected] or communicate via WhatsApp
Please read and sign below:
As a student enrolled in this class, I affirm the principle of academic integrity and commit to upholding integrity by completing all academic assignments myself. I will not participate, either directly or indirectly, in cheating or plagiarism; and I will actively discourage cheating or plagiarism by others throughout this course.
I have read through the summer assignment and understand the depth and time commitment to complete this assignment over the summer. I understand I must complete the summer assignment due on the first day of AP Biology class. I will rigorously prepare for the first exam given on the first day of class and know that if I do not score 70% or better, I will be removed from AP Biology.
________________________________ _____________________ Student Signature Date
________________________________ Printed name
Compile all worksheets and place in order in an appropriate binder or folder. Assignments should be ready before you come to class. You will not have time to assemble and organize your assignment in class. 15 point penalty will be given to assignments that are not ready. Those who have failed to complete entire summer assignment will be removed from this course.
Name, Date, Hr__________________________________________________________________________
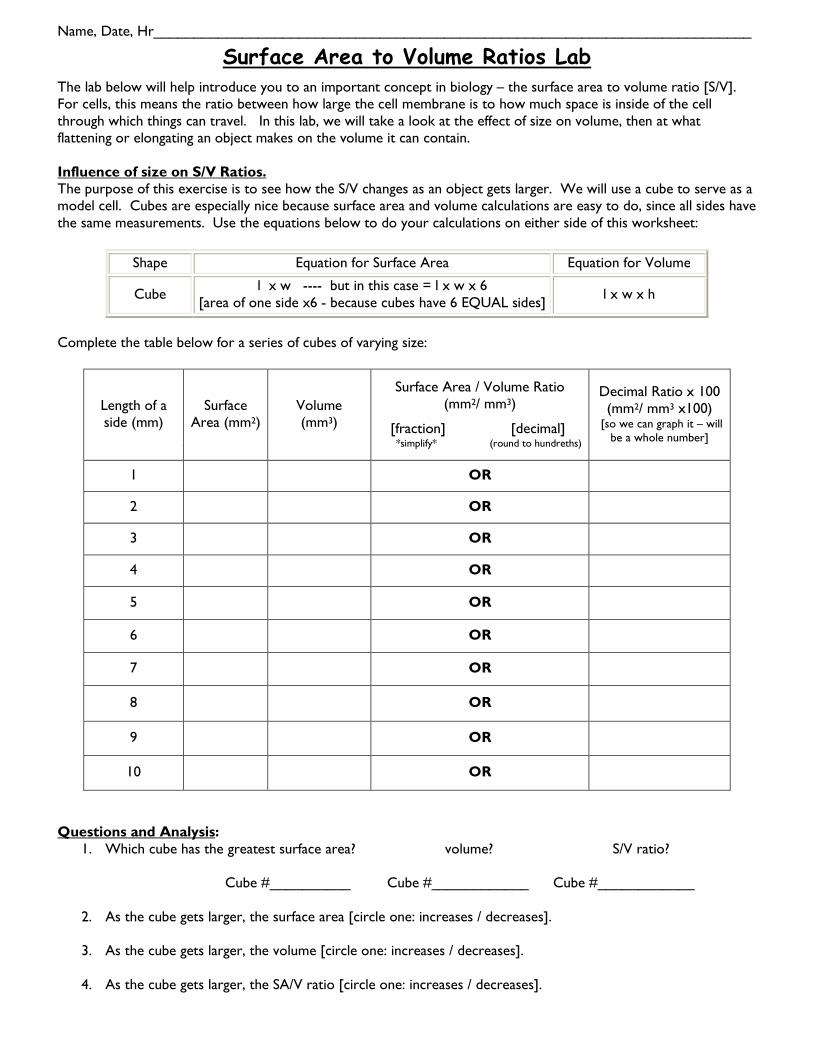
Surface Area to Volume Ratios Lab
The lab below will help introduce you to an important concept in biology – the surface area to volume ratio [S/V]. For cells, this means the ratio between how large the cell membrane is to how much space is inside of the cell through which things can travel. In this lab, we will take a look at the effect of size on volume, then at what flattening or elongating an object makes on the volume it can contain. Influence of size on S/V Ratios. The purpose of this exercise is to see how the S/V changes as an object gets larger. We will use a cube to serve as a model cell. Cubes are especially nice because surface area and volume calculations are easy to do, since all sides have the same measurements. Use the equations below to do your calculations on either side of this worksheet:
Shape Equation for Surface Area Equation for Volume
Cube l x w ---- but in this case = l x w x 6 [area of one side x6 - because cubes have 6 EQUAL sides] l x w x h
Complete the table below for a series of cubes of varying size:
Length of a side (mm)
Surface Area (mm2)
Volume (mm3)
Surface Area / Volume Ratio (mm2/ mm3)
[fraction] [decimal] *simplify* (round to hundreths)
Decimal Ratio x 100 (mm2/ mm3 x100)
[so we can graph it – will be a whole number]
1 OR
2 OR
3 OR
4 OR
5 OR
6 OR
7 OR
8 OR
9 OR
10 OR
Questions and Analysis:
1. Which cube has the greatest surface area? volume? S/V ratio? Cube #__________ Cube #____________ Cube #____________
2. As the cube gets larger, the surface area [circle one: increases / decreases]. 3. As the cube gets larger, the volume [circle one: increases / decreases].
4. As the cube gets larger, the SA/V ratio [circle one: increases / decreases].

On the graph below, plot the Volume, Surface Area, and the Surface area to Volume ratio [x100] against the length of the cube sides. You will be plotting all three values on ONE chart – below. Yes, your Y-scale will be very large. Color each line on your graph a different color and create a legend to the right. [make sure you have a SCALE, not just even spacing] Title: (Cube Volume), (Cube Surface Area), & (Surface Area to Volume Ratio x100) vs (Length of Cube Side)
[remember, these represent your IV and your DVs for this experiment…where do they belong on the graph??] Legend: Surface Area: Volume: S/V Ratio x100:
Influence of flattening on S/V Ratios. In this exercise we will explore how flattening an object impacts the surface to volume ratio. Picture a box that is 8 x 8 x 8 mm on a side. Then, imagine that we can flatten the box making it thinner and thinner – but in doing so, we still keep the original volume of the box [it can still hold the same amount]. What will happen to the surface area, and s/v ratio as the box is flattened? Complete the table below. SHOW ALL WORK on a separate sheet of paper. NW = NC
Box No.
Height (mm)
Length (mm)
Width (mm)
Surface area (mm2)
Volume (mm3)
S/V Ratio (mm2/mm3)
[round to hundredth]
1 8 8 8
2 4 16 8
3 2 16 16
4 1 32 16
5 0.5 32 32 Think about the following – write brief answers below.
1. Why do you think leaves are thin and flat? [hint: what does each leaf cell do…why would being thin help?]
2. Why do elephants have large, flat ears? [hint: what do their ears help them do other than hear?]
3. Why don’t desert plants have leaves? [hint: what substances do leaves lose through their leaves?]

Cell Size is Limited by Surface Area- Worksheet 2 To maintain homeostasis, cells must have enough surface area to exchange materials. However, as cells grow the surface area to volume ratio changes. As a result, there is a limit to cell growth because if a cell becomes too large there is not enough surface area for the exchange of materials and homeostasis cannot be maintained. When a cell reaches a critical surface area to volume ratio, it stops growing or is signaled to divide. To establish the relationship between surface area and volume use the AP Formula sheet (shown below) to calculate the surface area and volume of the cubes. Then, divide the surface area by the volume to get the surface area to volume ratio (SA/V ratio). Finally, graph the length of side (cm) vs. the surface area to volume ratios. Note that the surface area to volume ratio does not have a unit since surface area is measured in cm3 and volume is measured in mL (same as cm3). Surface Area and Volume – AP Formula Sheet
Symbols r = radius l = length h = height w = width A = surface area V = volume Σ = Sum of all a = surface area of one side of the cube
Volume of a Sphere V = 4/3 π r3 Volume of a Cube (or Square Column) V = l w h Volume of a Column V = π r2 h
Surface Area of a Sphere A = 4 π r2 Surface Area of a Cube A = 6 a Surface Area of a Rectangular Solid A = Σ (surface area of each side)
Cube 1 l = 1cm
w = 1 cm h = 1 cm
Cube 2 l = 2 cm w = 2 cm h = 2 cm
Cube 3 l = 3 cm w = 3 cm h = 3 cm

Data Analysis
Conclusion What is the relationship between size and surface area of a cube?
Cube 4 l = 4 cm w = 4 cm h = 4 cm
Cube 5 l = 5 cm w = 5 cm h = 5 cm
Cube 6 l = 6 cm w = 6 cm h = 6 cm
Length of Cube Side
(cm)
SA/V Ratio of Cube
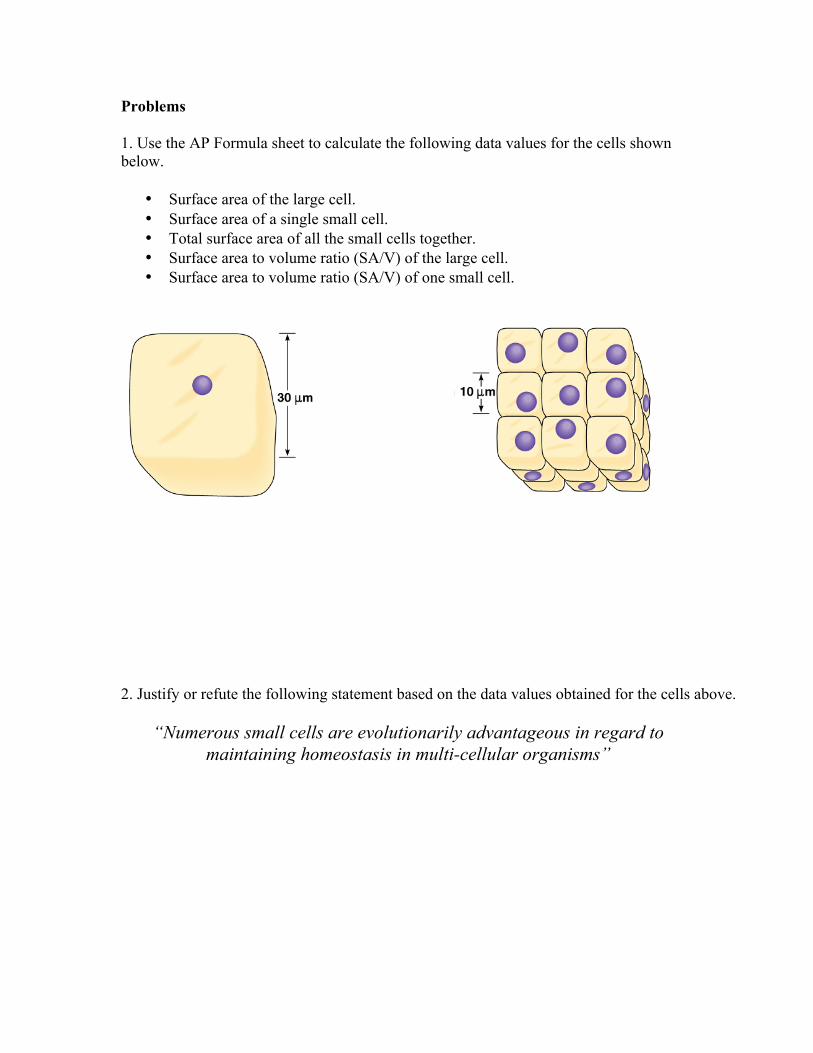
Problems 1. Use the AP Formula sheet to calculate the following data values for the cells shown below.
• Surface area of the large cell. • Surface area of a single small cell. • Total surface area of all the small cells together. • Surface area to volume ratio (SA/V) of the large cell. • Surface area to volume ratio (SA/V) of one small cell.
2. Justify or refute the following statement based on the data values obtained for the cells above.
“Numerous small cells are evolutionarily advantageous in regard to maintaining homeostasis in multi-cellular organisms”
3.
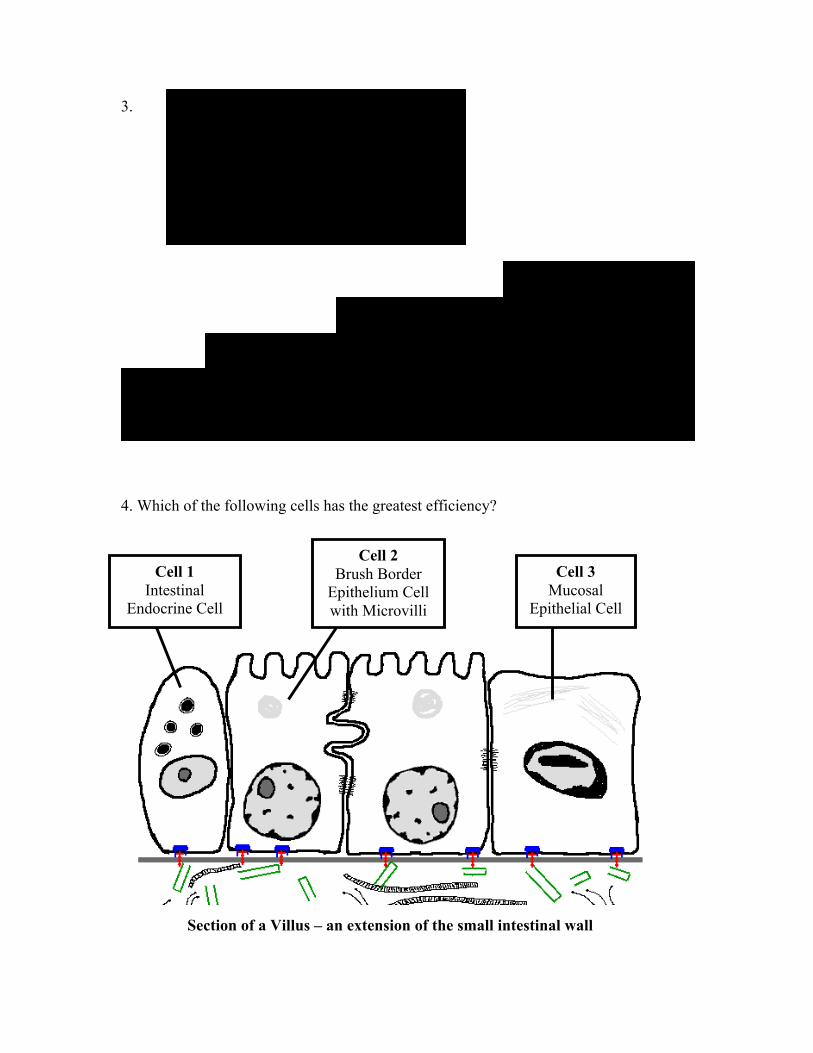
4. Which of the following cells has the greatest efficiency?
Cell 1 Intestinal
Endocrine Cell
Cell 2 Brush Border
Epithelium Cell with Microvilli
Cell 3 Mucosal
Epithelial Cell
Section of a Villus – an extension of the small intestinal wall
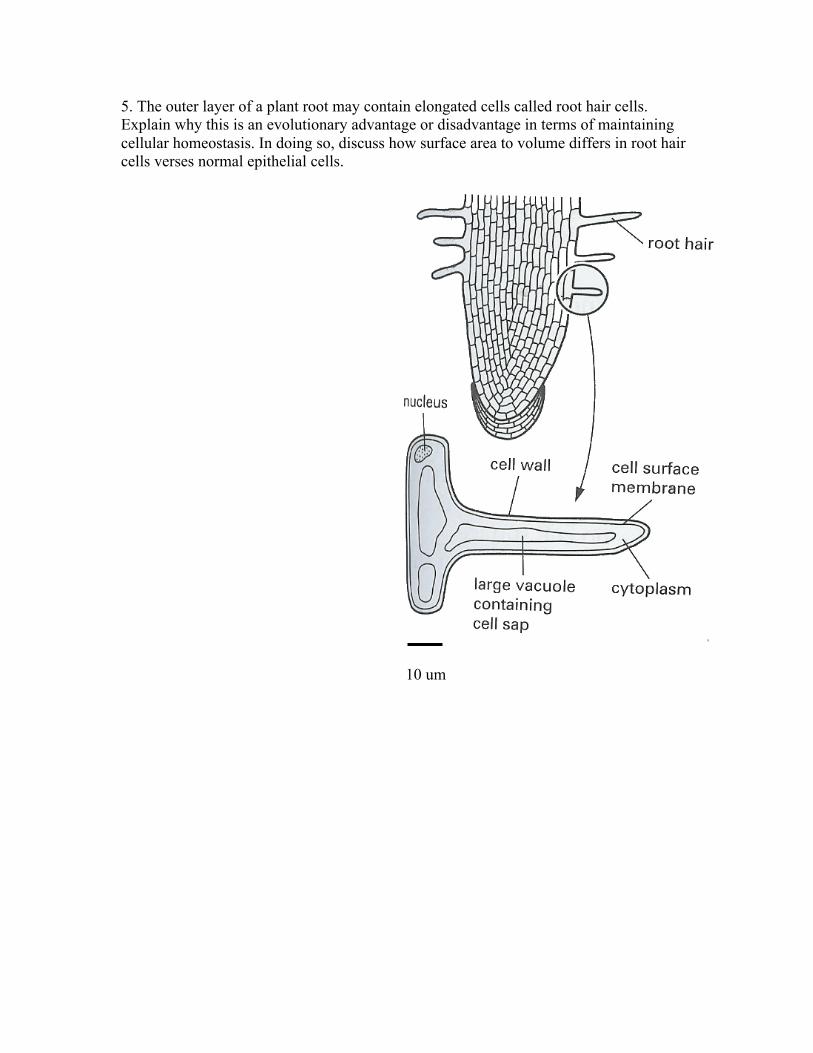
5. The outer layer of a plant root may contain elongated cells called root hair cells. Explain why this is an evolutionary advantage or disadvantage in terms of maintaining cellular homeostasis. In doing so, discuss how surface area to volume differs in root hair cells verses normal epithelial cells.
10 um

Math and Statistics for AP Biology
The website Bozeman Science (http://www.bozemanscience.com/ap-biology) has videos that may be useful to you if you are struggling with some of these concepts. Khan Academy (http://www.khanacademy.org/science/biology) is also a useful resource.
Answer the following questions. Answer directly on this document- handwritten please. 1. Suppose you are designing an experiment to test the effects of nicotine on the heart rate of rats. What are the disadvantages of having too small a sample size (i.e., testing on too few rats)? What are the disadvantages of having too large a sample size (i.e., testing on too many rats)?
2. Explain the difference between discrete variables and continuous variables. Give an example of each.
3. Explain the difference between quantitative and categorical variables. Give an example of each.
4. What is a null hypothesis?
5. What are some steps that scientists can take in designing an experiment to avoid false negatives?

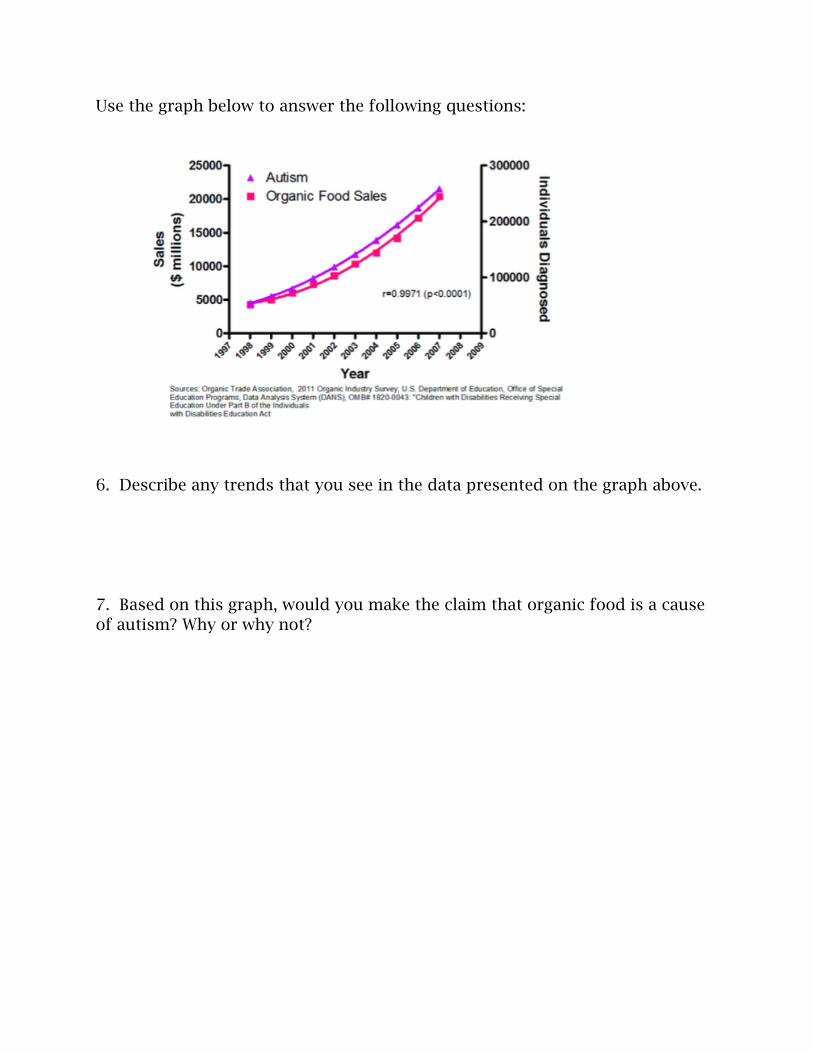
Use the graph below to answer the following questions:
6. Describe any trends that you see in the data presented on the graph above.
7. Based on this graph, would you make the claim that organic food is a cause of autism? Why or why not?
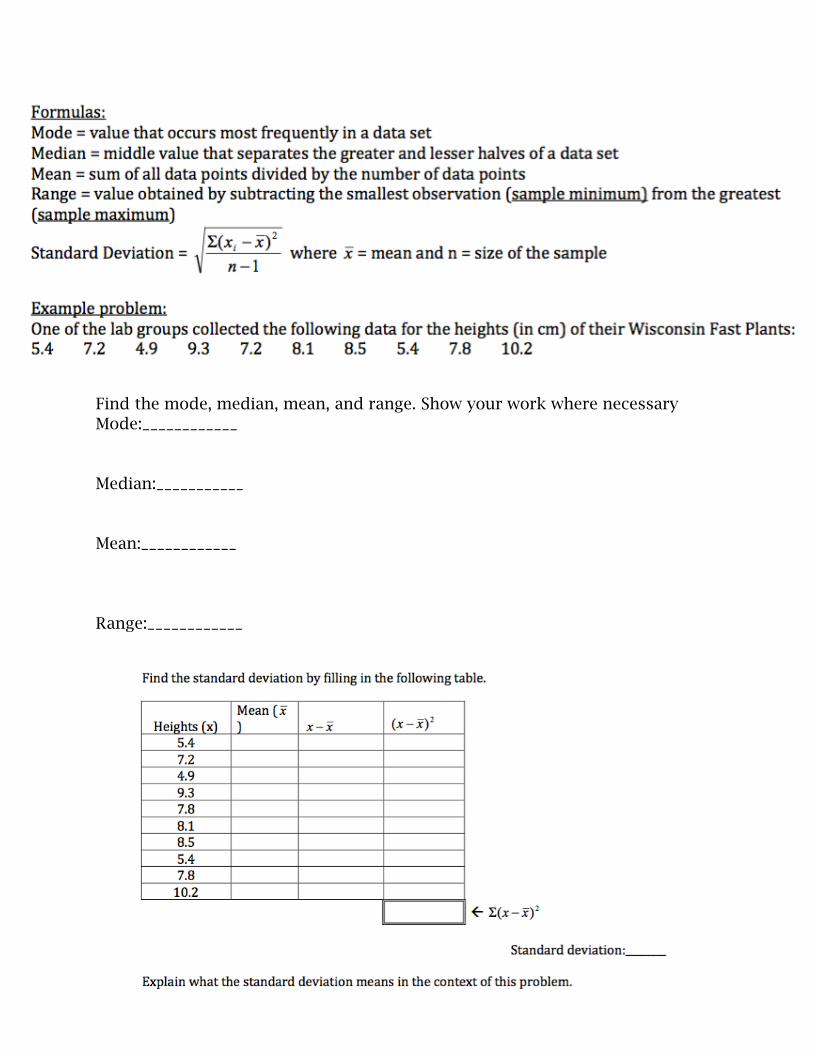
Find the mode, median, mean, and range. Show your work where necessary Mode:____________
Median:___________
Mean:____________
Range:____________

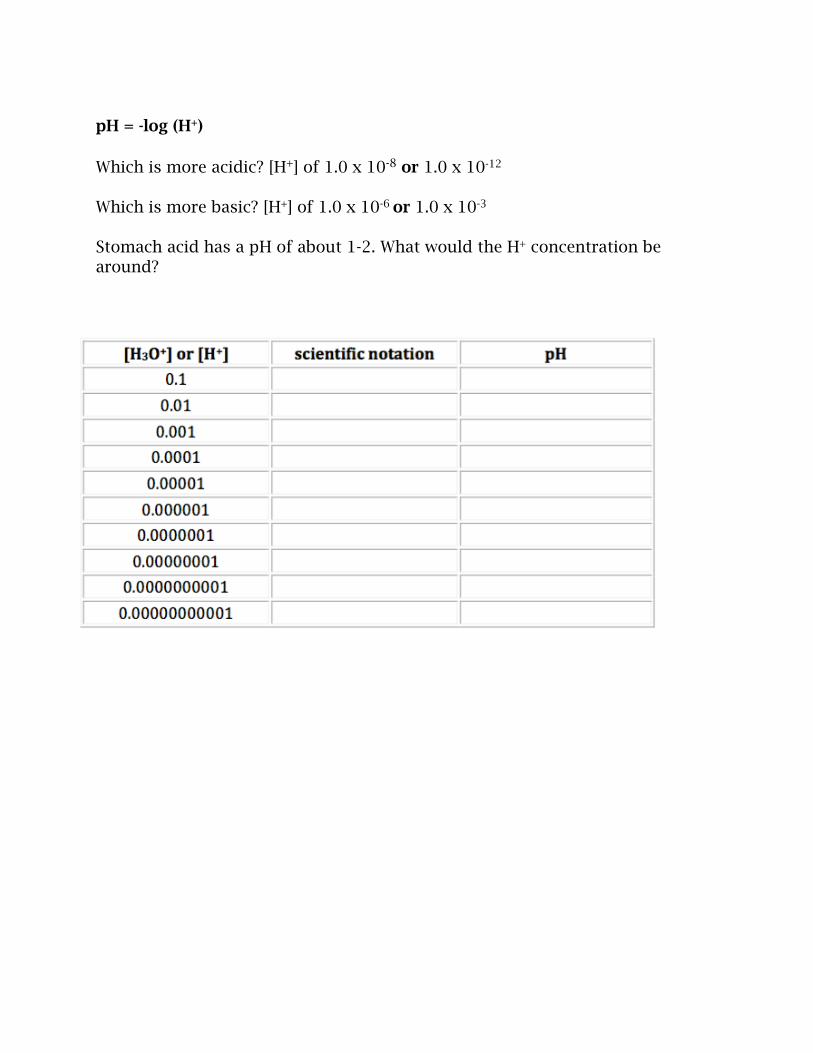
pH = -log (H+)
Which is more acidic? [H+] of 1.0 x 10⁻⁸ or 1.0 x 10⁻¹²
Which is more basic? [H+] of 1.0 x 10⁻⁶ or 1.0 x 10⁻³
Stomach acid has a pH of about 1-2. What would the H+ concentration be around?

Math and Statistics for AP Biology
The website Bozeman Science (http://www.bozemanscience.com/ap-biology) has videos that may be useful to you if you are struggling with some of these concepts. Khan Academy (http://www.khanacademy.org/science/biology) is also a useful resource.
Answer the following questions. Answer directly on this document- handwritten please. 1. Suppose you are designing an experiment to test the effects of nicotine on the heart rate of rats. What are the disadvantages of having too small a sample size (i.e., testing on too few rats)? What are the disadvantages of having too large a sample size (i.e., testing on too many rats)?
2. Explain the difference between discrete variables and continuous variables. Give an example of each.
3. Explain the difference between quantitative and categorical variables. Give an example of each.
4. What is a null hypothesis?
5. What are some steps that scientists can take in designing an experiment to avoid false negatives?
Use the graph below to answer the following questions:
6. Describe any trends that you see in the data presented on the graph above.
7. Based on this graph, would you make the claim that organic food is a cause of autism? Why or why not?

Find the mode, median, mean, and range. Show your work where necessary Mode:____________
Median:___________
Mean:____________
Range:____________
pH = -log (H+)
Which is more acidic? [H+] of 1.0 x 10⁻⁸ or 1.0 x 10⁻¹²
Which is more basic? [H+] of 1.0 x 10⁻⁶ or 1.0 x 10⁻³
Stomach acid has a pH of about 1-2. What would the H+ concentration be around?

Chapter-8 Introduction to Metabolism
Answer questions directly on this worksheet. Handwritten responses only.
1. Distinguish between anabolic and catabolic.
2. Know the first and second laws of thermodynamics. Which law contributes to the degree of disorder in the universe?
3. What is ∆G? When ∆G is negative, what does that mean?
4. What kinds of reactions are exergonic? What kinds are endergonic? Give examples of each.
5. How does ATP provide energy to endergonic reactions?
6. What is an enzyme? How does it work? What does induced-fit refer to?
7. What are environmental conditions that affect enzyme activity?
8. Understand and explain figure 8.19,8.20, and 8.22

Enzymes and Cellular Regulation 1
Enzymes and Cellular RegulationWhat are the factors that regulate the rate at which enzymes catalyze reactions?
Why?Digestive enzymes are protein-based biological catalysts that play important roles in our lives. They help remove stains from our shirts, turn milk into cheese, and are responsible for turning our dinner into use-able fuel for our bodies. Enzymes however do not work well universally. Some are meant to work at high temperatures, others at low temperatures. They may work best in acidic conditions or neutral conditions. In this activity we will look at the optimal conditions for two different enzymes. The digestive enzyme lipase is made in the pancreas and breaks down lipids in the small intestine, while pepsin breaks down proteins in the stomach.
Model 1 – Two Digestive Enzymes lipaseTriglycerides ⎯⎯→ glycerol + fatty acids
pepsinLarge polypeptides ⎯⎯→ smaller polypeptides + amino acids
Effect of pH on Enzyme Activity
pH0 2 4 6 8 10 12 14
Pepsin (stomach)
Rat
e of
rea
ctio
n
Lipase
1. Name the two enzymes illustrated in Model 1.
2. Consider the information provided in the Why? box and in Model 1 about these proteins.
a. In which body organ is pepsin active?
b. In which body organ is pancreatic lipase active?

2 POGIL™ Activities for AP* Biology
3. For each enzyme in Model 1, circle the pH that best represents the environment in which the enzyme is most active.
Pepsin 1.5 8 10.4
Lipase 1.5 8 10.4
4. Compare the rate of the pepsin-catalyzed reaction at pH 1.5 with the rate of the lipase-catalyzed reaction at pH 1.5.
5. Compare the rate of the pepsin-catalyzed reaction at pH 8 with the rate of the lipase-catalyzed reaction at pH 8.
6. Using your knowledge of protein structure, explain in detail the effect of exposing an enzyme to a pH outside of its optimal range. Include the effect on both enzyme structure and function.
7. At what pH values is lipase likely to be denatured? Justify your answer.
8. At what pH values is pepsin likely to be denatured? Justify your answer.
9. In addition to being produced in the pancreas, lipase is also produced in the stomach. Is the structure of pancreatic lipase the same as gastric (produced in the stomach) lipase? Justify your reasoning.
10. Add a line to the graph in Model 1 that shows a prediction for gastric lipase activity.
11. Antacids work by neutralizing acids, bringing the pH of the stomach to a range of 6–7. What is the effect of taking an antacid on a person’s ability to digest proteins?
Enzymes and Cellular Regulation 3
Model 2 – Amylase Rate of Reaction
Temperature, °CEnzyme concentration
(Substrate concentration always in excess)
Rat
e of
rea
ctio
n
Rat
e of
rea
ctio
n
Substrate concentration(Enzyme concentration constant)
Rat
e of
rea
ctio
n
0 20 40 60 80 100
AB
C
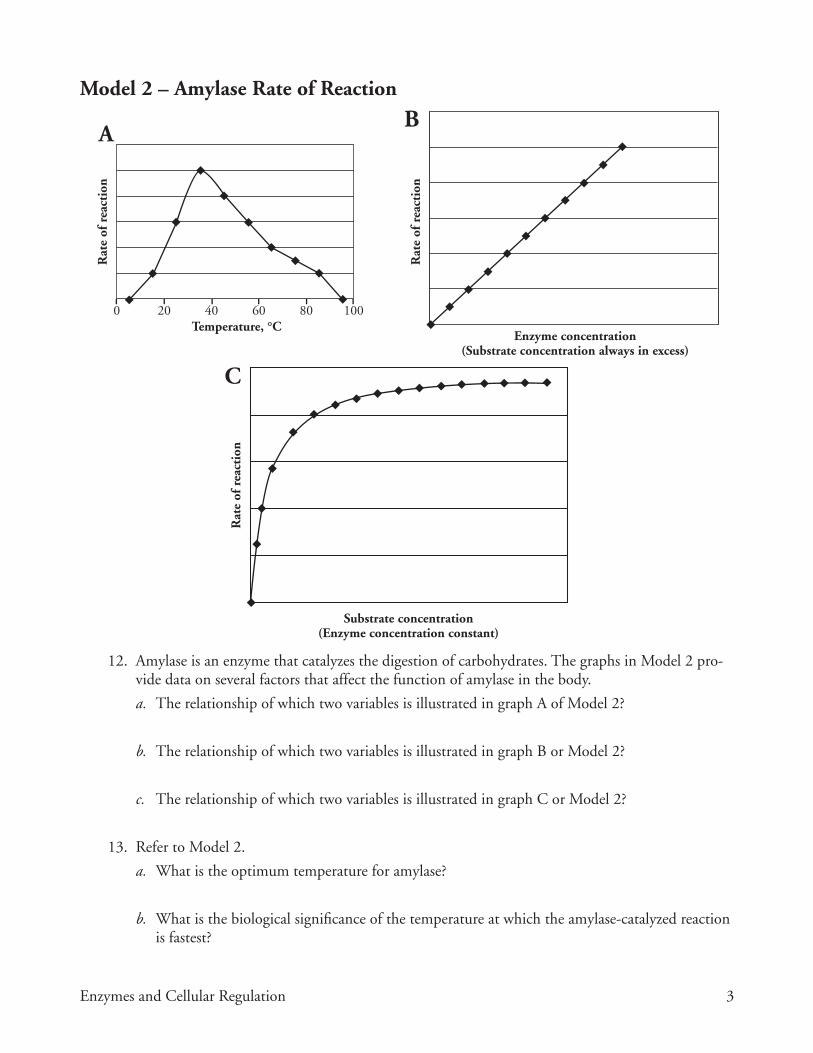
12. Amylase is an enzyme that catalyzes the digestion of carbohydrates. The graphs in Model 2 pro-vide data on several factors that affect the function of amylase in the body.
a. The relationship of which two variables is illustrated in graph A of Model 2?
b. The relationship of which two variables is illustrated in graph B or Model 2?
c. The relationship of which two variables is illustrated in graph C or Model 2?
13. Refer to Model 2.
a. What is the optimum temperature for amylase?
b. What is the biological significance of the temperature at which the amylase-catalyzed reaction is fastest?
4 POGIL™ Activities for AP* Biology
14. Predict what causes a decrease in enzyme activity at temperatures above 37 °C.
15. A young child runs a fever of 40 °C for 24 hours. Explain what effect this may have on his digestion.
16. Consider the data in graph B of Model 2.
a. Describe the relationship between enzyme concentration and reaction rate.
b. Propose an explanation for this relationship.
17. Consider the data in graph C of Model 2.
a. What is the relationship between substrate concentration and the reaction rate?
b. Propose an explanation for why a maximum reaction rate is reached in graph C.
18. As a group, develop an analogy for the function of an enzyme that will explain the concentration graphs in Model 2 (graphs B and C).
19. Would the reaction rate on graph B of Model 2 ever reach a maximum level? Justify your answer.

Enzymes and Cellular Regulation 5
Extension Questions20. Thermophilic bacteria, such as Thermus aquaticus, live in hot springs where the temperature is
greater then 70 °C. Draw a graph similar to graph A in Model 2 representing the optimal tem-perature of T. aquaticus.
21. DNA polymerase from T. aquaticus (Taq) is used in PCR (polymerase chain reaction). PCR is a technique where millions of copies of DNA can be made from one original copy. In this method, the target DNA molecule is subjected to temperatures over 95 °C to make the double-stranded DNA separate. The temperature is then lowered slightly to allow primers to anneal before the Taq polymerase catalyzes the reactions to incorporate new nucleotides into the complementary strands. The cycle is then repeated over and over until there are millions of copies of the target DNA.
a. Predict why this bacterial polymerase is used instead of a human polymerase.
b. What would happen if you used a human polymerase in a series of PCR reactions?
Read This!The rate of an enzyme-catalyzed reaction can also be affected by the presence of other molecules that can bind to the enzyme, changing its shape. In some reactions a coenzyme is necessary. This molecule binds to the protein strands of the enzyme, changing its shape so that is ready to receive the substrate molecule. Without the coenzyme, the enzyme would not be able to attach to the substrate. Other molecules can reduce the rate of reaction for enzymes by binding to the protein and either blocking the spot where the substrate will bind or by making the enzyme’s shape incompatible with the substrate. These molecules are called inhibitors.
22. Sketch a graph that shows the relationship between the rate of an enzyme reaction and the concentration of coenzyme necessary for the enzyme to function properly.
23. Add a line to graph C of Model 2 that shows the rate of an enzyme reaction in the presence of inhibitor molecules.