Embed Size (px)
Citation preview

LOS ANGELES COUNTY SHERIFF'S DEPARTMENT PATROL STATION PART I CRIME SUMMARY
31,078PART I CRIMES 72,926 68,494 26,088 29,320103.9 101.23 89.99 -13.39% -11.10%
Ver: 10.01.17.2014.0
06/06/2014 01:47 pm
1Page
YTD 05/31/2014 - PART I CRIME RATE PER 10,000 POPULATION - PRELIMINARY DATA
Per the FBI UCR Guidelines Homicide, Rape and Aggravated Assault are counted by victim. All other crimes are counted by incident, except Arson which is always counted.2009 Population Source: LA County Internal Services Department (based on the 2000 US Census and CA Department of Finance estimates).2013 Population Source: LA County Internal Services Department (based on the 2010 US Census and CA Department of Finance estimates). 2014 YTD Crime Rates based on 2013 population estimates.2013 population estimates updated for the city of Santa Clarita and the Santa Clarita Valley Station unincorporated area, due to 2012 year end annexations.Crime counts for patrol station areas only; red depicts +30% increases and green depicts -30% decreases. N/C = Not Calculable
This PRELIMINARY INFORMATION is used on an ongoing basis by the LASD for strategic planning and as a tactical early warning system. This data is not final and thus is not the crime data that is reported to the FBI Uniform Crime Index (UCI). This is because some of the most recent reports have not been written yet, nor reviewed by investigators. Once it is reported by investigators and supervisors, the crime data is reported to the FBI/UCI and is available via the pertinent LASD patrol station, pending publication by the FBI/UCI. Once it is reported by the LASD to the FBI, the FBI/UCI crime data is considered the most accurate.
DEPARTMENT YTDReportedIncidents
YTDCrimeRate
TotalReportedIncidents
YTDReported Incidents
YTDCrimeRate
TotalReportedIncidents
YTDReportedIncidents
YTDCrimeRate
5 YearChange inYTD Crime
Rate
1 YearChange inYTD Crime
Rate
2009 2013 2014
VIOLENT CRIMES
PROPERTY CRIMES
CRIMINAL HOMICIDE
FORCIBLE RAPE
ROBBERY
AGGRAVATED ASSAULT
BURGLARY
LARCENY THEFT
GRAND THEFT AUTO
ARSON
85
243
2,132
3,768
6,034
13,206
5,275
335
207
572
5,105
8,824
14,193
31,434
11,885
706
67
211
1,594
3,071
6,225
13,514
4,474
164
164
478
3,858
7,374
14,330
31,323
10,552
415
62
187
1,403
2,955
5,108
12,321
3,852
200
6,228
24,850
14,708
58,218
4,943
24,377
11,874
56,620
4,607
21,481
.28
.81
7.13
12.6
20.17
44.15
17.64
1.12
.23
.73
5.5
10.6
21.49
46.66
15.45
.57
.21
.65
4.84
10.19
17.62
42.5
13.29
.69
20.82
83.08
17.07
84.16
15.89
74.1
-25.00%
-19.75%
-32.12%
-19.13%
-12.64%
-3.74%
-24.66%
-38.39%
-8.70%
-10.96%
-12.00%
-3.87%
-18.01%
-8.92%
-13.98%
21.05%
-23.68%
-10.81%
-6.91%
-11.95%
2014/2009 2014/201320132009
LOS ANGELES COUNTY SHERIFF'S DEPARTMENT
06/06/2014 01:47 pm
STATION, CITY AND UNINCORPORATED AREA PART I CRIME SUMMARY
Ver: 10.02.19.2013.0
YTD 05/31/2014 - PART I CRIME RATE PER 10,000 POPULATION
1Page
- PRELIMINARY DATA
Per the FBI UCR Guidelines Homicide, Rape and Aggravated Assault are counted by victim. All other crimes are counted by incident, except Arson which is always counted.2009 Population Source: LA County Internal Services Department (based on the 2000 US Census and CA Department of Finance estimates).2013 Population Source: LA County Internal Services Department (based on the 2010 US Census and CA Department of Finance estimates). 2014 YTD Crime Rates based on 2013 population estimates. 2013 population estimates updated for the city of Santa Clarita and the Santa Clarita Valley Station unincorporated area, due to 2012 year end annexations.Crime counts for patrol station areas only; red depicts +30% increases and green depicts -30% decreases. N/C = Not Calculable
This PRELIMINARY INFORMATION is used on an ongoing basis by the LASD for strategic planning and as a tactical early warning system. This data is not final and thus is not the crime data that is reported to the FBI Uniform Crime Index (UCI). This is because some of the most recent reports have not been written yet, nor reviewed by investigators. Once it is reported by investigators and supervisors, the crime data is reported to the FBI/UCI and is available via the pertinent LASD patrol station, pending publication by the FBI/UCI. Once it is reported by the LASD to the FBI, the FBI/UCI crime data is considered the most accurate.
UNINCORPORATED
LA CANADA FLINTRIDGEUNINCORPORATED
LANCASTERUNINCORPORATED
AGOURA HILLSCALABASASHIDDEN HILLSMALIBUWESTLAKE VILLAGEUNINCORPORATED
PALMDALEUNINCORPORATED
SANTA CLARITAUNINCORPORATED
BRADBURYDUARTE
355
169 135
1,900 311
136 122
6 105 58
120
1,851 343
1,268 572
1 248
882
417 394
4,477 657
341 308 21
309 145 282
4,356 733
3,109 1,345
10 552
322
131 161
1,810 191
173 120
4 171 67
102
1,738 275
1,368 353
4 164
722
312 283
4,397 510
330 336
9 379 161 257
4,210 602
3,172 879
17 412
282
126 64
1,770 241
97 99 4
146 74 80
1,576 225
1,069 343
5 145
78.56
79.6265.99
135.8999.89
58.4951.7229.4176.7565.4155.05
129.21114.98
75.1278.04
10.66107.14
73.01
64.775.96
115.5660.92
85.152.0421.55
135.2381.0244.33
113.7862.43
77.5938.21
38.1776.92
63.94
62.2330.2
11376.87
47.7142.9421.55
115.4689.4834.77
103.1851.08
52.2751.41
47.7168.01
-18.6%
-21.8%-54.2%
-16.8%-23.1%
-18.4%-17.0%-26.7% 50.4% 36.8%-36.8%
-20.2%-55.6%
-30.4%-34.1%
347.6%-36.5%
-12.4%
-3.8%-60.2%
-2.2% 26.2%
-43.9%-17.5% 0.0%
-14.6% 10.4%-21.6%
-9.3%-18.2%
-32.6% 34.6%
25.0%-11.6%
ALTADENA
CRESCENTA VALLEY
LANCASTER
MALIBU/LOST HILLS
PALMDALE
SANTA CLARITA VALLEY
TEMPLE
YTDReportedIncidents
YTDCrime Rate
TotalReportedIncidents
YTDReportedIncidents
YTDCrime Rate
TotalReportedIncidents
YTDReportedIncidents
YTDCrime Rate
5 YearChange inYTD Crime
Rate
1 YearChange inYTD Crime
Rate
2009 2013 2014
2014/2009 2014/2013
STATION TOTAL
STATION TOTAL
STATION TOTAL
STATION TOTAL
STATION TOTAL
STATION TOTAL
355
304
2211
547
2194
1840
882
811
5134
1406
5089
4454
322
292
2001
637
2013
1721
722
595
4907
1472
4812
4051
282
190
2011
500
1801
1412
78.56
72.93
129.34
58.68
126.75
76.00
73.01
70.46
106.44
71.44
102.29
64.05
63.94
45.85
106.98
56.07
91.51
52.06
-18.61
-37.13
-17.29
-4.45
-27.8
-31.5
-12.42%
-34.93%
0.51%
-21.51%
-10.54%
-18.72%
PART I CRIMES
2009 2013

LOS ANGELES COUNTY SHERIFF'S DEPARTMENT
06/06/2014 01:47 pm
STATION, CITY AND UNINCORPORATED AREA PART I CRIME SUMMARY
Ver: 10.02.19.2013.0
YTD 05/31/2014 - PART I CRIME RATE PER 10,000 POPULATION
2Page
- PRELIMINARY DATA
Per the FBI UCR Guidelines Homicide, Rape and Aggravated Assault are counted by victim. All other crimes are counted by incident, except Arson which is always counted.2009 Population Source: LA County Internal Services Department (based on the 2000 US Census and CA Department of Finance estimates).2013 Population Source: LA County Internal Services Department (based on the 2010 US Census and CA Department of Finance estimates). 2014 YTD Crime Rates based on 2013 population estimates. 2013 population estimates updated for the city of Santa Clarita and the Santa Clarita Valley Station unincorporated area, due to 2012 year end annexations.Crime counts for patrol station areas only; red depicts +30% increases and green depicts -30% decreases. N/C = Not Calculable
This PRELIMINARY INFORMATION is used on an ongoing basis by the LASD for strategic planning and as a tactical early warning system. This data is not final and thus is not the crime data that is reported to the FBI Uniform Crime Index (UCI). This is because some of the most recent reports have not been written yet, nor reviewed by investigators. Once it is reported by investigators and supervisors, the crime data is reported to the FBI/UCI and is available via the pertinent LASD patrol station, pending publication by the FBI/UCI. Once it is reported by the LASD to the FBI, the FBI/UCI crime data is considered the most accurate.
ROSEMEADSOUTH EL MONTETEMPLE CITYUNINCORPORATED
AVALONUNINCORPORATED
CARSONUNINCORPORATED
LYNWOODUNINCORPORATED
COMPTONUNINCORPORATED
LOMITARANCHO PALOS VERDESROLLING HILLSROLLING HILLS ESTATESUNINCORPORATED
614 334 227 394
40 3
1,118 445
839 1,565
1,963 371
213 211
7 80 45
1,305 765 478 856
114 9
2,835 1,061
2,047 3,734
4,545 840
487 429 11
173 88
496 150 198 323
17 1
1,162 344
843 1,572
1,619 290
227 264
4 47 36
1,228 535 533 882
102 8
2,651 801
1,995 3,601
3,892 804
493 621 11
122 86
572 337 212 355
31 2
990 316
832 1,307
1,534 332
186 173
9 52 18
107.13149.6363.9764.2
114.6851.28
113.97197.64
114.66117.1
196.97152.69
101.1249.2435.6699.47
114.21
92.2674.5755.6855.9
45.627.17
126.7141.58
120.82133.53
167.85132
112.0763.4
21.5158.26
115.57
106.39167.5359.6261.44
83.1554.35
107.94130.06
119.25111.02
159.04151.12
91.8241.5448.3964.4657.78
-0.7% 12.0%-6.8%-4.3%
-27.5% 6.0%
-5.3%-34.2%
4.0%-5.2%
-19.3%-1.0%
-9.2%-15.6% 35.7%-35.2%-49.4%
15.3% 124.7% 7.1% 9.9%
82.4% 100.0%
-14.8%-8.1%
-1.3%-16.9%
-5.3% 14.5%
-18.1%-34.5%
125.0% 10.6%-50.0%
TEMPLE
AVALON
CARSON
CENTURY
COMPTON
LOMITA
YTDReportedIncidents
YTDCrime Rate
TotalReportedIncidents
YTDReportedIncidents
YTDCrime Rate
TotalReportedIncidents
YTDReportedIncidents
YTDCrime Rate
5 YearChange inYTD Crime
Rate
1 YearChange inYTD Crime
Rate
2009 2013 2014
2014/2009 2014/2013
STATION TOTAL
STATION TOTAL
STATION TOTAL
STATION TOTAL
STATION TOTAL
STATION TOTAL
1818
43
1563
2404
2334
556
3966
123
3896
5781
5385
1188
1335
18
1506
2415
1909
578
3607
110
3452
5596
4696
1333
1626
33
1306
2139
1866
438
90.64
105.57
129.59
116.24
188.29
71.41
70.41
43.95
129.82
128.8
161.2
77.13
85.76
80.57
112.58
114.08
157.57
58.45
-5.38
-23.68
-13.13
-1.86
-16.32
-18.15
21.80%
83.32%
-13.28%
-11.43%
-2.25%
-24.22%
PART I CRIMES
2009 2013
LOS ANGELES COUNTY SHERIFF'S DEPARTMENT
06/06/2014 01:47 pm
STATION, CITY AND UNINCORPORATED AREA PART I CRIME SUMMARY
Ver: 10.02.19.2013.0
YTD 05/31/2014 - PART I CRIME RATE PER 10,000 POPULATION
3Page
- PRELIMINARY DATA
Per the FBI UCR Guidelines Homicide, Rape and Aggravated Assault are counted by victim. All other crimes are counted by incident, except Arson which is always counted.2009 Population Source: LA County Internal Services Department (based on the 2000 US Census and CA Department of Finance estimates).2013 Population Source: LA County Internal Services Department (based on the 2010 US Census and CA Department of Finance estimates). 2014 YTD Crime Rates based on 2013 population estimates. 2013 population estimates updated for the city of Santa Clarita and the Santa Clarita Valley Station unincorporated area, due to 2012 year end annexations.Crime counts for patrol station areas only; red depicts +30% increases and green depicts -30% decreases. N/C = Not Calculable
This PRELIMINARY INFORMATION is used on an ongoing basis by the LASD for strategic planning and as a tactical early warning system. This data is not final and thus is not the crime data that is reported to the FBI Uniform Crime Index (UCI). This is because some of the most recent reports have not been written yet, nor reviewed by investigators. Once it is reported by investigators and supervisors, the crime data is reported to the FBI/UCI and is available via the pertinent LASD patrol station, pending publication by the FBI/UCI. Once it is reported by the LASD to the FBI, the FBI/UCI crime data is considered the most accurate.
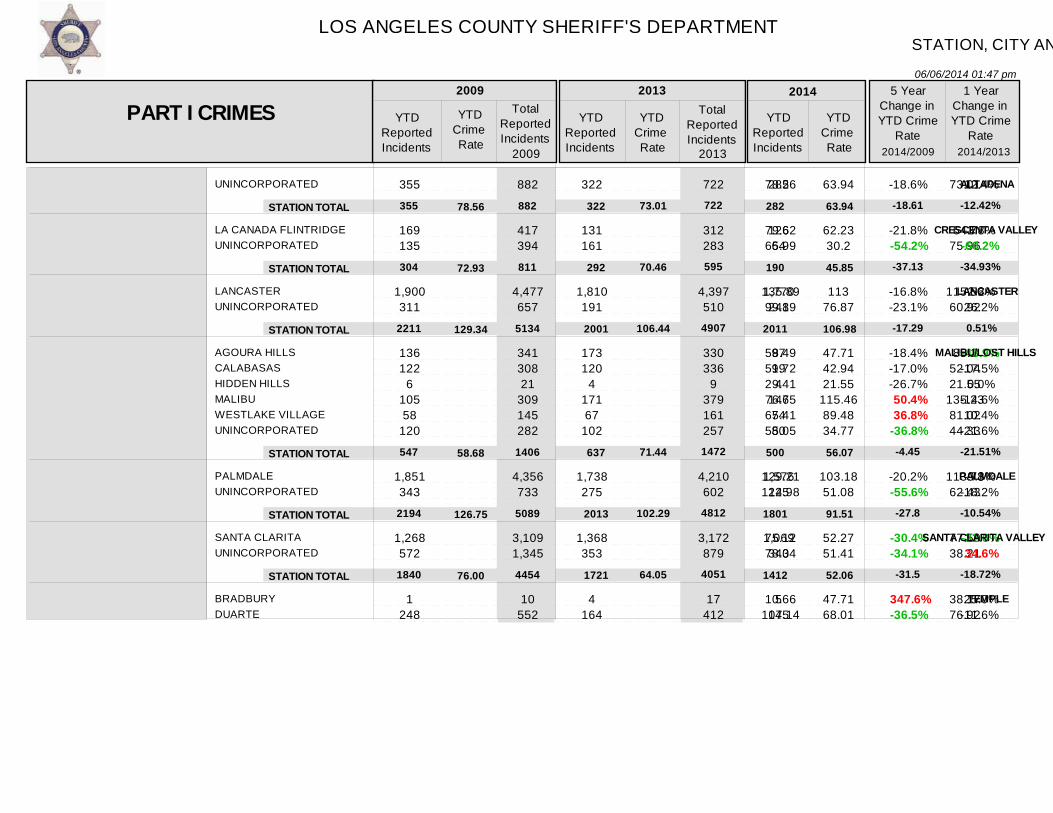
UNINCORPORATED
LAWNDALEUNINCORPORATED
WEST HOLLYWOODUNINCORPORATED
CERRITOSUNINCORPORATED
COMMERCECUDAHYMAYWOODUNINCORPORATED
INDUSTRYLA HABRA HEIGHTSLA PUENTEUNINCORPORATED
ARTESIABELLFLOWER
404
295 1,082
802 47
810 0
432 0 0
1,323
553 32
373 1,003
130 1,022
1,049
655 2,455
1,872 136
1,832 0
1,070 0 0
3,278
1,480 68
794 2,219
329 2,347
446
246 1,003
744 68
827 0
433 215 186
1,167
505 16
276 815
168 906
1,023
585 2,358
1,650 158
1,899
976 433 433
2,618
1,082 59
640 1,847
377 2,094
394
226 1,000
671 72
676 0
417 153 133
1,025
428 13
232 699
158 735
160.3
88.37113.83
214.37727.55
147.610
321.2900
91.46
8667.7152.5886.4
67.67
73.29132.67
167.08
75.07118.76
216.29961.81
168.630
337.6790.3267.9
92.26
23059.430.0569.3259.74
101.68118.25
147.6
68.97118.41
195.061018.39
137.840
325.264.2748.5581.03
19543.3824.4158.2751.23
95.6395.93
-7.9%
-22.0% 4.0%
-9.0% 40.0%
-6.6% 0.0%
1.2% 0.0% 0.0%
-11.4%
125.5%-53.6%-32.6%-24.3%
30.5%-27.7%
-11.7%
-8.1%-0.3%
-9.8% 5.9%
-18.3% 0.0%
-3.7%-28.8%-28.5%-12.2%
-15.3%-18.8%-15.9%-14.3%
-6.0%-18.9%
MARINA DEL REY
SOUTH LOS ANGELES
WEST HOLLYWOOD
CERRITOS
EAST LOS ANGELES
INDUSTRY
LAKEWOOD
YTDReportedIncidents
YTDCrime Rate
TotalReportedIncidents
YTDReportedIncidents
YTDCrime Rate
TotalReportedIncidents
YTDReportedIncidents
YTDCrime Rate
5 YearChange inYTD Crime
Rate
1 YearChange inYTD Crime
Rate
2009 2013 2014
2014/2009 2014/2013
STATION TOTAL
STATION TOTAL
STATION TOTAL
STATION TOTAL
STATION TOTAL
STATION TOTAL
404
1377
849
810
1755
1961
1049
3110
2008
1832
4348
4561
446
1249
812
827
2001
1612
1023
2943
1808
1899
4460
3628
394
1226
743
676
1728
1372
160.30
107.21
223.08
147.61
82.32
98.98
167.08
106.55
231.3
168.63
105.03
88.67
147.6
104.59
211.64
137.84
90.7
75.47
-7.92
-2.44
-5.13
-6.62
10.18
-23.75
-11.66%
-1.84%
-8.50%
-18.26%
-13.64%
-14.89%
PART I CRIMES
2009 2013
LOS ANGELES COUNTY SHERIFF'S DEPARTMENT
06/06/2014 01:47 pm
STATION, CITY AND UNINCORPORATED AREA PART I CRIME SUMMARY
Ver: 10.02.19.2013.0
YTD 05/31/2014 - PART I CRIME RATE PER 10,000 POPULATION
4Page
- PRELIMINARY DATA
Per the FBI UCR Guidelines Homicide, Rape and Aggravated Assault are counted by victim. All other crimes are counted by incident, except Arson which is always counted.2009 Population Source: LA County Internal Services Department (based on the 2000 US Census and CA Department of Finance estimates).2013 Population Source: LA County Internal Services Department (based on the 2010 US Census and CA Department of Finance estimates). 2014 YTD Crime Rates based on 2013 population estimates. 2013 population estimates updated for the city of Santa Clarita and the Santa Clarita Valley Station unincorporated area, due to 2012 year end annexations.Crime counts for patrol station areas only; red depicts +30% increases and green depicts -30% decreases. N/C = Not Calculable
This PRELIMINARY INFORMATION is used on an ongoing basis by the LASD for strategic planning and as a tactical early warning system. This data is not final and thus is not the crime data that is reported to the FBI Uniform Crime Index (UCI). This is because some of the most recent reports have not been written yet, nor reviewed by investigators. Once it is reported by investigators and supervisors, the crime data is reported to the FBI/UCI and is available via the pertinent LASD patrol station, pending publication by the FBI/UCI. Once it is reported by the LASD to the FBI, the FBI/UCI crime data is considered the most accurate.
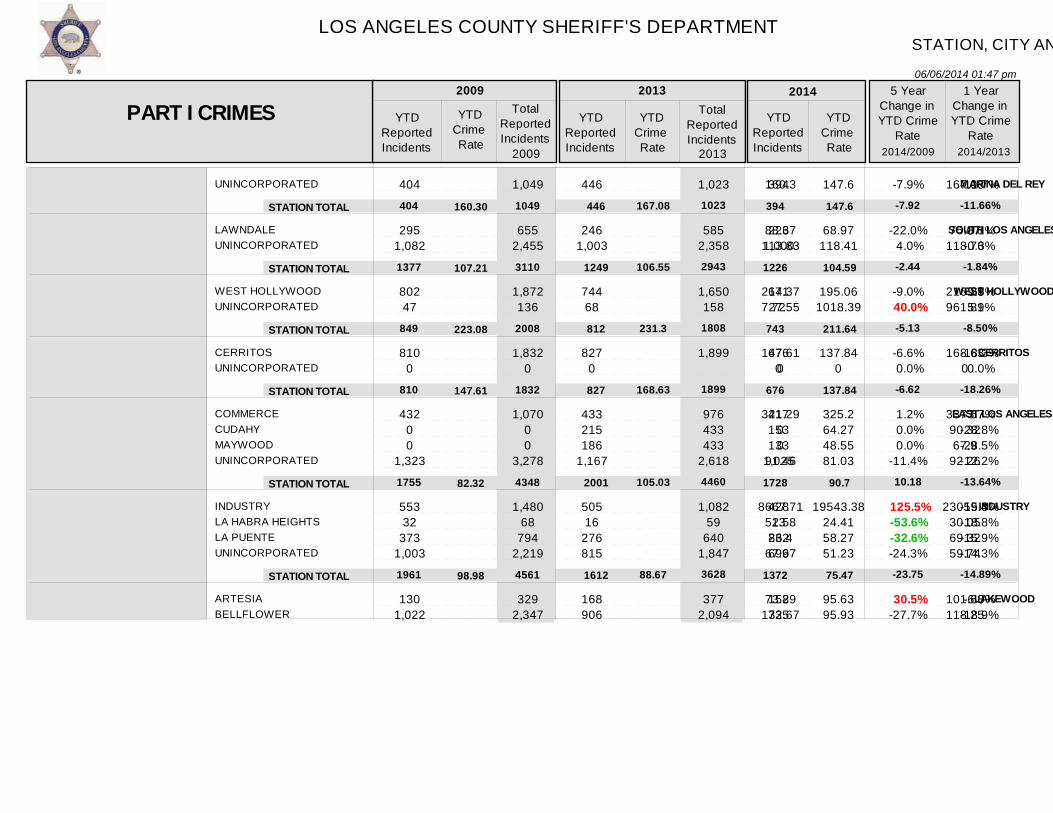
HAWAIIAN GARDENSLAKEWOODPARAMOUNTUNINCORPORATED
LA MIRADANORWALKUNINCORPORATED
PICO RIVERAUNINCORPORATED
SAN DIMASUNINCORPORATED
DIAMOND BARWALNUTUNINCORPORATED
140 968 848
7
335 1,116 397
673 288
362 284
468 246 469
306 2,398 2,002
12
742 2,597 865
1,568 672
883 747
976 492 967
109 899 835 14
415 1,178 414
728 252
321 253
467 224 443
254 2,265 1,792
24
916 2,662 885
1,760 578
773 677
949 500 874
83 804 666
5
318 977 372
687 215
263 233
315 138 376
88.13116.15146.739.73
67.74101.6854.52
100.4181.9
98.147.14
78.2775.9183.71
76.47112.31154.3564.04
85.52111.6161.87
115.6681.96
96.1952.71
84.0876.7983.89
58.23100.44123.1122.87
65.5392.5655.59
109.1569.93
78.8148.54
56.7147.3171.2
-33.9%-13.5%-16.1%-42.4%
-3.3%-9.0% 2.0%
8.7%-14.6%
-19.7% 3.0%
-27.6%-37.7%-14.9%
-23.9%-10.6%-20.2%-64.3%
-23.4%-17.1%-10.2%
-5.6%-14.7%
-18.1%-7.9%
-32.6%-38.4%-15.1%
LAKEWOOD
NORWALK
PICO RIVERA
SAN DIMAS
WALNUT
YTDReportedIncidents
YTDCrime Rate
TotalReportedIncidents
YTDReportedIncidents
YTDCrime Rate
TotalReportedIncidents
YTDReportedIncidents
YTDCrime Rate
5 YearChange inYTD Crime
Rate
1 YearChange inYTD Crime
Rate
2009 2013 2014
2014/2009 2014/2013
STATION TOTAL
STATION TOTAL
STATION TOTAL
STATION TOTAL
STATION TOTAL
3115
1848
961
646
1183
7394
4204
2240
1630
2435
2931
2007
980
574
1134
6806
4463
2338
1450
2323
2451
1667
902
496
829
122.85
79.65
94.04
66.50
79.81
120.26
90.82
104.6
70.54
82.46
100.56
75.43
96.28
60.95
60.28
-18.14
-5.3
2.38
-8.35
-24.47
-16.38%
-16.95%
-7.95%
-13.60%
-26.90%
PART I CRIMES
2009 2013
LOS ANGELES COUNTY SHERIFF'S DEPARTMENT
06/06/2014 01:47 pm
STATION, CITY AND UNINCORPORATED AREA PART I CRIME DETAIL
Ver: 10.02.19.2013.0
YTD 05/31/2014 - PART I CRIME RATE PER 10,000 POPULATION
1Page
- PRELIMINARY DATA
Per the FBI UCR Guidelines Homicide, Rape and Aggravated Assault are counted by victim. All other crimes are counted by incident, except Arson which is always counted.2009 Population Source: LA County Internal Services Department (based on the 2000 US Census and CA Department of Finance estimates).2013 Population Source: LA County Internal Services Department (based on the 2010 US Census and CA Department of Finance estimates). 2014 YTD Crime Rates based on 2013 population estimates. 2013 population estimates updated for the city of Santa Clarita and the Santa Clarita Valley Station unincorporated area, due to 2012 year end annexations.Crime counts for patrol station areas only; red depicts +30% increases and green depicts -30% decreases. N/C = Not Calculable
This PRELIMINARY INFORMATION is used on an ongoing basis by the LASD for strategic planning and as a tactical early warning system. This data is not final and thus is not the crime data that is reported to the FBI Uniform Crime Index (UCI). This is because some of the most recent reports have not been written yet, nor reviewed by investigators. Once it is reported by investigators and supervisors, the crime data is reported to the FBI/UCI and is available via the pertinent LASD patrol station, pending publication by the FBI/UCI. Once it is reported by the LASD to the FBI, the FBI/UCI crime data is considered the most accurate.
UNINCORPORATED
LA CANADA FLINTRIDGEUNINCORPORATED
LANCASTERUNINCORPORATED
AGOURA HILLSCALABASASHIDDEN HILLSMALIBUWESTLAKE VILLAGEUNINCORPORATED
PALMDALEUNINCORPORATED
SANTA CLARITAUNINCORPORATED
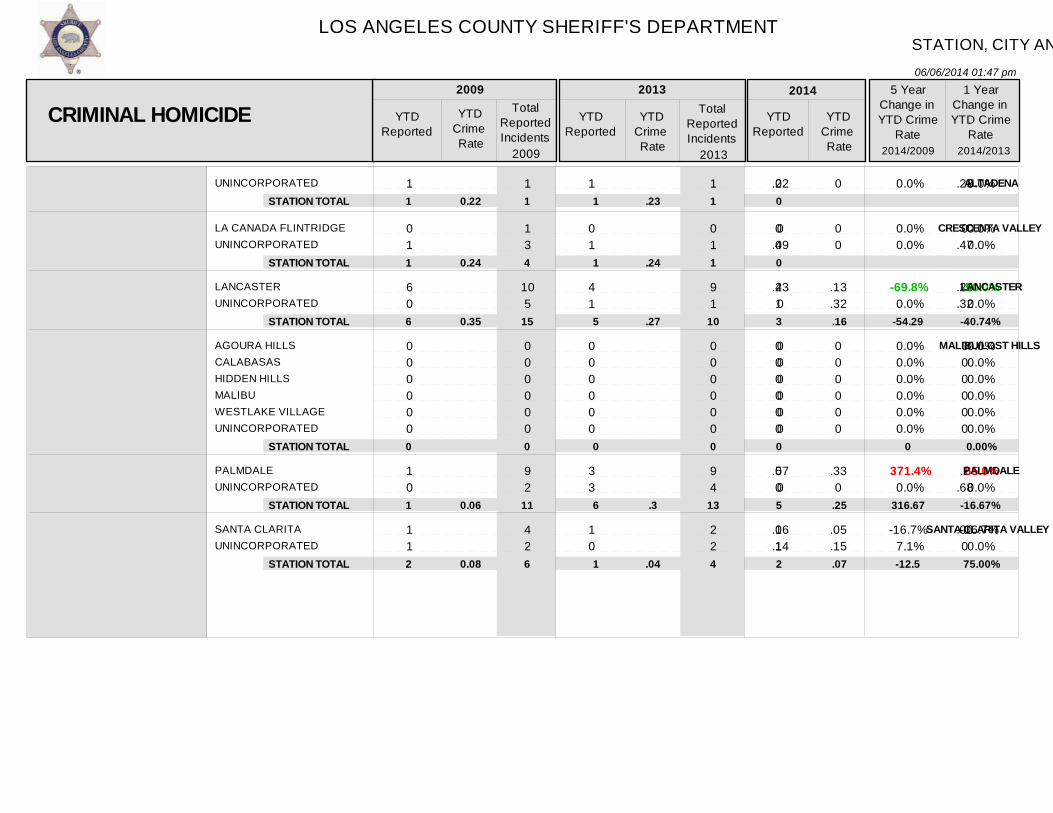
1
0 1
6 0
0 0 0 0 0 0
1 0
1 1
1
1 3
10 5
0 0 0 0 0 0
9 2
4 2
1
0 1
4 1
0 0 0 0 0 0
3 3
1 0
1
0 1
9 1
0 0 0 0 0 0
9 4
2 2
0
0 0
2 1
0 0 0 0 0 0
5 0
1 1
.22
0.49
.430
000000
.070
.06
.14
.23
0.47
.26
.32
000000
.2.68
.060
0
00
.13
.32
000000
.330
.05
.15
0.0%
0.0% 0.0%
-69.8% 0.0%
0.0% 0.0% 0.0% 0.0% 0.0% 0.0%
371.4% 0.0%
-16.7% 7.1%
0.0%
0.0% 0.0%
-50.0% 0.0%
0.0% 0.0% 0.0% 0.0% 0.0% 0.0%
65.0% 0.0%
-16.7% 0.0%
ALTADENA
CRESCENTA VALLEY
LANCASTER
MALIBU/LOST HILLS
PALMDALE
SANTA CLARITA VALLEY
CRIMINAL HOMICIDE YTDReported
YTDCrime Rate
TotalReportedIncidents
YTDReported
YTDCrime Rate
TotalReportedIncidents
YTDReported
YTDCrime Rate
5 YearChange inYTD Crime
Rate
1 YearChange inYTD Crime
Rate
2009 2013 2014
2014/2009 2014/2013
STATION TOTAL
STATION TOTAL
STATION TOTAL
STATION TOTAL
STATION TOTAL
STATION TOTAL
1
1
6
0
1
2
1
4
15
0
11
6
1
1
5
0
6
1
1
1
10
0
13
4
0
0
3
0
5
2
0.22
0.24
0.35
0.06
0.08
.23
.24
.27
.3
.04
.16
.25
.07
-54.29
0
316.67
-12.5
-40.74%
0.00%
-16.67%
75.00%
2009 2013
LOS ANGELES COUNTY SHERIFF'S DEPARTMENT
06/06/2014 01:47 pm
STATION, CITY AND UNINCORPORATED AREA PART I CRIME DETAIL
Ver: 10.02.19.2013.0
YTD 05/31/2014 - PART I CRIME RATE PER 10,000 POPULATION
2Page
- PRELIMINARY DATA
Per the FBI UCR Guidelines Homicide, Rape and Aggravated Assault are counted by victim. All other crimes are counted by incident, except Arson which is always counted.2009 Population Source: LA County Internal Services Department (based on the 2000 US Census and CA Department of Finance estimates).2013 Population Source: LA County Internal Services Department (based on the 2010 US Census and CA Department of Finance estimates). 2014 YTD Crime Rates based on 2013 population estimates. 2013 population estimates updated for the city of Santa Clarita and the Santa Clarita Valley Station unincorporated area, due to 2012 year end annexations.Crime counts for patrol station areas only; red depicts +30% increases and green depicts -30% decreases. N/C = Not Calculable
This PRELIMINARY INFORMATION is used on an ongoing basis by the LASD for strategic planning and as a tactical early warning system. This data is not final and thus is not the crime data that is reported to the FBI Uniform Crime Index (UCI). This is because some of the most recent reports have not been written yet, nor reviewed by investigators. Once it is reported by investigators and supervisors, the crime data is reported to the FBI/UCI and is available via the pertinent LASD patrol station, pending publication by the FBI/UCI. Once it is reported by the LASD to the FBI, the FBI/UCI crime data is considered the most accurate.
BRADBURYDUARTEROSEMEADSOUTH EL MONTETEMPLE CITYUNINCORPORATED
AVALONUNINCORPORATED
CARSONUNINCORPORATED
LYNWOODUNINCORPORATED
COMPTONUNINCORPORATED
LOMITARANCHO PALOS VERDESROLLING HILLSROLLING HILLS ESTATESUNINCORPORATED
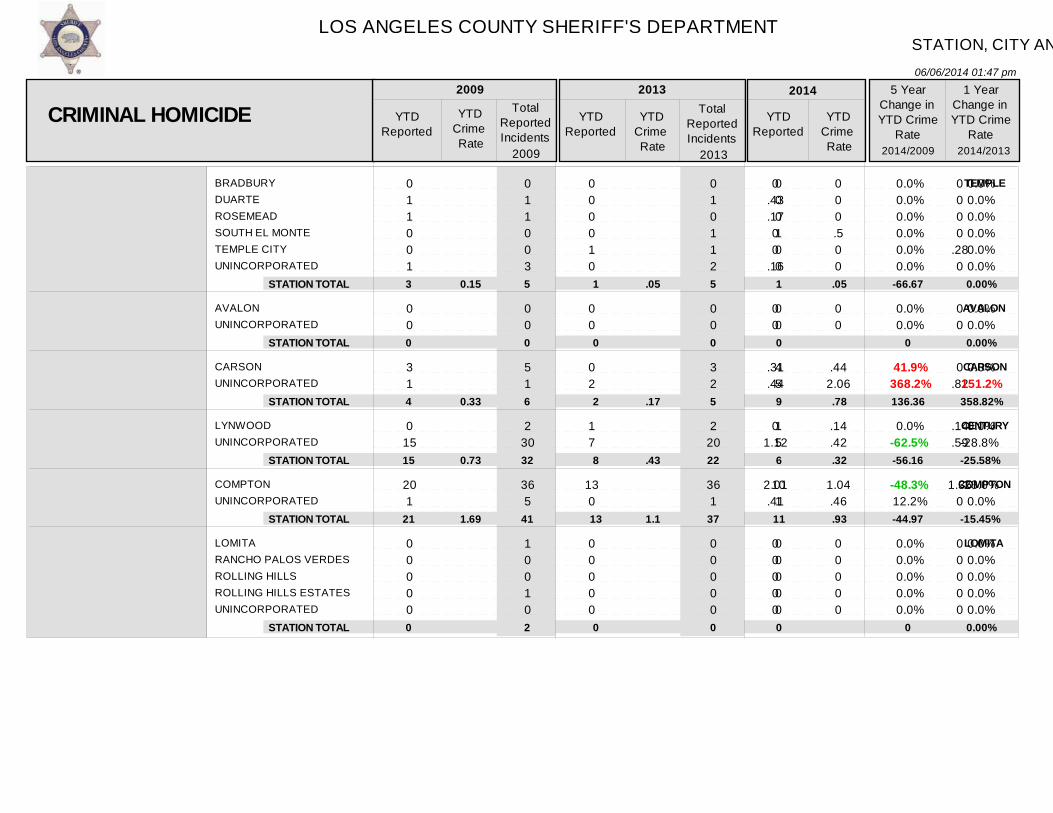
0 1 1 0 0 1
0 0
3 1
0 15
20 1
0 0 0 0 0
0 1 1 0 0 3
0 0
5 1
2 30
36 5
1 0 0 1 0
0 0 0 0 1 0
0 0
0 2
1 7
13 0
0 0 0 0 0
0 1 0 1 1 2
0 0
3 2
2 20
36 1
0 0 0 0 0
0 0 0 1 0 0
0 0
4 5
1 5
10 1
0 0 0 0 0
0.43.1700
.16
00
.31
.44
01.12
2.01.41
00000
0000
.280
00
0.82
.14
.59
1.350
00000
000.500
00
.442.06
.14
.42
1.04.46
00000
0.0% 0.0% 0.0% 0.0% 0.0% 0.0%
0.0% 0.0%
41.9% 368.2%
0.0%-62.5%
-48.3% 12.2%
0.0% 0.0% 0.0% 0.0% 0.0%
0.0% 0.0% 0.0% 0.0% 0.0% 0.0%
0.0% 0.0%
0.0% 151.2%
0.0%-28.8%
-23.0% 0.0%
0.0% 0.0% 0.0% 0.0% 0.0%
TEMPLE
AVALON
CARSON
CENTURY
COMPTON
LOMITA
CRIMINAL HOMICIDE YTDReported
YTDCrime Rate
TotalReportedIncidents
YTDReported
YTDCrime Rate
TotalReportedIncidents
YTDReported
YTDCrime Rate
5 YearChange inYTD Crime
Rate
1 YearChange inYTD Crime
Rate
2009 2013 2014
2014/2009 2014/2013
STATION TOTAL
STATION TOTAL
STATION TOTAL
STATION TOTAL
STATION TOTAL
STATION TOTAL
3
0
4
15
21
0
5
0
6
32
41
2
1
0
2
8
13
0
5
0
5
22
37
0
1
0
9
6
11
0
0.15
0.33
0.73
1.69
.05
.17
.43
1.1
.05
.78
.32
.93
-66.67
0
136.36
-56.16
-44.97
0
0.00%
0.00%
358.82%
-25.58%
-15.45%
0.00%
2009 2013
LOS ANGELES COUNTY SHERIFF'S DEPARTMENT
06/06/2014 01:47 pm
STATION, CITY AND UNINCORPORATED AREA PART I CRIME DETAIL
Ver: 10.02.19.2013.0
YTD 05/31/2014 - PART I CRIME RATE PER 10,000 POPULATION
3Page
- PRELIMINARY DATA
Per the FBI UCR Guidelines Homicide, Rape and Aggravated Assault are counted by victim. All other crimes are counted by incident, except Arson which is always counted.2009 Population Source: LA County Internal Services Department (based on the 2000 US Census and CA Department of Finance estimates).2013 Population Source: LA County Internal Services Department (based on the 2010 US Census and CA Department of Finance estimates). 2014 YTD Crime Rates based on 2013 population estimates. 2013 population estimates updated for the city of Santa Clarita and the Santa Clarita Valley Station unincorporated area, due to 2012 year end annexations.Crime counts for patrol station areas only; red depicts +30% increases and green depicts -30% decreases. N/C = Not Calculable
This PRELIMINARY INFORMATION is used on an ongoing basis by the LASD for strategic planning and as a tactical early warning system. This data is not final and thus is not the crime data that is reported to the FBI Uniform Crime Index (UCI). This is because some of the most recent reports have not been written yet, nor reviewed by investigators. Once it is reported by investigators and supervisors, the crime data is reported to the FBI/UCI and is available via the pertinent LASD patrol station, pending publication by the FBI/UCI. Once it is reported by the LASD to the FBI, the FBI/UCI crime data is considered the most accurate.
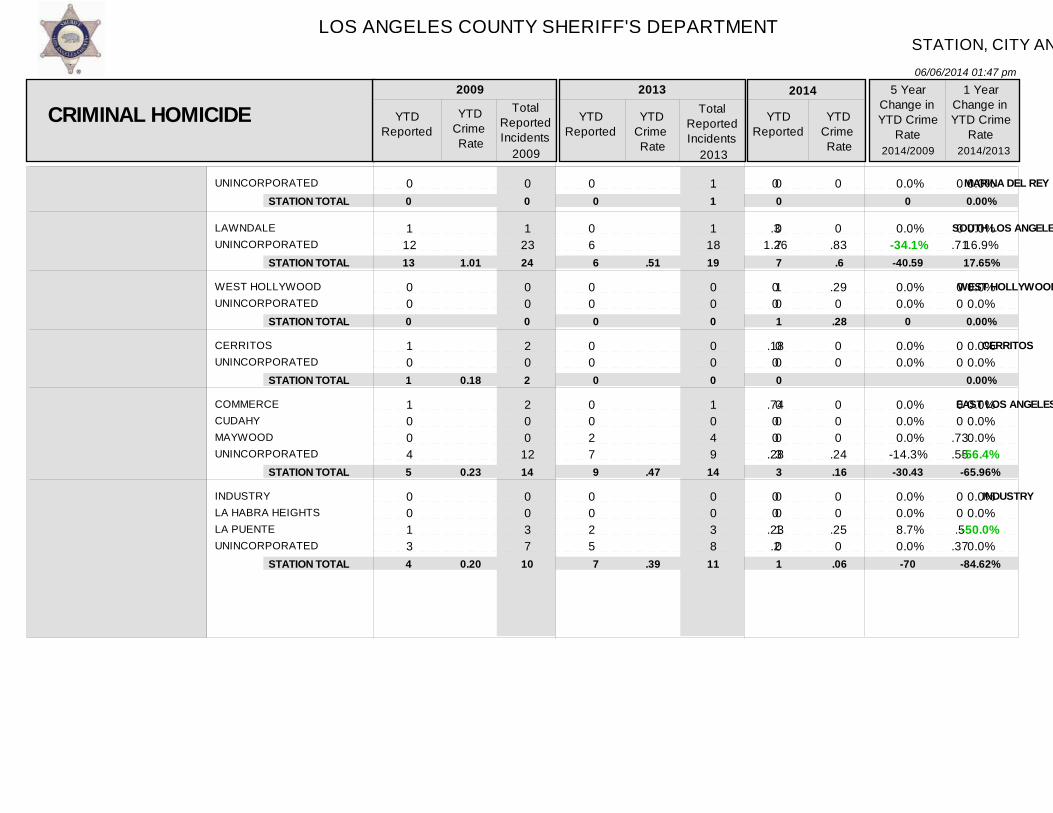
UNINCORPORATED
LAWNDALEUNINCORPORATED
WEST HOLLYWOODUNINCORPORATED
CERRITOSUNINCORPORATED
COMMERCECUDAHYMAYWOODUNINCORPORATED
INDUSTRYLA HABRA HEIGHTSLA PUENTEUNINCORPORATED
0
1 12
0 0
1 0
1 0 0 4
0 0 1 3
0
1 23
0 0
2 0
2 0 0
12
0 0 3 7
0
0 6
0 0
0 0
0 0 2 7
0 0 2 5
1
1 18
0 0
0 0
1 0 4 9
0 0 3 8
0
0 7
1 0
0 0
0 0 0 3
0 0 1 0
0
.31.26
00
.180
.7400
.28
00
.23.2
0
0.71
00
00
00
.73
.55
00.5
.37
0
0.83
.290
00
000
.24
00
.250
0.0%
0.0%-34.1%
0.0% 0.0%
0.0% 0.0%
0.0% 0.0% 0.0%
-14.3%
0.0% 0.0% 8.7% 0.0%
0.0%
0.0% 16.9%
0.0% 0.0%
0.0% 0.0%
0.0% 0.0% 0.0%-56.4%
0.0% 0.0%-50.0% 0.0%
MARINA DEL REY
SOUTH LOS ANGELES
WEST HOLLYWOOD
CERRITOS
EAST LOS ANGELES
INDUSTRY
CRIMINAL HOMICIDE YTDReported
YTDCrime Rate
TotalReportedIncidents
YTDReported
YTDCrime Rate
TotalReportedIncidents
YTDReported
YTDCrime Rate
5 YearChange inYTD Crime
Rate
1 YearChange inYTD Crime
Rate
2009 2013 2014
2014/2009 2014/2013
STATION TOTAL
STATION TOTAL
STATION TOTAL
STATION TOTAL
STATION TOTAL
STATION TOTAL
0
13
0
1
5
4
0
24
0
2
14
10
0
6
0
0
9
7
1
19
0
0
14
11
0
7
1
0
3
1
1.01
0.18
0.23
0.20
.51
.47
.39
.6
.28
.16
.06
0
-40.59
0
-30.43
-70
0.00%
17.65%
0.00%
0.00%
-65.96%
-84.62%
2009 2013

LOS ANGELES COUNTY SHERIFF'S DEPARTMENT
06/06/2014 01:47 pm
STATION, CITY AND UNINCORPORATED AREA PART I CRIME DETAIL
Ver: 10.02.19.2013.0
YTD 05/31/2014 - PART I CRIME RATE PER 10,000 POPULATION
4Page
- PRELIMINARY DATA
Per the FBI UCR Guidelines Homicide, Rape and Aggravated Assault are counted by victim. All other crimes are counted by incident, except Arson which is always counted.2009 Population Source: LA County Internal Services Department (based on the 2000 US Census and CA Department of Finance estimates).2013 Population Source: LA County Internal Services Department (based on the 2010 US Census and CA Department of Finance estimates). 2014 YTD Crime Rates based on 2013 population estimates. 2013 population estimates updated for the city of Santa Clarita and the Santa Clarita Valley Station unincorporated area, due to 2012 year end annexations.Crime counts for patrol station areas only; red depicts +30% increases and green depicts -30% decreases. N/C = Not Calculable
This PRELIMINARY INFORMATION is used on an ongoing basis by the LASD for strategic planning and as a tactical early warning system. This data is not final and thus is not the crime data that is reported to the FBI Uniform Crime Index (UCI). This is because some of the most recent reports have not been written yet, nor reviewed by investigators. Once it is reported by investigators and supervisors, the crime data is reported to the FBI/UCI and is available via the pertinent LASD patrol station, pending publication by the FBI/UCI. Once it is reported by the LASD to the FBI, the FBI/UCI crime data is considered the most accurate.
ARTESIABELLFLOWERHAWAIIAN GARDENSLAKEWOODPARAMOUNTUNINCORPORATED
LA MIRADANORWALKUNINCORPORATED
PICO RIVERAUNINCORPORATED
SAN DIMASUNINCORPORATED
DIAMOND BARWALNUTUNINCORPORATED
0 1 0 0 1 0
0 3 1
0 1
0 0
0 0 1
0 3 0 1 3 0
1 13 2
6 2
1 1
0 0 1
0 0 0 2 2 0
0 1 1
0 0
0 1
0 0 0
2 1 1 2 2 0
1 4 1
3 1
0 2
0 0 1
0 2 0 1 1 0
1 5 0
2 0
0 1
0 0 0
0.1300
.170
0.27.14
0.28
00
00
.18
000
.25
.370
0.09.15
00
0.21
000
0.260
.12
.180
.21
.470
.320
0.21
000
0.0% 100.0% 0.0% 0.0% 5.9% 0.0%
0.0% 74.1% 0.0%
0.0% 0.0%
0.0% 0.0%
0.0% 0.0% 0.0%
0.0% 0.0% 0.0%-52.0%-51.4% 0.0%
0.0% 422.2% 0.0%
0.0% 0.0%
0.0% 0.0%
0.0% 0.0% 0.0%
LAKEWOOD
NORWALK
PICO RIVERA
SAN DIMAS
WALNUT
CRIMINAL HOMICIDE YTDReported
YTDCrime Rate
TotalReportedIncidents
YTDReported
YTDCrime Rate
TotalReportedIncidents
YTDReported
YTDCrime Rate
5 YearChange inYTD Crime
Rate
1 YearChange inYTD Crime
Rate
2009 2013 2014
2014/2009 2014/2013
STATION TOTAL
STATION TOTAL
STATION TOTAL
STATION TOTAL
STATION TOTAL
2
4
1
0
1
7
16
8
2
1
4
2
0
1
0
8
6
4
2
1
4
6
2
1
0
0.08
0.17
0.10
0.07
.16
.09
.12
.16
.27
.21
.12
100
58.82
110
0
0.00%
200.00%
0.00%
0.00%
0.00%
2009 2013

LOS ANGELES COUNTY SHERIFF'S DEPARTMENT
06/06/2014 01:47 pm
STATION, CITY AND UNINCORPORATED AREA PART I CRIME DETAIL
Ver: 10.02.19.2013.0
YTD 05/31/2014 - PART I CRIME RATE PER 10,000 POPULATION
5Page
- PRELIMINARY DATA
Per the FBI UCR Guidelines Homicide, Rape and Aggravated Assault are counted by victim. All other crimes are counted by incident, except Arson which is always counted.2009 Population Source: LA County Internal Services Department (based on the 2000 US Census and CA Department of Finance estimates).2013 Population Source: LA County Internal Services Department (based on the 2010 US Census and CA Department of Finance estimates). 2014 YTD Crime Rates based on 2013 population estimates. 2013 population estimates updated for the city of Santa Clarita and the Santa Clarita Valley Station unincorporated area, due to 2012 year end annexations.Crime counts for patrol station areas only; red depicts +30% increases and green depicts -30% decreases. N/C = Not Calculable
This PRELIMINARY INFORMATION is used on an ongoing basis by the LASD for strategic planning and as a tactical early warning system. This data is not final and thus is not the crime data that is reported to the FBI Uniform Crime Index (UCI). This is because some of the most recent reports have not been written yet, nor reviewed by investigators. Once it is reported by investigators and supervisors, the crime data is reported to the FBI/UCI and is available via the pertinent LASD patrol station, pending publication by the FBI/UCI. Once it is reported by the LASD to the FBI, the FBI/UCI crime data is considered the most accurate.
UNINCORPORATED
LA CANADA FLINTRIDGEUNINCORPORATED
LANCASTERUNINCORPORATED
AGOURA HILLSCALABASASHIDDEN HILLSMALIBUWESTLAKE VILLAGEUNINCORPORATED
PALMDALEUNINCORPORATED
SANTA CLARITAUNINCORPORATED
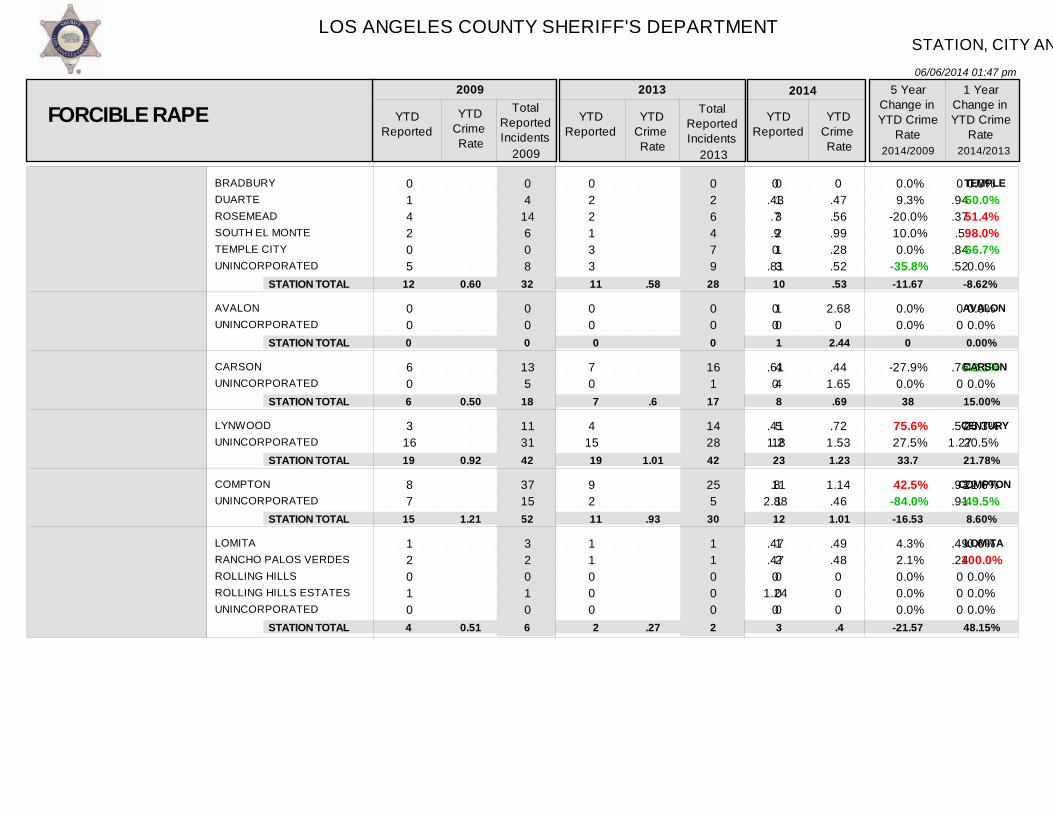
3
1 0
28 4
1 0 0 0 0 3
13 6
8 5
5
1 2
62 9
3 1 0 1 0 7
42 8
18 8
6
0 2
19 2
1 2 0 1 0 0
10 2
12 2
12
0 2
43 10
1 3 0 4 1 2
28 6
22 6
1
1 0
21 3
3 0 0 1 2 0
10 4
8 3
.66
.470
21.28
.430000
1.38
.912.01
.47
.68
1.36
0.94
1.21.64
.49
.870
.7900
.65
.45
.68
.22
.23
.490
1.34.96
1.4800
.792.42
0
.65
.91
.39
.45
-65.2%
4.3% 0.0%
-33.0%-25.0%
244.2% 0.0% 0.0% 0.0% 0.0% 0.0%
-28.6%-54.7%
-17.0%-33.8%
-83.1%
0.0% 0.0%
10.7% 50.0%
202.0% 0.0% 0.0% 0.0% 0.0% 0.0%
0.0% 102.2%
-42.7% 104.6%
ALTADENA
CRESCENTA VALLEY
LANCASTER
MALIBU/LOST HILLS
PALMDALE
SANTA CLARITA VALLEY
FORCIBLE RAPE YTDReported
YTDCrime Rate
TotalReportedIncidents
YTDReported
YTDCrime Rate
TotalReportedIncidents
YTDReported
YTDCrime Rate
5 YearChange inYTD Crime
Rate
1 YearChange inYTD Crime
Rate
2009 2013 2014
2014/2009 2014/2013
STATION TOTAL
STATION TOTAL
STATION TOTAL
STATION TOTAL
STATION TOTAL
STATION TOTAL
3
1
32
4
19
13
5
3
71
12
50
26
6
2
21
4
12
14
12
2
53
11
34
28
1
1
24
6
14
11
0.66
0.24
1.87
0.43
1.10
0.54
1.36
.48
1.12
.45
.61
.52
.23
.24
1.28
.67
.71
.41
-65.15
0
-31.55
55.81
-35.45
-24.07
-83.09%
-50.00%
14.29%
48.89%
16.39%
-21.15%
2009 2013
LOS ANGELES COUNTY SHERIFF'S DEPARTMENT
06/06/2014 01:47 pm
STATION, CITY AND UNINCORPORATED AREA PART I CRIME DETAIL
Ver: 10.02.19.2013.0
YTD 05/31/2014 - PART I CRIME RATE PER 10,000 POPULATION
6Page
- PRELIMINARY DATA
Per the FBI UCR Guidelines Homicide, Rape and Aggravated Assault are counted by victim. All other crimes are counted by incident, except Arson which is always counted.2009 Population Source: LA County Internal Services Department (based on the 2000 US Census and CA Department of Finance estimates).2013 Population Source: LA County Internal Services Department (based on the 2010 US Census and CA Department of Finance estimates). 2014 YTD Crime Rates based on 2013 population estimates. 2013 population estimates updated for the city of Santa Clarita and the Santa Clarita Valley Station unincorporated area, due to 2012 year end annexations.Crime counts for patrol station areas only; red depicts +30% increases and green depicts -30% decreases. N/C = Not Calculable
This PRELIMINARY INFORMATION is used on an ongoing basis by the LASD for strategic planning and as a tactical early warning system. This data is not final and thus is not the crime data that is reported to the FBI Uniform Crime Index (UCI). This is because some of the most recent reports have not been written yet, nor reviewed by investigators. Once it is reported by investigators and supervisors, the crime data is reported to the FBI/UCI and is available via the pertinent LASD patrol station, pending publication by the FBI/UCI. Once it is reported by the LASD to the FBI, the FBI/UCI crime data is considered the most accurate.
BRADBURYDUARTEROSEMEADSOUTH EL MONTETEMPLE CITYUNINCORPORATED
AVALONUNINCORPORATED
CARSONUNINCORPORATED
LYNWOODUNINCORPORATED
COMPTONUNINCORPORATED
LOMITARANCHO PALOS VERDESROLLING HILLSROLLING HILLS ESTATESUNINCORPORATED
0 1 4 2 0 5
0 0
6 0
3 16
8 7
1 2 0 1 0
0 4
14 6 0 8
0 0
13 5
11 31
37 15
3 2 0 1 0
0 2 2 1 3 3
0 0
7 0
4 15
9 2
1 1 0 0 0
0 2 6 4 7 9
0 0
16 1
14 28
25 5
1 1 0 0 0
0 1 3 2 1 3
1 0
4 4
5 18
11 1
1 2 0 0 0
0.43.7.90
.81
00
.610
.411.2
.82.88
.47
.470
1.240
0.94.37.5
.84
.52
00
.760
.571.27
.93
.91
.49
.24000
0.47.56.99.28.52
2.680
.441.65
.721.53
1.14.46
.49
.48000
0.0% 9.3%
-20.0% 10.0% 0.0%
-35.8%
0.0% 0.0%
-27.9% 0.0%
75.6% 27.5%
42.5%-84.0%
4.3% 2.1% 0.0% 0.0% 0.0%
0.0%-50.0% 51.4% 98.0%-66.7% 0.0%
0.0% 0.0%
-42.1% 0.0%
26.3% 20.5%
22.6%-49.5%
0.0% 100.0% 0.0% 0.0% 0.0%
TEMPLE
AVALON
CARSON
CENTURY
COMPTON
LOMITA
FORCIBLE RAPE YTDReported
YTDCrime Rate
TotalReportedIncidents
YTDReported
YTDCrime Rate
TotalReportedIncidents
YTDReported
YTDCrime Rate
5 YearChange inYTD Crime
Rate
1 YearChange inYTD Crime
Rate
2009 2013 2014
2014/2009 2014/2013
STATION TOTAL
STATION TOTAL
STATION TOTAL
STATION TOTAL
STATION TOTAL
STATION TOTAL
12
0
6
19
15
4
32
0
18
42
52
6
11
0
7
19
11
2
28
0
17
42
30
2
10
1
8
23
12
3
0.60
0.50
0.92
1.21
0.51
.58
.6
1.01
.93
.27
.53
2.44
.69
1.23
1.01
.4
-11.67
0
38
33.7
-16.53
-21.57
-8.62%
0.00%
15.00%
21.78%
8.60%
48.15%
2009 2013

LOS ANGELES COUNTY SHERIFF'S DEPARTMENT
06/06/2014 01:47 pm
STATION, CITY AND UNINCORPORATED AREA PART I CRIME DETAIL
Ver: 10.02.19.2013.0
YTD 05/31/2014 - PART I CRIME RATE PER 10,000 POPULATION
7Page
- PRELIMINARY DATA
Per the FBI UCR Guidelines Homicide, Rape and Aggravated Assault are counted by victim. All other crimes are counted by incident, except Arson which is always counted.2009 Population Source: LA County Internal Services Department (based on the 2000 US Census and CA Department of Finance estimates).2013 Population Source: LA County Internal Services Department (based on the 2010 US Census and CA Department of Finance estimates). 2014 YTD Crime Rates based on 2013 population estimates. 2013 population estimates updated for the city of Santa Clarita and the Santa Clarita Valley Station unincorporated area, due to 2012 year end annexations.Crime counts for patrol station areas only; red depicts +30% increases and green depicts -30% decreases. N/C = Not Calculable
This PRELIMINARY INFORMATION is used on an ongoing basis by the LASD for strategic planning and as a tactical early warning system. This data is not final and thus is not the crime data that is reported to the FBI Uniform Crime Index (UCI). This is because some of the most recent reports have not been written yet, nor reviewed by investigators. Once it is reported by investigators and supervisors, the crime data is reported to the FBI/UCI and is available via the pertinent LASD patrol station, pending publication by the FBI/UCI. Once it is reported by the LASD to the FBI, the FBI/UCI crime data is considered the most accurate.
UNINCORPORATED
LAWNDALEUNINCORPORATED
WEST HOLLYWOODUNINCORPORATED
CERRITOSUNINCORPORATED
COMMERCECUDAHYMAYWOODUNINCORPORATED
INDUSTRYLA HABRA HEIGHTSLA PUENTEUNINCORPORATED
2
4 11
8 2
3 0
0 0 0
19
1 1 4 4
4
5 34
13 2
4 0
2 0 0
37
2 1 8
12
2
4 9
4 0
0 0
0 0 3 8
0 1 7 7
2
9 22
14 0
3 0
0 4 4
24
4 1
12 15
3
3 11
1 0
0 0
2 1 0
11
2 0 0 4
.79
1.21.16
2.1430.96
.550
000
1.31
15.671.64.93.27
.75
1.221.07
1.160
00
00
1.1.63
01.881.76.51
1.12
.921.3
.290
00
1.56.420
.87
91.3200
.29
41.8%
-23.3% 12.1%
-86.5% 0.0%
0.0% 0.0%
0.0% 0.0% 0.0%
-33.6%
482.8% 0.0% 0.0% 7.4%
49.3%
-24.6% 21.5%
-75.0% 0.0%
0.0% 0.0%
0.0% 0.0% 0.0% 38.1%
0.0% 0.0% 0.0%-43.1%
MARINA DEL REY
SOUTH LOS ANGELES
WEST HOLLYWOOD
CERRITOS
EAST LOS ANGELES
INDUSTRY
FORCIBLE RAPE YTDReported
YTDCrime Rate
TotalReportedIncidents
YTDReported
YTDCrime Rate
TotalReportedIncidents
YTDReported
YTDCrime Rate
5 YearChange inYTD Crime
Rate
1 YearChange inYTD Crime
Rate
2009 2013 2014
2014/2009 2014/2013
STATION TOTAL
STATION TOTAL
STATION TOTAL
STATION TOTAL
STATION TOTAL
STATION TOTAL
2
15
10
3
19
10
4
39
15
4
39
23
2
13
4
0
11
15
2
31
14
3
32
32
3
14
1
0
14
6
0.79
1.17
2.63
0.55
0.89
0.50
.75
1.11
1.14
.58
.83
1.12
1.19
.28
.73
.33
41.77
1.71
-89.35
-17.98
-34
49.33%
7.21%
-75.44%
0.00%
25.86%
-60.24%
2009 2013

LOS ANGELES COUNTY SHERIFF'S DEPARTMENT
06/06/2014 01:47 pm
STATION, CITY AND UNINCORPORATED AREA PART I CRIME DETAIL
Ver: 10.02.19.2013.0
YTD 05/31/2014 - PART I CRIME RATE PER 10,000 POPULATION
8Page
- PRELIMINARY DATA
Per the FBI UCR Guidelines Homicide, Rape and Aggravated Assault are counted by victim. All other crimes are counted by incident, except Arson which is always counted.2009 Population Source: LA County Internal Services Department (based on the 2000 US Census and CA Department of Finance estimates).2013 Population Source: LA County Internal Services Department (based on the 2010 US Census and CA Department of Finance estimates). 2014 YTD Crime Rates based on 2013 population estimates. 2013 population estimates updated for the city of Santa Clarita and the Santa Clarita Valley Station unincorporated area, due to 2012 year end annexations.Crime counts for patrol station areas only; red depicts +30% increases and green depicts -30% decreases. N/C = Not Calculable
This PRELIMINARY INFORMATION is used on an ongoing basis by the LASD for strategic planning and as a tactical early warning system. This data is not final and thus is not the crime data that is reported to the FBI Uniform Crime Index (UCI). This is because some of the most recent reports have not been written yet, nor reviewed by investigators. Once it is reported by investigators and supervisors, the crime data is reported to the FBI/UCI and is available via the pertinent LASD patrol station, pending publication by the FBI/UCI. Once it is reported by the LASD to the FBI, the FBI/UCI crime data is considered the most accurate.
ARTESIABELLFLOWERHAWAIIAN GARDENSLAKEWOODPARAMOUNTUNINCORPORATED
LA MIRADANORWALKUNINCORPORATED
PICO RIVERAUNINCORPORATED
SAN DIMASUNINCORPORATED
DIAMOND BARWALNUTUNINCORPORATED
0 9 2
11 5 1
1 7 9
3 1
2 4
1 0 0
1 16 3
20 13 2
4 16 12
15 3
9 8
4 3 2
0 4 2 6 4 2
3 15 7
4 1
2 2
2 1 2
0 8 2
11 9 3
11 19 11
8 2
6 8
3 1 3
0 4 0 2 2 0
3 5 4
3 2
1 4
3 1 1
01.171.261.32.86
5.68
.2.64
1.24
.45
.28
.54
.66
.1700
0.521.4.75.74
9.15
.621.421.05
.64
.33
.6.42
.36
.34
.38
0.520
.25
.370
.62
.47.6
.48
.65
.3.83
.54
.34
.19
0.0%-55.6% 0.0%
-81.1%-57.0% 0.0%
210.0%-26.6%-51.6%
6.7% 132.1%
-44.4% 25.8%
217.7% 0.0% 0.0%
0.0% 0.0% 0.0%-66.7%-50.0% 0.0%
0.0%-66.9%-42.9%
-25.0% 97.0%
-50.0% 97.6%
50.0% 0.0%-50.0%
LAKEWOOD
NORWALK
PICO RIVERA
SAN DIMAS
WALNUT
FORCIBLE RAPE YTDReported
YTDCrime Rate
TotalReportedIncidents
YTDReported
YTDCrime Rate
TotalReportedIncidents
YTDReported
YTDCrime Rate
5 YearChange inYTD Crime
Rate
1 YearChange inYTD Crime
Rate
2009 2013 2014
2014/2009 2014/2013
STATION TOTAL
STATION TOTAL
STATION TOTAL
STATION TOTAL
STATION TOTAL
28
17
4
6
1
55
32
18
17
9
18
25
5
4
5
33
41
10
14
7
8
12
5
5
5
1.10
0.73
0.39
0.62
0.07
.74
1.13
.53
.49
.36
.33
.54
.53
.61
.36
-70
-26.03
35.9
-1.61
414.29
-55.41%
-52.21%
0.00%
24.49%
0.00%
2009 2013
LOS ANGELES COUNTY SHERIFF'S DEPARTMENT
06/06/2014 01:47 pm
STATION, CITY AND UNINCORPORATED AREA PART I CRIME DETAIL
Ver: 10.02.19.2013.0
YTD 05/31/2014 - PART I CRIME RATE PER 10,000 POPULATION
9Page
- PRELIMINARY DATA
Per the FBI UCR Guidelines Homicide, Rape and Aggravated Assault are counted by victim. All other crimes are counted by incident, except Arson which is always counted.2009 Population Source: LA County Internal Services Department (based on the 2000 US Census and CA Department of Finance estimates).2013 Population Source: LA County Internal Services Department (based on the 2010 US Census and CA Department of Finance estimates). 2014 YTD Crime Rates based on 2013 population estimates. 2013 population estimates updated for the city of Santa Clarita and the Santa Clarita Valley Station unincorporated area, due to 2012 year end annexations.Crime counts for patrol station areas only; red depicts +30% increases and green depicts -30% decreases. N/C = Not Calculable
This PRELIMINARY INFORMATION is used on an ongoing basis by the LASD for strategic planning and as a tactical early warning system. This data is not final and thus is not the crime data that is reported to the FBI Uniform Crime Index (UCI). This is because some of the most recent reports have not been written yet, nor reviewed by investigators. Once it is reported by investigators and supervisors, the crime data is reported to the FBI/UCI and is available via the pertinent LASD patrol station, pending publication by the FBI/UCI. Once it is reported by the LASD to the FBI, the FBI/UCI crime data is considered the most accurate.
UNINCORPORATED
LA CANADA FLINTRIDGEUNINCORPORATED
LANCASTERUNINCORPORATED
AGOURA HILLSCALABASASHIDDEN HILLSMALIBUWESTLAKE VILLAGEUNINCORPORATED
PALMDALEUNINCORPORATED
SANTA CLARITAUNINCORPORATED
10
3 2
140 8
4 2 0 3 1 3
107 16
53 12
34
10 7
319 16
6 6 0 3 2 7
262 24
107 35
6
2 2
87 4
6 2 1 6 0 0
98 8
32 6
12
3 9
257 10
10 6 2
11 3 2
255 17
102 17
7
1 1
95 4
0 3 0 1 1 0
96 2
37 7
2.21
1.41.98
10.012.57
1.72.850
2.191.131.38
7.475.36
3.141.64
1.36
.99
.94
5.551.28
2.95.87
5.394.74
00
6.421.82
1.81.65
1.59
.49
.47
6.071.28
01.30
.791.21
0
6.28.45
1.811.05
-28.1%
-65.3%-52.0%
-39.4%-50.2%
0.0% 52.9% 0.0%
-63.9% 7.1% 0.0%
-15.9%-91.6%
-42.4%-36.0%
16.9%
-50.5%-50.0%
9.4% 0.0%
0.0% 49.4% 0.0%-83.3% 0.0% 0.0%
-2.2%-75.3%
0.0% 61.5%
ALTADENA
CRESCENTA VALLEY
LANCASTER
MALIBU/LOST HILLS
PALMDALE
SANTA CLARITA VALLEY
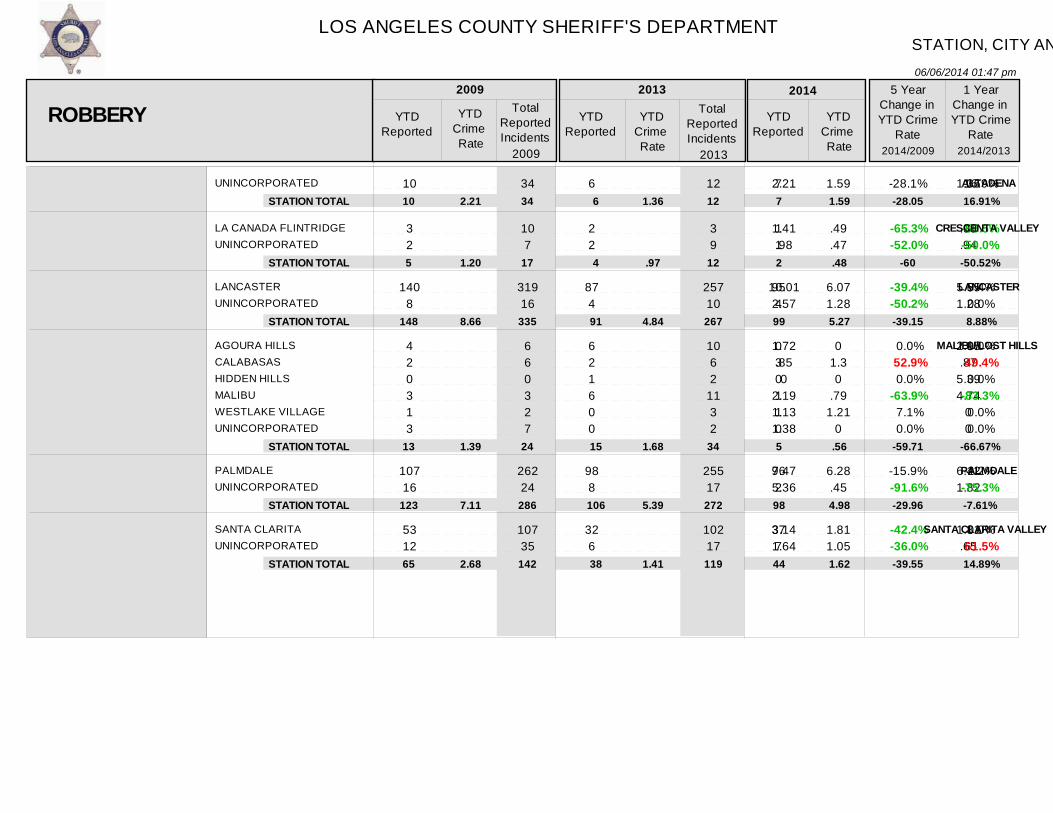
ROBBERY YTDReported
YTDCrime Rate
TotalReportedIncidents
YTDReported
YTDCrime Rate
TotalReportedIncidents
YTDReported
YTDCrime Rate
5 YearChange inYTD Crime
Rate
1 YearChange inYTD Crime
Rate
2009 2013 2014
2014/2009 2014/2013
STATION TOTAL
STATION TOTAL
STATION TOTAL
STATION TOTAL
STATION TOTAL
STATION TOTAL
10
5
148
13
123
65
34
17
335
24
286
142
6
4
91
15
106
38
12
12
267
34
272
119
7
2
99
5
98
44
2.21
1.20
8.66
1.39
7.11
2.68
1.36
.97
4.84
1.68
5.39
1.41
1.59
.48
5.27
.56
4.98
1.62
-28.05
-60
-39.15
-59.71
-29.96
-39.55
16.91%
-50.52%
8.88%
-66.67%
-7.61%
14.89%
2009 2013
LOS ANGELES COUNTY SHERIFF'S DEPARTMENT
06/06/2014 01:47 pm
STATION, CITY AND UNINCORPORATED AREA PART I CRIME DETAIL
Ver: 10.02.19.2013.0
YTD 05/31/2014 - PART I CRIME RATE PER 10,000 POPULATION
10Page
- PRELIMINARY DATA
Per the FBI UCR Guidelines Homicide, Rape and Aggravated Assault are counted by victim. All other crimes are counted by incident, except Arson which is always counted.2009 Population Source: LA County Internal Services Department (based on the 2000 US Census and CA Department of Finance estimates).2013 Population Source: LA County Internal Services Department (based on the 2010 US Census and CA Department of Finance estimates). 2014 YTD Crime Rates based on 2013 population estimates. 2013 population estimates updated for the city of Santa Clarita and the Santa Clarita Valley Station unincorporated area, due to 2012 year end annexations.Crime counts for patrol station areas only; red depicts +30% increases and green depicts -30% decreases. N/C = Not Calculable
This PRELIMINARY INFORMATION is used on an ongoing basis by the LASD for strategic planning and as a tactical early warning system. This data is not final and thus is not the crime data that is reported to the FBI Uniform Crime Index (UCI). This is because some of the most recent reports have not been written yet, nor reviewed by investigators. Once it is reported by investigators and supervisors, the crime data is reported to the FBI/UCI and is available via the pertinent LASD patrol station, pending publication by the FBI/UCI. Once it is reported by the LASD to the FBI, the FBI/UCI crime data is considered the most accurate.
BRADBURYDUARTEROSEMEADSOUTH EL MONTETEMPLE CITYUNINCORPORATED
AVALONUNINCORPORATED
CARSONUNINCORPORATED
LYNWOODUNINCORPORATED
COMPTONUNINCORPORATED
LOMITARANCHO PALOS VERDESROLLING HILLSROLLING HILLS ESTATESUNINCORPORATED
0 9
42 29 9
16
0 0
61 11
90 198
197 20
12 7 0 2 2
0 21
111 68 18 40
1 0
165 34
236 499
497 60
24 8 0 5 3
0 7
27 8 7 9
1 0
61 7
77 184
148 24
8 5 0 0 0
0 19 67 34 13 37
2 0
148 33
190 428
368 65
16 7 0 1 1
0 4
23 12 6 6
0 0
41 12
69 170
137 19
8 2 0 2 0
03.897.33
12.992.542.61
00
6.224.89
12.314.82
19.778.23
5.71.63
02.495.08
03.285.023.981.971.56
2.680
6.652.88
11.0415.63
15.3410.92
3.951.2000
01.884.285.971.691.04
00
4.474.94
9.8914.44
14.28.65
3.95.480
2.480
0.0%-51.7%-41.6%-54.0%-33.5%-60.2%
0.0% 0.0%
-28.1% 1.0%
-19.6%-2.6%
-28.2% 5.1%
-30.7%-70.6% 0.0%-0.4% 0.0%
0.0%-42.7%-14.7% 50.0%-14.2%-33.3%
0.0% 0.0%
-32.8% 71.5%
-10.4%-7.6%
-7.4%-20.8%
0.0%-60.0% 0.0% 0.0% 0.0%
TEMPLE
AVALON
CARSON
CENTURY
COMPTON
LOMITA
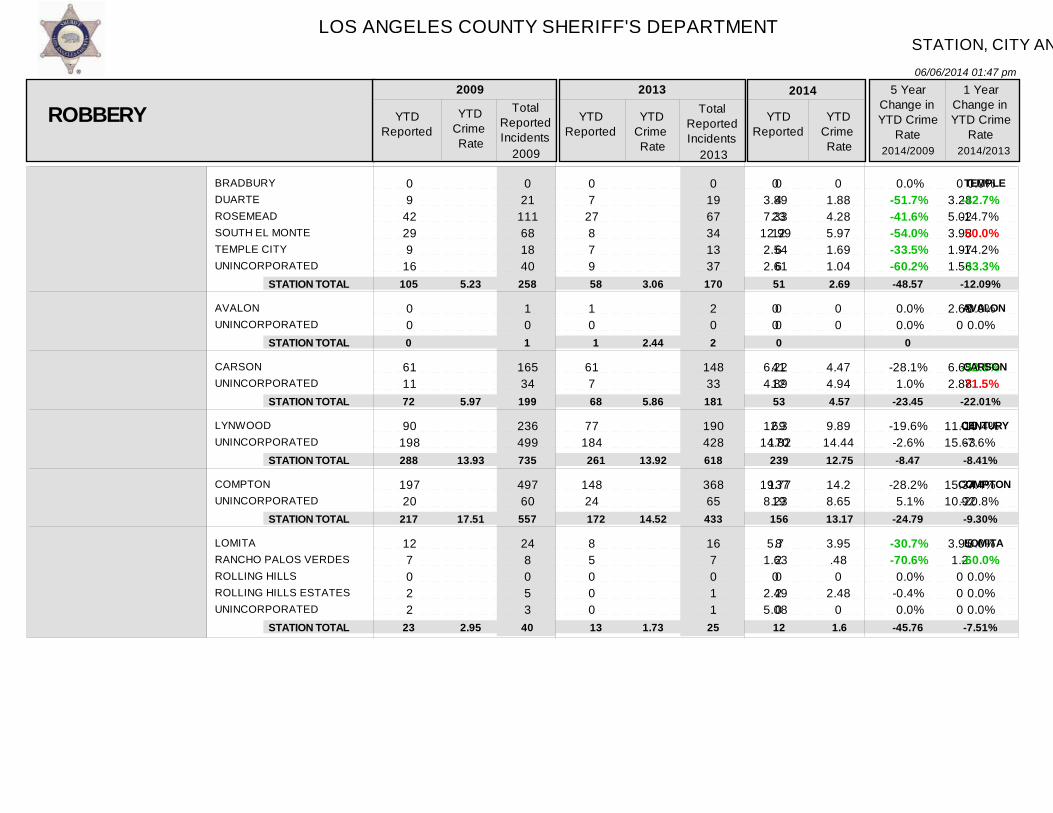
ROBBERY YTDReported
YTDCrime Rate
TotalReportedIncidents
YTDReported
YTDCrime Rate
TotalReportedIncidents
YTDReported
YTDCrime Rate
5 YearChange inYTD Crime
Rate
1 YearChange inYTD Crime
Rate
2009 2013 2014
2014/2009 2014/2013
STATION TOTAL
STATION TOTAL
STATION TOTAL
STATION TOTAL
STATION TOTAL
STATION TOTAL
105
0
72
288
217
23
258
1
199
735
557
40
58
1
68
261
172
13
170
2
181
618
433
25
51
0
53
239
156
12
5.23
5.97
13.93
17.51
2.95
3.06
2.44
5.86
13.92
14.52
1.73
2.69
4.57
12.75
13.17
1.6
-48.57
0
-23.45
-8.47
-24.79
-45.76
-12.09%
-22.01%
-8.41%
-9.30%
-7.51%
2009 2013
LOS ANGELES COUNTY SHERIFF'S DEPARTMENT
06/06/2014 01:47 pm
STATION, CITY AND UNINCORPORATED AREA PART I CRIME DETAIL
Ver: 10.02.19.2013.0
YTD 05/31/2014 - PART I CRIME RATE PER 10,000 POPULATION
11Page
- PRELIMINARY DATA
Per the FBI UCR Guidelines Homicide, Rape and Aggravated Assault are counted by victim. All other crimes are counted by incident, except Arson which is always counted.2009 Population Source: LA County Internal Services Department (based on the 2000 US Census and CA Department of Finance estimates).2013 Population Source: LA County Internal Services Department (based on the 2010 US Census and CA Department of Finance estimates). 2014 YTD Crime Rates based on 2013 population estimates. 2013 population estimates updated for the city of Santa Clarita and the Santa Clarita Valley Station unincorporated area, due to 2012 year end annexations.Crime counts for patrol station areas only; red depicts +30% increases and green depicts -30% decreases. N/C = Not Calculable
This PRELIMINARY INFORMATION is used on an ongoing basis by the LASD for strategic planning and as a tactical early warning system. This data is not final and thus is not the crime data that is reported to the FBI Uniform Crime Index (UCI). This is because some of the most recent reports have not been written yet, nor reviewed by investigators. Once it is reported by investigators and supervisors, the crime data is reported to the FBI/UCI and is available via the pertinent LASD patrol station, pending publication by the FBI/UCI. Once it is reported by the LASD to the FBI, the FBI/UCI crime data is considered the most accurate.
UNINCORPORATED
LAWNDALEUNINCORPORATED
WEST HOLLYWOODUNINCORPORATED
CERRITOSUNINCORPORATED
COMMERCECUDAHYMAYWOODUNINCORPORATED
INDUSTRYLA HABRA HEIGHTSLA PUENTEUNINCORPORATED
23
29 149
55 2
21 0
23 0 0
129
17 0
38 53
59
81 328
113 3
50 0
59 0 0
388
47 2
69 100
17
25 150
23 1
14 0
17 16 13 86
9 0
30 32
46
51 328
67 3
42 0
39 37 32
188
18 0
49 62
9
16 108
42 0
22 0
12 11 14 82
13 0
21 25
9.13
8.6915.67
14.730.96
3.830
17.1100
8.92
266.460
8.83.58
6.37
7.6317.76
6.6914.14
2.850
13.266.724.756.8
410.960
7.532.35
3.37
4.8812.79
12.210
4.490
9.364.625.116.48
593.610
5.271.83
-63.1%
-43.8%-18.4%
-16.9% 0.0%
17.2% 0.0%
-45.3% 0.0% 0.0%
-27.4%
122.8% 0.0%
-40.1%-48.9%
-47.1%
-36.0%-28.0%
82.5% 0.0%
57.5% 0.0%
-29.4%-31.3% 7.6%-4.7%
44.4% 0.0%-30.0%-22.1%
MARINA DEL REY
SOUTH LOS ANGELES
WEST HOLLYWOOD
CERRITOS
EAST LOS ANGELES
INDUSTRY
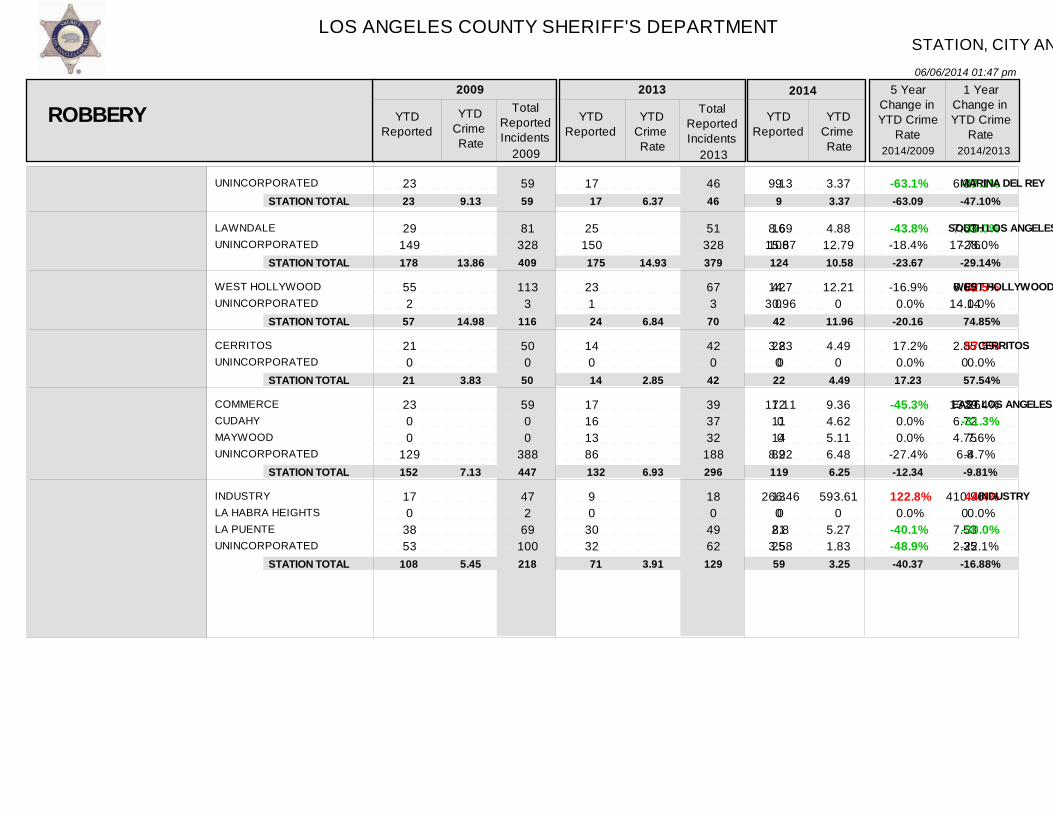
ROBBERY YTDReported
YTDCrime Rate
TotalReportedIncidents
YTDReported
YTDCrime Rate
TotalReportedIncidents
YTDReported
YTDCrime Rate
5 YearChange inYTD Crime
Rate
1 YearChange inYTD Crime
Rate
2009 2013 2014
2014/2009 2014/2013
STATION TOTAL
STATION TOTAL
STATION TOTAL
STATION TOTAL
STATION TOTAL
STATION TOTAL
23
178
57
21
152
108
59
409
116
50
447
218
17
175
24
14
132
71
46
379
70
42
296
129
9
124
42
22
119
59
9.13
13.86
14.98
3.83
7.13
5.45
6.37
14.93
6.84
2.85
6.93
3.91
3.37
10.58
11.96
4.49
6.25
3.25
-63.09
-23.67
-20.16
17.23
-12.34
-40.37
-47.10%
-29.14%
74.85%
57.54%
-9.81%
-16.88%
2009 2013
LOS ANGELES COUNTY SHERIFF'S DEPARTMENT
06/06/2014 01:47 pm
STATION, CITY AND UNINCORPORATED AREA PART I CRIME DETAIL
Ver: 10.02.19.2013.0
YTD 05/31/2014 - PART I CRIME RATE PER 10,000 POPULATION
12Page
- PRELIMINARY DATA
Per the FBI UCR Guidelines Homicide, Rape and Aggravated Assault are counted by victim. All other crimes are counted by incident, except Arson which is always counted.2009 Population Source: LA County Internal Services Department (based on the 2000 US Census and CA Department of Finance estimates).2013 Population Source: LA County Internal Services Department (based on the 2010 US Census and CA Department of Finance estimates). 2014 YTD Crime Rates based on 2013 population estimates. 2013 population estimates updated for the city of Santa Clarita and the Santa Clarita Valley Station unincorporated area, due to 2012 year end annexations.Crime counts for patrol station areas only; red depicts +30% increases and green depicts -30% decreases. N/C = Not Calculable
This PRELIMINARY INFORMATION is used on an ongoing basis by the LASD for strategic planning and as a tactical early warning system. This data is not final and thus is not the crime data that is reported to the FBI Uniform Crime Index (UCI). This is because some of the most recent reports have not been written yet, nor reviewed by investigators. Once it is reported by investigators and supervisors, the crime data is reported to the FBI/UCI and is available via the pertinent LASD patrol station, pending publication by the FBI/UCI. Once it is reported by the LASD to the FBI, the FBI/UCI crime data is considered the most accurate.
ARTESIABELLFLOWERHAWAIIAN GARDENSLAKEWOODPARAMOUNTUNINCORPORATED
LA MIRADANORWALKUNINCORPORATED
PICO RIVERAUNINCORPORATED
SAN DIMASUNINCORPORATED
DIAMOND BARWALNUTUNINCORPORATED
8 107 17 66 83 0
10 69 28
33 11
12 9
21 12 38
18 231 35
167 185
0
21 178 54
79 23
33 25
40 21 68
10 43 8
39 63 2
6 69 13
24 8
11 8
14 2 8
27 101 18
108 112
3
14 150 34
65 20
19 23
24 10 23
13 29 8
35 30 0
8 55 11
28 10
8 5
6 7 9
4.5113.8910.77.92
14.360
2.026.293.85
4.923.13
3.251.49
3.513.7
6.78
6.055.615.614.87
11.659.15
1.246.541.94
3.812.6
3.31.67
2.52.69
1.51
7.873.795.614.375.55
0
1.655.211.64
4.453.25
2.41.04
1.082.41.7
74.5%-72.7%-47.6%-44.8%-61.4% 0.0%
-18.3%-17.2%-57.4%
-9.6% 3.8%
-26.2%-30.2%
-69.2%-35.1%-74.9%
30.1%-32.4% 0.0%
-10.3%-52.4% 0.0%
33.1%-20.3%-15.5%
16.8% 25.0%
-27.3%-37.7%
-57.1% 247.8% 12.6%
LAKEWOOD
NORWALK
PICO RIVERA
SAN DIMAS
WALNUT
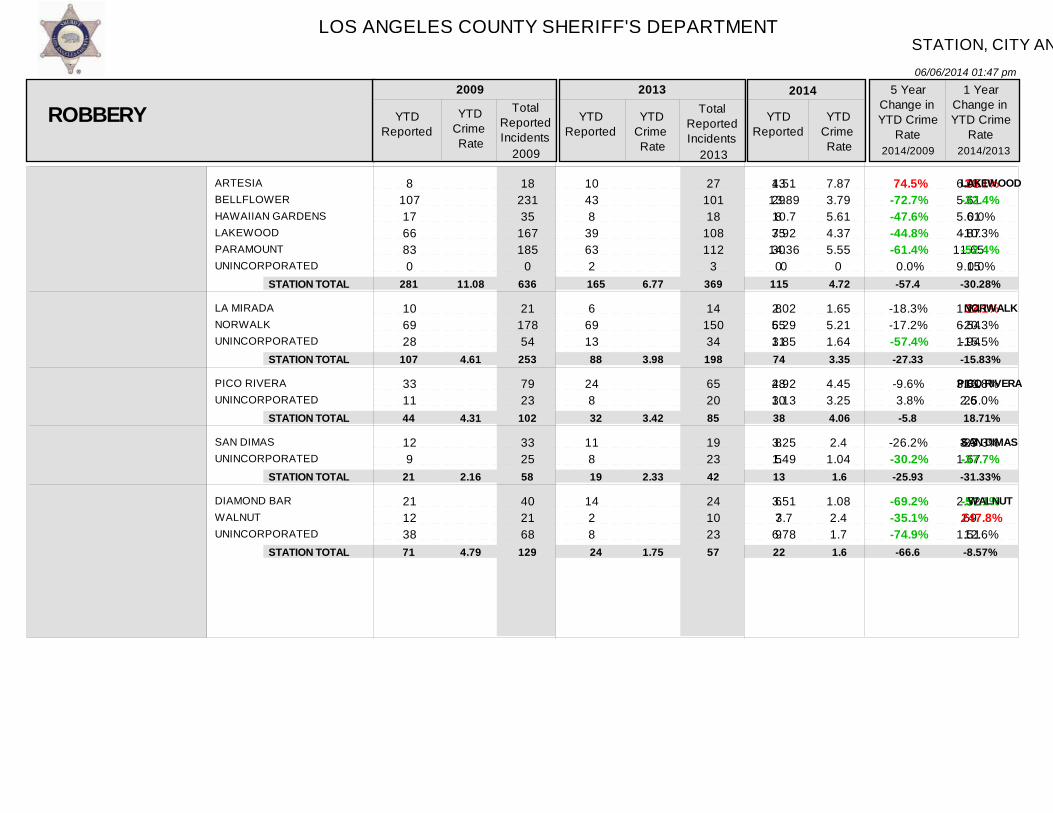
ROBBERY YTDReported
YTDCrime Rate
TotalReportedIncidents
YTDReported
YTDCrime Rate
TotalReportedIncidents
YTDReported
YTDCrime Rate
5 YearChange inYTD Crime
Rate
1 YearChange inYTD Crime
Rate
2009 2013 2014
2014/2009 2014/2013
STATION TOTAL
STATION TOTAL
STATION TOTAL
STATION TOTAL
STATION TOTAL
281
107
44
21
71
636
253
102
58
129
165
88
32
19
24
369
198
85
42
57
115
74
38
13
22
11.08
4.61
4.31
2.16
4.79
6.77
3.98
3.42
2.33
1.75
4.72
3.35
4.06
1.6
1.6
-57.4
-27.33
-5.8
-25.93
-66.6
-30.28%
-15.83%
18.71%
-31.33%
-8.57%
2009 2013

LOS ANGELES COUNTY SHERIFF'S DEPARTMENT
06/06/2014 01:47 pm
STATION, CITY AND UNINCORPORATED AREA PART I CRIME DETAIL
Ver: 10.02.19.2013.0
YTD 05/31/2014 - PART I CRIME RATE PER 10,000 POPULATION
13Page
- PRELIMINARY DATA
Per the FBI UCR Guidelines Homicide, Rape and Aggravated Assault are counted by victim. All other crimes are counted by incident, except Arson which is always counted.2009 Population Source: LA County Internal Services Department (based on the 2000 US Census and CA Department of Finance estimates).2013 Population Source: LA County Internal Services Department (based on the 2010 US Census and CA Department of Finance estimates). 2014 YTD Crime Rates based on 2013 population estimates. 2013 population estimates updated for the city of Santa Clarita and the Santa Clarita Valley Station unincorporated area, due to 2012 year end annexations.Crime counts for patrol station areas only; red depicts +30% increases and green depicts -30% decreases. N/C = Not Calculable
This PRELIMINARY INFORMATION is used on an ongoing basis by the LASD for strategic planning and as a tactical early warning system. This data is not final and thus is not the crime data that is reported to the FBI Uniform Crime Index (UCI). This is because some of the most recent reports have not been written yet, nor reviewed by investigators. Once it is reported by investigators and supervisors, the crime data is reported to the FBI/UCI and is available via the pertinent LASD patrol station, pending publication by the FBI/UCI. Once it is reported by the LASD to the FBI, the FBI/UCI crime data is considered the most accurate.
UNINCORPORATED
LA CANADA FLINTRIDGEUNINCORPORATED
LANCASTERUNINCORPORATED
AGOURA HILLSCALABASASHIDDEN HILLSMALIBUWESTLAKE VILLAGEUNINCORPORATED
PALMDALEUNINCORPORATED
SANTA CLARITAUNINCORPORATED
59
2 9
265 39
10 6 0
11 1 1
205 46
82 34
139
10 16
582 90
19 13 2
23 2
11
504 98
239 87
17
1 12
240 33
3 2 0 4 3 1
175 34
80 20
48
7 20
522 69
5 11 0
13 7
17
477 102
174 65
25
3 6
261 32
3 2 0 7 0 4
212 37
82 12
13.06
.944.4
18.9512.53
4.32.54
08.041.13.46
14.3115.42
4.864.64
3.85
.495.66
15.3210.53
1.48.870
3.163.63.43
11.467.72
4.542.16
5.67
1.482.83
16.6610.21
1.48.870
5.540
1.74
13.888.4
4.011.8
-56.6%
57.5%-35.7%
-12.1%-18.5%
-65.6%-65.8% 0.0%
-31.1% 0.0%
278.3%
-3.0%-45.5%
-17.5%-61.2%
47.3%
202.0%-50.0%
8.8%-3.0%
0.0% 0.0% 0.0% 75.3% 0.0%
304.7%
21.1% 8.8%
-11.7%-16.7%
ALTADENA
CRESCENTA VALLEY
LANCASTER
MALIBU/LOST HILLS
PALMDALE
SANTA CLARITA VALLEY
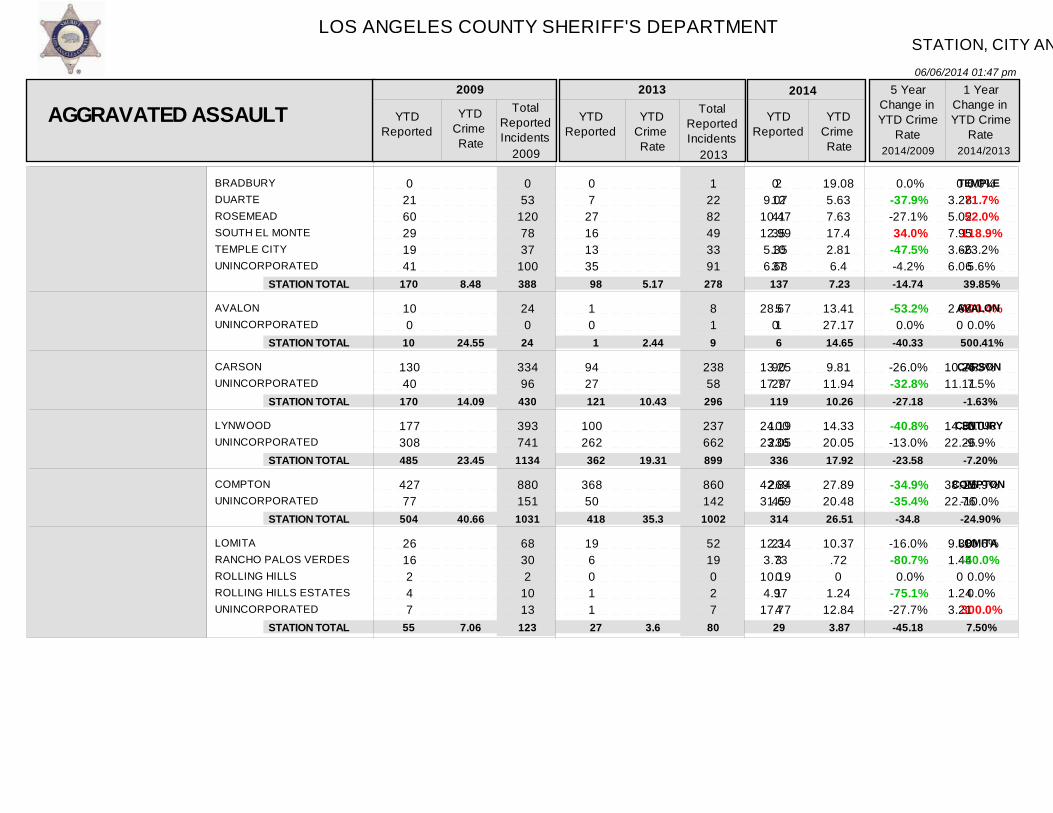
AGGRAVATED ASSAULT YTDReported
YTDCrime Rate
TotalReportedIncidents
YTDReported
YTDCrime Rate
TotalReportedIncidents
YTDReported
YTDCrime Rate
5 YearChange inYTD Crime
Rate
1 YearChange inYTD Crime
Rate
2009 2013 2014
2014/2009 2014/2013
STATION TOTAL
STATION TOTAL
STATION TOTAL
STATION TOTAL
STATION TOTAL
STATION TOTAL
59
11
304
29
251
116
139
26
672
70
602
326
17
13
273
13
209
100
48
27
591
53
579
239
25
9
293
16
249
94
13.06
2.64
17.78
3.11
14.50
4.79
3.85
3.14
14.52
1.46
10.62
3.72
5.67
2.17
15.59
1.79
12.65
3.47
-56.58
-17.8
-12.32
-42.44
-12.76
-27.56
47.27%
-30.89%
7.37%
22.60%
19.11%
-6.72%
2009 2013
LOS ANGELES COUNTY SHERIFF'S DEPARTMENT
06/06/2014 01:47 pm
STATION, CITY AND UNINCORPORATED AREA PART I CRIME DETAIL
Ver: 10.02.19.2013.0
YTD 05/31/2014 - PART I CRIME RATE PER 10,000 POPULATION
14Page
- PRELIMINARY DATA
Per the FBI UCR Guidelines Homicide, Rape and Aggravated Assault are counted by victim. All other crimes are counted by incident, except Arson which is always counted.2009 Population Source: LA County Internal Services Department (based on the 2000 US Census and CA Department of Finance estimates).2013 Population Source: LA County Internal Services Department (based on the 2010 US Census and CA Department of Finance estimates). 2014 YTD Crime Rates based on 2013 population estimates. 2013 population estimates updated for the city of Santa Clarita and the Santa Clarita Valley Station unincorporated area, due to 2012 year end annexations.Crime counts for patrol station areas only; red depicts +30% increases and green depicts -30% decreases. N/C = Not Calculable
This PRELIMINARY INFORMATION is used on an ongoing basis by the LASD for strategic planning and as a tactical early warning system. This data is not final and thus is not the crime data that is reported to the FBI Uniform Crime Index (UCI). This is because some of the most recent reports have not been written yet, nor reviewed by investigators. Once it is reported by investigators and supervisors, the crime data is reported to the FBI/UCI and is available via the pertinent LASD patrol station, pending publication by the FBI/UCI. Once it is reported by the LASD to the FBI, the FBI/UCI crime data is considered the most accurate.
BRADBURYDUARTEROSEMEADSOUTH EL MONTETEMPLE CITYUNINCORPORATED
AVALONUNINCORPORATED
CARSONUNINCORPORATED
LYNWOODUNINCORPORATED
COMPTONUNINCORPORATED
LOMITARANCHO PALOS VERDESROLLING HILLSROLLING HILLS ESTATESUNINCORPORATED
0 21 60 29 19 41
10 0
130 40
177 308
427 77
26 16 2 4 7
0 53
120 78 37
100
24 0
334 96
393 741
880 151
68 30 2
10 13
0 7
27 16 13 35
1 0
94 27
100 262
368 50
19 6 0 1 1
1 22 82 49 33 91
8 1
238 58
237 662
860 142
52 19 0 2 7
2 12 41 35 10 37
5 1
90 29
100 236
269 45
21 3 0 1 4
09.07
10.4712.995.356.68
28.670
13.2517.77
24.1923.05
42.8431.69
12.343.73
10.194.97
17.77
03.285.027.953.666.06
2.680
10.2511.11
14.3322.26
38.1522.76
9.381.44
01.243.21
19.085.637.6317.42.816.4
13.4127.17
9.8111.94
14.3320.05
27.8920.48
10.37.720
1.2412.84
0.0%-37.9%-27.1% 34.0%-47.5%-4.2%
-53.2% 0.0%
-26.0%-32.8%
-40.8%-13.0%
-34.9%-35.4%
-16.0%-80.7% 0.0%
-75.1%-27.7%
0.0% 71.7% 52.0%
118.9%-23.2% 5.6%
400.4% 0.0%
-4.3% 7.5%
0.0%-9.9%
-26.9%-10.0%
10.6%-50.0% 0.0% 0.0%
300.0%
TEMPLE
AVALON
CARSON
CENTURY
COMPTON
LOMITA
AGGRAVATED ASSAULT YTDReported
YTDCrime Rate
TotalReportedIncidents
YTDReported
YTDCrime Rate
TotalReportedIncidents
YTDReported
YTDCrime Rate
5 YearChange inYTD Crime
Rate
1 YearChange inYTD Crime
Rate
2009 2013 2014
2014/2009 2014/2013
STATION TOTAL
STATION TOTAL
STATION TOTAL
STATION TOTAL
STATION TOTAL
STATION TOTAL
170
10
170
485
504
55
388
24
430
1134
1031
123
98
1
121
362
418
27
278
9
296
899
1002
80
137
6
119
336
314
29
8.48
24.55
14.09
23.45
40.66
7.06
5.17
2.44
10.43
19.31
35.3
3.6
7.23
14.65
10.26
17.92
26.51
3.87
-14.74
-40.33
-27.18
-23.58
-34.8
-45.18
39.85%
500.41%
-1.63%
-7.20%
-24.90%
7.50%
2009 2013
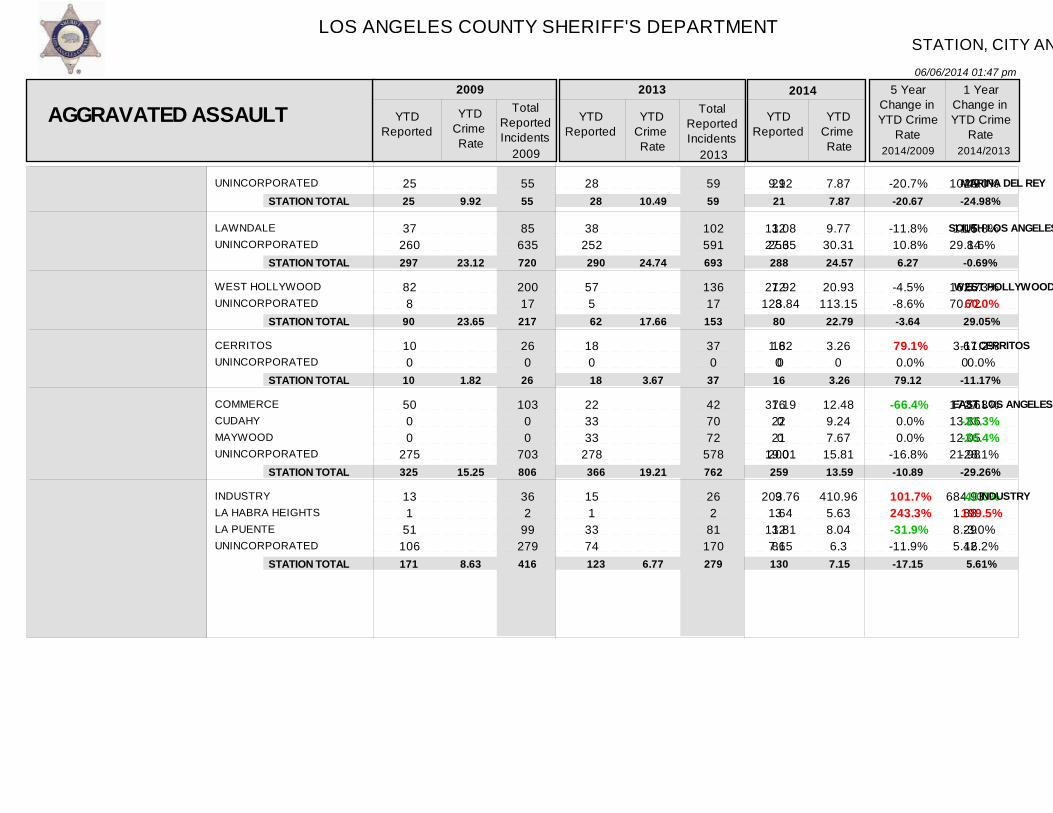
LOS ANGELES COUNTY SHERIFF'S DEPARTMENT
06/06/2014 01:47 pm
STATION, CITY AND UNINCORPORATED AREA PART I CRIME DETAIL
Ver: 10.02.19.2013.0
YTD 05/31/2014 - PART I CRIME RATE PER 10,000 POPULATION
15Page
- PRELIMINARY DATA
Per the FBI UCR Guidelines Homicide, Rape and Aggravated Assault are counted by victim. All other crimes are counted by incident, except Arson which is always counted.2009 Population Source: LA County Internal Services Department (based on the 2000 US Census and CA Department of Finance estimates).2013 Population Source: LA County Internal Services Department (based on the 2010 US Census and CA Department of Finance estimates). 2014 YTD Crime Rates based on 2013 population estimates. 2013 population estimates updated for the city of Santa Clarita and the Santa Clarita Valley Station unincorporated area, due to 2012 year end annexations.Crime counts for patrol station areas only; red depicts +30% increases and green depicts -30% decreases. N/C = Not Calculable
This PRELIMINARY INFORMATION is used on an ongoing basis by the LASD for strategic planning and as a tactical early warning system. This data is not final and thus is not the crime data that is reported to the FBI Uniform Crime Index (UCI). This is because some of the most recent reports have not been written yet, nor reviewed by investigators. Once it is reported by investigators and supervisors, the crime data is reported to the FBI/UCI and is available via the pertinent LASD patrol station, pending publication by the FBI/UCI. Once it is reported by the LASD to the FBI, the FBI/UCI crime data is considered the most accurate.
UNINCORPORATED
LAWNDALEUNINCORPORATED
WEST HOLLYWOODUNINCORPORATED
CERRITOSUNINCORPORATED
COMMERCECUDAHYMAYWOODUNINCORPORATED
INDUSTRYLA HABRA HEIGHTSLA PUENTEUNINCORPORATED
25
37 260
82 8
10 0
50 0 0
275
13 1
51 106
55
85 635
200 17
26 0
103 0 0
703
36 2
99 279
28
38 252
57 5
18 0
22 33 33
278
15 1
33 74
59
102 591
136 17
37 0
42 70 72
578
26 2
81 170
21
32 256
72 8
16 0
16 22 21
200
9 3
32 86
9.92
11.0827.35
21.92123.84
1.820
37.1900
19.01
203.761.64
11.817.15
10.49
11.629.84
16.5770.72
3.670
17.1613.8612.0521.98
684.931.888.295.42
7.87
9.7730.31
20.93113.15
3.260
12.489.247.67
15.81
410.965.638.046.3
-20.7%
-11.8% 10.8%
-4.5%-8.6%
79.1% 0.0%
-66.4% 0.0% 0.0%
-16.8%
101.7% 243.3%-31.9%-11.9%
-25.0%
-15.8% 1.6%
26.3% 60.0%
-11.2% 0.0%
-27.3%-33.3%-36.4%-28.1%
-40.0% 199.5%-3.0% 16.2%
MARINA DEL REY
SOUTH LOS ANGELES
WEST HOLLYWOOD
CERRITOS
EAST LOS ANGELES
INDUSTRY
AGGRAVATED ASSAULT YTDReported
YTDCrime Rate
TotalReportedIncidents
YTDReported
YTDCrime Rate
TotalReportedIncidents
YTDReported
YTDCrime Rate
5 YearChange inYTD Crime
Rate
1 YearChange inYTD Crime
Rate
2009 2013 2014
2014/2009 2014/2013
STATION TOTAL
STATION TOTAL
STATION TOTAL
STATION TOTAL
STATION TOTAL
STATION TOTAL
25
297
90
10
325
171
55
720
217
26
806
416
28
290
62
18
366
123
59
693
153
37
762
279
21
288
80
16
259
130
9.92
23.12
23.65
1.82
15.25
8.63
10.49
24.74
17.66
3.67
19.21
6.77
7.87
24.57
22.79
3.26
13.59
7.15
-20.67
6.27
-3.64
79.12
-10.89
-17.15
-24.98%
-0.69%
29.05%
-11.17%
-29.26%
5.61%
2009 2013

LOS ANGELES COUNTY SHERIFF'S DEPARTMENT
06/06/2014 01:47 pm
STATION, CITY AND UNINCORPORATED AREA PART I CRIME DETAIL
Ver: 10.02.19.2013.0
YTD 05/31/2014 - PART I CRIME RATE PER 10,000 POPULATION
16Page
- PRELIMINARY DATA
Per the FBI UCR Guidelines Homicide, Rape and Aggravated Assault are counted by victim. All other crimes are counted by incident, except Arson which is always counted.2009 Population Source: LA County Internal Services Department (based on the 2000 US Census and CA Department of Finance estimates).2013 Population Source: LA County Internal Services Department (based on the 2010 US Census and CA Department of Finance estimates). 2014 YTD Crime Rates based on 2013 population estimates. 2013 population estimates updated for the city of Santa Clarita and the Santa Clarita Valley Station unincorporated area, due to 2012 year end annexations.Crime counts for patrol station areas only; red depicts +30% increases and green depicts -30% decreases. N/C = Not Calculable
This PRELIMINARY INFORMATION is used on an ongoing basis by the LASD for strategic planning and as a tactical early warning system. This data is not final and thus is not the crime data that is reported to the FBI Uniform Crime Index (UCI). This is because some of the most recent reports have not been written yet, nor reviewed by investigators. Once it is reported by investigators and supervisors, the crime data is reported to the FBI/UCI and is available via the pertinent LASD patrol station, pending publication by the FBI/UCI. Once it is reported by the LASD to the FBI, the FBI/UCI crime data is considered the most accurate.
ARTESIABELLFLOWERHAWAIIAN GARDENSLAKEWOODPARAMOUNTUNINCORPORATED
LA MIRADANORWALKUNINCORPORATED
PICO RIVERAUNINCORPORATED
SAN DIMASUNINCORPORATED
DIAMOND BARWALNUTUNINCORPORATED
11 130 19 64 68 0
27 106 51
42 40
22 34
24 11 37
25 293 44
171 174
0
54 247 122
106 86
59 103
42 19 74
10 75 18 40 33 0
19 102 26
57 37
16 42
16 9
32
33 172 31
101 97 1
48 235 89
140 78
44 106
35 26 54
10 66 10 52 51 0
27 73 34
75 18
12 42
19 12 33
6.216.8811.967.68
11.760
5.469.66
7
6.2711.38
5.965.64
4.013.396.6
6.059.79
12.635
6.10
3.929.663.89
9.0612.03
4.798.75
2.883.096.06
6.058.617.026.5
9.430
5.566.925.08
11.925.85
3.68.75
3.424.116.25
-2.4%-49.0%-41.3%-15.4%-19.8% 0.0%
1.8%-28.4%-27.4%
90.1%-48.6%
-39.6% 55.1%
-14.7% 21.2%-5.3%
0.0%-12.1%-44.4% 30.0% 54.6% 0.0%
41.8%-28.4% 30.6%
31.6%-51.4%
-24.8% 0.0%
18.8% 33.0% 3.1%
LAKEWOOD
NORWALK
PICO RIVERA
SAN DIMAS
WALNUT
AGGRAVATED ASSAULT YTDReported
YTDCrime Rate
TotalReportedIncidents
YTDReported
YTDCrime Rate
TotalReportedIncidents
YTDReported
YTDCrime Rate
5 YearChange inYTD Crime
Rate
1 YearChange inYTD Crime
Rate
2009 2013 2014
2014/2009 2014/2013
STATION TOTAL
STATION TOTAL
STATION TOTAL
STATION TOTAL
STATION TOTAL
292
184
82
56
72
707
423
192
162
135
176
147
94
58
57
435
372
218
150
115
189
134
93
54
64
11.52
7.93
8.02
5.76
4.86
7.22
6.65
10.03
7.13
4.14
7.75
6.06
9.93
6.64
4.65
-32.73
-23.58
23.82
15.28
-4.32
7.34%
-8.87%
-1.00%
-6.87%
12.32%
2009 2013
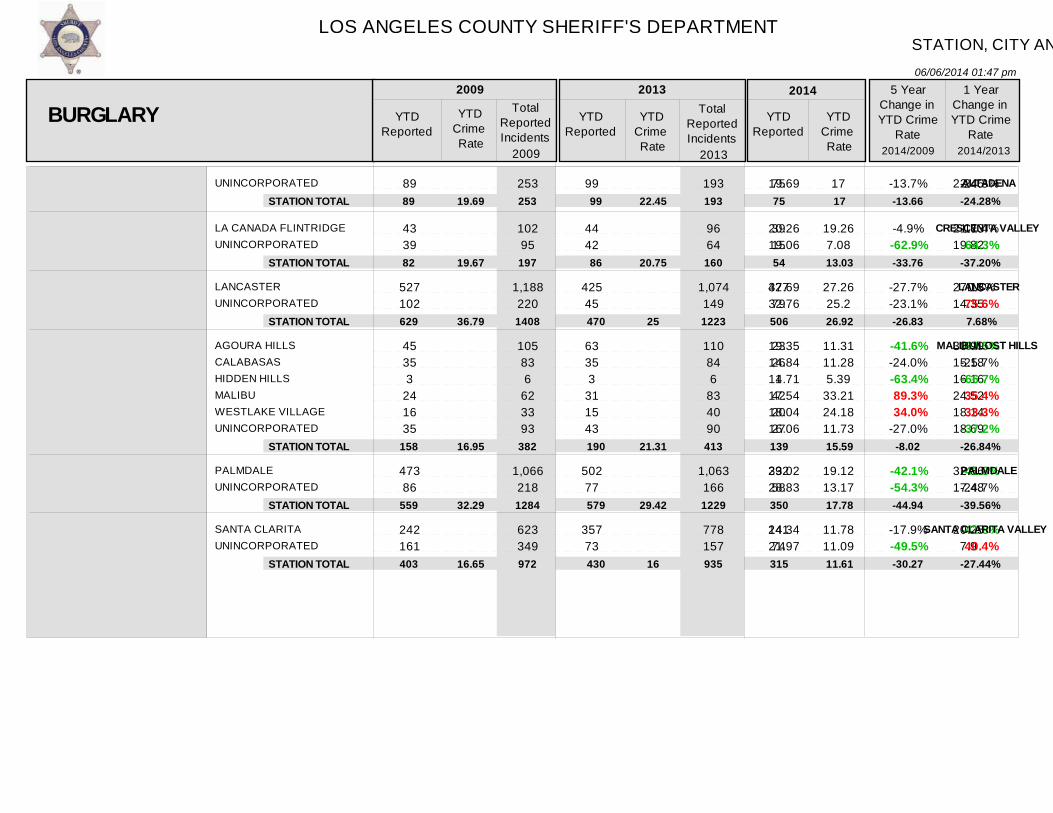
LOS ANGELES COUNTY SHERIFF'S DEPARTMENT
06/06/2014 01:47 pm
STATION, CITY AND UNINCORPORATED AREA PART I CRIME DETAIL
Ver: 10.02.19.2013.0
YTD 05/31/2014 - PART I CRIME RATE PER 10,000 POPULATION
17Page
- PRELIMINARY DATA
Per the FBI UCR Guidelines Homicide, Rape and Aggravated Assault are counted by victim. All other crimes are counted by incident, except Arson which is always counted.2009 Population Source: LA County Internal Services Department (based on the 2000 US Census and CA Department of Finance estimates).2013 Population Source: LA County Internal Services Department (based on the 2010 US Census and CA Department of Finance estimates). 2014 YTD Crime Rates based on 2013 population estimates. 2013 population estimates updated for the city of Santa Clarita and the Santa Clarita Valley Station unincorporated area, due to 2012 year end annexations.Crime counts for patrol station areas only; red depicts +30% increases and green depicts -30% decreases. N/C = Not Calculable
This PRELIMINARY INFORMATION is used on an ongoing basis by the LASD for strategic planning and as a tactical early warning system. This data is not final and thus is not the crime data that is reported to the FBI Uniform Crime Index (UCI). This is because some of the most recent reports have not been written yet, nor reviewed by investigators. Once it is reported by investigators and supervisors, the crime data is reported to the FBI/UCI and is available via the pertinent LASD patrol station, pending publication by the FBI/UCI. Once it is reported by the LASD to the FBI, the FBI/UCI crime data is considered the most accurate.
UNINCORPORATED
LA CANADA FLINTRIDGEUNINCORPORATED
LANCASTERUNINCORPORATED
AGOURA HILLSCALABASASHIDDEN HILLSMALIBUWESTLAKE VILLAGEUNINCORPORATED
PALMDALEUNINCORPORATED
SANTA CLARITAUNINCORPORATED
89
43 39
527 102
45 35 3
24 16 35
473 86
242 161
253
102 95
1,188 220
105 83 6
62 33 93
1,066 218
623 349
99
44 42
425 45
63 35 3
31 15 43
502 77
357 73
193
96 64
1,074 149
110 84 6
83 40 90
1,063 166
778 157
75
39 15
427 79
23 26 1
42 20 27
292 58
241 74
19.69
20.2619.06
37.6932.76
19.3514.8414.7117.5418.0416.06
33.0228.83
14.3421.97
22.45
21.7319.82
27.1314.35
30.9915.1816.1624.5218.1418.69
32.8617.48
20.257.9
17
19.267.08
27.2625.2
11.3111.285.39
33.2124.1811.73
19.1213.17
11.7811.09
-13.7%
-4.9%-62.9%
-27.7%-23.1%
-41.6%-24.0%-63.4% 89.3% 34.0%-27.0%
-42.1%-54.3%
-17.9%-49.5%
-24.3%
-11.4%-64.3%
0.5% 75.6%
-63.5%-25.7%-66.7% 35.4% 33.3%-37.2%
-41.8%-24.7%
-41.8% 40.4%
ALTADENA
CRESCENTA VALLEY
LANCASTER
MALIBU/LOST HILLS
PALMDALE
SANTA CLARITA VALLEY
BURGLARY YTDReported
YTDCrime Rate
TotalReportedIncidents
YTDReported
YTDCrime Rate
TotalReportedIncidents
YTDReported
YTDCrime Rate
5 YearChange inYTD Crime
Rate
1 YearChange inYTD Crime
Rate
2009 2013 2014
2014/2009 2014/2013
STATION TOTAL
STATION TOTAL
STATION TOTAL
STATION TOTAL
STATION TOTAL
STATION TOTAL
89
82
629
158
559
403
253
197
1408
382
1284
972
99
86
470
190
579
430
193
160
1223
413
1229
935
75
54
506
139
350
315
19.69
19.67
36.79
16.95
32.29
16.65
22.45
20.75
25
21.31
29.42
16
17
13.03
26.92
15.59
17.78
11.61
-13.66
-33.76
-26.83
-8.02
-44.94
-30.27
-24.28%
-37.20%
7.68%
-26.84%
-39.56%
-27.44%
2009 2013
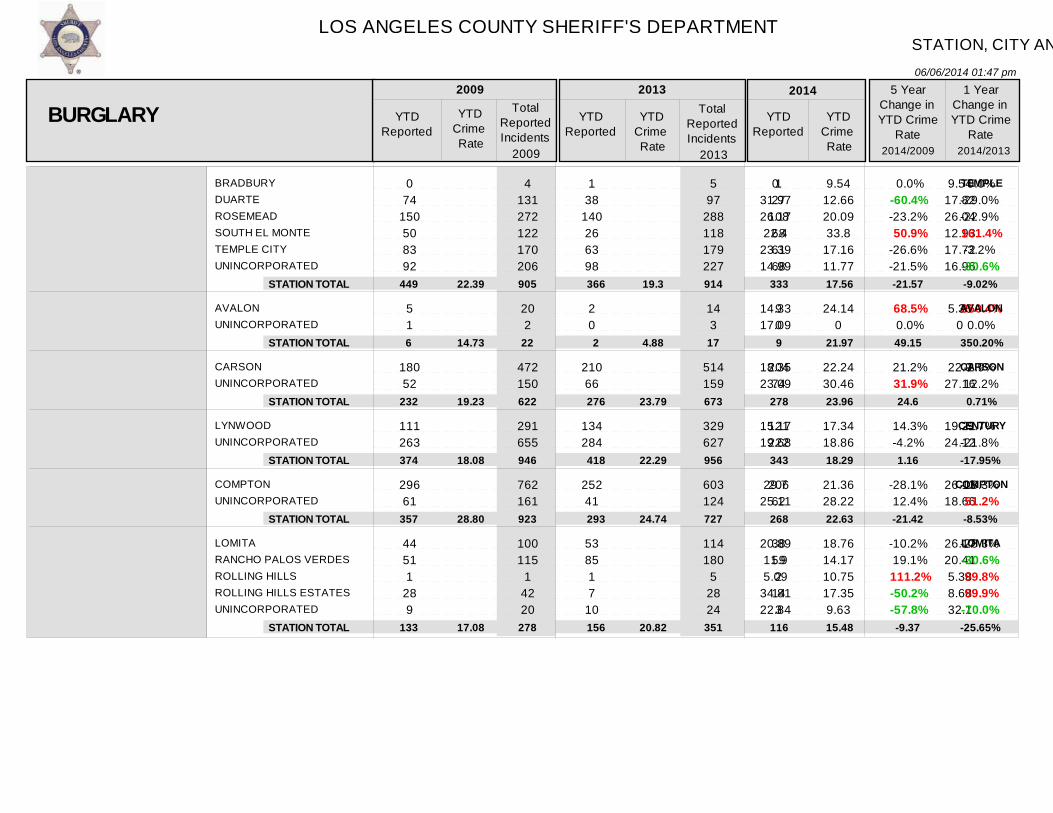
LOS ANGELES COUNTY SHERIFF'S DEPARTMENT
06/06/2014 01:47 pm
STATION, CITY AND UNINCORPORATED AREA PART I CRIME DETAIL
Ver: 10.02.19.2013.0
YTD 05/31/2014 - PART I CRIME RATE PER 10,000 POPULATION
18Page
- PRELIMINARY DATA
Per the FBI UCR Guidelines Homicide, Rape and Aggravated Assault are counted by victim. All other crimes are counted by incident, except Arson which is always counted.2009 Population Source: LA County Internal Services Department (based on the 2000 US Census and CA Department of Finance estimates).2013 Population Source: LA County Internal Services Department (based on the 2010 US Census and CA Department of Finance estimates). 2014 YTD Crime Rates based on 2013 population estimates. 2013 population estimates updated for the city of Santa Clarita and the Santa Clarita Valley Station unincorporated area, due to 2012 year end annexations.Crime counts for patrol station areas only; red depicts +30% increases and green depicts -30% decreases. N/C = Not Calculable
This PRELIMINARY INFORMATION is used on an ongoing basis by the LASD for strategic planning and as a tactical early warning system. This data is not final and thus is not the crime data that is reported to the FBI Uniform Crime Index (UCI). This is because some of the most recent reports have not been written yet, nor reviewed by investigators. Once it is reported by investigators and supervisors, the crime data is reported to the FBI/UCI and is available via the pertinent LASD patrol station, pending publication by the FBI/UCI. Once it is reported by the LASD to the FBI, the FBI/UCI crime data is considered the most accurate.
BRADBURYDUARTEROSEMEADSOUTH EL MONTETEMPLE CITYUNINCORPORATED
AVALONUNINCORPORATED
CARSONUNINCORPORATED
LYNWOODUNINCORPORATED
COMPTONUNINCORPORATED
LOMITARANCHO PALOS VERDESROLLING HILLSROLLING HILLS ESTATESUNINCORPORATED
0 74
150 50 83 92
5 1
180 52
111 263
296 61
44 51 1
28 9
4 131 272 122 170 206
20 2
472 150
291 655
762 161
100 115
1 42 20
1 38
140 26 63 98
2 0
210 66
134 284
252 41
53 85 1 7
10
5 97
288 118 179 227
14 3
514 159
329 627
603 124
114 180
5 28 24
1 27
108 68 61 68
9 0
204 74
121 222
206 62
38 59 2
14 3
031.9726.1722.4
23.3914.99
14.3317.09
18.3523.09
15.1719.68
29.725.11
20.8911.95.09
34.8122.84
9.5417.8226.0412.9317.7216.96
5.360
22.927.16
19.2124.12
26.1318.66
26.1720.415.388.6832.1
9.5412.6620.0933.8
17.1611.77
24.140
22.2430.46
17.3418.86
21.3628.22
18.7614.1710.7517.359.63
0.0%-60.4%-23.2% 50.9%-26.6%-21.5%
68.5% 0.0%
21.2% 31.9%
14.3%-4.2%
-28.1% 12.4%
-10.2% 19.1% 111.2%-50.2%-57.8%
0.0%-29.0%-22.9% 161.4%-3.2%-30.6%
350.4% 0.0%
-2.9% 12.2%
-9.7%-21.8%
-18.3% 51.2%
-28.3%-30.6% 99.8% 99.9%-70.0%
TEMPLE
AVALON
CARSON
CENTURY
COMPTON
LOMITA
BURGLARY YTDReported
YTDCrime Rate
TotalReportedIncidents
YTDReported
YTDCrime Rate
TotalReportedIncidents
YTDReported
YTDCrime Rate
5 YearChange inYTD Crime
Rate
1 YearChange inYTD Crime
Rate
2009 2013 2014
2014/2009 2014/2013
STATION TOTAL
STATION TOTAL
STATION TOTAL
STATION TOTAL
STATION TOTAL
STATION TOTAL
449
6
232
374
357
133
905
22
622
946
923
278
366
2
276
418
293
156
914
17
673
956
727
351
333
9
278
343
268
116
22.39
14.73
19.23
18.08
28.80
17.08
19.3
4.88
23.79
22.29
24.74
20.82
17.56
21.97
23.96
18.29
22.63
15.48
-21.57
49.15
24.6
1.16
-21.42
-9.37
-9.02%
350.20%
0.71%
-17.95%
-8.53%
-25.65%
2009 2013
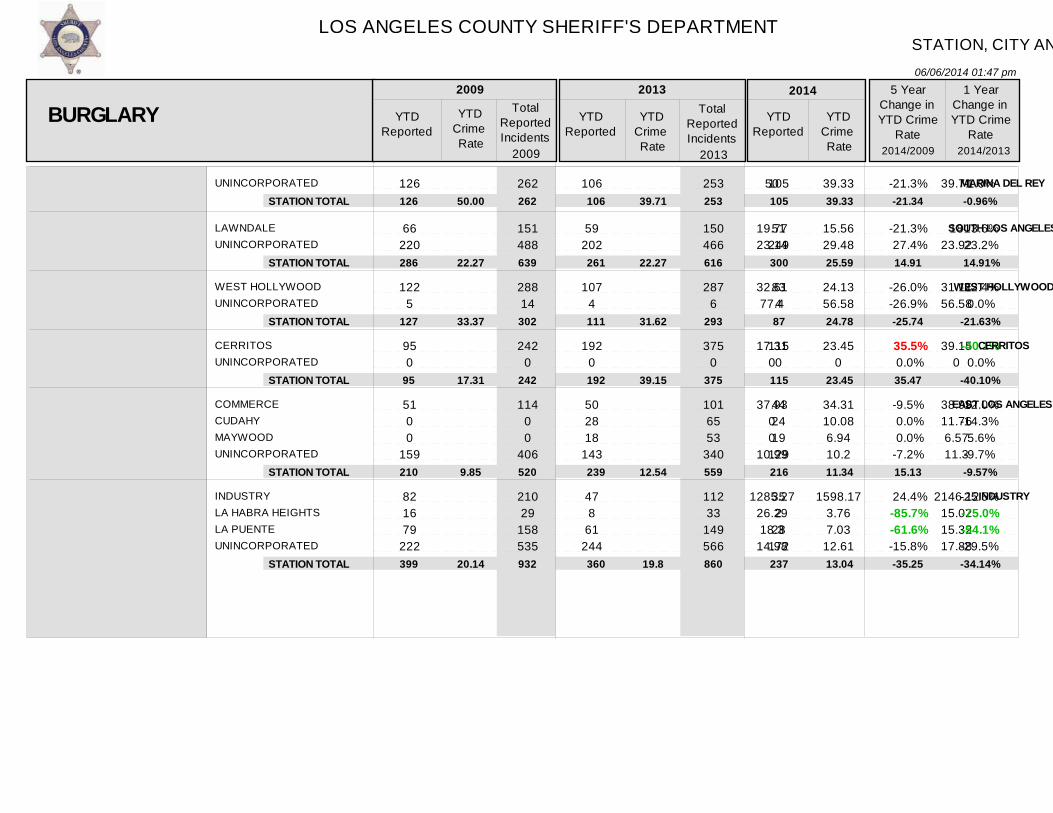
LOS ANGELES COUNTY SHERIFF'S DEPARTMENT
06/06/2014 01:47 pm
STATION, CITY AND UNINCORPORATED AREA PART I CRIME DETAIL
Ver: 10.02.19.2013.0
YTD 05/31/2014 - PART I CRIME RATE PER 10,000 POPULATION
19Page
- PRELIMINARY DATA
Per the FBI UCR Guidelines Homicide, Rape and Aggravated Assault are counted by victim. All other crimes are counted by incident, except Arson which is always counted.2009 Population Source: LA County Internal Services Department (based on the 2000 US Census and CA Department of Finance estimates).2013 Population Source: LA County Internal Services Department (based on the 2010 US Census and CA Department of Finance estimates). 2014 YTD Crime Rates based on 2013 population estimates. 2013 population estimates updated for the city of Santa Clarita and the Santa Clarita Valley Station unincorporated area, due to 2012 year end annexations.Crime counts for patrol station areas only; red depicts +30% increases and green depicts -30% decreases. N/C = Not Calculable
This PRELIMINARY INFORMATION is used on an ongoing basis by the LASD for strategic planning and as a tactical early warning system. This data is not final and thus is not the crime data that is reported to the FBI Uniform Crime Index (UCI). This is because some of the most recent reports have not been written yet, nor reviewed by investigators. Once it is reported by investigators and supervisors, the crime data is reported to the FBI/UCI and is available via the pertinent LASD patrol station, pending publication by the FBI/UCI. Once it is reported by the LASD to the FBI, the FBI/UCI crime data is considered the most accurate.
UNINCORPORATED
LAWNDALEUNINCORPORATED
WEST HOLLYWOODUNINCORPORATED
CERRITOSUNINCORPORATED
COMMERCECUDAHYMAYWOODUNINCORPORATED
INDUSTRYLA HABRA HEIGHTSLA PUENTEUNINCORPORATED
126
66 220
122 5
95 0
51 0 0
159
82 16 79
222
262
151 488
288 14
242 0
114 0 0
406
210 29
158 535
106
59 202
107 4
192 0
50 28 18
143
47 8
61 244
253
150 466
287 6
375 0
101 65 53
340
112 33
149 566
105
51 249
83 4
115 0
44 24 19
129
35 2
28 172
50
19.7723.14
32.6177.4
17.310
37.9300
10.99
1285.2726.2918.3
14.98
39.71
1823.92
31.1156.58
39.150
38.9911.766.5711.3
2146.1215.0215.3217.88
39.33
15.5629.48
24.1356.58
23.450
34.3110.086.9410.2
1598.173.767.03
12.61
-21.3%
-21.3% 27.4%
-26.0%-26.9%
35.5% 0.0%
-9.5% 0.0% 0.0%-7.2%
24.4%-85.7%-61.6%-15.8%
-1.0%
-13.6% 23.2%
-22.4% 0.0%
-40.1% 0.0%
-12.0%-14.3% 5.6%-9.7%
-25.5%-75.0%-54.1%-29.5%
MARINA DEL REY
SOUTH LOS ANGELES
WEST HOLLYWOOD
CERRITOS
EAST LOS ANGELES
INDUSTRY
BURGLARY YTDReported
YTDCrime Rate
TotalReportedIncidents
YTDReported
YTDCrime Rate
TotalReportedIncidents
YTDReported
YTDCrime Rate
5 YearChange inYTD Crime
Rate
1 YearChange inYTD Crime
Rate
2009 2013 2014
2014/2009 2014/2013
STATION TOTAL
STATION TOTAL
STATION TOTAL
STATION TOTAL
STATION TOTAL
STATION TOTAL
126
286
127
95
210
399
262
639
302
242
520
932
106
261
111
192
239
360
253
616
293
375
559
860
105
300
87
115
216
237
50.00
22.27
33.37
17.31
9.85
20.14
39.71
22.27
31.62
39.15
12.54
19.8
39.33
25.59
24.78
23.45
11.34
13.04
-21.34
14.91
-25.74
35.47
15.13
-35.25
-0.96%
14.91%
-21.63%
-40.10%
-9.57%
-34.14%
2009 2013
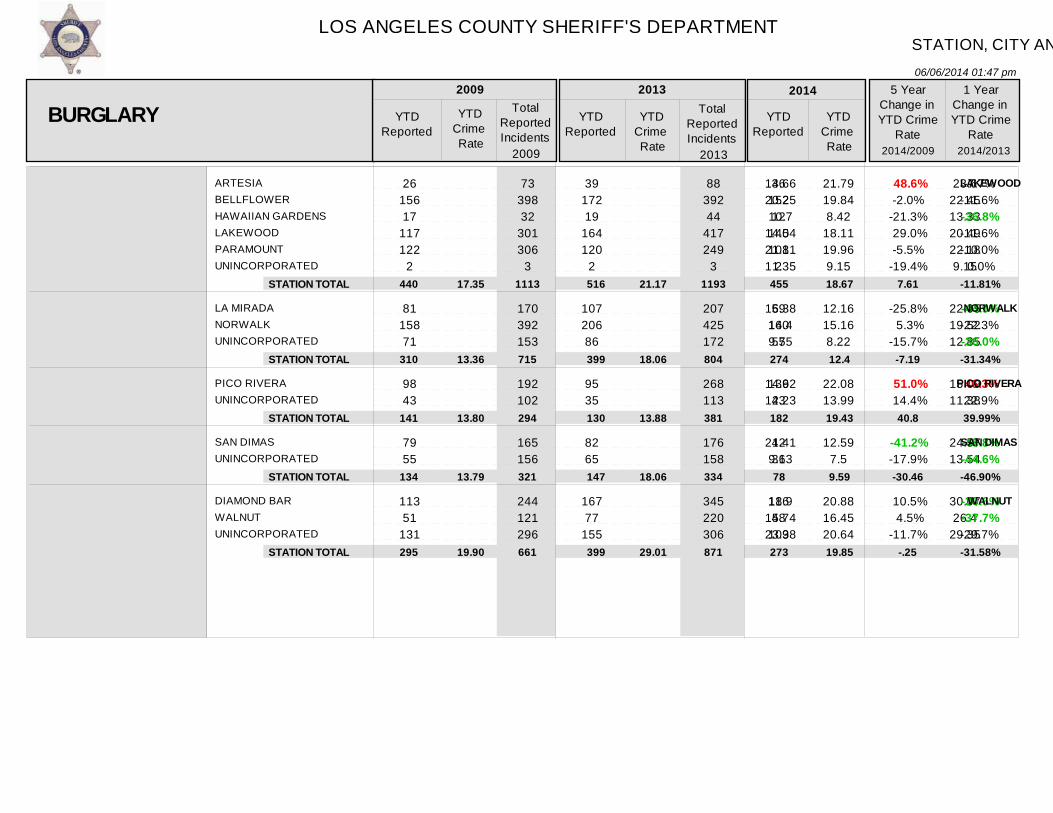
LOS ANGELES COUNTY SHERIFF'S DEPARTMENT
06/06/2014 01:47 pm
STATION, CITY AND UNINCORPORATED AREA PART I CRIME DETAIL
Ver: 10.02.19.2013.0
YTD 05/31/2014 - PART I CRIME RATE PER 10,000 POPULATION
20Page
- PRELIMINARY DATA
Per the FBI UCR Guidelines Homicide, Rape and Aggravated Assault are counted by victim. All other crimes are counted by incident, except Arson which is always counted.2009 Population Source: LA County Internal Services Department (based on the 2000 US Census and CA Department of Finance estimates).2013 Population Source: LA County Internal Services Department (based on the 2010 US Census and CA Department of Finance estimates). 2014 YTD Crime Rates based on 2013 population estimates. 2013 population estimates updated for the city of Santa Clarita and the Santa Clarita Valley Station unincorporated area, due to 2012 year end annexations.Crime counts for patrol station areas only; red depicts +30% increases and green depicts -30% decreases. N/C = Not Calculable
This PRELIMINARY INFORMATION is used on an ongoing basis by the LASD for strategic planning and as a tactical early warning system. This data is not final and thus is not the crime data that is reported to the FBI Uniform Crime Index (UCI). This is because some of the most recent reports have not been written yet, nor reviewed by investigators. Once it is reported by investigators and supervisors, the crime data is reported to the FBI/UCI and is available via the pertinent LASD patrol station, pending publication by the FBI/UCI. Once it is reported by the LASD to the FBI, the FBI/UCI crime data is considered the most accurate.
ARTESIABELLFLOWERHAWAIIAN GARDENSLAKEWOODPARAMOUNTUNINCORPORATED
LA MIRADANORWALKUNINCORPORATED
PICO RIVERAUNINCORPORATED
SAN DIMASUNINCORPORATED
DIAMOND BARWALNUTUNINCORPORATED
26 156 17
117 122
2
81 158 71
98 43
79 55
113 51
131
73 398 32
301 306
3
170 392 153
192 102
165 156
244 121 296
39 172 19
164 120
2
107 206 86
95 35
82 65
167 77
155
88 392 44
417 249
3
207 425 172
268 113
176 158
345 220 306
36 152 12
145 108
2
59 160 55
139 43
42 36
116 48
109
14.6620.2510.7
14.0421.1111.35
16.3814.49.75
14.6212.23
21.419.13
18.915.7423.38
23.622.4513.3320.4922.189.15
22.0519.5212.85
15.0911.38
24.5713.54
30.0726.4
29.35
21.7919.848.42
18.1119.969.15
12.1615.168.22
22.0813.99
12.597.5
20.8816.4520.64
48.6%-2.0%
-21.3% 29.0%-5.5%
-19.4%
-25.8% 5.3%
-15.7%
51.0% 14.4%
-41.2%-17.9%
10.5% 4.5%
-11.7%
-7.7%-11.6%-36.8%-11.6%-10.0% 0.0%
-44.9%-22.3%-36.0%
46.3% 22.9%
-48.8%-44.6%
-30.6%-37.7%-29.7%
LAKEWOOD
NORWALK
PICO RIVERA
SAN DIMAS
WALNUT
BURGLARY YTDReported
YTDCrime Rate
TotalReportedIncidents
YTDReported
YTDCrime Rate
TotalReportedIncidents
YTDReported
YTDCrime Rate
5 YearChange inYTD Crime
Rate
1 YearChange inYTD Crime
Rate
2009 2013 2014
2014/2009 2014/2013
STATION TOTAL
STATION TOTAL
STATION TOTAL
STATION TOTAL
STATION TOTAL
440
310
141
134
295
1113
715
294
321
661
516
399
130
147
399
1193
804
381
334
871
455
274
182
78
273
17.35
13.36
13.80
13.79
19.90
21.17
18.06
13.88
18.06
29.01
18.67
12.4
19.43
9.59
19.85
7.61
-7.19
40.8
-30.46
-.25
-11.81%
-31.34%
39.99%
-46.90%
-31.58%
2009 2013
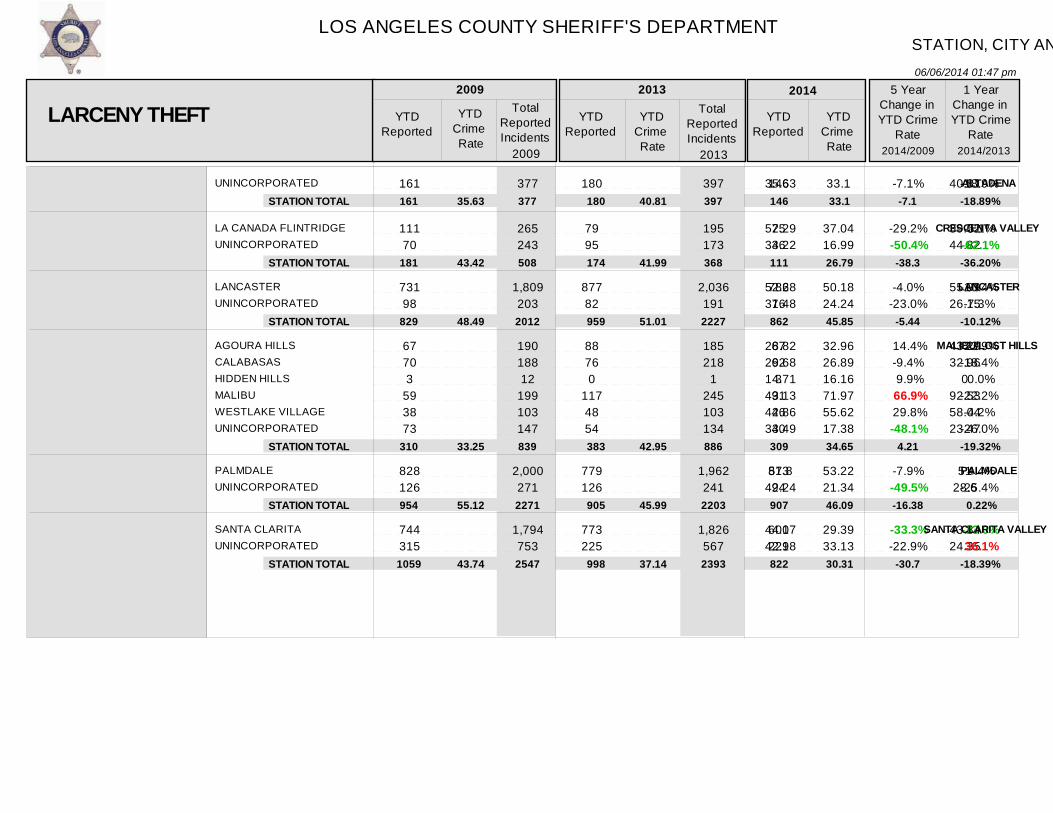
LOS ANGELES COUNTY SHERIFF'S DEPARTMENT
06/06/2014 01:47 pm
STATION, CITY AND UNINCORPORATED AREA PART I CRIME DETAIL
Ver: 10.02.19.2013.0
YTD 05/31/2014 - PART I CRIME RATE PER 10,000 POPULATION
21Page
- PRELIMINARY DATA
Per the FBI UCR Guidelines Homicide, Rape and Aggravated Assault are counted by victim. All other crimes are counted by incident, except Arson which is always counted.2009 Population Source: LA County Internal Services Department (based on the 2000 US Census and CA Department of Finance estimates).2013 Population Source: LA County Internal Services Department (based on the 2010 US Census and CA Department of Finance estimates). 2014 YTD Crime Rates based on 2013 population estimates. 2013 population estimates updated for the city of Santa Clarita and the Santa Clarita Valley Station unincorporated area, due to 2012 year end annexations.Crime counts for patrol station areas only; red depicts +30% increases and green depicts -30% decreases. N/C = Not Calculable
This PRELIMINARY INFORMATION is used on an ongoing basis by the LASD for strategic planning and as a tactical early warning system. This data is not final and thus is not the crime data that is reported to the FBI Uniform Crime Index (UCI). This is because some of the most recent reports have not been written yet, nor reviewed by investigators. Once it is reported by investigators and supervisors, the crime data is reported to the FBI/UCI and is available via the pertinent LASD patrol station, pending publication by the FBI/UCI. Once it is reported by the LASD to the FBI, the FBI/UCI crime data is considered the most accurate.
UNINCORPORATED
LA CANADA FLINTRIDGEUNINCORPORATED
LANCASTERUNINCORPORATED
AGOURA HILLSCALABASASHIDDEN HILLSMALIBUWESTLAKE VILLAGEUNINCORPORATED
PALMDALEUNINCORPORATED
SANTA CLARITAUNINCORPORATED
161
111 70
731 98
67 70 3
59 38 73
828 126
744 315
377
265 243
1,809 203
190 188 12
199 103 147
2,000 271
1,794 753
180
79 95
877 82
88 76 0
117 48 54
779 126
773 225
397
195 173
2,036 191
185 218
1 245 103 134
1,962 241
1,826 567
146
75 36
786 76
67 62 3
91 46 40
813 94
601 221
35.63
52.2934.22
52.2831.48
28.8229.6814.7143.1342.8633.49
57.842.24
44.0742.98
40.81
39.0244.82
55.9926.15
43.2932.96
092.5358.0423.47
5128.6
43.8424.35
33.1
37.0416.99
50.1824.24
32.9626.8916.1671.9755.6217.38
53.2221.34
29.3933.13
-7.1%
-29.2%-50.4%
-4.0%-23.0%
14.4%-9.4% 9.9% 66.9% 29.8%-48.1%
-7.9%-49.5%
-33.3%-22.9%
-18.9%
-5.1%-62.1%
-10.4%-7.3%
-23.9%-18.4% 0.0%
-22.2%-4.2%
-26.0%
4.4%-25.4%
-33.0% 36.1%
ALTADENA
CRESCENTA VALLEY
LANCASTER
MALIBU/LOST HILLS
PALMDALE
SANTA CLARITA VALLEY
LARCENY THEFT YTDReported
YTDCrime Rate
TotalReportedIncidents
YTDReported
YTDCrime Rate
TotalReportedIncidents
YTDReported
YTDCrime Rate
5 YearChange inYTD Crime
Rate
1 YearChange inYTD Crime
Rate
2009 2013 2014
2014/2009 2014/2013
STATION TOTAL
STATION TOTAL
STATION TOTAL
STATION TOTAL
STATION TOTAL
STATION TOTAL
161
181
829
310
954
1059
377
508
2012
839
2271
2547
180
174
959
383
905
998
397
368
2227
886
2203
2393
146
111
862
309
907
822
35.63
43.42
48.49
33.25
55.12
43.74
40.81
41.99
51.01
42.95
45.99
37.14
33.1
26.79
45.85
34.65
46.09
30.31
-7.1
-38.3
-5.44
4.21
-16.38
-30.7
-18.89%
-36.20%
-10.12%
-19.32%
0.22%
-18.39%
2009 2013

LOS ANGELES COUNTY SHERIFF'S DEPARTMENT
06/06/2014 01:47 pm
STATION, CITY AND UNINCORPORATED AREA PART I CRIME DETAIL
Ver: 10.02.19.2013.0
YTD 05/31/2014 - PART I CRIME RATE PER 10,000 POPULATION
22Page
- PRELIMINARY DATA
Per the FBI UCR Guidelines Homicide, Rape and Aggravated Assault are counted by victim. All other crimes are counted by incident, except Arson which is always counted.2009 Population Source: LA County Internal Services Department (based on the 2000 US Census and CA Department of Finance estimates).2013 Population Source: LA County Internal Services Department (based on the 2010 US Census and CA Department of Finance estimates). 2014 YTD Crime Rates based on 2013 population estimates. 2013 population estimates updated for the city of Santa Clarita and the Santa Clarita Valley Station unincorporated area, due to 2012 year end annexations.Crime counts for patrol station areas only; red depicts +30% increases and green depicts -30% decreases. N/C = Not Calculable
This PRELIMINARY INFORMATION is used on an ongoing basis by the LASD for strategic planning and as a tactical early warning system. This data is not final and thus is not the crime data that is reported to the FBI Uniform Crime Index (UCI). This is because some of the most recent reports have not been written yet, nor reviewed by investigators. Once it is reported by investigators and supervisors, the crime data is reported to the FBI/UCI and is available via the pertinent LASD patrol station, pending publication by the FBI/UCI. Once it is reported by the LASD to the FBI, the FBI/UCI crime data is considered the most accurate.
BRADBURYDUARTEROSEMEADSOUTH EL MONTETEMPLE CITYUNINCORPORATED
AVALONUNINCORPORATED
CARSONUNINCORPORATED
LYNWOODUNINCORPORATED
COMPTONUNINCORPORATED
LOMITARANCHO PALOS VERDESROLLING HILLSROLLING HILLS ESTATESUNINCORPORATED
1 118 245 165 99
174
17 2
562 252
198 317
571 72
102 123
3 44 21
6 273 556 352 190 364
52 7
1,375 531
453 795
1,345 197
230 248
7 110 39
3 90
251 63
101 125
11 1
565 181
265 458
465 85
120 157
3 38 21
9 216 617 210 267 392
58 3
1,255 393
660 1,036
1,167 241
233 374
6 85 44
2 84
321 170 118 198
16 0
504 134
273 378
560 111
93 97 6
32 8
10.6650.9842.7573.9227.9
28.35
48.7434.19
57.29111.92
27.0623.72
57.2929.63
48.4228.7
15.2854.7153.3
28.6342.2146.6931.3228.4
21.63
29.5127.17
61.674.49
37.9838.91
48.2138.69
59.2437.7
16.1347.1167.42
19.0839.4
59.7184.5133.1934.27
42.920
54.9555.15
39.1332.11
58.0650.52
45.9123.2932.2639.6725.68
79.0%-22.7% 39.7% 14.3% 19.0% 20.9%
-11.9% 0.0%
-4.1%-50.7%
44.6% 35.4%
1.3% 70.5%
-5.2%-18.9% 111.1%-27.5%-51.8%
-33.4%-6.7% 27.9% 169.8% 16.9% 58.4%
45.4% 0.0%
-10.8%-26.0%
3.0%-17.5%
20.4% 30.6%
-22.5%-38.2%
100.0%-15.8%-61.9%
TEMPLE
AVALON
CARSON
CENTURY
COMPTON
LOMITA
LARCENY THEFT YTDReported
YTDCrime Rate
TotalReportedIncidents
YTDReported
YTDCrime Rate
TotalReportedIncidents
YTDReported
YTDCrime Rate
5 YearChange inYTD Crime
Rate
1 YearChange inYTD Crime
Rate
2009 2013 2014
2014/2009 2014/2013
STATION TOTAL
STATION TOTAL
STATION TOTAL
STATION TOTAL
STATION TOTAL
STATION TOTAL
802
19
814
515
643
293
1741
59
1906
1248
1542
634
633
12
746
723
550
339
1711
61
1648
1696
1408
742
893
16
638
651
671
236
39.98
46.65
67.49
24.90
51.87
37.63
33.39
29.3
64.3
38.56
46.44
45.24
47.1
39.06
54.99
34.72
56.66
31.49
17.81
-16.27
-18.52
39.44
9.23
-16.32
41.06%
33.31%
-14.48%
-9.96%
22.01%
-30.39%
2009 2013
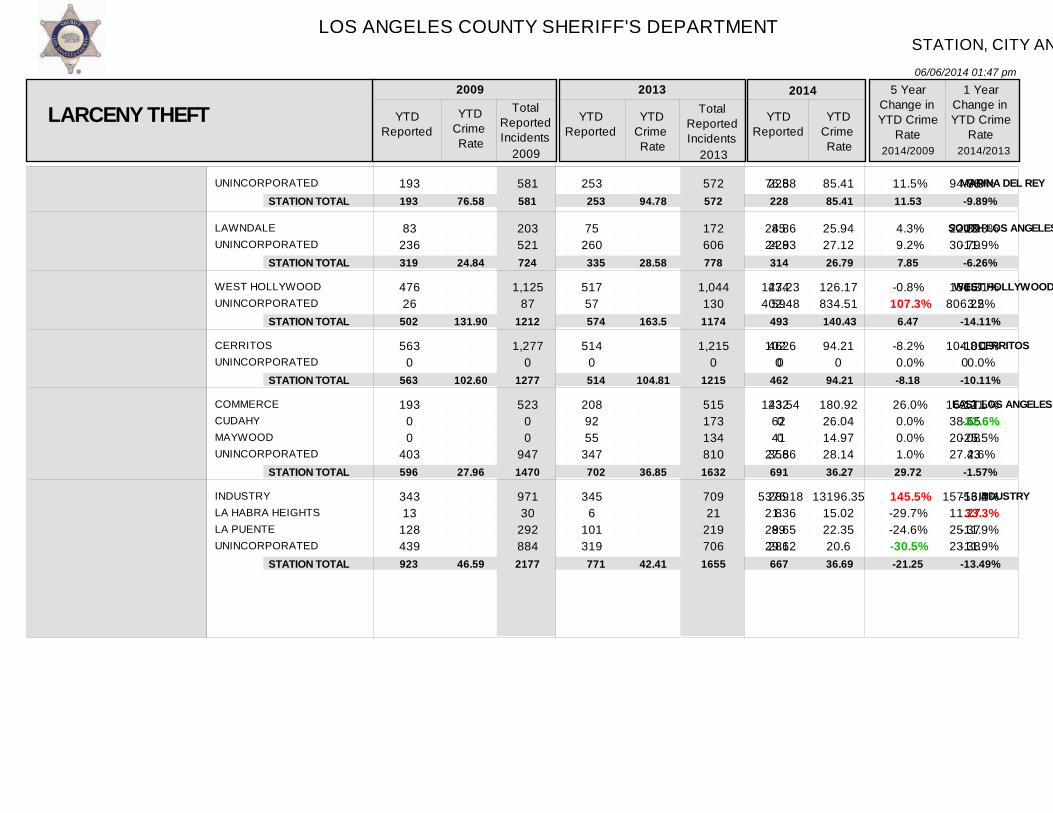
LOS ANGELES COUNTY SHERIFF'S DEPARTMENT
06/06/2014 01:47 pm
STATION, CITY AND UNINCORPORATED AREA PART I CRIME DETAIL
Ver: 10.02.19.2013.0
YTD 05/31/2014 - PART I CRIME RATE PER 10,000 POPULATION
23Page
- PRELIMINARY DATA
Per the FBI UCR Guidelines Homicide, Rape and Aggravated Assault are counted by victim. All other crimes are counted by incident, except Arson which is always counted.2009 Population Source: LA County Internal Services Department (based on the 2000 US Census and CA Department of Finance estimates).2013 Population Source: LA County Internal Services Department (based on the 2010 US Census and CA Department of Finance estimates). 2014 YTD Crime Rates based on 2013 population estimates. 2013 population estimates updated for the city of Santa Clarita and the Santa Clarita Valley Station unincorporated area, due to 2012 year end annexations.Crime counts for patrol station areas only; red depicts +30% increases and green depicts -30% decreases. N/C = Not Calculable
This PRELIMINARY INFORMATION is used on an ongoing basis by the LASD for strategic planning and as a tactical early warning system. This data is not final and thus is not the crime data that is reported to the FBI Uniform Crime Index (UCI). This is because some of the most recent reports have not been written yet, nor reviewed by investigators. Once it is reported by investigators and supervisors, the crime data is reported to the FBI/UCI and is available via the pertinent LASD patrol station, pending publication by the FBI/UCI. Once it is reported by the LASD to the FBI, the FBI/UCI crime data is considered the most accurate.
UNINCORPORATED
LAWNDALEUNINCORPORATED
WEST HOLLYWOODUNINCORPORATED
CERRITOSUNINCORPORATED
COMMERCECUDAHYMAYWOODUNINCORPORATED
INDUSTRYLA HABRA HEIGHTSLA PUENTEUNINCORPORATED
193
83 236
476 26
563 0
193 0 0
403
343 13
128 439
581
203 521
1,125 87
1,277 0
523 0 0
947
971 30
292 884
253
75 260
517 57
514 0
208 92 55
347
345 6
101 319
572
172 606
1,044 130
1,215 0
515 173 134 810
709 21
219 706
228
85 229
434 59
462 0
232 62 41
356
289 8
89 281
76.58
24.8624.83
127.23402.48
102.60
143.5400
27.86
5376.1821.3629.6529.62
94.78
22.8930.79
150.3806.22
104.810
162.2138.6520.0827.43
15753.411.2725.3723.38
85.41
25.9427.12
126.17834.51
94.210
180.9226.0414.9728.14
13196.3515.0222.3520.6
11.5%
4.3% 9.2%
-0.8% 107.3%
-8.2% 0.0%
26.0% 0.0% 0.0% 1.0%
145.5%-29.7%-24.6%-30.5%
-9.9%
13.3%-11.9%
-16.1% 3.5%
-10.1% 0.0%
11.5%-32.6%-25.5% 2.6%
-16.2% 33.3%-11.9%-11.9%
MARINA DEL REY
SOUTH LOS ANGELES
WEST HOLLYWOOD
CERRITOS
EAST LOS ANGELES
INDUSTRY
LARCENY THEFT YTDReported
YTDCrime Rate
TotalReportedIncidents
YTDReported
YTDCrime Rate
TotalReportedIncidents
YTDReported
YTDCrime Rate
5 YearChange inYTD Crime
Rate
1 YearChange inYTD Crime
Rate
2009 2013 2014
2014/2009 2014/2013
STATION TOTAL
STATION TOTAL
STATION TOTAL
STATION TOTAL
STATION TOTAL
STATION TOTAL
193
319
502
563
596
923
581
724
1212
1277
1470
2177
253
335
574
514
702
771
572
778
1174
1215
1632
1655
228
314
493
462
691
667
76.58
24.84
131.90
102.60
27.96
46.59
94.78
28.58
163.5
104.81
36.85
42.41
85.41
26.79
140.43
94.21
36.27
36.69
11.53
7.85
6.47
-8.18
29.72
-21.25
-9.89%
-6.26%
-14.11%
-10.11%
-1.57%
-13.49%
2009 2013
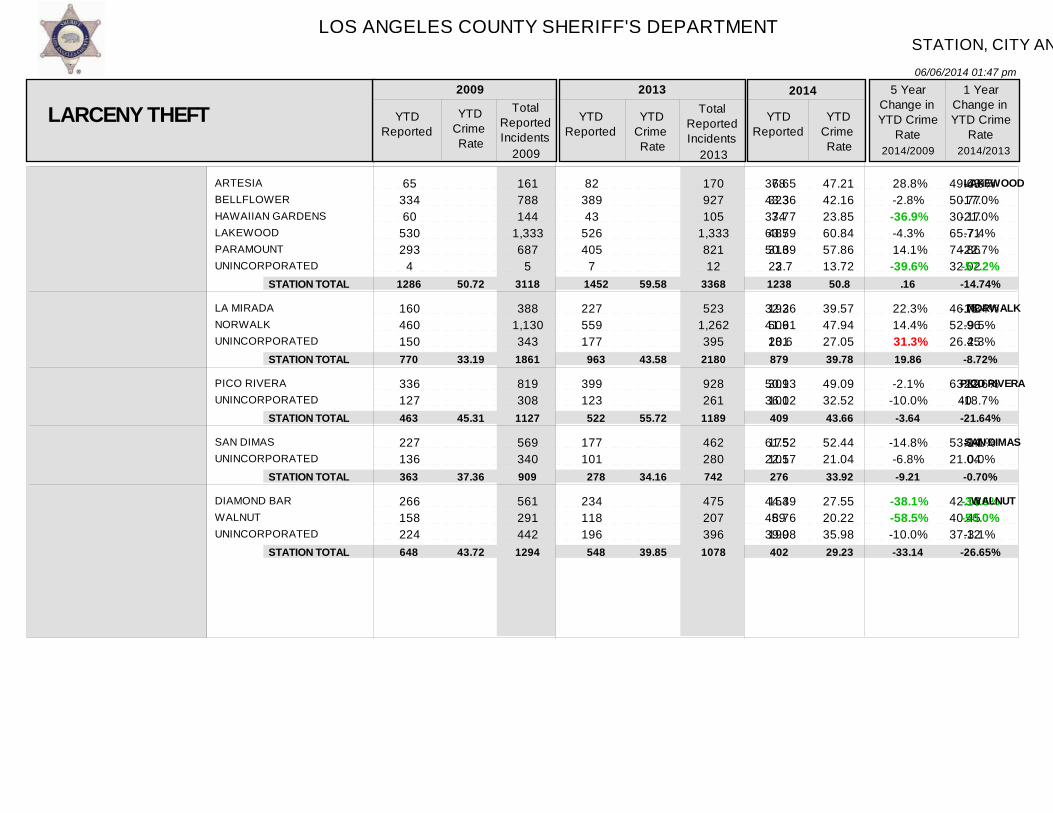
LOS ANGELES COUNTY SHERIFF'S DEPARTMENT
06/06/2014 01:47 pm
STATION, CITY AND UNINCORPORATED AREA PART I CRIME DETAIL
Ver: 10.02.19.2013.0
YTD 05/31/2014 - PART I CRIME RATE PER 10,000 POPULATION
24Page
- PRELIMINARY DATA
Per the FBI UCR Guidelines Homicide, Rape and Aggravated Assault are counted by victim. All other crimes are counted by incident, except Arson which is always counted.2009 Population Source: LA County Internal Services Department (based on the 2000 US Census and CA Department of Finance estimates).2013 Population Source: LA County Internal Services Department (based on the 2010 US Census and CA Department of Finance estimates). 2014 YTD Crime Rates based on 2013 population estimates. 2013 population estimates updated for the city of Santa Clarita and the Santa Clarita Valley Station unincorporated area, due to 2012 year end annexations.Crime counts for patrol station areas only; red depicts +30% increases and green depicts -30% decreases. N/C = Not Calculable
This PRELIMINARY INFORMATION is used on an ongoing basis by the LASD for strategic planning and as a tactical early warning system. This data is not final and thus is not the crime data that is reported to the FBI Uniform Crime Index (UCI). This is because some of the most recent reports have not been written yet, nor reviewed by investigators. Once it is reported by investigators and supervisors, the crime data is reported to the FBI/UCI and is available via the pertinent LASD patrol station, pending publication by the FBI/UCI. Once it is reported by the LASD to the FBI, the FBI/UCI crime data is considered the most accurate.
ARTESIABELLFLOWERHAWAIIAN GARDENSLAKEWOODPARAMOUNTUNINCORPORATED
LA MIRADANORWALKUNINCORPORATED
PICO RIVERAUNINCORPORATED
SAN DIMASUNINCORPORATED
DIAMOND BARWALNUTUNINCORPORATED
65 334 60
530 293
4
160 460 150
336 127
227 136
266 158 224
161 788 144
1,333 687
5
388 1,130 343
819 308
569 340
561 291 442
82 389 43
526 405
7
227 559 177
399 123
177 101
234 118 196
170 927 105
1,333 821 12
523 1,262 395
928 261
462 280
475 207 396
78 323 34
487 313
3
192 506 181
309 100
175 101
153 59
190
36.6543.3637.7763.5950.6922.7
32.3641.9120.6
50.1336.12
61.5222.57
44.4948.7639.98
49.6350.7730.1765.7174.8632.02
46.7852.9626.45
63.3940
53.0421.04
42.1340.4537.12
47.2142.1623.8560.8457.8613.72
39.5747.9427.05
49.0932.52
52.4421.04
27.5520.2235.98
28.8%-2.8%-36.9%-4.3% 14.1%-39.6%
22.3% 14.4% 31.3%
-2.1%-10.0%
-14.8%-6.8%
-38.1%-58.5%-10.0%
-4.9%-17.0%-21.0%-7.4%
-22.7%-57.2%
-15.4%-9.5% 2.3%
-22.6%-18.7%
-1.1% 0.0%
-34.6%-50.0%-3.1%
LAKEWOOD
NORWALK
PICO RIVERA
SAN DIMAS
WALNUT
LARCENY THEFT YTDReported
YTDCrime Rate
TotalReportedIncidents
YTDReported
YTDCrime Rate
TotalReportedIncidents
YTDReported
YTDCrime Rate
5 YearChange inYTD Crime
Rate
1 YearChange inYTD Crime
Rate
2009 2013 2014
2014/2009 2014/2013
STATION TOTAL
STATION TOTAL
STATION TOTAL
STATION TOTAL
STATION TOTAL
1286
770
463
363
648
3118
1861
1127
909
1294
1452
963
522
278
548
3368
2180
1189
742
1078
1238
879
409
276
402
50.72
33.19
45.31
37.36
43.72
59.58
43.58
55.72
34.16
39.85
50.8
39.78
43.66
33.92
29.23
.16
19.86
-3.64
-9.21
-33.14
-14.74%
-8.72%
-21.64%
-0.70%
-26.65%
2009 2013
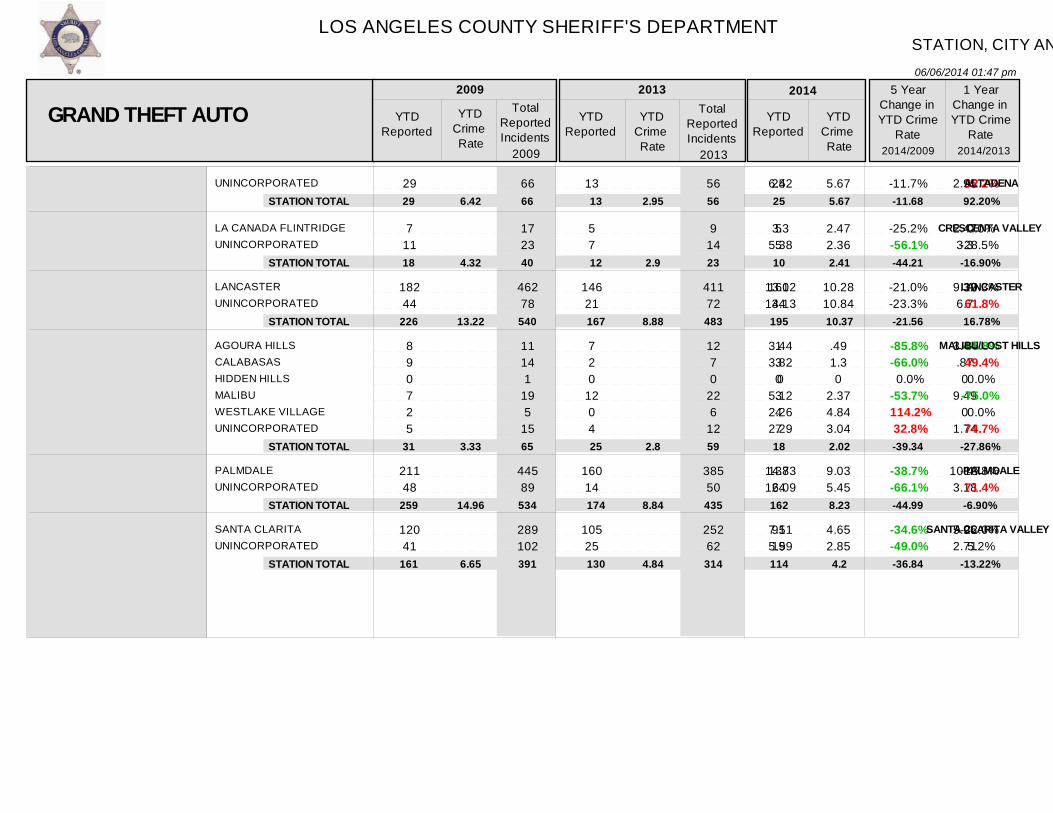
LOS ANGELES COUNTY SHERIFF'S DEPARTMENT
06/06/2014 01:47 pm
STATION, CITY AND UNINCORPORATED AREA PART I CRIME DETAIL
Ver: 10.02.19.2013.0
YTD 05/31/2014 - PART I CRIME RATE PER 10,000 POPULATION
25Page
- PRELIMINARY DATA
Per the FBI UCR Guidelines Homicide, Rape and Aggravated Assault are counted by victim. All other crimes are counted by incident, except Arson which is always counted.2009 Population Source: LA County Internal Services Department (based on the 2000 US Census and CA Department of Finance estimates).2013 Population Source: LA County Internal Services Department (based on the 2010 US Census and CA Department of Finance estimates). 2014 YTD Crime Rates based on 2013 population estimates. 2013 population estimates updated for the city of Santa Clarita and the Santa Clarita Valley Station unincorporated area, due to 2012 year end annexations.Crime counts for patrol station areas only; red depicts +30% increases and green depicts -30% decreases. N/C = Not Calculable
This PRELIMINARY INFORMATION is used on an ongoing basis by the LASD for strategic planning and as a tactical early warning system. This data is not final and thus is not the crime data that is reported to the FBI Uniform Crime Index (UCI). This is because some of the most recent reports have not been written yet, nor reviewed by investigators. Once it is reported by investigators and supervisors, the crime data is reported to the FBI/UCI and is available via the pertinent LASD patrol station, pending publication by the FBI/UCI. Once it is reported by the LASD to the FBI, the FBI/UCI crime data is considered the most accurate.
UNINCORPORATED
LA CANADA FLINTRIDGEUNINCORPORATED
LANCASTERUNINCORPORATED
AGOURA HILLSCALABASASHIDDEN HILLSMALIBUWESTLAKE VILLAGEUNINCORPORATED
PALMDALEUNINCORPORATED
SANTA CLARITAUNINCORPORATED
29
7 11
182 44
8 9 0 7 2 5
211 48
120 41
66
17 23
462 78
11 14 1
19 5
15
445 89
289 102
13
5 7
146 21
7 2 0
12 0 4
160 14
105 25
56
9 14
411 72
12 7 0
22 6
12
385 50
252 62
25
5 5
161 34
1 3 0 3 4 7
138 24
95 19
6.42
3.35.38
13.0214.13
3.443.82
05.122.262.29
14.7316.09
7.115.59
2.95
2.473.3
9.326.7
3.44.870
9.490
1.74
10.473.18
5.962.71
5.67
2.472.36
10.2810.84
.491.30
2.374.843.04
9.035.45
4.652.85
-11.7%
-25.2%-56.1%
-21.0%-23.3%
-85.8%-66.0% 0.0%
-53.7% 114.2% 32.8%
-38.7%-66.1%
-34.6%-49.0%
92.2%
0.0%-28.5%
10.3% 61.8%
-85.8% 49.4% 0.0%-75.0% 0.0% 74.7%
-13.8% 71.4%
-22.0% 5.2%
ALTADENA
CRESCENTA VALLEY
LANCASTER
MALIBU/LOST HILLS
PALMDALE
SANTA CLARITA VALLEY
GRAND THEFT AUTO YTDReported
YTDCrime Rate
TotalReportedIncidents
YTDReported
YTDCrime Rate
TotalReportedIncidents
YTDReported
YTDCrime Rate
5 YearChange inYTD Crime
Rate
1 YearChange inYTD Crime
Rate
2009 2013 2014
2014/2009 2014/2013
STATION TOTAL
STATION TOTAL
STATION TOTAL
STATION TOTAL
STATION TOTAL
STATION TOTAL
29
18
226
31
259
161
66
40
540
65
534
391
13
12
167
25
174
130
56
23
483
59
435
314
25
10
195
18
162
114
6.42
4.32
13.22
3.33
14.96
6.65
2.95
2.9
8.88
2.8
8.84
4.84
5.67
2.41
10.37
2.02
8.23
4.2
-11.68
-44.21
-21.56
-39.34
-44.99
-36.84
92.20%
-16.90%
16.78%
-27.86%
-6.90%
-13.22%
2009 2013

LOS ANGELES COUNTY SHERIFF'S DEPARTMENT
06/06/2014 01:47 pm
STATION, CITY AND UNINCORPORATED AREA PART I CRIME DETAIL
Ver: 10.02.19.2013.0
YTD 05/31/2014 - PART I CRIME RATE PER 10,000 POPULATION
26Page
- PRELIMINARY DATA
Per the FBI UCR Guidelines Homicide, Rape and Aggravated Assault are counted by victim. All other crimes are counted by incident, except Arson which is always counted.2009 Population Source: LA County Internal Services Department (based on the 2000 US Census and CA Department of Finance estimates).2013 Population Source: LA County Internal Services Department (based on the 2010 US Census and CA Department of Finance estimates). 2014 YTD Crime Rates based on 2013 population estimates. 2013 population estimates updated for the city of Santa Clarita and the Santa Clarita Valley Station unincorporated area, due to 2012 year end annexations.Crime counts for patrol station areas only; red depicts +30% increases and green depicts -30% decreases. N/C = Not Calculable
This PRELIMINARY INFORMATION is used on an ongoing basis by the LASD for strategic planning and as a tactical early warning system. This data is not final and thus is not the crime data that is reported to the FBI Uniform Crime Index (UCI). This is because some of the most recent reports have not been written yet, nor reviewed by investigators. Once it is reported by investigators and supervisors, the crime data is reported to the FBI/UCI and is available via the pertinent LASD patrol station, pending publication by the FBI/UCI. Once it is reported by the LASD to the FBI, the FBI/UCI crime data is considered the most accurate.
BRADBURYDUARTEROSEMEADSOUTH EL MONTETEMPLE CITYUNINCORPORATED
AVALONUNINCORPORATED
CARSONUNINCORPORATED
LYNWOODUNINCORPORATED
COMPTONUNINCORPORATED
LOMITARANCHO PALOS VERDESROLLING HILLSROLLING HILLS ESTATESUNINCORPORATED
0 23
110 54 17 63
8 0
168 84
251 418
402 125
23 11 1 1 6
0 66
227 130 63
131
16 0
446 233
641 910
899 234
56 24 1 3
12
0 20 48 34 10 52
2 0
220 60
256 346
350 85
25 10 0 1 4
2 55
165 115 33
114
17 0
468 148
550 767
797 218
76 40 0 6
10
0 17 75 49 16 42
0 0
138 57
260 266
317 87
24 8 0 3 3
09.94
19.1924.194.79
10.27
22.940
17.1337.31
34.331.28
40.3451.45
10.922.575.091.24
15.23
09.388.9316.92.81
9
5.360
23.9924.69
36.6929.39
36.2938.69
12.342.40
1.2412.84
07.97
13.9524.36
4.57.27
00
15.0523.46
37.2622.6
32.8739.6
11.851.92
03.729.63
0.0%-19.8%-27.3% 0.7%-6.1%
-29.2%
0.0% 0.0%
-12.1%-37.1%
8.6%-27.8%
-18.5%-23.0%
8.5%-25.3% 0.0%
200.0%-36.8%
0.0%-15.0% 56.2% 44.1% 60.1%-19.2%
0.0% 0.0%
-37.3%-5.0%
1.6%-23.1%
-9.4% 2.4%
-4.0%-20.0% 0.0%
200.0%-25.0%
TEMPLE
AVALON
CARSON
CENTURY
COMPTON
LOMITA
GRAND THEFT AUTO YTDReported
YTDCrime Rate
TotalReportedIncidents
YTDReported
YTDCrime Rate
TotalReportedIncidents
YTDReported
YTDCrime Rate
5 YearChange inYTD Crime
Rate
1 YearChange inYTD Crime
Rate
2009 2013 2014
2014/2009 2014/2013
STATION TOTAL
STATION TOTAL
STATION TOTAL
STATION TOTAL
STATION TOTAL
STATION TOTAL
267
8
252
669
527
42
617
16
679
1551
1133
96
164
2
280
602
435
40
484
17
616
1317
1015
132
199
0
195
526
404
38
13.31
19.64
20.89
32.35
42.51
5.39
8.65
4.88
24.14
32.11
36.73
5.34
10.5
16.81
28.05
34.11
5.07
-21.11
-19.53
-13.29
-19.76
-5.94
21.39%
-30.36%
-12.64%
-7.13%
-5.06%
2009 2013
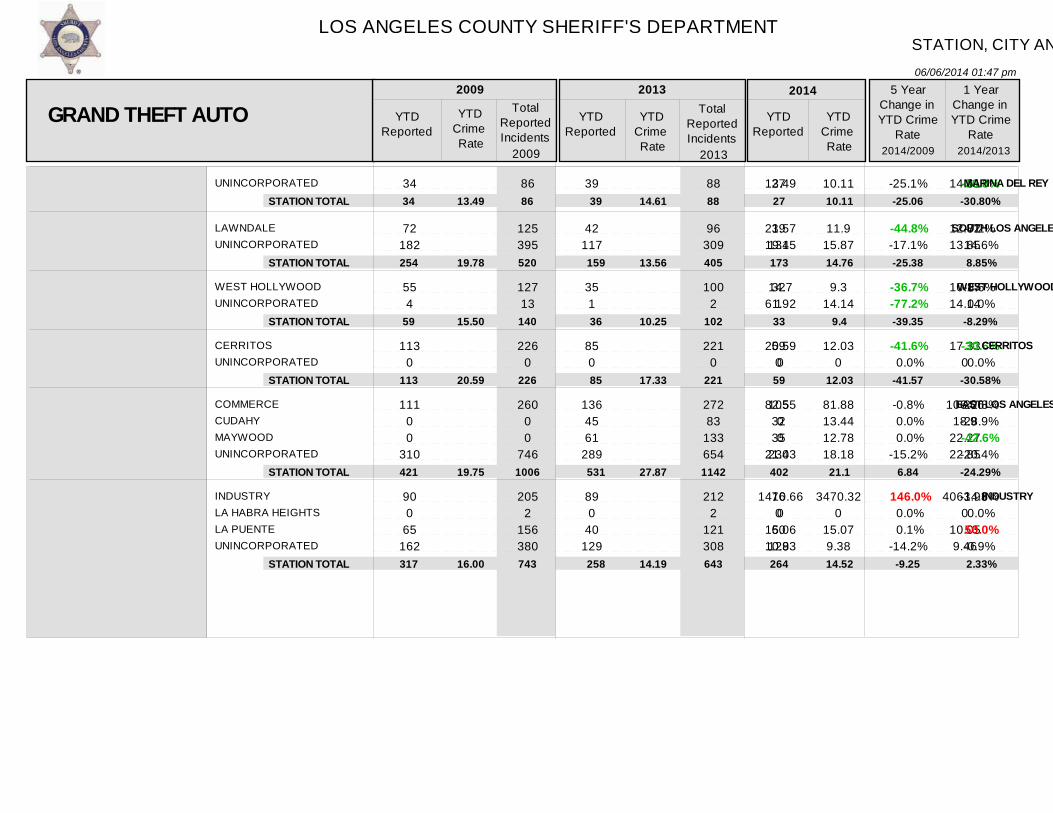
LOS ANGELES COUNTY SHERIFF'S DEPARTMENT
06/06/2014 01:47 pm
STATION, CITY AND UNINCORPORATED AREA PART I CRIME DETAIL
Ver: 10.02.19.2013.0
YTD 05/31/2014 - PART I CRIME RATE PER 10,000 POPULATION
27Page
- PRELIMINARY DATA
Per the FBI UCR Guidelines Homicide, Rape and Aggravated Assault are counted by victim. All other crimes are counted by incident, except Arson which is always counted.2009 Population Source: LA County Internal Services Department (based on the 2000 US Census and CA Department of Finance estimates).2013 Population Source: LA County Internal Services Department (based on the 2010 US Census and CA Department of Finance estimates). 2014 YTD Crime Rates based on 2013 population estimates. 2013 population estimates updated for the city of Santa Clarita and the Santa Clarita Valley Station unincorporated area, due to 2012 year end annexations.Crime counts for patrol station areas only; red depicts +30% increases and green depicts -30% decreases. N/C = Not Calculable
This PRELIMINARY INFORMATION is used on an ongoing basis by the LASD for strategic planning and as a tactical early warning system. This data is not final and thus is not the crime data that is reported to the FBI Uniform Crime Index (UCI). This is because some of the most recent reports have not been written yet, nor reviewed by investigators. Once it is reported by investigators and supervisors, the crime data is reported to the FBI/UCI and is available via the pertinent LASD patrol station, pending publication by the FBI/UCI. Once it is reported by the LASD to the FBI, the FBI/UCI crime data is considered the most accurate.
UNINCORPORATED
LAWNDALEUNINCORPORATED
WEST HOLLYWOODUNINCORPORATED
CERRITOSUNINCORPORATED
COMMERCECUDAHYMAYWOODUNINCORPORATED
INDUSTRYLA HABRA HEIGHTSLA PUENTEUNINCORPORATED
34
72 182
55 4
113 0
111 0 0
310
90 0
65 162
86
125 395
127 13
226 0
260 0 0
746
205 2
156 380
39
42 117
35 1
85 0
136 45 61
289
89 0
40 129
88
96 309
100 2
221 0
272 83
133 654
212 2
121 308
27
39 134
32 1
59 0
105 32 35
230
76 0
60 128
13.49
21.5719.15
14.761.92
20.590
82.5500
21.43
1410.660
15.0610.93
14.61
12.8213.85
10.1714.14
17.330
106.0618.9
22.2722.85
4063.930
10.059.46
10.11
11.915.87
9.314.14
12.030
81.8813.4412.7818.18
3470.320
15.079.38
-25.1%
-44.8%-17.1%
-36.7%-77.2%
-41.6% 0.0%
-0.8% 0.0% 0.0%
-15.2%
146.0% 0.0% 0.1%
-14.2%
-30.8%
-7.2% 14.6%
-8.6% 0.0%
-30.6% 0.0%
-22.8%-28.9%-42.6%-20.4%
-14.6% 0.0% 50.0%-0.9%
MARINA DEL REY
SOUTH LOS ANGELES
WEST HOLLYWOOD
CERRITOS
EAST LOS ANGELES
INDUSTRY
GRAND THEFT AUTO YTDReported
YTDCrime Rate
TotalReportedIncidents
YTDReported
YTDCrime Rate
TotalReportedIncidents
YTDReported
YTDCrime Rate
5 YearChange inYTD Crime
Rate
1 YearChange inYTD Crime
Rate
2009 2013 2014
2014/2009 2014/2013
STATION TOTAL
STATION TOTAL
STATION TOTAL
STATION TOTAL
STATION TOTAL
STATION TOTAL
34
254
59
113
421
317
86
520
140
226
1006
743
39
159
36
85
531
258
88
405
102
221
1142
643
27
173
33
59
402
264
13.49
19.78
15.50
20.59
19.75
16.00
14.61
13.56
10.25
17.33
27.87
14.19
10.11
14.76
9.4
12.03
21.1
14.52
-25.06
-25.38
-39.35
-41.57
6.84
-9.25
-30.80%
8.85%
-8.29%
-30.58%
-24.29%
2.33%
2009 2013
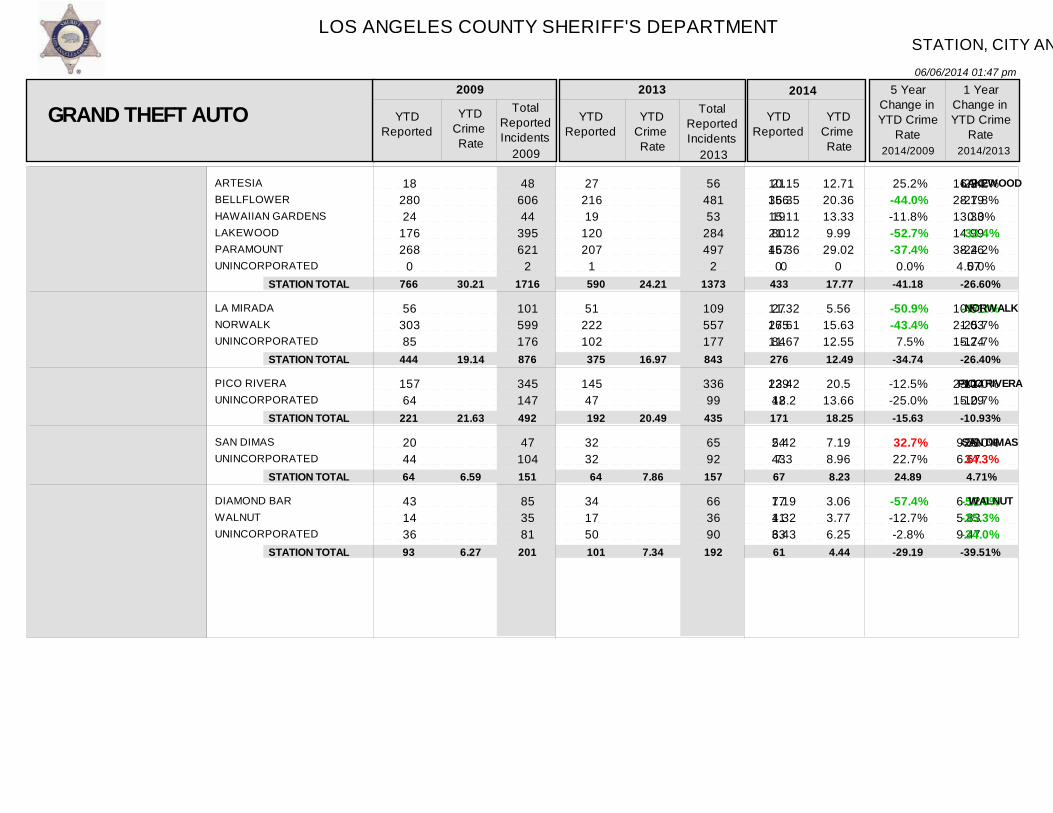
LOS ANGELES COUNTY SHERIFF'S DEPARTMENT
06/06/2014 01:47 pm
STATION, CITY AND UNINCORPORATED AREA PART I CRIME DETAIL
Ver: 10.02.19.2013.0
YTD 05/31/2014 - PART I CRIME RATE PER 10,000 POPULATION
28Page
- PRELIMINARY DATA
Per the FBI UCR Guidelines Homicide, Rape and Aggravated Assault are counted by victim. All other crimes are counted by incident, except Arson which is always counted.2009 Population Source: LA County Internal Services Department (based on the 2000 US Census and CA Department of Finance estimates).2013 Population Source: LA County Internal Services Department (based on the 2010 US Census and CA Department of Finance estimates). 2014 YTD Crime Rates based on 2013 population estimates. 2013 population estimates updated for the city of Santa Clarita and the Santa Clarita Valley Station unincorporated area, due to 2012 year end annexations.Crime counts for patrol station areas only; red depicts +30% increases and green depicts -30% decreases. N/C = Not Calculable
This PRELIMINARY INFORMATION is used on an ongoing basis by the LASD for strategic planning and as a tactical early warning system. This data is not final and thus is not the crime data that is reported to the FBI Uniform Crime Index (UCI). This is because some of the most recent reports have not been written yet, nor reviewed by investigators. Once it is reported by investigators and supervisors, the crime data is reported to the FBI/UCI and is available via the pertinent LASD patrol station, pending publication by the FBI/UCI. Once it is reported by the LASD to the FBI, the FBI/UCI crime data is considered the most accurate.
ARTESIABELLFLOWERHAWAIIAN GARDENSLAKEWOODPARAMOUNTUNINCORPORATED
LA MIRADANORWALKUNINCORPORATED
PICO RIVERAUNINCORPORATED
SAN DIMASUNINCORPORATED
DIAMOND BARWALNUTUNINCORPORATED
18 280 24
176 268
0
56 303 85
157 64
20 44
43 14 36
48 606 44
395 621
2
101 599 176
345 147
47 104
85 35 81
27 216 19
120 207
1
51 222 102
145 47
32 32
34 17 50
56 481 53
284 497
2
109 557 177
336 99
65 92
66 36 90
21 156 19 80
157 0
27 165 84
129 42
24 43
17 11 33
10.1536.3515.1121.1246.36
0
11.3227.6111.67
23.4218.2
5.427.3
7.194.326.43
16.3428.1913.3314.9938.264.57
10.5121.0315.24
23.0415.29
9.596.67
6.125.839.47
12.7120.3613.339.99
29.020
5.5615.6312.55
20.513.66
7.198.96
3.063.776.25
25.2%-44.0%-11.8%-52.7%-37.4% 0.0%
-50.9%-43.4% 7.5%
-12.5%-25.0%
32.7% 22.7%
-57.4%-12.7%-2.8%
-22.2%-27.8% 0.0%-33.4%-24.2% 0.0%
-47.1%-25.7%-17.7%
-11.0%-10.7%
-25.0% 34.3%
-50.0%-35.3%-34.0%
LAKEWOOD
NORWALK
PICO RIVERA
SAN DIMAS
WALNUT
GRAND THEFT AUTO YTDReported
YTDCrime Rate
TotalReportedIncidents
YTDReported
YTDCrime Rate
TotalReportedIncidents
YTDReported
YTDCrime Rate
5 YearChange inYTD Crime
Rate
1 YearChange inYTD Crime
Rate
2009 2013 2014
2014/2009 2014/2013
STATION TOTAL
STATION TOTAL
STATION TOTAL
STATION TOTAL
STATION TOTAL
766
444
221
64
93
1716
876
492
151
201
590
375
192
64
101
1373
843
435
157
192
433
276
171
67
61
30.21
19.14
21.63
6.59
6.27
24.21
16.97
20.49
7.86
7.34
17.77
12.49
18.25
8.23
4.44
-41.18
-34.74
-15.63
24.89
-29.19
-26.60%
-26.40%
-10.93%
4.71%
-39.51%
2009 2013

LOS ANGELES COUNTY SHERIFF'S DEPARTMENT
06/06/2014 01:47 pm
STATION, CITY AND UNINCORPORATED AREA PART I CRIME DETAIL
Ver: 10.02.19.2013.0
YTD 05/31/2014 - PART I CRIME RATE PER 10,000 POPULATION
29Page
- PRELIMINARY DATA
Per the FBI UCR Guidelines Homicide, Rape and Aggravated Assault are counted by victim. All other crimes are counted by incident, except Arson which is always counted.2009 Population Source: LA County Internal Services Department (based on the 2000 US Census and CA Department of Finance estimates).2013 Population Source: LA County Internal Services Department (based on the 2010 US Census and CA Department of Finance estimates). 2014 YTD Crime Rates based on 2013 population estimates. 2013 population estimates updated for the city of Santa Clarita and the Santa Clarita Valley Station unincorporated area, due to 2012 year end annexations.Crime counts for patrol station areas only; red depicts +30% increases and green depicts -30% decreases. N/C = Not Calculable
This PRELIMINARY INFORMATION is used on an ongoing basis by the LASD for strategic planning and as a tactical early warning system. This data is not final and thus is not the crime data that is reported to the FBI Uniform Crime Index (UCI). This is because some of the most recent reports have not been written yet, nor reviewed by investigators. Once it is reported by investigators and supervisors, the crime data is reported to the FBI/UCI and is available via the pertinent LASD patrol station, pending publication by the FBI/UCI. Once it is reported by the LASD to the FBI, the FBI/UCI crime data is considered the most accurate.
UNINCORPORATED
LA CANADA FLINTRIDGEUNINCORPORATED
LANCASTERUNINCORPORATED
AGOURA HILLSCALABASASHIDDEN HILLSMALIBUWESTLAKE VILLAGEUNINCORPORATED
PALMDALEUNINCORPORATED
SANTA CLARITAUNINCORPORATED
3
2 3
21 16
1 0 0 1 0 0
13 15
18 3
7
11 5
45 36
7 3 0 2 0 2
28 23
35 9
0
0 0
12 3
5 1 0 0 1 0
11 11
8 2
3
2 0
45 8
7 7 0 1 1 0
31 16
16 3
3
2 1
17 12
0 3 0 1 1 2
10 6
4 6
.66
.941.47
1.55.14
.4300
.7300
.915.03
1.07.41
0
00
.77
.96
2.46.4300
1.210
.722.5
.45
.22
.68
.99
.47
1.093.83
01.30
.791.21.87
.651.36
.2
.9
3.0%
5.3%-68.0%
-27.3%-25.5%
0.0% 0.0% 0.0% 8.2% 0.0% 0.0%
-28.6%-73.0%
-81.3% 119.5%
0.0%
0.0% 0.0%
41.6% 299.0%
0.0% 202.3% 0.0% 0.0% 0.0% 0.0%
-9.7%-45.6%
-55.6% 309.1%
ALTADENA
CRESCENTA VALLEY
LANCASTER
MALIBU/LOST HILLS
PALMDALE
SANTA CLARITA VALLEY
ARSON YTDReported
YTDCrime Rate
TotalReportedIncidents
YTDReported
YTDCrime Rate
TotalReportedIncidents
YTDReported
YTDCrime Rate
5 YearChange inYTD Crime
Rate
1 YearChange inYTD Crime
Rate
2009 2013 2014
2014/2009 2014/2013
STATION TOTAL
STATION TOTAL
STATION TOTAL
STATION TOTAL
STATION TOTAL
STATION TOTAL
3
5
37
2
28
21
7
16
81
14
51
44
0
0
15
7
22
10
3
2
53
16
47
19
3
3
29
7
16
10
0.66
1.20
2.16
0.21
1.62
0.87
.8
.79
1.12
.37
.68
.72
1.54
.79
.81
.37
3.03
-40
-28.7
276.19
-50
-57.47
0.00%
0.00%
92.50%
0.00%
-27.68%
0.00%
2009 2013
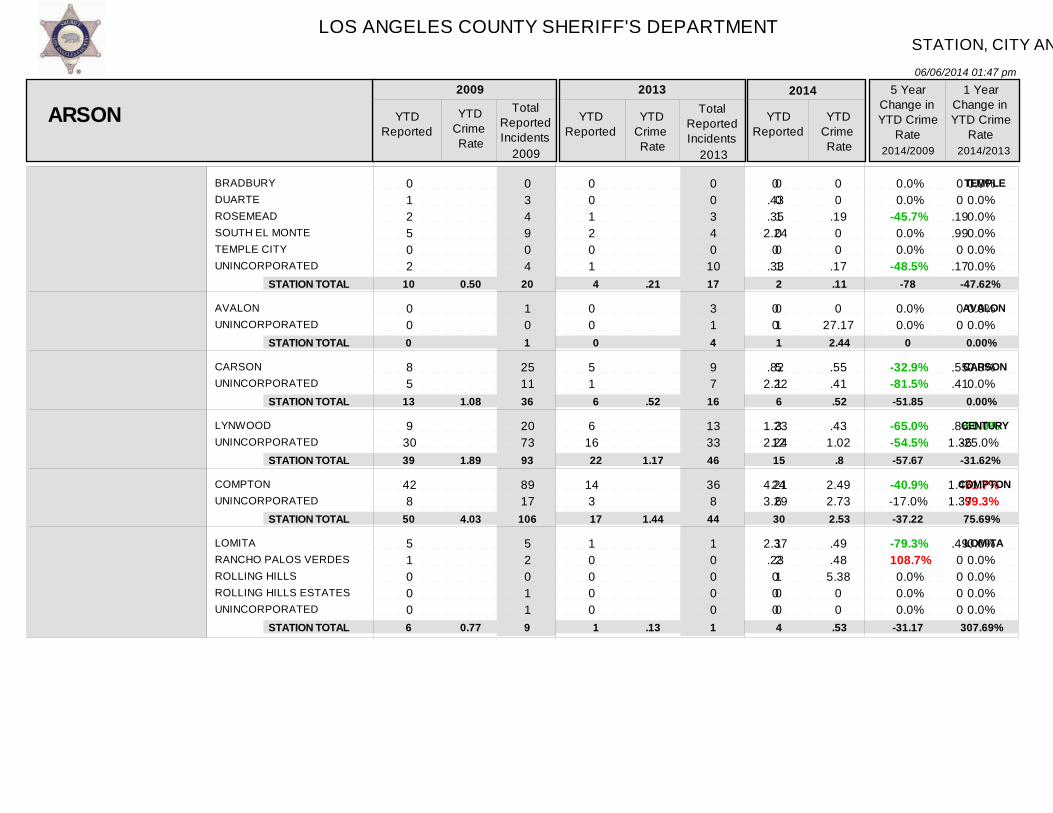
LOS ANGELES COUNTY SHERIFF'S DEPARTMENT
06/06/2014 01:47 pm
STATION, CITY AND UNINCORPORATED AREA PART I CRIME DETAIL
Ver: 10.02.19.2013.0
YTD 05/31/2014 - PART I CRIME RATE PER 10,000 POPULATION
30Page
- PRELIMINARY DATA
Per the FBI UCR Guidelines Homicide, Rape and Aggravated Assault are counted by victim. All other crimes are counted by incident, except Arson which is always counted.2009 Population Source: LA County Internal Services Department (based on the 2000 US Census and CA Department of Finance estimates).2013 Population Source: LA County Internal Services Department (based on the 2010 US Census and CA Department of Finance estimates). 2014 YTD Crime Rates based on 2013 population estimates. 2013 population estimates updated for the city of Santa Clarita and the Santa Clarita Valley Station unincorporated area, due to 2012 year end annexations.Crime counts for patrol station areas only; red depicts +30% increases and green depicts -30% decreases. N/C = Not Calculable
This PRELIMINARY INFORMATION is used on an ongoing basis by the LASD for strategic planning and as a tactical early warning system. This data is not final and thus is not the crime data that is reported to the FBI Uniform Crime Index (UCI). This is because some of the most recent reports have not been written yet, nor reviewed by investigators. Once it is reported by investigators and supervisors, the crime data is reported to the FBI/UCI and is available via the pertinent LASD patrol station, pending publication by the FBI/UCI. Once it is reported by the LASD to the FBI, the FBI/UCI crime data is considered the most accurate.
BRADBURYDUARTEROSEMEADSOUTH EL MONTETEMPLE CITYUNINCORPORATED
AVALONUNINCORPORATED
CARSONUNINCORPORATED
LYNWOODUNINCORPORATED
COMPTONUNINCORPORATED
LOMITARANCHO PALOS VERDESROLLING HILLSROLLING HILLS ESTATESUNINCORPORATED
0 1 2 5 0 2
0 0
8 5
9 30
42 8
5 1 0 0 0
0 3 4 9 0 4
1 0
25 11
20 73
89 17
5 2 0 1 1
0 0 1 2 0 1
0 0
5 1
6 16
14 3
1 0 0 0 0
0 0 3 4 0
10
3 1
9 7
13 33
36 8
1 0 0 0 0
0 0 1 0 0 1
0 1
5 1
3 12
24 6
1 2 1 0 0
0.43.35
2.240
.33
00
.822.22
1.232.24
4.213.29
2.37.23000
00
.19
.990
.17
00
.55
.41
.861.36
1.451.37
.490000
00
.1900
.17
027.17
.55
.41
.431.02
2.492.73
.49
.485.38
00
0.0% 0.0%
-45.7% 0.0% 0.0%
-48.5%
0.0% 0.0%
-32.9%-81.5%
-65.0%-54.5%
-40.9%-17.0%
-79.3% 108.7% 0.0% 0.0% 0.0%
0.0% 0.0% 0.0% 0.0% 0.0% 0.0%
0.0% 0.0%
0.0% 0.0%
-50.0%-25.0%
71.7% 99.3%
0.0% 0.0% 0.0% 0.0% 0.0%
TEMPLE
AVALON
CARSON
CENTURY
COMPTON
LOMITA
ARSON YTDReported
YTDCrime Rate
TotalReportedIncidents
YTDReported
YTDCrime Rate
TotalReportedIncidents
YTDReported
YTDCrime Rate
5 YearChange inYTD Crime
Rate
1 YearChange inYTD Crime
Rate
2009 2013 2014
2014/2009 2014/2013
STATION TOTAL
STATION TOTAL
STATION TOTAL
STATION TOTAL
STATION TOTAL
STATION TOTAL
10
0
13
39
50
6
20
1
36
93
106
9
4
0
6
22
17
1
17
4
16
46
44
1
2
1
6
15
30
4
0.50
1.08
1.89
4.03
0.77
.21
.52
1.17
1.44
.13
.11
2.44
.52
.8
2.53
.53
-78
0
-51.85
-57.67
-37.22
-31.17
-47.62%
0.00%
0.00%
-31.62%
75.69%
307.69%
2009 2013
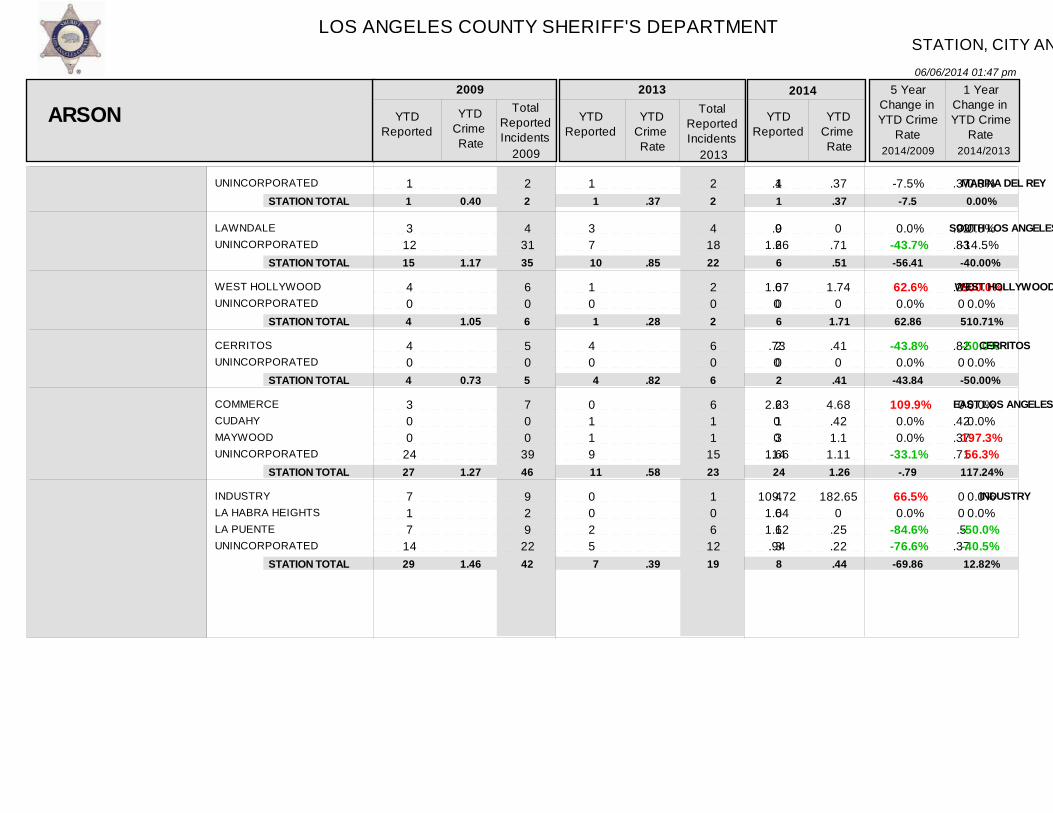
LOS ANGELES COUNTY SHERIFF'S DEPARTMENT
06/06/2014 01:47 pm
STATION, CITY AND UNINCORPORATED AREA PART I CRIME DETAIL
Ver: 10.02.19.2013.0
YTD 05/31/2014 - PART I CRIME RATE PER 10,000 POPULATION
31Page
- PRELIMINARY DATA
Per the FBI UCR Guidelines Homicide, Rape and Aggravated Assault are counted by victim. All other crimes are counted by incident, except Arson which is always counted.2009 Population Source: LA County Internal Services Department (based on the 2000 US Census and CA Department of Finance estimates).2013 Population Source: LA County Internal Services Department (based on the 2010 US Census and CA Department of Finance estimates). 2014 YTD Crime Rates based on 2013 population estimates. 2013 population estimates updated for the city of Santa Clarita and the Santa Clarita Valley Station unincorporated area, due to 2012 year end annexations.Crime counts for patrol station areas only; red depicts +30% increases and green depicts -30% decreases. N/C = Not Calculable
This PRELIMINARY INFORMATION is used on an ongoing basis by the LASD for strategic planning and as a tactical early warning system. This data is not final and thus is not the crime data that is reported to the FBI Uniform Crime Index (UCI). This is because some of the most recent reports have not been written yet, nor reviewed by investigators. Once it is reported by investigators and supervisors, the crime data is reported to the FBI/UCI and is available via the pertinent LASD patrol station, pending publication by the FBI/UCI. Once it is reported by the LASD to the FBI, the FBI/UCI crime data is considered the most accurate.
UNINCORPORATED
LAWNDALEUNINCORPORATED
WEST HOLLYWOODUNINCORPORATED
CERRITOSUNINCORPORATED
COMMERCECUDAHYMAYWOODUNINCORPORATED
INDUSTRYLA HABRA HEIGHTSLA PUENTEUNINCORPORATED
1
3 12
4 0
4 0
3 0 0
24
7 1 7
14
2
4 31
6 0
5 0
7 0 0
39
9 2 9
22
1
3 7
1 0
4 0
0 1 1 9
0 0 2 5
2
4 18
2 0
6 0
6 1 1
15
1 0 6
12
1
0 6
6 0
2 0
6 1 3
14
4 0 1 3
.4
.91.26
1.070
.730
2.2300
1.66
109.721.641.62.94
.37
.92
.83
.290
.820
0.42.37.71
00.5
.37
.37
0.71
1.740
.410
4.68.421.1
1.11
182.650
.25
.22
-7.5%
0.0%-43.7%
62.6% 0.0%
-43.8% 0.0%
109.9% 0.0% 0.0%
-33.1%
66.5% 0.0%
-84.6%-76.6%
0.0%
0.0%-14.5%
500.0% 0.0%
-50.0% 0.0%
0.0% 0.0%
197.3% 56.3%
0.0% 0.0%-50.0%-40.5%
MARINA DEL REY
SOUTH LOS ANGELES
WEST HOLLYWOOD
CERRITOS
EAST LOS ANGELES
INDUSTRY
ARSON YTDReported
YTDCrime Rate
TotalReportedIncidents
YTDReported
YTDCrime Rate
TotalReportedIncidents
YTDReported
YTDCrime Rate
5 YearChange inYTD Crime
Rate
1 YearChange inYTD Crime
Rate
2009 2013 2014
2014/2009 2014/2013
STATION TOTAL
STATION TOTAL
STATION TOTAL
STATION TOTAL
STATION TOTAL
STATION TOTAL
1
15
4
4
27
29
2
35
6
5
46
42
1
10
1
4
11
7
2
22
2
6
23
19
1
6
6
2
24
8
0.40
1.17
1.05
0.73
1.27
1.46
.37
.85
.28
.82
.58
.39
.37
.51
1.71
.41
1.26
.44
-7.5
-56.41
62.86
-43.84
-.79
-69.86
0.00%
-40.00%
510.71%
-50.00%
117.24%
12.82%
2009 2013
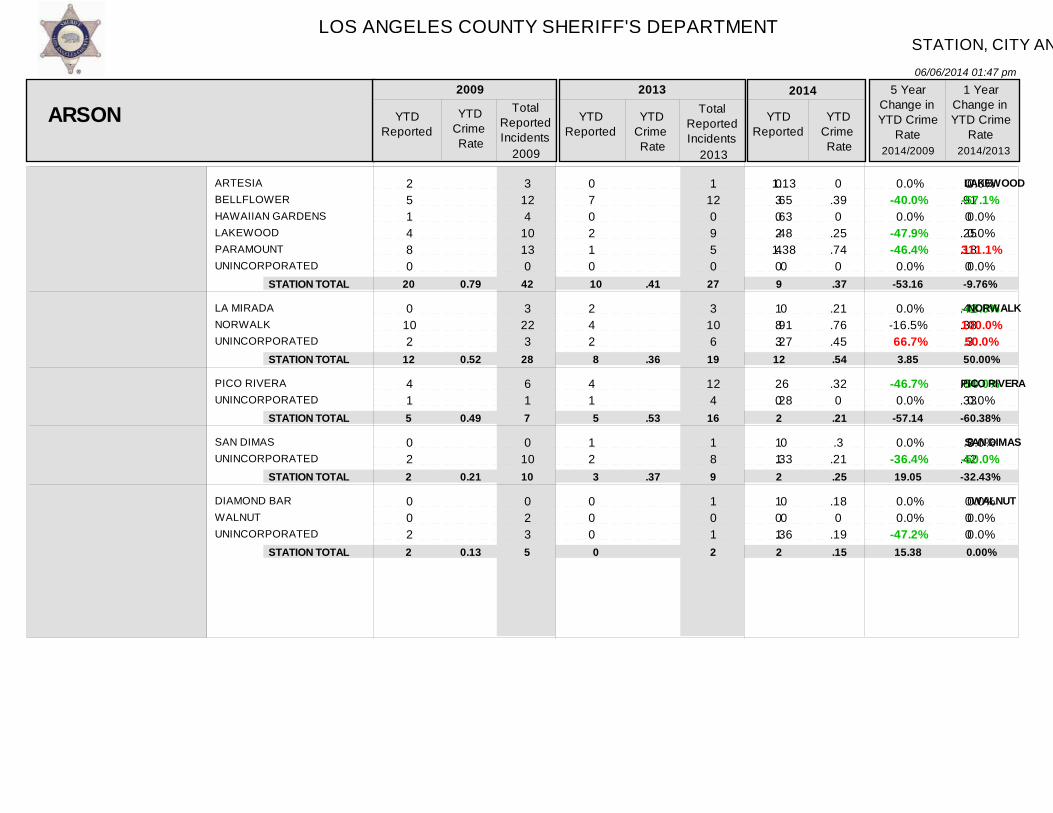
LOS ANGELES COUNTY SHERIFF'S DEPARTMENT
06/06/2014 01:47 pm
STATION, CITY AND UNINCORPORATED AREA PART I CRIME DETAIL
Ver: 10.02.19.2013.0
YTD 05/31/2014 - PART I CRIME RATE PER 10,000 POPULATION
32Page
- PRELIMINARY DATA
Per the FBI UCR Guidelines Homicide, Rape and Aggravated Assault are counted by victim. All other crimes are counted by incident, except Arson which is always counted.2009 Population Source: LA County Internal Services Department (based on the 2000 US Census and CA Department of Finance estimates).2013 Population Source: LA County Internal Services Department (based on the 2010 US Census and CA Department of Finance estimates). 2014 YTD Crime Rates based on 2013 population estimates. 2013 population estimates updated for the city of Santa Clarita and the Santa Clarita Valley Station unincorporated area, due to 2012 year end annexations.Crime counts for patrol station areas only; red depicts +30% increases and green depicts -30% decreases. N/C = Not Calculable
This PRELIMINARY INFORMATION is used on an ongoing basis by the LASD for strategic planning and as a tactical early warning system. This data is not final and thus is not the crime data that is reported to the FBI Uniform Crime Index (UCI). This is because some of the most recent reports have not been written yet, nor reviewed by investigators. Once it is reported by investigators and supervisors, the crime data is reported to the FBI/UCI and is available via the pertinent LASD patrol station, pending publication by the FBI/UCI. Once it is reported by the LASD to the FBI, the FBI/UCI crime data is considered the most accurate.
ARTESIABELLFLOWERHAWAIIAN GARDENSLAKEWOODPARAMOUNTUNINCORPORATED
LA MIRADANORWALKUNINCORPORATED
PICO RIVERAUNINCORPORATED
SAN DIMASUNINCORPORATED
DIAMOND BARWALNUTUNINCORPORATED
2 5 1 4 8 0
0 10 2
4 1
0 2
0 0 2
3 12 4
10 13 0
3 22 3
6 1
0 10
0 2 3
0 7 0 2 1 0
2 4 2
4 1
1 2
0 0 0
1 12 0 9 5 0
3 10 6
12 4
1 8
1 0 1
0 3 0 2 4 0
1 8 3
2 0
1 1
1 0 1
1.13.65.63.48
1.380
0.91.27
.6.28
0.33
00
.36
0.910
.25
.180
.41
.38.3
.64
.33
.3.42
000
0.390
.25
.740
.21
.76
.45
.320
.3.21
.180
.19
0.0%-40.0% 0.0%
-47.9%-46.4% 0.0%
0.0%-16.5% 66.7%
-46.7% 0.0%
0.0%-36.4%
0.0% 0.0%
-47.2%
0.0%-57.1% 0.0% 0.0%
311.1% 0.0%
-48.8% 100.0% 50.0%
-50.0% 0.0%
0.0%-50.0%
0.0% 0.0% 0.0%
LAKEWOOD
NORWALK
PICO RIVERA
SAN DIMAS
WALNUT
ARSON YTDReported
YTDCrime Rate
TotalReportedIncidents
YTDReported
YTDCrime Rate
TotalReportedIncidents
YTDReported
YTDCrime Rate
5 YearChange inYTD Crime
Rate
1 YearChange inYTD Crime
Rate
2009 2013 2014
2014/2009 2014/2013
STATION TOTAL
STATION TOTAL
STATION TOTAL
STATION TOTAL
STATION TOTAL
20
12
5
2
2
42
28
7
10
5
10
8
5
3
0
27
19
16
9
2
9
12
2
2
2
0.79
0.52
0.49
0.21
0.13
.41
.36
.53
.37
.37
.54
.21
.25
.15
-53.16
3.85
-57.14
19.05
15.38
-9.76%
50.00%
-60.38%
-32.43%
0.00%
2009 2013
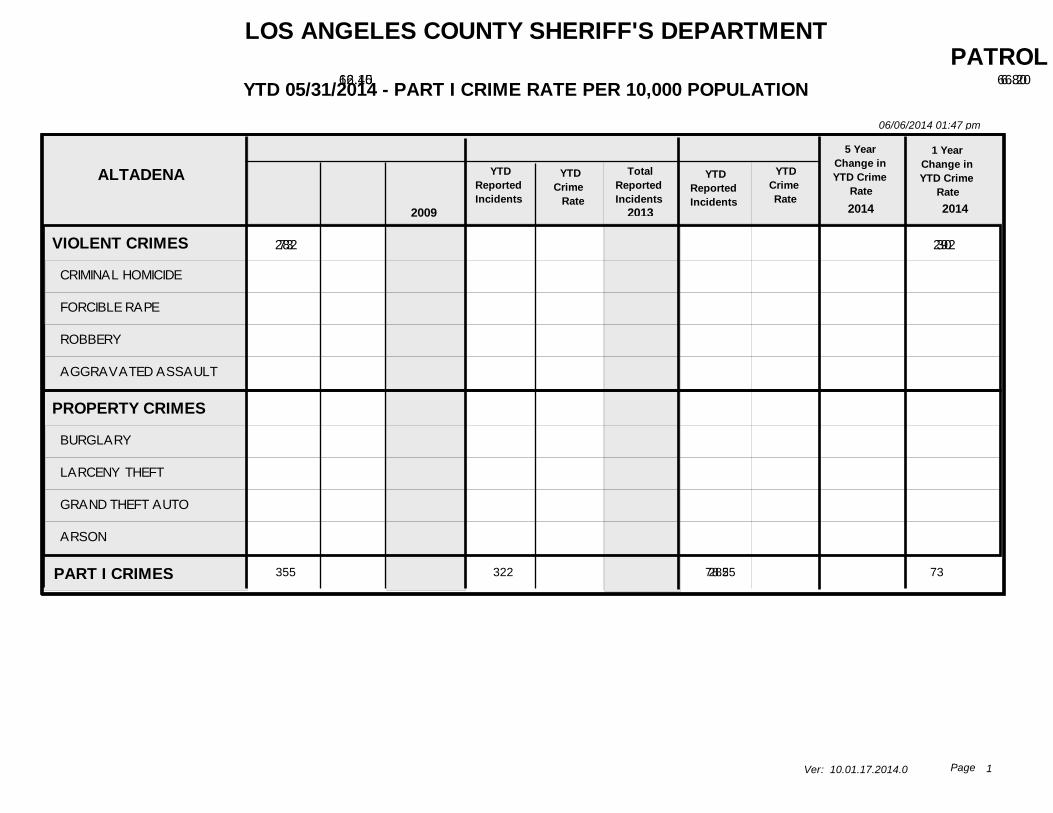
LOS ANGELES COUNTY SHERIFF'S DEPARTMENT
YTD 05/31/2014 - PART I CRIME RATE PER 10,000 POPULATION
06/06/2014 01:47 pm
Ver: 10.01.17.2014.0 1Page
PATROL STATION PART I CRIME SUMMARY- PRELIMINARY DATA
Per the FBI UCR Guidelines Homicide, Rape and Aggravated Assault are counted by victim. All other crimes are counted by incident, except Arson which is always counted.2009 Population Source: LA County Internal Services Department (based on the 2000 US Census and CA Department of Finance estimates).2013 Population Source: LA County Internal Services Department (based on the 2010 US Census and CA Department of Finance estimates). 2014 YTD Crime Rates based on 2013 population estimates. 2013 population estimates updated for the city of Santa Clarita and the Santa Clarita Valley Station unincorporated area, due to 2012 year end annexations.Crime counts for patrol station areas only; red depicts +30% increases and green depicts -30% decreases. N/C = Not Calculable
This PRELIMINARY INFORMATION is used on an ongoing basis by the LASD for strategic planning and as a tactical early warning system. This data is not final and thus is not the crime data that is reported to the FBI Uniform Crime Index (UCI). This is because some of the most recent reports have not been written yet, nor reviewed by investigators. Once it is reported by investigators and supervisors, the crime data is reported to the FBI/UCI and is available via the pertinent LASD patrol station, pending publication by the FBI/UCI. Once it is reported by the LASD to the FBI, the FBI/UCI crime data is considered the most accurate.
ALTADENA
VIOLENT CRIMES
PROPERTY CRIMES
CRIMINAL HOMICIDE
FORCIBLE RAPE
ROBBERY
AGGRAVATED ASSAULT
BURGLARY
LARCENY THEFT
GRAND THEFT AUTO
ARSON
73
282
16.15
62.40
179
703
YTDReportedIncidents
YTDCrime Rate
TotalReported
YTDReportedIncidents
YTDCrime Rate
TotalReportedIncidents
YTDReportedIncidents
YTDCrimeRate
5 YearChange inYTD Crime
Rate
1 YearChange inYTD Crime
Rate
30
292
6.80
66.20
73
649
33
249
7.48
56.45
1
3
10
59
89
161
29
3
0.22
0.66
2.21
13.06
19.69
35.63
6.42
0.66
1
5
34
139
253
377
66
7
1
6
6
17
99
180
13
0
0.23
1.36
1.36
3.85
22.45
40.81
2.95
0.00
1
12
12
48
193
397
56
3
0
1
7
25
75
146
25
3
0.00
0.23
1.59
5.67
17.00
33.10
5.67
0.68
-53.7%
-9.5%
0.0%
-65.2%
-28.1%
-56.6%
-13.7%
-7.1%
-11.7%
3.0%
10.0%
-14.7%
0.0%
-83.1%
16.9%
47.3%
-24.3%
-18.9%
92.2%
0.0%
2009 2013 2014
2009 2013 2014 2014
355PART I CRIMES 322 28278.55 73 63.93 882 722 -18.6% -12.4%

LOS ANGELES COUNTY SHERIFF'S DEPARTMENT
YTD 05/31/2014 - PART I CRIME RATE PER 10,000 POPULATION
06/06/2014 01:47 pm
Ver: 10.01.17.2014.0 2Page
PATROL STATION PART I CRIME SUMMARY- PRELIMINARY DATA
Per the FBI UCR Guidelines Homicide, Rape and Aggravated Assault are counted by victim. All other crimes are counted by incident, except Arson which is always counted.2009 Population Source: LA County Internal Services Department (based on the 2000 US Census and CA Department of Finance estimates).2013 Population Source: LA County Internal Services Department (based on the 2010 US Census and CA Department of Finance estimates). 2014 YTD Crime Rates based on 2013 population estimates. 2013 population estimates updated for the city of Santa Clarita and the Santa Clarita Valley Station unincorporated area, due to 2012 year end annexations.Crime counts for patrol station areas only; red depicts +30% increases and green depicts -30% decreases. N/C = Not Calculable
This PRELIMINARY INFORMATION is used on an ongoing basis by the LASD for strategic planning and as a tactical early warning system. This data is not final and thus is not the crime data that is reported to the FBI Uniform Crime Index (UCI). This is because some of the most recent reports have not been written yet, nor reviewed by investigators. Once it is reported by investigators and supervisors, the crime data is reported to the FBI/UCI and is available via the pertinent LASD patrol station, pending publication by the FBI/UCI. Once it is reported by the LASD to the FBI, the FBI/UCI crime data is considered the most accurate.
AVALON
VIOLENT CRIMES
PROPERTY CRIMES
CRIMINAL HOMICIDE
FORCIBLE RAPE
ROBBERY
AGGRAVATED ASSAULT
BURGLARY
LARCENY THEFT
GRAND THEFT AUTO
ARSON
10
33
24.55
81.02
25
98
YTDReportedIncidents
YTDCrime Rate
TotalReported
YTDReportedIncidents
YTDCrime Rate
TotalReportedIncidents
YTDReportedIncidents
YTDCrimeRate
5 YearChange inYTD Crime
Rate
1 YearChange inYTD Crime
Rate
2
16
4.88
39.06
11
99
7
26
17.09
63.48
0
0
0
10
6
19
8
0
0.00
0.00
0.00
24.55
14.73
46.65
19.64
0.00
0
0
1
24
22
59
16
1
0
0
1
1
2
12
2
0
0.00
0.00
2.44
2.44
4.88
29.30
4.88
0.00
0
0
2
9
17
61
17
4
0
1
0
6
9
16
0
1
0.00
2.44
0.00
14.65
21.97
39.06
0.00
2.44
-30.4%
-21.7%
0.0%
0.0%
0.0%
-40.3%
49.2%
-16.3%
0.0%
0.0%
250.2%
62.5%
0.0%
0.0%
0.0%
500.4%
350.2%
33.3%
0.0%
0.0%
2009 2013 2014
2009 2013 2014 2014
43PART I CRIMES 18 33105.57 43.94 80.57 123 110 -23.7% 83.3%

LOS ANGELES COUNTY SHERIFF'S DEPARTMENT
YTD 05/31/2014 - PART I CRIME RATE PER 10,000 POPULATION
06/06/2014 01:47 pm
Ver: 10.01.17.2014.0 3Page
PATROL STATION PART I CRIME SUMMARY- PRELIMINARY DATA
Per the FBI UCR Guidelines Homicide, Rape and Aggravated Assault are counted by victim. All other crimes are counted by incident, except Arson which is always counted.2009 Population Source: LA County Internal Services Department (based on the 2000 US Census and CA Department of Finance estimates).2013 Population Source: LA County Internal Services Department (based on the 2010 US Census and CA Department of Finance estimates). 2014 YTD Crime Rates based on 2013 population estimates. 2013 population estimates updated for the city of Santa Clarita and the Santa Clarita Valley Station unincorporated area, due to 2012 year end annexations.Crime counts for patrol station areas only; red depicts +30% increases and green depicts -30% decreases. N/C = Not Calculable
This PRELIMINARY INFORMATION is used on an ongoing basis by the LASD for strategic planning and as a tactical early warning system. This data is not final and thus is not the crime data that is reported to the FBI Uniform Crime Index (UCI). This is because some of the most recent reports have not been written yet, nor reviewed by investigators. Once it is reported by investigators and supervisors, the crime data is reported to the FBI/UCI and is available via the pertinent LASD patrol station, pending publication by the FBI/UCI. Once it is reported by the LASD to the FBI, the FBI/UCI crime data is considered the most accurate.
CARSON
VIOLENT CRIMES
PROPERTY CRIMES
CRIMINAL HOMICIDE
FORCIBLE RAPE
ROBBERY
AGGRAVATED ASSAULT
BURGLARY
LARCENY THEFT
GRAND THEFT AUTO
ARSON
252
1,311
20.89
108.69
653
3,243
YTDReportedIncidents
YTDCrime Rate
TotalReported
YTDReportedIncidents
YTDCrime Rate
TotalReportedIncidents
YTDReportedIncidents
YTDCrimeRate
5 YearChange inYTD Crime
Rate
1 YearChange inYTD Crime
Rate
198
1308
17.07
112.75
499
2,953
189
1117
16.29
96.28
4
6
72
170
232
814
252
13
0.33
0.50
5.97
14.09
19.23
67.49
20.89
1.08
6
18
199
430
622
1,906
679
36
2
7
68
121
276
746
280
6
0.17
0.60
5.86
10.43
23.79
64.30
24.14
0.52
5
17
181
296
673
1,648
616
16
9
8
53
119
278
638
195
6
0.78
0.69
4.57
10.26
23.96
54.99
16.81
0.52
-22.0%
-11.4%
136.4%
38.0%
-23.5%
-27.2%
24.6%
-18.5%
-19.5%
-51.9%
-4.6%
-14.6%
358.8%
15.0%
-22.0%
-1.6%
0.7%
-14.5%
-30.4%
0.0%
2009 2013 2014
2009 2013 2014 2014
1,563PART I CRIMES 1,506 1,306129.58 129.82 112.57 3,896 3,452 -13.1% -13.3%

LOS ANGELES COUNTY SHERIFF'S DEPARTMENT
YTD 05/31/2014 - PART I CRIME RATE PER 10,000 POPULATION
06/06/2014 01:47 pm
Ver: 10.01.17.2014.0 4Page
PATROL STATION PART I CRIME SUMMARY- PRELIMINARY DATA
Per the FBI UCR Guidelines Homicide, Rape and Aggravated Assault are counted by victim. All other crimes are counted by incident, except Arson which is always counted.2009 Population Source: LA County Internal Services Department (based on the 2000 US Census and CA Department of Finance estimates).2013 Population Source: LA County Internal Services Department (based on the 2010 US Census and CA Department of Finance estimates). 2014 YTD Crime Rates based on 2013 population estimates. 2013 population estimates updated for the city of Santa Clarita and the Santa Clarita Valley Station unincorporated area, due to 2012 year end annexations.Crime counts for patrol station areas only; red depicts +30% increases and green depicts -30% decreases. N/C = Not Calculable
This PRELIMINARY INFORMATION is used on an ongoing basis by the LASD for strategic planning and as a tactical early warning system. This data is not final and thus is not the crime data that is reported to the FBI Uniform Crime Index (UCI). This is because some of the most recent reports have not been written yet, nor reviewed by investigators. Once it is reported by investigators and supervisors, the crime data is reported to the FBI/UCI and is available via the pertinent LASD patrol station, pending publication by the FBI/UCI. Once it is reported by the LASD to the FBI, the FBI/UCI crime data is considered the most accurate.
CENTURY
VIOLENT CRIMES
PROPERTY CRIMES
CRIMINAL HOMICIDE
FORCIBLE RAPE
ROBBERY
AGGRAVATED ASSAULT
BURGLARY
LARCENY THEFT
GRAND THEFT AUTO
ARSON
807
1,597
39.02
77.22
1,943
3,838
YTDReportedIncidents
YTDCrime Rate
TotalReported
YTDReportedIncidents
YTDCrime Rate
TotalReportedIncidents
YTDReportedIncidents
YTDCrimeRate
5 YearChange inYTD Crime
Rate
1 YearChange inYTD Crime
Rate
650
1765
34.67
94.14
1,581
4,015
604
1535
32.21
81.87
15
19
288
485
374
515
669
39
0.73
0.92
13.93
23.45
18.08
24.90
32.35
1.89
32
42
735
1,134
946
1,248
1,551
93
8
19
261
362
418
723
602
22
0.43
1.01
13.92
19.31
22.29
38.56
32.11
1.17
22
42
618
899
956
1,696
1,317
46
6
23
239
336
343
651
526
15
0.32
1.23
12.75
17.92
18.29
34.72
28.05
0.80
-17.5%
6.0%
-56.2%
33.7%
-8.5%
-23.6%
1.2%
39.4%
-13.3%
-57.7%
-7.1%
-13.0%
-25.6%
21.8%
-8.4%
-7.2%
-18.0%
-10.0%
-12.6%
-31.6%
2009 2013 2014
2009 2013 2014 2014
2,404PART I CRIMES 2,415 2,139116.24 128.81 114.08 5,781 5,596 -1.9% -11.4%

LOS ANGELES COUNTY SHERIFF'S DEPARTMENT
YTD 05/31/2014 - PART I CRIME RATE PER 10,000 POPULATION
06/06/2014 01:47 pm
Ver: 10.01.17.2014.0 5Page
PATROL STATION PART I CRIME SUMMARY- PRELIMINARY DATA
Per the FBI UCR Guidelines Homicide, Rape and Aggravated Assault are counted by victim. All other crimes are counted by incident, except Arson which is always counted.2009 Population Source: LA County Internal Services Department (based on the 2000 US Census and CA Department of Finance estimates).2013 Population Source: LA County Internal Services Department (based on the 2010 US Census and CA Department of Finance estimates). 2014 YTD Crime Rates based on 2013 population estimates. 2013 population estimates updated for the city of Santa Clarita and the Santa Clarita Valley Station unincorporated area, due to 2012 year end annexations.Crime counts for patrol station areas only; red depicts +30% increases and green depicts -30% decreases. N/C = Not Calculable
This PRELIMINARY INFORMATION is used on an ongoing basis by the LASD for strategic planning and as a tactical early warning system. This data is not final and thus is not the crime data that is reported to the FBI Uniform Crime Index (UCI). This is because some of the most recent reports have not been written yet, nor reviewed by investigators. Once it is reported by investigators and supervisors, the crime data is reported to the FBI/UCI and is available via the pertinent LASD patrol station, pending publication by the FBI/UCI. Once it is reported by the LASD to the FBI, the FBI/UCI crime data is considered the most accurate.
CERRITOS
VIOLENT CRIMES
PROPERTY CRIMES
CRIMINAL HOMICIDE
FORCIBLE RAPE
ROBBERY
AGGRAVATED ASSAULT
BURGLARY
LARCENY THEFT
GRAND THEFT AUTO
ARSON
35
775
6.38
141.24
82
1,750
YTDReportedIncidents
YTDCrime Rate
TotalReported
YTDReportedIncidents
YTDCrime Rate
TotalReportedIncidents
YTDReportedIncidents
YTDCrimeRate
5 YearChange inYTD Crime
Rate
1 YearChange inYTD Crime
Rate
32
795
6.53
162.11
82
1,817
38
638
7.75
130.10
1
3
21
10
95
563
113
4
0.18
0.55
3.83
1.82
17.31
102.60
20.59
0.73
2
4
50
26
242
1,277
226
5
0
0
14
18
192
514
85
4
0.00
0.00
2.85
3.67
39.15
104.81
17.33
0.82
0
3
42
37
375
1,215
221
6
0
0
22
16
115
462
59
2
0.00
0.00
4.49
3.26
23.45
94.21
12.03
0.41
21.5%
-7.9%
0.0%
0.0%
17.2%
79.1%
35.5%
-8.2%
-41.6%
-43.8%
18.7%
-19.8%
0.0%
0.0%
57.5%
-11.2%
-40.1%
-10.1%
-30.6%
-50.0%
2009 2013 2014
2009 2013 2014 2014
810PART I CRIMES 827 676147.62 168.64 137.85 1,832 1,899 -6.6% -18.3%

LOS ANGELES COUNTY SHERIFF'S DEPARTMENT
YTD 05/31/2014 - PART I CRIME RATE PER 10,000 POPULATION
06/06/2014 01:47 pm
Ver: 10.01.17.2014.0 6Page
PATROL STATION PART I CRIME SUMMARY- PRELIMINARY DATA
Per the FBI UCR Guidelines Homicide, Rape and Aggravated Assault are counted by victim. All other crimes are counted by incident, except Arson which is always counted.2009 Population Source: LA County Internal Services Department (based on the 2000 US Census and CA Department of Finance estimates).2013 Population Source: LA County Internal Services Department (based on the 2010 US Census and CA Department of Finance estimates). 2014 YTD Crime Rates based on 2013 population estimates. 2013 population estimates updated for the city of Santa Clarita and the Santa Clarita Valley Station unincorporated area, due to 2012 year end annexations.Crime counts for patrol station areas only; red depicts +30% increases and green depicts -30% decreases. N/C = Not Calculable
This PRELIMINARY INFORMATION is used on an ongoing basis by the LASD for strategic planning and as a tactical early warning system. This data is not final and thus is not the crime data that is reported to the FBI Uniform Crime Index (UCI). This is because some of the most recent reports have not been written yet, nor reviewed by investigators. Once it is reported by investigators and supervisors, the crime data is reported to the FBI/UCI and is available via the pertinent LASD patrol station, pending publication by the FBI/UCI. Once it is reported by the LASD to the FBI, the FBI/UCI crime data is considered the most accurate.
COMPTON
VIOLENT CRIMES
PROPERTY CRIMES
CRIMINAL HOMICIDE
FORCIBLE RAPE
ROBBERY
AGGRAVATED ASSAULT
BURGLARY
LARCENY THEFT
GRAND THEFT AUTO
ARSON
757
1,577
61.07
127.22
1,681
3,704
YTDReportedIncidents
YTDCrime Rate
TotalReported
YTDReportedIncidents
YTDCrime Rate
TotalReportedIncidents
YTDReportedIncidents
YTDCrimeRate
5 YearChange inYTD Crime
Rate
1 YearChange inYTD Crime
Rate
614
1295
51.85
109.35
1,502
3,194
493
1373
41.63
115.94
21
15
217
504
357
643
527
50
1.69
1.21
17.51
40.66
28.80
51.87
42.51
4.03
41
52
557
1,031
923
1,542
1,133
106
13
11
172
418
293
550
435
17
1.10
0.93
14.52
35.30
24.74
46.44
36.73
1.44
37
30
433
1,002
727
1,408
1,015
44
11
12
156
314
268
671
404
30
0.93
1.01
13.17
26.51
22.63
56.66
34.11
2.53
-31.8%
-8.9%
-45.0%
-16.5%
-24.8%
-34.8%
-21.4%
9.2%
-19.8%
-37.2%
-19.7%
6.0%
-15.5%
8.6%
-9.3%
-24.9%
-8.5%
22.0%
-7.1%
75.7%
2009 2013 2014
2009 2013 2014 2014
2,334PART I CRIMES 1,909 1,866188.29 161.2 157.57 5,385 4,696 -16.3% -2.3%
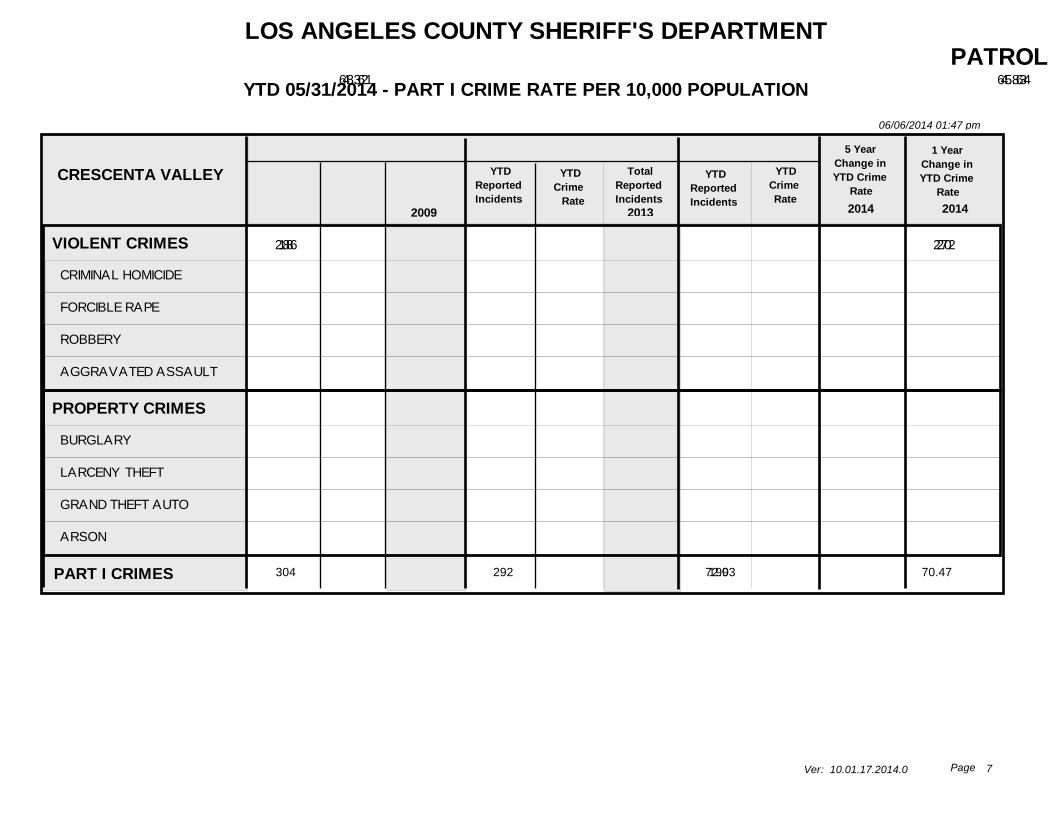
LOS ANGELES COUNTY SHERIFF'S DEPARTMENT
YTD 05/31/2014 - PART I CRIME RATE PER 10,000 POPULATION
06/06/2014 01:47 pm
Ver: 10.01.17.2014.0 7Page
PATROL STATION PART I CRIME SUMMARY- PRELIMINARY DATA
Per the FBI UCR Guidelines Homicide, Rape and Aggravated Assault are counted by victim. All other crimes are counted by incident, except Arson which is always counted.2009 Population Source: LA County Internal Services Department (based on the 2000 US Census and CA Department of Finance estimates).2013 Population Source: LA County Internal Services Department (based on the 2010 US Census and CA Department of Finance estimates). 2014 YTD Crime Rates based on 2013 population estimates. 2013 population estimates updated for the city of Santa Clarita and the Santa Clarita Valley Station unincorporated area, due to 2012 year end annexations.Crime counts for patrol station areas only; red depicts +30% increases and green depicts -30% decreases. N/C = Not Calculable
This PRELIMINARY INFORMATION is used on an ongoing basis by the LASD for strategic planning and as a tactical early warning system. This data is not final and thus is not the crime data that is reported to the FBI Uniform Crime Index (UCI). This is because some of the most recent reports have not been written yet, nor reviewed by investigators. Once it is reported by investigators and supervisors, the crime data is reported to the FBI/UCI and is available via the pertinent LASD patrol station, pending publication by the FBI/UCI. Once it is reported by the LASD to the FBI, the FBI/UCI crime data is considered the most accurate.
CRESCENTA VALLEY
VIOLENT CRIMES
PROPERTY CRIMES
CRIMINAL HOMICIDE
FORCIBLE RAPE
ROBBERY
AGGRAVATED ASSAULT
BURGLARY
LARCENY THEFT
GRAND THEFT AUTO
ARSON
18
286
4.32
68.61
50
761
YTDReportedIncidents
YTDCrime Rate
TotalReported
YTDReportedIncidents
YTDCrime Rate
TotalReportedIncidents
YTDReportedIncidents
YTDCrimeRate
5 YearChange inYTD Crime
Rate
1 YearChange inYTD Crime
Rate
20
272
4.83
65.64
42
553
12
178
2.90
42.95
1
1
5
11
82
181
18
5
0.24
0.24
1.20
2.64
19.67
43.42
4.32
1.20
4
3
17
26
197
508
40
16
1
2
4
13
86
174
12
0
0.24
0.48
0.97
3.14
20.75
41.99
2.90
0.00
1
2
12
27
160
368
23
2
0
1
2
9
54
111
10
3
0.00
0.24
0.48
2.17
13.03
26.79
2.41
0.72
-32.9%
-37.4%
0.0%
0.0%
-60.0%
-17.8%
-33.8%
-38.3%
-44.2%
-40.0%
-40.0%
-34.6%
0.0%
-50.0%
-50.5%
-30.9%
-37.2%
-36.2%
-16.9%
0.0%
2009 2013 2014
2009 2013 2014 2014
304PART I CRIMES 292 19072.93 70.47 45.85 811 595 -37.1% -34.9%
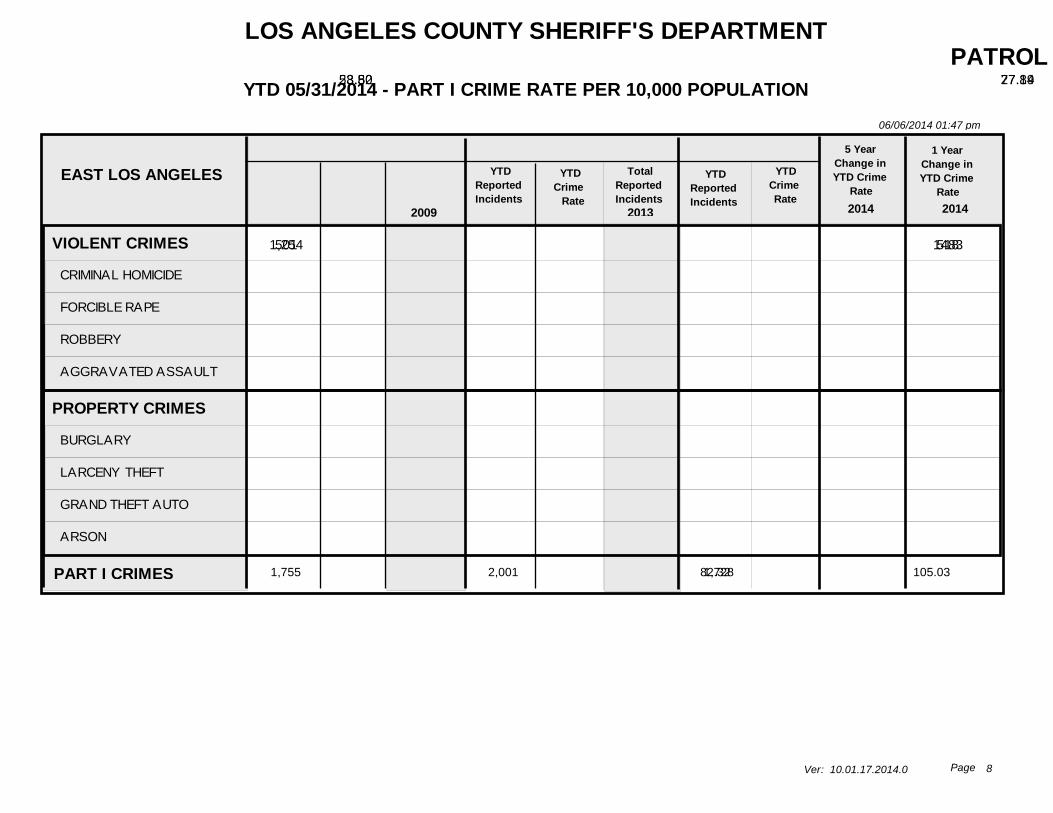
LOS ANGELES COUNTY SHERIFF'S DEPARTMENT
YTD 05/31/2014 - PART I CRIME RATE PER 10,000 POPULATION
06/06/2014 01:47 pm
Ver: 10.01.17.2014.0 8Page
PATROL STATION PART I CRIME SUMMARY- PRELIMINARY DATA
Per the FBI UCR Guidelines Homicide, Rape and Aggravated Assault are counted by victim. All other crimes are counted by incident, except Arson which is always counted.2009 Population Source: LA County Internal Services Department (based on the 2000 US Census and CA Department of Finance estimates).2013 Population Source: LA County Internal Services Department (based on the 2010 US Census and CA Department of Finance estimates). 2014 YTD Crime Rates based on 2013 population estimates. 2013 population estimates updated for the city of Santa Clarita and the Santa Clarita Valley Station unincorporated area, due to 2012 year end annexations.Crime counts for patrol station areas only; red depicts +30% increases and green depicts -30% decreases. N/C = Not Calculable
This PRELIMINARY INFORMATION is used on an ongoing basis by the LASD for strategic planning and as a tactical early warning system. This data is not final and thus is not the crime data that is reported to the FBI Uniform Crime Index (UCI). This is because some of the most recent reports have not been written yet, nor reviewed by investigators. Once it is reported by investigators and supervisors, the crime data is reported to the FBI/UCI and is available via the pertinent LASD patrol station, pending publication by the FBI/UCI. Once it is reported by the LASD to the FBI, the FBI/UCI crime data is considered the most accurate.
EAST LOS ANGELES
VIOLENT CRIMES
PROPERTY CRIMES
CRIMINAL HOMICIDE
FORCIBLE RAPE
ROBBERY
AGGRAVATED ASSAULT
BURGLARY
LARCENY THEFT
GRAND THEFT AUTO
ARSON
501
1,254
23.50
58.82
1,306
3,042
YTDReportedIncidents
YTDCrime Rate
TotalReported
YTDReportedIncidents
YTDCrime Rate
TotalReportedIncidents
YTDReportedIncidents
YTDCrimeRate
5 YearChange inYTD Crime
Rate
1 YearChange inYTD Crime
Rate
518
1483
27.19
77.84
1,104
3,356
395
1333
20.73
69.97
5
19
152
325
210
596
421
27
0.23
0.89
7.13
15.25
9.85
27.96
19.75
1.27
14
39
447
806
520
1,470
1,006
46
9
11
132
366
239
702
531
11
0.47
0.58
6.93
19.21
12.54
36.85
27.87
0.58
14
32
296
762
559
1,632
1,142
23
3
14
119
259
216
691
402
24
0.16
0.73
6.25
13.59
11.34
36.27
21.10
1.26
-11.8%
19.0%
-30.4%
-18.0%
-12.3%
-10.9%
15.1%
29.7%
6.8%
-0.8%
-23.8%
-10.1%
-66.0%
25.9%
-9.8%
-29.3%
-9.6%
-1.6%
-24.3%
117.2%
2009 2013 2014
2009 2013 2014 2014
1,755PART I CRIMES 2,001 1,72882.32 105.03 90.7 4,348 4,460 10.2% -13.6%

LOS ANGELES COUNTY SHERIFF'S DEPARTMENT
YTD 05/31/2014 - PART I CRIME RATE PER 10,000 POPULATION
06/06/2014 01:47 pm
Ver: 10.01.17.2014.0 9Page
PATROL STATION PART I CRIME SUMMARY- PRELIMINARY DATA
Per the FBI UCR Guidelines Homicide, Rape and Aggravated Assault are counted by victim. All other crimes are counted by incident, except Arson which is always counted.2009 Population Source: LA County Internal Services Department (based on the 2000 US Census and CA Department of Finance estimates).2013 Population Source: LA County Internal Services Department (based on the 2010 US Census and CA Department of Finance estimates). 2014 YTD Crime Rates based on 2013 population estimates. 2013 population estimates updated for the city of Santa Clarita and the Santa Clarita Valley Station unincorporated area, due to 2012 year end annexations.Crime counts for patrol station areas only; red depicts +30% increases and green depicts -30% decreases. N/C = Not Calculable
This PRELIMINARY INFORMATION is used on an ongoing basis by the LASD for strategic planning and as a tactical early warning system. This data is not final and thus is not the crime data that is reported to the FBI Uniform Crime Index (UCI). This is because some of the most recent reports have not been written yet, nor reviewed by investigators. Once it is reported by investigators and supervisors, the crime data is reported to the FBI/UCI and is available via the pertinent LASD patrol station, pending publication by the FBI/UCI. Once it is reported by the LASD to the FBI, the FBI/UCI crime data is considered the most accurate.
INDUSTRY
VIOLENT CRIMES
PROPERTY CRIMES
CRIMINAL HOMICIDE
FORCIBLE RAPE
ROBBERY
AGGRAVATED ASSAULT
BURGLARY
LARCENY THEFT
GRAND THEFT AUTO
ARSON
293
1,668
14.79
84.19
667
3,894
YTDReportedIncidents
YTDCrime Rate
TotalReported
YTDReportedIncidents
YTDCrime Rate
TotalReportedIncidents
YTDReportedIncidents
YTDCrimeRate
5 YearChange inYTD Crime
Rate
1 YearChange inYTD Crime
Rate
216
1396
11.88
76.79
451
3,177
196
1176
10.78
64.69
4
10
108
171
399
923
317
29
0.20
0.50
5.45
8.63
20.14
46.59
16.00
1.46
10
23
218
416
932
2,177
743
42
7
15
71
123
360
771
258
7
0.39
0.83
3.91
6.77
19.80
42.41
14.19
0.39
11
32
129
279
860
1,655
643
19
1
6
59
130
237
667
264
8
0.06
0.33
3.25
7.15
13.04
36.69
14.52
0.44
-27.1%
-23.2%
-70.0%
-34.0%
-40.4%
-17.2%
-35.3%
-21.3%
-9.3%
-69.9%
-9.3%
-15.8%
-84.6%
-60.2%
-16.9%
5.6%
-34.1%
-13.5%
2.3%
12.8%
2009 2013 2014
2009 2013 2014 2014
1,961PART I CRIMES 1,612 1,37298.98 88.67 75.47 4,561 3,628 -23.8% -14.9%

LOS ANGELES COUNTY SHERIFF'S DEPARTMENT
YTD 05/31/2014 - PART I CRIME RATE PER 10,000 POPULATION
06/06/2014 01:47 pm
Ver: 10.01.17.2014.0 10Page
PATROL STATION PART I CRIME SUMMARY- PRELIMINARY DATA
Per the FBI UCR Guidelines Homicide, Rape and Aggravated Assault are counted by victim. All other crimes are counted by incident, except Arson which is always counted.2009 Population Source: LA County Internal Services Department (based on the 2000 US Census and CA Department of Finance estimates).2013 Population Source: LA County Internal Services Department (based on the 2010 US Census and CA Department of Finance estimates). 2014 YTD Crime Rates based on 2013 population estimates. 2013 population estimates updated for the city of Santa Clarita and the Santa Clarita Valley Station unincorporated area, due to 2012 year end annexations.Crime counts for patrol station areas only; red depicts +30% increases and green depicts -30% decreases. N/C = Not Calculable
This PRELIMINARY INFORMATION is used on an ongoing basis by the LASD for strategic planning and as a tactical early warning system. This data is not final and thus is not the crime data that is reported to the FBI Uniform Crime Index (UCI). This is because some of the most recent reports have not been written yet, nor reviewed by investigators. Once it is reported by investigators and supervisors, the crime data is reported to the FBI/UCI and is available via the pertinent LASD patrol station, pending publication by the FBI/UCI. Once it is reported by the LASD to the FBI, the FBI/UCI crime data is considered the most accurate.
LAKEWOOD
VIOLENT CRIMES
PROPERTY CRIMES
CRIMINAL HOMICIDE
FORCIBLE RAPE
ROBBERY
AGGRAVATED ASSAULT
BURGLARY
LARCENY THEFT
GRAND THEFT AUTO
ARSON
603
2,512
23.78
99.07
1,405
5,989
YTDReportedIncidents
YTDCrime Rate
TotalReported
YTDReportedIncidents
YTDCrime Rate
TotalReportedIncidents
YTDReportedIncidents
YTDCrimeRate
5 YearChange inYTD Crime
Rate
1 YearChange inYTD Crime
Rate
363
2568
14.89
105.37
845
5,961
316
2135
12.97
87.60
2
28
281
292
440
1,286
766
20
0.08
1.10
11.08
11.52
17.35
50.72
30.21
0.79
7
55
636
707
1,113
3,118
1,716
42
4
18
165
176
516
1,452
590
10
0.16
0.74
6.77
7.22
21.17
59.58
24.21
0.41
8
33
369
435
1,193
3,368
1,373
27
4
8
115
189
455
1,238
433
9
0.16
0.33
4.72
7.75
18.67
50.80
17.77
0.37
-45.5%
-11.6%
100.0%
-70.0%
-57.4%
-32.7%
7.6%
0.2%
-41.2%
-53.2%
-12.9%
-16.9%
0.0%
-55.4%
-30.3%
7.3%
-11.8%
-14.7%
-26.6%
-9.8%
2009 2013 2014
2009 2013 2014 2014
3,115PART I CRIMES 2,931 2,451122.85 120.26 100.57 7,394 6,806 -18.1% -16.4%
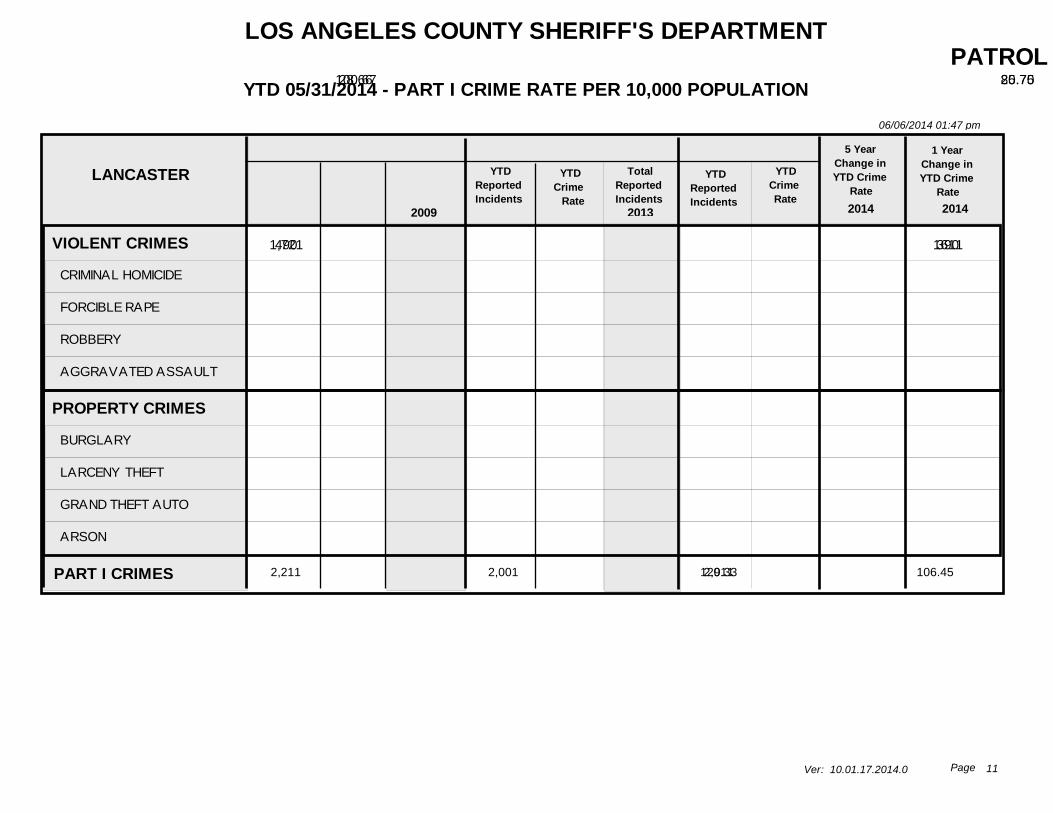
LOS ANGELES COUNTY SHERIFF'S DEPARTMENT
YTD 05/31/2014 - PART I CRIME RATE PER 10,000 POPULATION
06/06/2014 01:47 pm
Ver: 10.01.17.2014.0 11Page
PATROL STATION PART I CRIME SUMMARY- PRELIMINARY DATA
Per the FBI UCR Guidelines Homicide, Rape and Aggravated Assault are counted by victim. All other crimes are counted by incident, except Arson which is always counted.2009 Population Source: LA County Internal Services Department (based on the 2000 US Census and CA Department of Finance estimates).2013 Population Source: LA County Internal Services Department (based on the 2010 US Census and CA Department of Finance estimates). 2014 YTD Crime Rates based on 2013 population estimates. 2013 population estimates updated for the city of Santa Clarita and the Santa Clarita Valley Station unincorporated area, due to 2012 year end annexations.Crime counts for patrol station areas only; red depicts +30% increases and green depicts -30% decreases. N/C = Not Calculable
This PRELIMINARY INFORMATION is used on an ongoing basis by the LASD for strategic planning and as a tactical early warning system. This data is not final and thus is not the crime data that is reported to the FBI Uniform Crime Index (UCI). This is because some of the most recent reports have not been written yet, nor reviewed by investigators. Once it is reported by investigators and supervisors, the crime data is reported to the FBI/UCI and is available via the pertinent LASD patrol station, pending publication by the FBI/UCI. Once it is reported by the LASD to the FBI, the FBI/UCI crime data is considered the most accurate.
LANCASTER
VIOLENT CRIMES
PROPERTY CRIMES
CRIMINAL HOMICIDE
FORCIBLE RAPE
ROBBERY
AGGRAVATED ASSAULT
BURGLARY
LARCENY THEFT
GRAND THEFT AUTO
ARSON
490
1,721
28.66
100.67
1,093
4,041
YTDReportedIncidents
YTDCrime Rate
TotalReported
YTDReportedIncidents
YTDCrime Rate
TotalReportedIncidents
YTDReportedIncidents
YTDCrimeRate
5 YearChange inYTD Crime
Rate
1 YearChange inYTD Crime
Rate
390
1611
20.75
85.70
921
3,986
419
1592
22.29
84.69
6
32
148
304
629
829
226
37
0.35
1.87
8.66
17.78
36.79
48.49
13.22
2.16
15
71
335
672
1,408
2,012
540
81
5
21
91
273
470
959
167
15
0.27
1.12
4.84
14.52
25.00
51.01
8.88
0.80
10
53
267
591
1,223
2,227
483
53
3
24
99
293
506
862
195
29
0.16
1.28
5.27
15.59
26.92
45.85
10.37
1.54
-22.2%
-15.9%
-54.3%
-31.6%
-39.2%
-12.3%
-26.8%
-5.4%
-21.6%
-28.7%
7.4%
-1.2%
-40.7%
14.3%
8.9%
7.4%
7.7%
-10.1%
16.8%
92.5%
2009 2013 2014
2009 2013 2014 2014
2,211PART I CRIMES 2,001 2,011129.33 106.45 106.98 5,134 4,907 -17.3% 0.5%

LOS ANGELES COUNTY SHERIFF'S DEPARTMENT
YTD 05/31/2014 - PART I CRIME RATE PER 10,000 POPULATION
06/06/2014 01:47 pm
Ver: 10.01.17.2014.0 12Page
PATROL STATION PART I CRIME SUMMARY- PRELIMINARY DATA
Per the FBI UCR Guidelines Homicide, Rape and Aggravated Assault are counted by victim. All other crimes are counted by incident, except Arson which is always counted.2009 Population Source: LA County Internal Services Department (based on the 2000 US Census and CA Department of Finance estimates).2013 Population Source: LA County Internal Services Department (based on the 2010 US Census and CA Department of Finance estimates). 2014 YTD Crime Rates based on 2013 population estimates. 2013 population estimates updated for the city of Santa Clarita and the Santa Clarita Valley Station unincorporated area, due to 2012 year end annexations.Crime counts for patrol station areas only; red depicts +30% increases and green depicts -30% decreases. N/C = Not Calculable
This PRELIMINARY INFORMATION is used on an ongoing basis by the LASD for strategic planning and as a tactical early warning system. This data is not final and thus is not the crime data that is reported to the FBI Uniform Crime Index (UCI). This is because some of the most recent reports have not been written yet, nor reviewed by investigators. Once it is reported by investigators and supervisors, the crime data is reported to the FBI/UCI and is available via the pertinent LASD patrol station, pending publication by the FBI/UCI. Once it is reported by the LASD to the FBI, the FBI/UCI crime data is considered the most accurate.
LOMITA
VIOLENT CRIMES
PROPERTY CRIMES
CRIMINAL HOMICIDE
FORCIBLE RAPE
ROBBERY
AGGRAVATED ASSAULT
BURGLARY
LARCENY THEFT
GRAND THEFT AUTO
ARSON
82
474
10.53
60.88
171
1,017
YTDReportedIncidents
YTDCrime Rate
TotalReported
YTDReportedIncidents
YTDCrime Rate
TotalReportedIncidents
YTDReportedIncidents
YTDCrimeRate
5 YearChange inYTD Crime
Rate
1 YearChange inYTD Crime
Rate
42
536
5.60
71.52
107
1,226
44
394
5.87
52.57
0
4
23
55
133
293
42
6
0.00
0.51
2.95
7.06
17.08
37.63
5.39
0.77
2
6
40
123
278
634
96
9
0
2
13
27
156
339
40
1
0.00
0.27
1.73
3.60
20.82
45.24
5.34
0.13
0
2
25
80
351
742
132
1
0
3
12
29
116
236
38
4
0.00
0.40
1.60
3.87
15.48
31.49
5.07
0.53
-44.3%
-13.7%
0.0%
-21.6%
-45.8%
-45.2%
-9.4%
-16.3%
-5.9%
-31.2%
4.8%
-26.5%
0.0%
48.2%
-7.5%
7.5%
-25.7%
-30.4%
-5.1%
307.7%
2009 2013 2014
2009 2013 2014 2014
556PART I CRIMES 578 43871.41 77.12 58.44 1,188 1,333 -18.2% -24.2%

LOS ANGELES COUNTY SHERIFF'S DEPARTMENT
YTD 05/31/2014 - PART I CRIME RATE PER 10,000 POPULATION
06/06/2014 01:47 pm
Ver: 10.01.17.2014.0 13Page
PATROL STATION PART I CRIME SUMMARY- PRELIMINARY DATA
Per the FBI UCR Guidelines Homicide, Rape and Aggravated Assault are counted by victim. All other crimes are counted by incident, except Arson which is always counted.2009 Population Source: LA County Internal Services Department (based on the 2000 US Census and CA Department of Finance estimates).2013 Population Source: LA County Internal Services Department (based on the 2010 US Census and CA Department of Finance estimates). 2014 YTD Crime Rates based on 2013 population estimates. 2013 population estimates updated for the city of Santa Clarita and the Santa Clarita Valley Station unincorporated area, due to 2012 year end annexations.Crime counts for patrol station areas only; red depicts +30% increases and green depicts -30% decreases. N/C = Not Calculable
This PRELIMINARY INFORMATION is used on an ongoing basis by the LASD for strategic planning and as a tactical early warning system. This data is not final and thus is not the crime data that is reported to the FBI Uniform Crime Index (UCI). This is because some of the most recent reports have not been written yet, nor reviewed by investigators. Once it is reported by investigators and supervisors, the crime data is reported to the FBI/UCI and is available via the pertinent LASD patrol station, pending publication by the FBI/UCI. Once it is reported by the LASD to the FBI, the FBI/UCI crime data is considered the most accurate.
MALIBU/LOST HILLS
VIOLENT CRIMES
PROPERTY CRIMES
CRIMINAL HOMICIDE
FORCIBLE RAPE
ROBBERY
AGGRAVATED ASSAULT
BURGLARY
LARCENY THEFT
GRAND THEFT AUTO
ARSON
46
501
4.93
53.74
106
1,300
YTDReportedIncidents
YTDCrime Rate
TotalReported
YTDReportedIncidents
YTDCrime Rate
TotalReportedIncidents
YTDReportedIncidents
YTDCrimeRate
5 YearChange inYTD Crime
Rate
1 YearChange inYTD Crime
Rate
32
605
3.59
67.85
98
1,374
27
473
3.03
53.04
0
4
13
29
158
310
31
2
0.00
0.43
1.39
3.11
16.95
33.25
3.33
0.21
0
12
24
70
382
839
65
14
0
4
15
13
190
383
25
7
0.00
0.45
1.68
1.46
21.31
42.95
2.80
0.79
0
11
34
53
413
886
59
16
0
6
5
16
139
309
18
7
0.00
0.67
0.56
1.79
15.59
34.65
2.02
0.79
-38.5%
-1.3%
0.0%
55.8%
-59.7%
-42.4%
-8.0%
4.2%
-39.3%
276.2%
-15.6%
-21.8%
0.0%
48.9%
-66.7%
22.6%
-26.8%
-19.3%
-27.9%
0.0%
2009 2013 2014
2009 2013 2014 2014
547PART I CRIMES 637 50058.67 71.44 56.07 1,406 1,472 -4.5% -21.5%

LOS ANGELES COUNTY SHERIFF'S DEPARTMENT
YTD 05/31/2014 - PART I CRIME RATE PER 10,000 POPULATION
06/06/2014 01:47 pm
Ver: 10.01.17.2014.0 14Page
PATROL STATION PART I CRIME SUMMARY- PRELIMINARY DATA
Per the FBI UCR Guidelines Homicide, Rape and Aggravated Assault are counted by victim. All other crimes are counted by incident, except Arson which is always counted.2009 Population Source: LA County Internal Services Department (based on the 2000 US Census and CA Department of Finance estimates).2013 Population Source: LA County Internal Services Department (based on the 2010 US Census and CA Department of Finance estimates). 2014 YTD Crime Rates based on 2013 population estimates. 2013 population estimates updated for the city of Santa Clarita and the Santa Clarita Valley Station unincorporated area, due to 2012 year end annexations.Crime counts for patrol station areas only; red depicts +30% increases and green depicts -30% decreases. N/C = Not Calculable
This PRELIMINARY INFORMATION is used on an ongoing basis by the LASD for strategic planning and as a tactical early warning system. This data is not final and thus is not the crime data that is reported to the FBI Uniform Crime Index (UCI). This is because some of the most recent reports have not been written yet, nor reviewed by investigators. Once it is reported by investigators and supervisors, the crime data is reported to the FBI/UCI and is available via the pertinent LASD patrol station, pending publication by the FBI/UCI. Once it is reported by the LASD to the FBI, the FBI/UCI crime data is considered the most accurate.
MARINA DEL REY
VIOLENT CRIMES
PROPERTY CRIMES
CRIMINAL HOMICIDE
FORCIBLE RAPE
ROBBERY
AGGRAVATED ASSAULT
BURGLARY
LARCENY THEFT
GRAND THEFT AUTO
ARSON
50
354
19.84
140.47
118
931
YTDReportedIncidents
YTDCrime Rate
TotalReported
YTDReportedIncidents
YTDCrime Rate
TotalReportedIncidents
YTDReportedIncidents
YTDCrimeRate
5 YearChange inYTD Crime
Rate
1 YearChange inYTD Crime
Rate
47
399
17.61
149.47
108
915
33
361
12.36
135.24
0
2
23
25
126
193
34
1
0.00
0.79
9.13
9.92
50.00
76.58
13.49
0.40
0
4
59
55
262
581
86
2
0
2
17
28
106
253
39
1
0.00
0.75
6.37
10.49
39.71
94.78
14.61
0.37
1
2
46
59
253
572
88
2
0
3
9
21
105
228
27
1
0.00
1.12
3.37
7.87
39.33
85.41
10.11
0.37
-37.7%
-3.7%
0.0%
41.8%
-63.1%
-20.7%
-21.3%
11.5%
-25.1%
-7.5%
-29.8%
-9.5%
0.0%
49.3%
-47.1%
-25.0%
-1.0%
-9.9%
-30.8%
0.0%
2009 2013 2014
2009 2013 2014 2014
404PART I CRIMES 446 394160.31 167.08 147.6 1,049 1,023 -7.9% -11.7%

LOS ANGELES COUNTY SHERIFF'S DEPARTMENT
YTD 05/31/2014 - PART I CRIME RATE PER 10,000 POPULATION
06/06/2014 01:47 pm
Ver: 10.01.17.2014.0 15Page
PATROL STATION PART I CRIME SUMMARY- PRELIMINARY DATA
Per the FBI UCR Guidelines Homicide, Rape and Aggravated Assault are counted by victim. All other crimes are counted by incident, except Arson which is always counted.2009 Population Source: LA County Internal Services Department (based on the 2000 US Census and CA Department of Finance estimates).2013 Population Source: LA County Internal Services Department (based on the 2010 US Census and CA Department of Finance estimates). 2014 YTD Crime Rates based on 2013 population estimates. 2013 population estimates updated for the city of Santa Clarita and the Santa Clarita Valley Station unincorporated area, due to 2012 year end annexations.Crime counts for patrol station areas only; red depicts +30% increases and green depicts -30% decreases. N/C = Not Calculable
This PRELIMINARY INFORMATION is used on an ongoing basis by the LASD for strategic planning and as a tactical early warning system. This data is not final and thus is not the crime data that is reported to the FBI Uniform Crime Index (UCI). This is because some of the most recent reports have not been written yet, nor reviewed by investigators. Once it is reported by investigators and supervisors, the crime data is reported to the FBI/UCI and is available via the pertinent LASD patrol station, pending publication by the FBI/UCI. Once it is reported by the LASD to the FBI, the FBI/UCI crime data is considered the most accurate.
NORWALK
VIOLENT CRIMES
PROPERTY CRIMES
CRIMINAL HOMICIDE
FORCIBLE RAPE
ROBBERY
AGGRAVATED ASSAULT
BURGLARY
LARCENY THEFT
GRAND THEFT AUTO
ARSON
312
1,536
13.45
66.20
724
3,480
YTDReportedIncidents
YTDCrime Rate
TotalReported
YTDReportedIncidents
YTDCrime Rate
TotalReportedIncidents
YTDReportedIncidents
YTDCrimeRate
5 YearChange inYTD Crime
Rate
1 YearChange inYTD Crime
Rate
262
1745
11.86
78.96
617
3,846
226
1441
10.23
65.21
4
17
107
184
310
770
444
12
0.17
0.73
4.61
7.93
13.36
33.19
19.14
0.52
16
32
253
423
715
1,861
876
28
2
25
88
147
399
963
375
8
0.09
1.13
3.98
6.65
18.06
43.58
16.97
0.36
6
41
198
372
804
2,180
843
19
6
12
74
134
274
879
276
12
0.27
0.54
3.35
6.06
12.40
39.78
12.49
0.54
-23.9%
-1.5%
58.8%
-26.0%
-27.3%
-23.6%
-7.2%
19.9%
-34.7%
3.9%
-13.7%
-17.4%
200.0%
-52.2%
-15.8%
-8.9%
-31.3%
-8.7%
-26.4%
50.0%
2009 2013 2014
2009 2013 2014 2014
1,848PART I CRIMES 2,007 1,66779.65 90.82 75.44 4,204 4,463 -5.3% -17.0%

LOS ANGELES COUNTY SHERIFF'S DEPARTMENT
YTD 05/31/2014 - PART I CRIME RATE PER 10,000 POPULATION
06/06/2014 01:47 pm
Ver: 10.01.17.2014.0 16Page
PATROL STATION PART I CRIME SUMMARY- PRELIMINARY DATA
Per the FBI UCR Guidelines Homicide, Rape and Aggravated Assault are counted by victim. All other crimes are counted by incident, except Arson which is always counted.2009 Population Source: LA County Internal Services Department (based on the 2000 US Census and CA Department of Finance estimates).2013 Population Source: LA County Internal Services Department (based on the 2010 US Census and CA Department of Finance estimates). 2014 YTD Crime Rates based on 2013 population estimates. 2013 population estimates updated for the city of Santa Clarita and the Santa Clarita Valley Station unincorporated area, due to 2012 year end annexations.Crime counts for patrol station areas only; red depicts +30% increases and green depicts -30% decreases. N/C = Not Calculable
This PRELIMINARY INFORMATION is used on an ongoing basis by the LASD for strategic planning and as a tactical early warning system. This data is not final and thus is not the crime data that is reported to the FBI Uniform Crime Index (UCI). This is because some of the most recent reports have not been written yet, nor reviewed by investigators. Once it is reported by investigators and supervisors, the crime data is reported to the FBI/UCI and is available via the pertinent LASD patrol station, pending publication by the FBI/UCI. Once it is reported by the LASD to the FBI, the FBI/UCI crime data is considered the most accurate.
PALMDALE
VIOLENT CRIMES
PROPERTY CRIMES
CRIMINAL HOMICIDE
FORCIBLE RAPE
ROBBERY
AGGRAVATED ASSAULT
BURGLARY
LARCENY THEFT
GRAND THEFT AUTO
ARSON
394
1,800
22.76
103.99
949
4,140
YTDReportedIncidents
YTDCrime Rate
TotalReported
YTDReportedIncidents
YTDCrime Rate
TotalReportedIncidents
YTDReportedIncidents
YTDCrimeRate
5 YearChange inYTD Crime
Rate
1 YearChange inYTD Crime
Rate
333
1680
16.92
85.37
898
3,914
366
1435
18.60
72.92
1
19
123
251
559
954
259
28
0.06
1.10
7.11
14.50
32.29
55.12
14.96
1.62
11
50
286
602
1,284
2,271
534
51
6
12
106
209
579
905
174
22
0.30
0.61
5.39
10.62
29.42
45.99
8.84
1.12
13
34
272
579
1,229
2,203
435
47
5
14
98
249
350
907
162
16
0.25
0.71
4.98
12.65
17.78
46.09
8.23
0.81
-18.3%
-29.9%
316.7%
-35.5%
-30.0%
-12.8%
-44.9%
-16.4%
-45.0%
-50.0%
9.9%
-14.6%
-16.7%
16.4%
-7.6%
19.1%
-39.6%
0.2%
-6.9%
-27.7%
2009 2013 2014
2009 2013 2014 2014
2,194PART I CRIMES 2,013 1,801126.75 102.29 91.52 5,089 4,812 -27.8% -10.5%
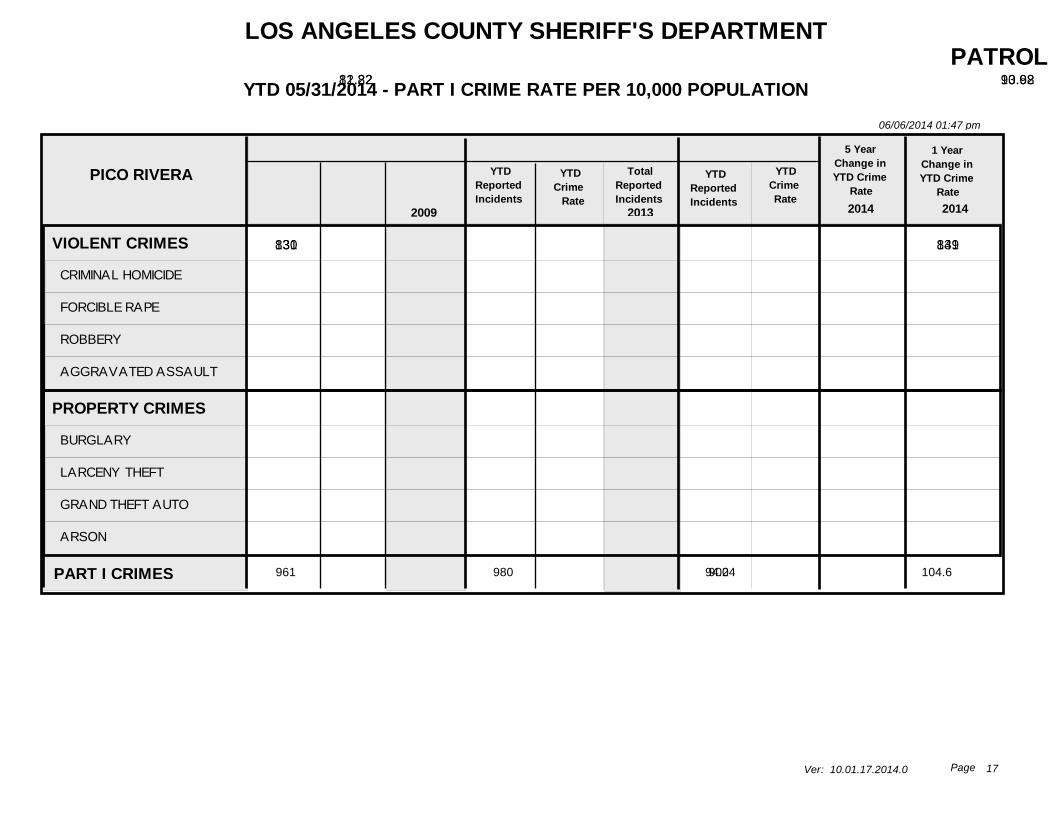
LOS ANGELES COUNTY SHERIFF'S DEPARTMENT
YTD 05/31/2014 - PART I CRIME RATE PER 10,000 POPULATION
06/06/2014 01:47 pm
Ver: 10.01.17.2014.0 17Page
PATROL STATION PART I CRIME SUMMARY- PRELIMINARY DATA
Per the FBI UCR Guidelines Homicide, Rape and Aggravated Assault are counted by victim. All other crimes are counted by incident, except Arson which is always counted.2009 Population Source: LA County Internal Services Department (based on the 2000 US Census and CA Department of Finance estimates).2013 Population Source: LA County Internal Services Department (based on the 2010 US Census and CA Department of Finance estimates). 2014 YTD Crime Rates based on 2013 population estimates. 2013 population estimates updated for the city of Santa Clarita and the Santa Clarita Valley Station unincorporated area, due to 2012 year end annexations.Crime counts for patrol station areas only; red depicts +30% increases and green depicts -30% decreases. N/C = Not Calculable
This PRELIMINARY INFORMATION is used on an ongoing basis by the LASD for strategic planning and as a tactical early warning system. This data is not final and thus is not the crime data that is reported to the FBI Uniform Crime Index (UCI). This is because some of the most recent reports have not been written yet, nor reviewed by investigators. Once it is reported by investigators and supervisors, the crime data is reported to the FBI/UCI and is available via the pertinent LASD patrol station, pending publication by the FBI/UCI. Once it is reported by the LASD to the FBI, the FBI/UCI crime data is considered the most accurate.
PICO RIVERA
VIOLENT CRIMES
PROPERTY CRIMES
CRIMINAL HOMICIDE
FORCIBLE RAPE
ROBBERY
AGGRAVATED ASSAULT
BURGLARY
LARCENY THEFT
GRAND THEFT AUTO
ARSON
131
830
12.82
81.22
320
1,920
YTDReportedIncidents
YTDCrime Rate
TotalReported
YTDReportedIncidents
YTDCrime Rate
TotalReportedIncidents
YTDReportedIncidents
YTDCrimeRate
5 YearChange inYTD Crime
Rate
1 YearChange inYTD Crime
Rate
131
849
13.98
90.62
317
2,021
138
764
14.73
81.55
1
4
44
82
141
463
221
5
0.10
0.39
4.31
8.02
13.80
45.31
21.63
0.49
8
18
102
192
294
1,127
492
7
0
5
32
94
130
522
192
5
0.00
0.53
3.42
10.03
13.88
55.72
20.49
0.53
4
10
85
218
381
1,189
435
16
2
5
38
93
182
409
171
2
0.21
0.53
4.06
9.93
19.43
43.66
18.25
0.21
14.9%
0.4%
110.0%
35.9%
-5.8%
23.8%
40.8%
-3.6%
-15.6%
-57.1%
5.4%
-10.0%
0.0%
0.0%
18.7%
-1.0%
40.0%
-21.6%
-10.9%
-60.4%
2009 2013 2014
2009 2013 2014 2014
961PART I CRIMES 980 90294.04 104.6 96.28 2,240 2,338 2.4% -8.0%

LOS ANGELES COUNTY SHERIFF'S DEPARTMENT
YTD 05/31/2014 - PART I CRIME RATE PER 10,000 POPULATION
06/06/2014 01:47 pm
Ver: 10.01.17.2014.0 18Page
PATROL STATION PART I CRIME SUMMARY- PRELIMINARY DATA
Per the FBI UCR Guidelines Homicide, Rape and Aggravated Assault are counted by victim. All other crimes are counted by incident, except Arson which is always counted.2009 Population Source: LA County Internal Services Department (based on the 2000 US Census and CA Department of Finance estimates).2013 Population Source: LA County Internal Services Department (based on the 2010 US Census and CA Department of Finance estimates). 2014 YTD Crime Rates based on 2013 population estimates. 2013 population estimates updated for the city of Santa Clarita and the Santa Clarita Valley Station unincorporated area, due to 2012 year end annexations.Crime counts for patrol station areas only; red depicts +30% increases and green depicts -30% decreases. N/C = Not Calculable
This PRELIMINARY INFORMATION is used on an ongoing basis by the LASD for strategic planning and as a tactical early warning system. This data is not final and thus is not the crime data that is reported to the FBI Uniform Crime Index (UCI). This is because some of the most recent reports have not been written yet, nor reviewed by investigators. Once it is reported by investigators and supervisors, the crime data is reported to the FBI/UCI and is available via the pertinent LASD patrol station, pending publication by the FBI/UCI. Once it is reported by the LASD to the FBI, the FBI/UCI crime data is considered the most accurate.
SAN DIMAS
VIOLENT CRIMES
PROPERTY CRIMES
CRIMINAL HOMICIDE
FORCIBLE RAPE
ROBBERY
AGGRAVATED ASSAULT
BURGLARY
LARCENY THEFT
GRAND THEFT AUTO
ARSON
83
563
8.54
57.95
239
1,391
YTDReportedIncidents
YTDCrime Rate
TotalReported
YTDReportedIncidents
YTDCrime Rate
TotalReportedIncidents
YTDReportedIncidents
YTDCrimeRate
5 YearChange inYTD Crime
Rate
1 YearChange inYTD Crime
Rate
82
492
10.08
60.46
208
1,242
73
423
8.97
51.98
0
6
21
56
134
363
64
2
0.00
0.62
2.16
5.76
13.79
37.36
6.59
0.21
2
17
58
162
321
909
151
10
1
4
19
58
147
278
64
3
0.12
0.49
2.33
7.13
18.06
34.16
7.86
0.37
2
14
42
150
334
742
157
9
1
5
13
54
78
276
67
2
0.12
0.61
1.60
6.64
9.59
33.92
8.23
0.25
5.0%
-10.3%
0.0%
-1.6%
-25.9%
15.3%
-30.5%
-9.2%
24.9%
19.1%
-11.0%
-14.0%
0.0%
24.5%
-31.3%
-6.9%
-46.9%
-0.7%
4.7%
-32.4%
2009 2013 2014
2009 2013 2014 2014
646PART I CRIMES 574 49666.49 70.54 60.95 1,630 1,450 -8.4% -13.6%

LOS ANGELES COUNTY SHERIFF'S DEPARTMENT
YTD 05/31/2014 - PART I CRIME RATE PER 10,000 POPULATION
06/06/2014 01:47 pm
Ver: 10.01.17.2014.0 19Page
PATROL STATION PART I CRIME SUMMARY- PRELIMINARY DATA
Per the FBI UCR Guidelines Homicide, Rape and Aggravated Assault are counted by victim. All other crimes are counted by incident, except Arson which is always counted.2009 Population Source: LA County Internal Services Department (based on the 2000 US Census and CA Department of Finance estimates).2013 Population Source: LA County Internal Services Department (based on the 2010 US Census and CA Department of Finance estimates). 2014 YTD Crime Rates based on 2013 population estimates. 2013 population estimates updated for the city of Santa Clarita and the Santa Clarita Valley Station unincorporated area, due to 2012 year end annexations.Crime counts for patrol station areas only; red depicts +30% increases and green depicts -30% decreases. N/C = Not Calculable
This PRELIMINARY INFORMATION is used on an ongoing basis by the LASD for strategic planning and as a tactical early warning system. This data is not final and thus is not the crime data that is reported to the FBI Uniform Crime Index (UCI). This is because some of the most recent reports have not been written yet, nor reviewed by investigators. Once it is reported by investigators and supervisors, the crime data is reported to the FBI/UCI and is available via the pertinent LASD patrol station, pending publication by the FBI/UCI. Once it is reported by the LASD to the FBI, the FBI/UCI crime data is considered the most accurate.
SANTA CLARITA VALLEY
VIOLENT CRIMES
PROPERTY CRIMES
CRIMINAL HOMICIDE
FORCIBLE RAPE
ROBBERY
AGGRAVATED ASSAULT
BURGLARY
LARCENY THEFT
GRAND THEFT AUTO
ARSON
196
1,644
8.10
67.91
500
3,954
YTDReportedIncidents
YTDCrime Rate
TotalReported
YTDReportedIncidents
YTDCrime Rate
TotalReportedIncidents
YTDReportedIncidents
YTDCrimeRate
5 YearChange inYTD Crime
Rate
1 YearChange inYTD Crime
Rate
153
1568
5.69
58.35
390
3,661
151
1261
5.57
46.49
2
13
65
116
403
1,059
161
21
0.08
0.54
2.68
4.79
16.65
43.74
6.65
0.87
6
26
142
326
972
2,547
391
44
1
14
38
100
430
998
130
10
0.04
0.52
1.41
3.72
16.00
37.14
4.84
0.37
4
28
119
239
935
2,393
314
19
2
11
44
94
315
822
114
10
0.07
0.41
1.62
3.47
11.61
30.31
4.20
0.37
-31.2%
-31.5%
-12.5%
-24.1%
-39.6%
-27.6%
-30.3%
-30.7%
-36.8%
-57.5%
-2.1%
-20.3%
75.0%
-21.2%
14.9%
-6.7%
-27.4%
-18.4%
-13.2%
0.0%
2009 2013 2014
2009 2013 2014 2014
1,840PART I CRIMES 1,721 1,41276.01 64.04 52.06 4,454 4,051 -31.5% -18.7%

LOS ANGELES COUNTY SHERIFF'S DEPARTMENT
YTD 05/31/2014 - PART I CRIME RATE PER 10,000 POPULATION
06/06/2014 01:47 pm
Ver: 10.01.17.2014.0 20Page
PATROL STATION PART I CRIME SUMMARY- PRELIMINARY DATA
Per the FBI UCR Guidelines Homicide, Rape and Aggravated Assault are counted by victim. All other crimes are counted by incident, except Arson which is always counted.2009 Population Source: LA County Internal Services Department (based on the 2000 US Census and CA Department of Finance estimates).2013 Population Source: LA County Internal Services Department (based on the 2010 US Census and CA Department of Finance estimates). 2014 YTD Crime Rates based on 2013 population estimates. 2013 population estimates updated for the city of Santa Clarita and the Santa Clarita Valley Station unincorporated area, due to 2012 year end annexations.Crime counts for patrol station areas only; red depicts +30% increases and green depicts -30% decreases. N/C = Not Calculable
This PRELIMINARY INFORMATION is used on an ongoing basis by the LASD for strategic planning and as a tactical early warning system. This data is not final and thus is not the crime data that is reported to the FBI Uniform Crime Index (UCI). This is because some of the most recent reports have not been written yet, nor reviewed by investigators. Once it is reported by investigators and supervisors, the crime data is reported to the FBI/UCI and is available via the pertinent LASD patrol station, pending publication by the FBI/UCI. Once it is reported by the LASD to the FBI, the FBI/UCI crime data is considered the most accurate.
SOUTH LOS ANGELES
VIOLENT CRIMES
PROPERTY CRIMES
CRIMINAL HOMICIDE
FORCIBLE RAPE
ROBBERY
AGGRAVATED ASSAULT
BURGLARY
LARCENY THEFT
GRAND THEFT AUTO
ARSON
503
874
39.16
68.05
1,192
1,918
YTDReportedIncidents
YTDCrime Rate
TotalReported
YTDReportedIncidents
YTDCrime Rate
TotalReportedIncidents
YTDReportedIncidents
YTDCrimeRate
5 YearChange inYTD Crime
Rate
1 YearChange inYTD Crime
Rate
484
765
41.29
65.26
1,122
1,821
433
793
36.94
67.65
13
15
178
297
286
319
254
15
1.01
1.17
13.86
23.12
22.27
24.84
19.78
1.17
24
39
409
720
639
724
520
35
6
13
175
290
261
335
159
10
0.51
1.11
14.93
24.74
22.27
28.58
13.56
0.85
19
31
379
693
616
778
405
22
7
14
124
288
300
314
173
6
0.60
1.19
10.58
24.57
25.59
26.79
14.76
0.51
-5.7%
-0.6%
-40.6%
1.7%
-23.7%
6.3%
14.9%
7.9%
-25.4%
-56.4%
-10.5%
3.7%
17.7%
7.2%
-29.1%
-0.7%
14.9%
-6.3%
8.9%
-40.0%
2009 2013 2014
2009 2013 2014 2014
1,377PART I CRIMES 1,249 1,226107.21 106.55 104.59 3,110 2,943 -2.4% -1.8%

LOS ANGELES COUNTY SHERIFF'S DEPARTMENT
YTD 05/31/2014 - PART I CRIME RATE PER 10,000 POPULATION
06/06/2014 01:47 pm
Ver: 10.01.17.2014.0 21Page
PATROL STATION PART I CRIME SUMMARY- PRELIMINARY DATA
Per the FBI UCR Guidelines Homicide, Rape and Aggravated Assault are counted by victim. All other crimes are counted by incident, except Arson which is always counted.2009 Population Source: LA County Internal Services Department (based on the 2000 US Census and CA Department of Finance estimates).2013 Population Source: LA County Internal Services Department (based on the 2010 US Census and CA Department of Finance estimates). 2014 YTD Crime Rates based on 2013 population estimates. 2013 population estimates updated for the city of Santa Clarita and the Santa Clarita Valley Station unincorporated area, due to 2012 year end annexations.Crime counts for patrol station areas only; red depicts +30% increases and green depicts -30% decreases. N/C = Not Calculable
This PRELIMINARY INFORMATION is used on an ongoing basis by the LASD for strategic planning and as a tactical early warning system. This data is not final and thus is not the crime data that is reported to the FBI Uniform Crime Index (UCI). This is because some of the most recent reports have not been written yet, nor reviewed by investigators. Once it is reported by investigators and supervisors, the crime data is reported to the FBI/UCI and is available via the pertinent LASD patrol station, pending publication by the FBI/UCI. Once it is reported by the LASD to the FBI, the FBI/UCI crime data is considered the most accurate.
TEMPLE
VIOLENT CRIMES
PROPERTY CRIMES
CRIMINAL HOMICIDE
FORCIBLE RAPE
ROBBERY
AGGRAVATED ASSAULT
BURGLARY
LARCENY THEFT
GRAND THEFT AUTO
ARSON
290
1,528
14.46
76.18
683
3,283
YTDReportedIncidents
YTDCrime Rate
TotalReported
YTDReportedIncidents
YTDCrime Rate
TotalReportedIncidents
YTDReportedIncidents
YTDCrimeRate
5 YearChange inYTD Crime
Rate
1 YearChange inYTD Crime
Rate
168
1167
8.86
61.55
481
3,126
199
1427
10.50
75.27
3
12
105
170
449
802
267
10
0.15
0.60
5.23
8.48
22.39
39.98
13.31
0.50
5
32
258
388
905
1,741
617
20
1
11
58
98
366
633
164
4
0.05
0.58
3.06
5.17
19.30
33.39
8.65
0.21
5
28
170
278
914
1,711
484
17
1
10
51
137
333
893
199
2
0.05
0.53
2.69
7.23
17.56
47.10
10.50
0.11
-27.4%
-1.2%
-66.7%
-11.7%
-48.6%
-14.7%
-21.6%
17.8%
-21.1%
-78.0%
18.5%
22.3%
0.0%
-8.6%
-12.1%
39.9%
-9.0%
41.1%
21.4%
-47.6%
2009 2013 2014
2009 2013 2014 2014
1,818PART I CRIMES 1,335 1,62690.64 70.41 85.77 3,966 3,607 -5.4% 21.8%
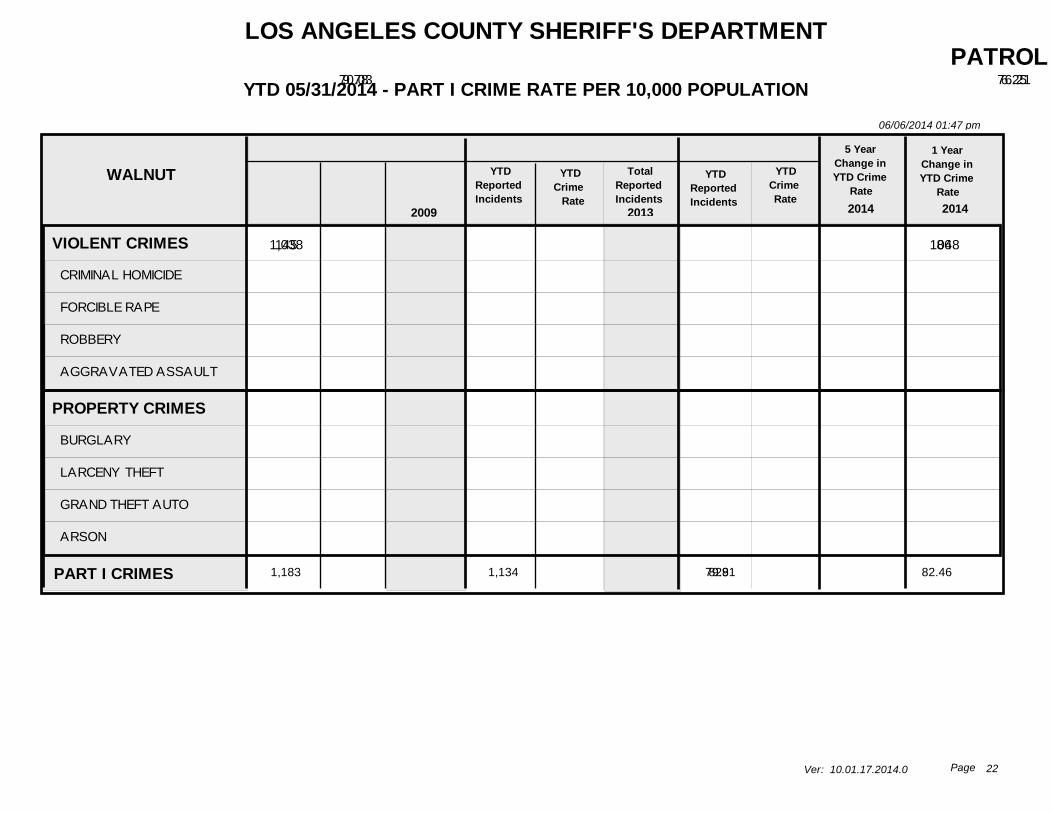
LOS ANGELES COUNTY SHERIFF'S DEPARTMENT
YTD 05/31/2014 - PART I CRIME RATE PER 10,000 POPULATION
06/06/2014 01:47 pm
Ver: 10.01.17.2014.0 22Page
PATROL STATION PART I CRIME SUMMARY- PRELIMINARY DATA
Per the FBI UCR Guidelines Homicide, Rape and Aggravated Assault are counted by victim. All other crimes are counted by incident, except Arson which is always counted.2009 Population Source: LA County Internal Services Department (based on the 2000 US Census and CA Department of Finance estimates).2013 Population Source: LA County Internal Services Department (based on the 2010 US Census and CA Department of Finance estimates). 2014 YTD Crime Rates based on 2013 population estimates. 2013 population estimates updated for the city of Santa Clarita and the Santa Clarita Valley Station unincorporated area, due to 2012 year end annexations.Crime counts for patrol station areas only; red depicts +30% increases and green depicts -30% decreases. N/C = Not Calculable
This PRELIMINARY INFORMATION is used on an ongoing basis by the LASD for strategic planning and as a tactical early warning system. This data is not final and thus is not the crime data that is reported to the FBI Uniform Crime Index (UCI). This is because some of the most recent reports have not been written yet, nor reviewed by investigators. Once it is reported by investigators and supervisors, the crime data is reported to the FBI/UCI and is available via the pertinent LASD patrol station, pending publication by the FBI/UCI. Once it is reported by the LASD to the FBI, the FBI/UCI crime data is considered the most accurate.
WALNUT
VIOLENT CRIMES
PROPERTY CRIMES
CRIMINAL HOMICIDE
FORCIBLE RAPE
ROBBERY
AGGRAVATED ASSAULT
BURGLARY
LARCENY THEFT
GRAND THEFT AUTO
ARSON
145
1,038
9.78
70.03
274
2,161
YTDReportedIncidents
YTDCrime Rate
TotalReported
YTDReportedIncidents
YTDCrime Rate
TotalReportedIncidents
YTDReportedIncidents
YTDCrimeRate
5 YearChange inYTD Crime
Rate
1 YearChange inYTD Crime
Rate
86
1048
6.25
76.21
180
2,143
91
738
6.62
53.66
1
1
71
72
295
648
93
2
0.07
0.07
4.79
4.86
19.90
43.72
6.27
0.13
1
9
129
135
661
1,294
201
5
0
5
24
57
399
548
101
0
0.00
0.36
1.75
4.14
29.01
39.85
7.34
0.00
1
7
57
115
871
1,078
192
2
0
5
22
64
273
402
61
2
0.00
0.36
1.60
4.65
19.85
29.23
4.44
0.15
-32.3%
-23.4%
0.0%
414.3%
-66.6%
-4.3%
-0.3%
-33.1%
-29.2%
15.4%
5.9%
-29.6%
0.0%
0.0%
-8.6%
12.3%
-31.6%
-26.7%
-39.5%
0.0%
2009 2013 2014
2009 2013 2014 2014
1,183PART I CRIMES 1,134 82979.81 82.46 60.28 2,435 2,323 -24.5% -26.9%
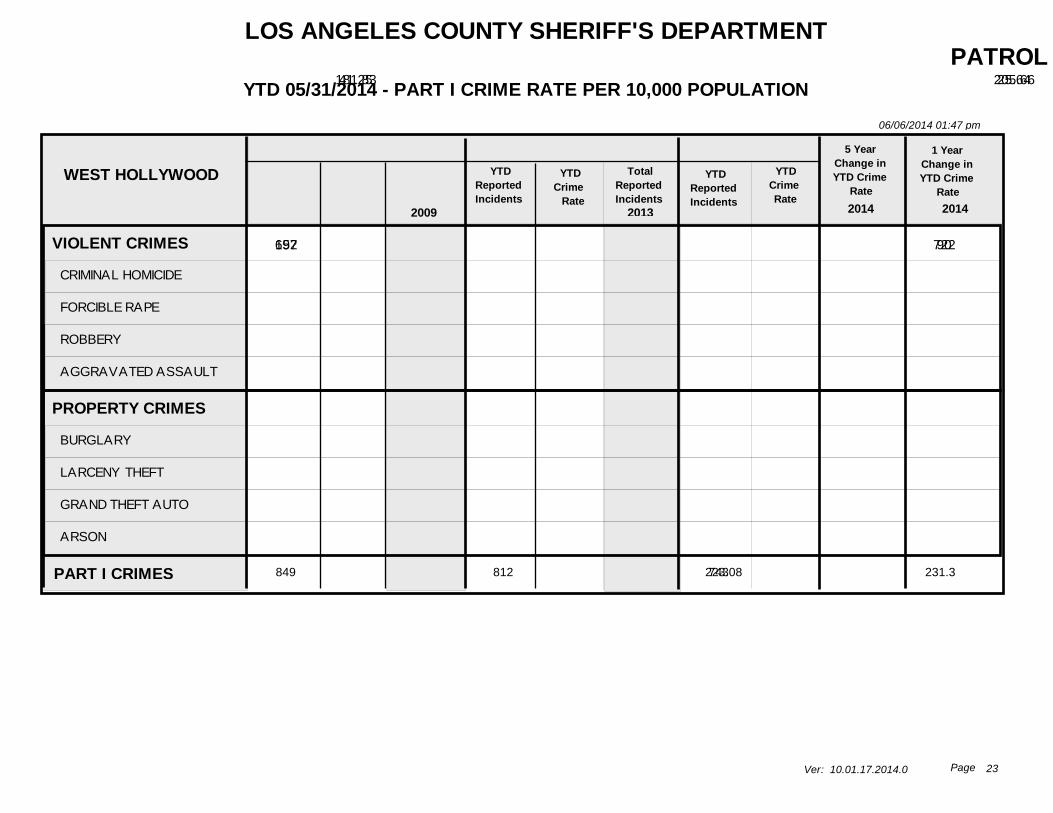
LOS ANGELES COUNTY SHERIFF'S DEPARTMENT
YTD 05/31/2014 - PART I CRIME RATE PER 10,000 POPULATION
06/06/2014 01:47 pm
Ver: 10.01.17.2014.0 23Page
PATROL STATION PART I CRIME SUMMARY- PRELIMINARY DATA
Per the FBI UCR Guidelines Homicide, Rape and Aggravated Assault are counted by victim. All other crimes are counted by incident, except Arson which is always counted.2009 Population Source: LA County Internal Services Department (based on the 2000 US Census and CA Department of Finance estimates).2013 Population Source: LA County Internal Services Department (based on the 2010 US Census and CA Department of Finance estimates). 2014 YTD Crime Rates based on 2013 population estimates. 2013 population estimates updated for the city of Santa Clarita and the Santa Clarita Valley Station unincorporated area, due to 2012 year end annexations.Crime counts for patrol station areas only; red depicts +30% increases and green depicts -30% decreases. N/C = Not Calculable
This PRELIMINARY INFORMATION is used on an ongoing basis by the LASD for strategic planning and as a tactical early warning system. This data is not final and thus is not the crime data that is reported to the FBI Uniform Crime Index (UCI). This is because some of the most recent reports have not been written yet, nor reviewed by investigators. Once it is reported by investigators and supervisors, the crime data is reported to the FBI/UCI and is available via the pertinent LASD patrol station, pending publication by the FBI/UCI. Once it is reported by the LASD to the FBI, the FBI/UCI crime data is considered the most accurate.
WEST HOLLYWOOD
VIOLENT CRIMES
PROPERTY CRIMES
CRIMINAL HOMICIDE
FORCIBLE RAPE
ROBBERY
AGGRAVATED ASSAULT
BURGLARY
LARCENY THEFT
GRAND THEFT AUTO
ARSON
157
692
41.25
181.83
348
1,660
YTDReportedIncidents
YTDCrime Rate
TotalReported
YTDReportedIncidents
YTDCrime Rate
TotalReportedIncidents
YTDReportedIncidents
YTDCrimeRate
5 YearChange inYTD Crime
Rate
1 YearChange inYTD Crime
Rate
90
722
25.64
205.66
237
1,571
124
619
35.32
176.32
0
10
57
90
127
502
59
4
0.00
2.63
14.98
23.65
33.37
131.90
15.50
1.05
0
15
116
217
302
1,212
140
6
0
4
24
62
111
574
36
1
0.00
1.14
6.84
17.66
31.62
163.50
10.25
0.28
0
14
70
153
293
1,174
102
2
1
1
42
80
87
493
33
6
0.28
0.28
11.96
22.79
24.78
140.43
9.40
1.71
-14.4%
-3.0%
0.0%
-89.4%
-20.2%
-3.6%
-25.7%
6.5%
-39.4%
62.9%
37.8%
-14.3%
0.0%
-75.4%
74.9%
29.1%
-21.6%
-14.1%
-8.3%
510.7%
2009 2013 2014
2009 2013 2014 2014
849PART I CRIMES 812 743223.08 231.3 211.64 2,008 1,808 -5.1% -8.5%

LOS ANGELES COUNTY SHERIFF'S DEPARTMENT
06/06/2014 01:47 pm
STATION, CITY & UNINCORPORATED DETAIL BY STATION & CRIME TYPE
Ver: 10.02.19.2013.0
YTD 05/31/2014 - PART I CRIME RATE PER 10,000 POPULATION
1Page
- PRELIMINARY DATA
Per the FBI UCR Guidelines Homicide, Rape and Aggravated Assault are counted by victim. All other crimes are counted by incident, except Arson which is always counted.2009 Population Source: LA County Internal Services Department (based on the 2000 US Census and CA Department of Finance estimates).2013 Population Source: LA County Internal Services Department (based on the 2010 US Census and CA Department of Finance estimates). 2014 YTD Crime Rates based on 2013 population estimates. 2013 population estimates updated for the city of Santa Clarita and the Santa Clarita Valley Station unincorporated area, due to 2012 year end annexations.Crime counts for patrol station areas only; red depicts +30% increases and green depicts -30% decreases. N/C = Not Calculable
This PRELIMINARY INFORMATION is used on an ongoing basis by the LASD for strategic planning and as a tactical early warning system. This data is not final and thus is not the crime data that is reported to the FBI Uniform Crime Index (UCI). This is because some of the most recent reports have not been written yet, nor reviewed by investigators. Once it is reported by investigators and supervisors, the crime data is reported to the FBI/UCI and is available via the pertinent LASD patrol station, pending publication by the FBI/UCI. Once it is reported by the LASD to the FBI, the FBI/UCI crime data is considered the most accurate.
UNINCORPORATED
UNINCORPORATED
UNINCORPORATED
UNINCORPORATED
UNINCORPORATED
UNINCORPORATED
UNINCORPORATED
UNINCORPORATED
1
3
10
59
89
161
29
3
1
5
34
139
253
377
66
7
1
6
6
17
99
180
13
0
1
12
12
48
193
397
56
3
0
1
7
25
75
146
25
3
.22
.66
2.21
13.06
19.69
35.63
6.42
.66
.23
1.36
1.36
3.85
22.45
40.81
2.95
0
0
.23
1.59
5.67
17
33.1
5.67
.68
-100
-65.15
-28.05
-56.58
-13.66
-7.1
-11.68
3.03
-100
-83.09
16.91
47.27
-24.28
-18.89
92.2
N/C
CRIMINAL HOMICIDE
FORCIBLE RAPE
ROBBERY
AGGRAVATED ASSAULT
BURGLARY
LARCENY THEFT
GRAND THEFT AUTO
ARSON
ALTADENA YTDReported
YTDCrime Rate
TotalReportedIncidents
YTDReported
YTDCrime Rate
TotalReportedIncidents
YTDReported
YTDCrime Rate
5 YearChange inYTD Crime
Rate
1 YearChange inYTD Crime
Rate
2009 2013 2014
2014/2009 2014/2013
PART I CRIMES TOTAL
STATION TOTAL
STATION TOTAL
STATION TOTAL
STATION TOTAL
STATION TOTAL
STATION TOTAL
STATION TOTAL
STATION TOTAL
UNINCORPORATED 355
2009
322
2013
282
1
3
10
59
89
161
29
3
1
6
6
17
99
180
13
0
0
1
7
25
75
146
25
3
78.56 882
1
5
34
139
253
377
66
7
1
12
12
48
193
397
56
3
73.01 722
.22
.66
2.21
13.06
19.69
35.63
6.42
.66
.23
1.36
1.36
3.85
22.45
40.81
2.95
0
63.94
0
.23
1.59
5.67
17
33.1
5.67
.68
-18.61
-100
-83.09
16.91
47.27
-24.28
-18.89
92.2
N/C
STATION TOTAL
-12.42
355 322
-100
-65.15
-28.05
-56.58
-13.66
-7.1
-11.68
3.03
282 882 722 63.9478.56 73.01 -18.61 -12.42
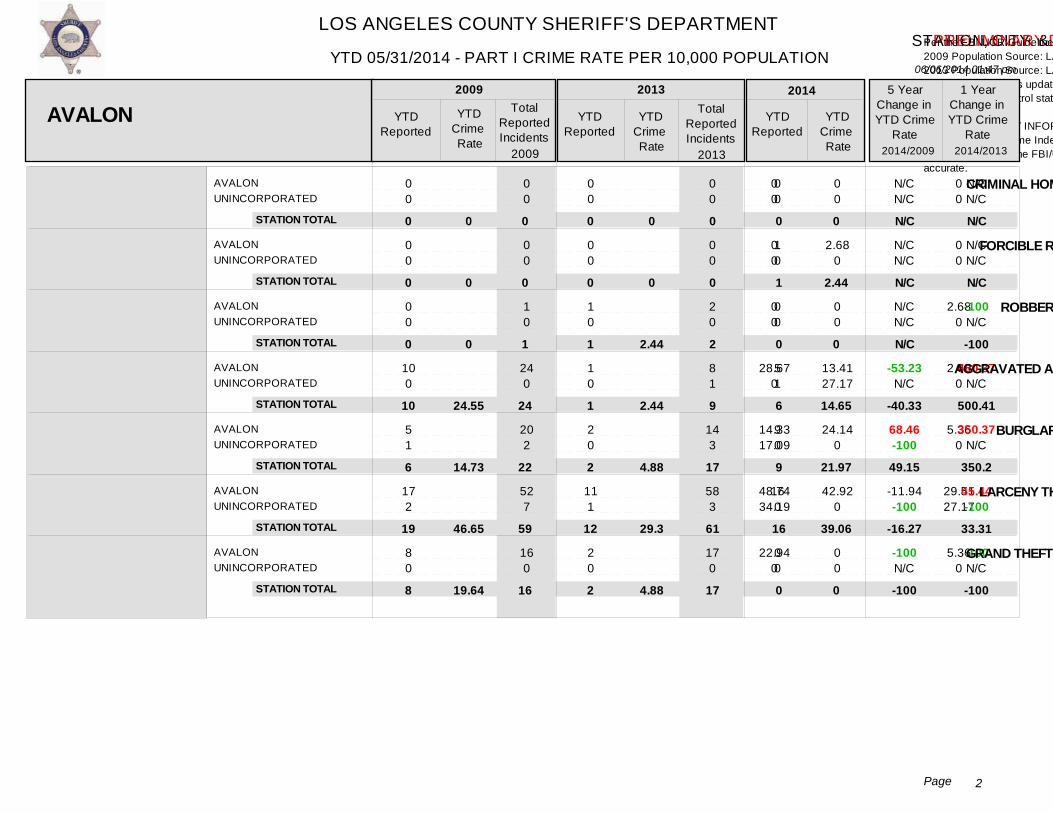
LOS ANGELES COUNTY SHERIFF'S DEPARTMENT
06/06/2014 01:47 pm
STATION, CITY & UNINCORPORATED DETAIL BY STATION & CRIME TYPE
Ver: 10.02.19.2013.0
YTD 05/31/2014 - PART I CRIME RATE PER 10,000 POPULATION
2Page
- PRELIMINARY DATA
Per the FBI UCR Guidelines Homicide, Rape and Aggravated Assault are counted by victim. All other crimes are counted by incident, except Arson which is always counted.2009 Population Source: LA County Internal Services Department (based on the 2000 US Census and CA Department of Finance estimates).2013 Population Source: LA County Internal Services Department (based on the 2010 US Census and CA Department of Finance estimates). 2014 YTD Crime Rates based on 2013 population estimates. 2013 population estimates updated for the city of Santa Clarita and the Santa Clarita Valley Station unincorporated area, due to 2012 year end annexations.Crime counts for patrol station areas only; red depicts +30% increases and green depicts -30% decreases. N/C = Not Calculable
This PRELIMINARY INFORMATION is used on an ongoing basis by the LASD for strategic planning and as a tactical early warning system. This data is not final and thus is not the crime data that is reported to the FBI Uniform Crime Index (UCI). This is because some of the most recent reports have not been written yet, nor reviewed by investigators. Once it is reported by investigators and supervisors, the crime data is reported to the FBI/UCI and is available via the pertinent LASD patrol station, pending publication by the FBI/UCI. Once it is reported by the LASD to the FBI, the FBI/UCI crime data is considered the most accurate.
AVALONUNINCORPORATED
AVALONUNINCORPORATED
AVALONUNINCORPORATED
AVALONUNINCORPORATED
AVALONUNINCORPORATED
AVALONUNINCORPORATED
AVALONUNINCORPORATED
0 0
0 0
0 0
10 0
5 1
17 2
8 0
0 0
0 0
1 0
24 0
20 2
52 7
16 0
0 0
0 0
1 0
1 0
2 0
11 1
2 0
0 0
0 0
2 0
8 1
14 3
58 3
17 0
0 0
1 0
0 0
5 1
9 0
16 0
0 0
00
00
00
28.670
14.3317.09
48.7434.19
22.940
00
00
2.680
2.680
5.360
29.5127.17
5.360
00
2.680
00
13.4127.17
24.140
42.920
00
N/CN/C
N/CN/C
N/CN/C
-53.23N/C
68.46-100
-11.94-100
-100N/C
N/CN/C
N/CN/C
-100N/C
400.37N/C
350.37N/C
45.44-100
-100N/C
CRIMINAL HOMICIDE
FORCIBLE RAPE
ROBBERY
AGGRAVATED ASSAULT
BURGLARY
LARCENY THEFT
GRAND THEFT AUTO
AVALON YTDReported
YTDCrime Rate
TotalReportedIncidents
YTDReported
YTDCrime Rate
TotalReportedIncidents
YTDReported
YTDCrime Rate
5 YearChange inYTD Crime
Rate
1 YearChange inYTD Crime
Rate
2009 2013 2014
2014/2009 2014/2013
STATION TOTAL
STATION TOTAL
STATION TOTAL
STATION TOTAL
STATION TOTAL
STATION TOTAL
STATION TOTAL
2009 2013
0
0
0
10
6
19
8
0
0
1
1
2
12
2
0
1
0
6
9
16
0
0
0
1
24
22
59
16
0
0
2
9
17
61
17
0
0
0
24.55
14.73
46.65
19.64
0
0
2.44
2.44
4.88
29.3
4.88
0
2.44
0
14.65
21.97
39.06
0
N/C
N/C
-100
500.41
350.2
33.31
-100
N/C
N/C
N/C
-40.33
49.15
-16.27
-100
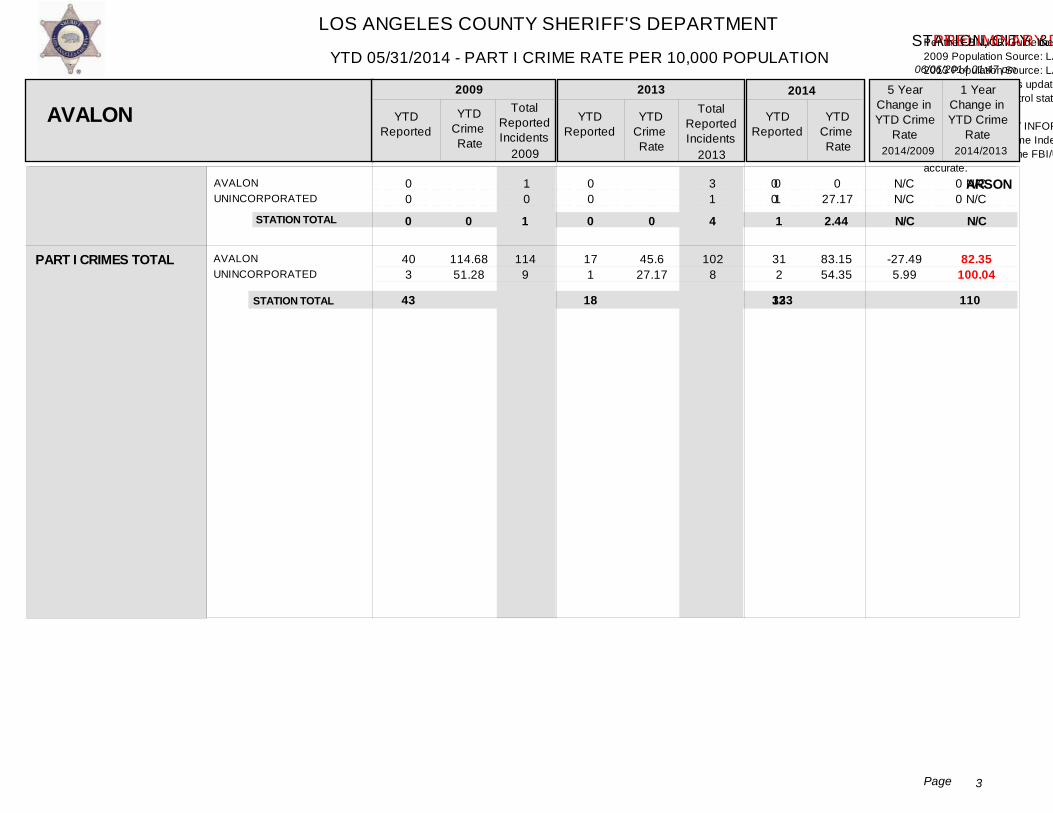
LOS ANGELES COUNTY SHERIFF'S DEPARTMENT
06/06/2014 01:47 pm
STATION, CITY & UNINCORPORATED DETAIL BY STATION & CRIME TYPE
Ver: 10.02.19.2013.0
YTD 05/31/2014 - PART I CRIME RATE PER 10,000 POPULATION
3Page
- PRELIMINARY DATA
Per the FBI UCR Guidelines Homicide, Rape and Aggravated Assault are counted by victim. All other crimes are counted by incident, except Arson which is always counted.2009 Population Source: LA County Internal Services Department (based on the 2000 US Census and CA Department of Finance estimates).2013 Population Source: LA County Internal Services Department (based on the 2010 US Census and CA Department of Finance estimates). 2014 YTD Crime Rates based on 2013 population estimates. 2013 population estimates updated for the city of Santa Clarita and the Santa Clarita Valley Station unincorporated area, due to 2012 year end annexations.Crime counts for patrol station areas only; red depicts +30% increases and green depicts -30% decreases. N/C = Not Calculable
This PRELIMINARY INFORMATION is used on an ongoing basis by the LASD for strategic planning and as a tactical early warning system. This data is not final and thus is not the crime data that is reported to the FBI Uniform Crime Index (UCI). This is because some of the most recent reports have not been written yet, nor reviewed by investigators. Once it is reported by investigators and supervisors, the crime data is reported to the FBI/UCI and is available via the pertinent LASD patrol station, pending publication by the FBI/UCI. Once it is reported by the LASD to the FBI, the FBI/UCI crime data is considered the most accurate.
AVALONUNINCORPORATED
0 0
1 0
0 0
3 1
0 1
00
00
027.17
N/CN/C
N/CN/C
ARSON
AVALON YTDReported
YTDCrime Rate
TotalReportedIncidents
YTDReported
YTDCrime Rate
TotalReportedIncidents
YTDReported
YTDCrime Rate
5 YearChange inYTD Crime
Rate
1 YearChange inYTD Crime
Rate
2009 2013 2014
2014/2009 2014/2013
PART I CRIMES TOTAL
STATION TOTAL
AVALONUNINCORPORATED
40 3
2009
17 1
2013
31 2
0 0 1
114.6851.28
114 9
1 4
45.627.17
102 8
0 0
83.1554.35
2.44
-27.495.99
N/C
STATION TOTAL
82.35100.04
43 18
N/C
33 123 110 80.57105.57 43.95 -23.68 83.32

LOS ANGELES COUNTY SHERIFF'S DEPARTMENT
06/06/2014 01:47 pm
STATION, CITY & UNINCORPORATED DETAIL BY STATION & CRIME TYPE
Ver: 10.02.19.2013.0
YTD 05/31/2014 - PART I CRIME RATE PER 10,000 POPULATION
4Page
- PRELIMINARY DATA
Per the FBI UCR Guidelines Homicide, Rape and Aggravated Assault are counted by victim. All other crimes are counted by incident, except Arson which is always counted.2009 Population Source: LA County Internal Services Department (based on the 2000 US Census and CA Department of Finance estimates).2013 Population Source: LA County Internal Services Department (based on the 2010 US Census and CA Department of Finance estimates). 2014 YTD Crime Rates based on 2013 population estimates. 2013 population estimates updated for the city of Santa Clarita and the Santa Clarita Valley Station unincorporated area, due to 2012 year end annexations.Crime counts for patrol station areas only; red depicts +30% increases and green depicts -30% decreases. N/C = Not Calculable
This PRELIMINARY INFORMATION is used on an ongoing basis by the LASD for strategic planning and as a tactical early warning system. This data is not final and thus is not the crime data that is reported to the FBI Uniform Crime Index (UCI). This is because some of the most recent reports have not been written yet, nor reviewed by investigators. Once it is reported by investigators and supervisors, the crime data is reported to the FBI/UCI and is available via the pertinent LASD patrol station, pending publication by the FBI/UCI. Once it is reported by the LASD to the FBI, the FBI/UCI crime data is considered the most accurate.
CARSONUNINCORPORATED
CARSONUNINCORPORATED
CARSONUNINCORPORATED
CARSONUNINCORPORATED
CARSONUNINCORPORATED
CARSONUNINCORPORATED
CARSONUNINCORPORATED
3 1
6 0
61 11
130 40
180 52
562 252
168 84
5 1
13 5
165 34
334 96
472 150
1,375 531
446 233
0 2
7 0
61 7
94 27
210 66
565 181
220 60
3 2
16 1
148 33
238 58
514 159
1,255 393
468 148
4 5
4 4
41 12
90 29
204 74
504 134
138 57
.31
.44
.610
6.224.89
13.2517.77
18.3523.09
57.29111.92
17.1337.31
0.82
.760
6.652.88
10.2511.11
22.927.16
61.674.49
23.9924.69
.442.06
.441.65
4.474.94
9.8111.94
22.2430.46
54.9555.15
15.0523.46
41.94368.18
-27.87N/C
-28.141.02
-25.96-32.81
21.231.92
-4.08-50.72
-12.14-37.12
N/C151.22
-42.11N/C
-32.7871.53
-4.297.47
-2.8812.15
-10.8-25.96
-37.27-4.98
CRIMINAL HOMICIDE
FORCIBLE RAPE
ROBBERY
AGGRAVATED ASSAULT
BURGLARY
LARCENY THEFT
GRAND THEFT AUTO
CARSON YTDReported
YTDCrime Rate
TotalReportedIncidents
YTDReported
YTDCrime Rate
TotalReportedIncidents
YTDReported
YTDCrime Rate
5 YearChange inYTD Crime
Rate
1 YearChange inYTD Crime
Rate
2009 2013 2014
2014/2009 2014/2013
STATION TOTAL
STATION TOTAL
STATION TOTAL
STATION TOTAL
STATION TOTAL
STATION TOTAL
STATION TOTAL
2009 2013
4
6
72
170
232
814
252
2
7
68
121
276
746
280
9
8
53
119
278
638
195
6
18
199
430
622
1,906
679
5
17
181
296
673
1,648
616
.33
.5
5.97
14.09
19.23
67.49
20.89
.17
.6
5.86
10.43
23.79
64.3
24.14
.78
.69
4.57
10.26
23.96
54.99
16.81
358.82
15
-22.01
-1.63
.71
-14.48
-30.36
136.36
38
-23.45
-27.18
24.6
-18.52
-19.53
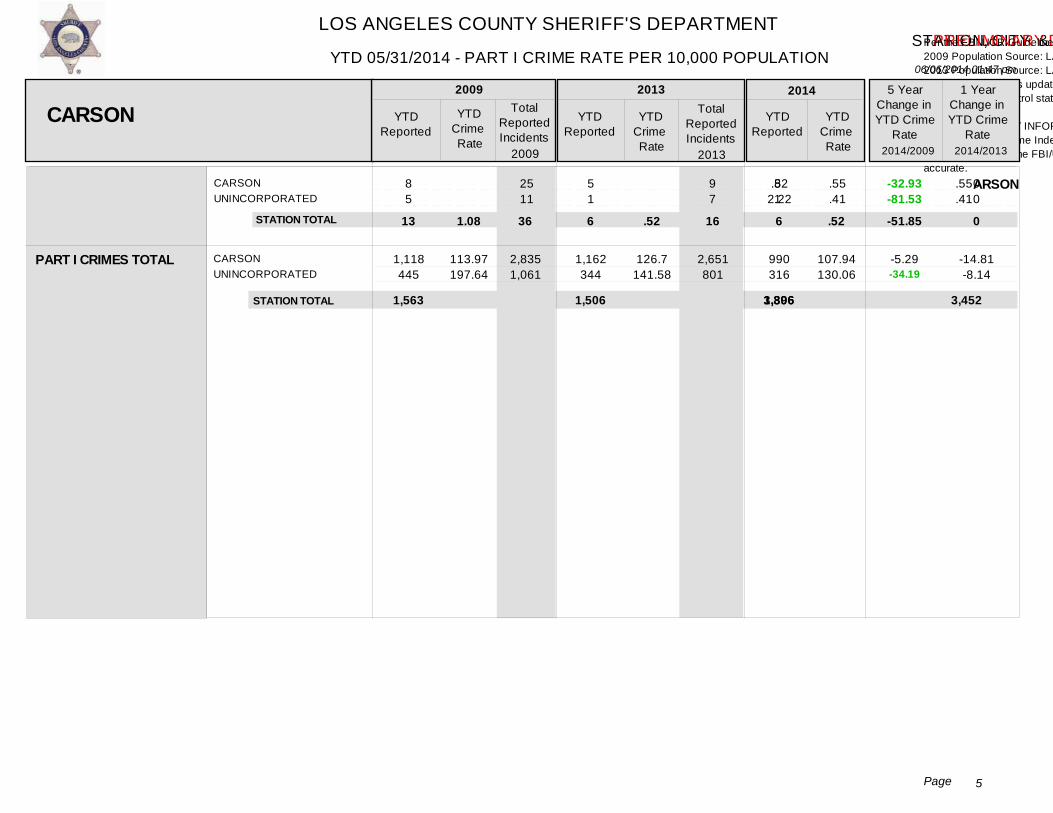
LOS ANGELES COUNTY SHERIFF'S DEPARTMENT
06/06/2014 01:47 pm
STATION, CITY & UNINCORPORATED DETAIL BY STATION & CRIME TYPE
Ver: 10.02.19.2013.0
YTD 05/31/2014 - PART I CRIME RATE PER 10,000 POPULATION
5Page
- PRELIMINARY DATA
Per the FBI UCR Guidelines Homicide, Rape and Aggravated Assault are counted by victim. All other crimes are counted by incident, except Arson which is always counted.2009 Population Source: LA County Internal Services Department (based on the 2000 US Census and CA Department of Finance estimates).2013 Population Source: LA County Internal Services Department (based on the 2010 US Census and CA Department of Finance estimates). 2014 YTD Crime Rates based on 2013 population estimates. 2013 population estimates updated for the city of Santa Clarita and the Santa Clarita Valley Station unincorporated area, due to 2012 year end annexations.Crime counts for patrol station areas only; red depicts +30% increases and green depicts -30% decreases. N/C = Not Calculable
This PRELIMINARY INFORMATION is used on an ongoing basis by the LASD for strategic planning and as a tactical early warning system. This data is not final and thus is not the crime data that is reported to the FBI Uniform Crime Index (UCI). This is because some of the most recent reports have not been written yet, nor reviewed by investigators. Once it is reported by investigators and supervisors, the crime data is reported to the FBI/UCI and is available via the pertinent LASD patrol station, pending publication by the FBI/UCI. Once it is reported by the LASD to the FBI, the FBI/UCI crime data is considered the most accurate.
CARSONUNINCORPORATED
8 5
25 11
5 1
9 7
5 1
.822.22
.55
.41.55.41
-32.93-81.53
00
ARSON
CARSON YTDReported
YTDCrime Rate
TotalReportedIncidents
YTDReported
YTDCrime Rate
TotalReportedIncidents
YTDReported
YTDCrime Rate
5 YearChange inYTD Crime
Rate
1 YearChange inYTD Crime
Rate
2009 2013 2014
2014/2009 2014/2013
PART I CRIMES TOTAL
STATION TOTAL
CARSONUNINCORPORATED
1,118 445
2009
1,162 344
2013
990 316
13 6 6
113.97197.64
2,835 1,061
36 16
126.7141.58
2,651 801
1.08 .52
107.94130.06
.52
-5.29-34.19
0
STATION TOTAL
-14.81-8.14
1,563 1,506
-51.85
1,306 3,896 3,452 112.58129.59 129.82 -13.13 -13.28
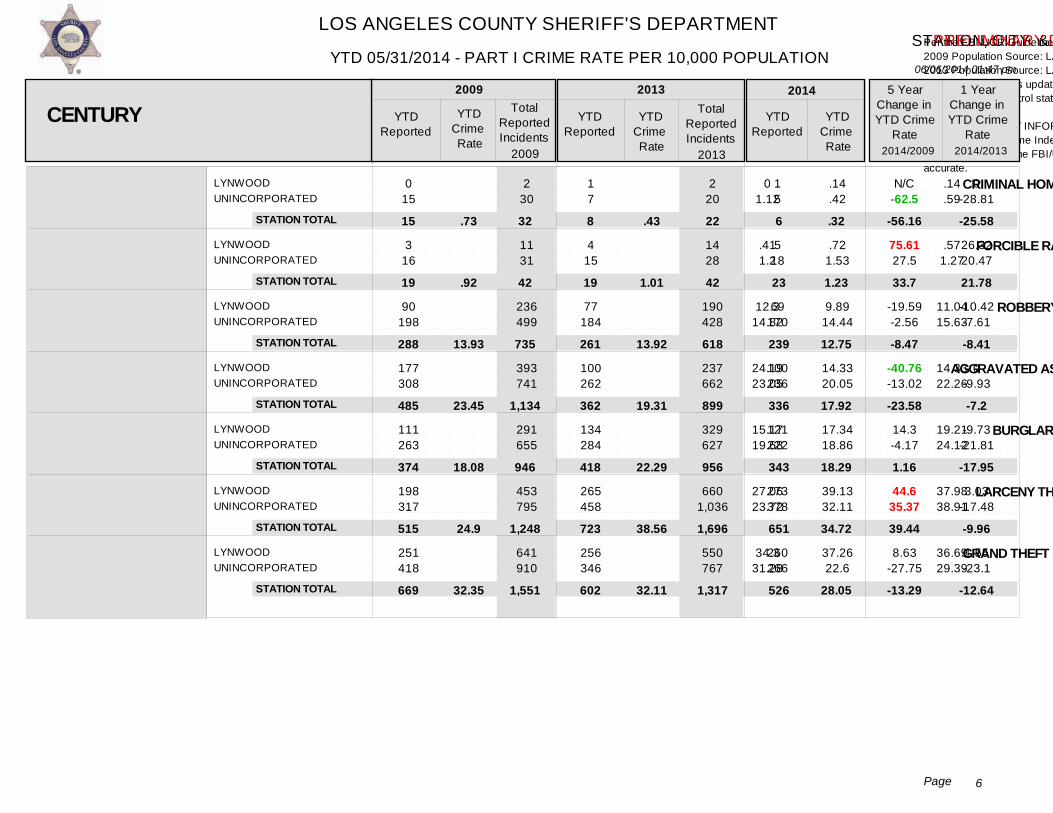
LOS ANGELES COUNTY SHERIFF'S DEPARTMENT
06/06/2014 01:47 pm
STATION, CITY & UNINCORPORATED DETAIL BY STATION & CRIME TYPE
Ver: 10.02.19.2013.0
YTD 05/31/2014 - PART I CRIME RATE PER 10,000 POPULATION
6Page
- PRELIMINARY DATA
Per the FBI UCR Guidelines Homicide, Rape and Aggravated Assault are counted by victim. All other crimes are counted by incident, except Arson which is always counted.2009 Population Source: LA County Internal Services Department (based on the 2000 US Census and CA Department of Finance estimates).2013 Population Source: LA County Internal Services Department (based on the 2010 US Census and CA Department of Finance estimates). 2014 YTD Crime Rates based on 2013 population estimates. 2013 population estimates updated for the city of Santa Clarita and the Santa Clarita Valley Station unincorporated area, due to 2012 year end annexations.Crime counts for patrol station areas only; red depicts +30% increases and green depicts -30% decreases. N/C = Not Calculable
This PRELIMINARY INFORMATION is used on an ongoing basis by the LASD for strategic planning and as a tactical early warning system. This data is not final and thus is not the crime data that is reported to the FBI Uniform Crime Index (UCI). This is because some of the most recent reports have not been written yet, nor reviewed by investigators. Once it is reported by investigators and supervisors, the crime data is reported to the FBI/UCI and is available via the pertinent LASD patrol station, pending publication by the FBI/UCI. Once it is reported by the LASD to the FBI, the FBI/UCI crime data is considered the most accurate.
LYNWOODUNINCORPORATED
LYNWOODUNINCORPORATED
LYNWOODUNINCORPORATED
LYNWOODUNINCORPORATED
LYNWOODUNINCORPORATED
LYNWOODUNINCORPORATED
LYNWOODUNINCORPORATED
0 15
3 16
90 198
177 308
111 263
198 317
251 418
2 30
11 31
236 499
393 741
291 655
453 795
641 910
1 7
4 15
77 184
100 262
134 284
265 458
256 346
2 20
14 28
190 428
237 662
329 627
660 1,036
550 767
1 5
5 18
69 170
100 236
121 222
273 378
260 266
01.12
.411.2
12.314.82
24.1923.05
15.1719.68
27.0623.72
34.331.28
.14
.59
.571.27
11.0415.63
14.3322.26
19.2124.12
37.9838.91
36.6929.39
.14
.42
.721.53
9.8914.44
14.3320.05
17.3418.86
39.1332.11
37.2622.6
N/C-62.5
75.6127.5
-19.59-2.56
-40.76-13.02
14.3-4.17
44.635.37
8.63-27.75
0-28.81
26.3220.47
-10.42-7.61
0-9.93
-9.73-21.81
3.03-17.48
1.55-23.1
CRIMINAL HOMICIDE
FORCIBLE RAPE
ROBBERY
AGGRAVATED ASSAULT
BURGLARY
LARCENY THEFT
GRAND THEFT AUTO
CENTURY YTDReported
YTDCrime Rate
TotalReportedIncidents
YTDReported
YTDCrime Rate
TotalReportedIncidents
YTDReported
YTDCrime Rate
5 YearChange inYTD Crime
Rate
1 YearChange inYTD Crime
Rate
2009 2013 2014
2014/2009 2014/2013
STATION TOTAL
STATION TOTAL
STATION TOTAL
STATION TOTAL
STATION TOTAL
STATION TOTAL
STATION TOTAL
2009 2013
15
19
288
485
374
515
669
8
19
261
362
418
723
602
6
23
239
336
343
651
526
32
42
735
1,134
946
1,248
1,551
22
42
618
899
956
1,696
1,317
.73
.92
13.93
23.45
18.08
24.9
32.35
.43
1.01
13.92
19.31
22.29
38.56
32.11
.32
1.23
12.75
17.92
18.29
34.72
28.05
-25.58
21.78
-8.41
-7.2
-17.95
-9.96
-12.64
-56.16
33.7
-8.47
-23.58
1.16
39.44
-13.29
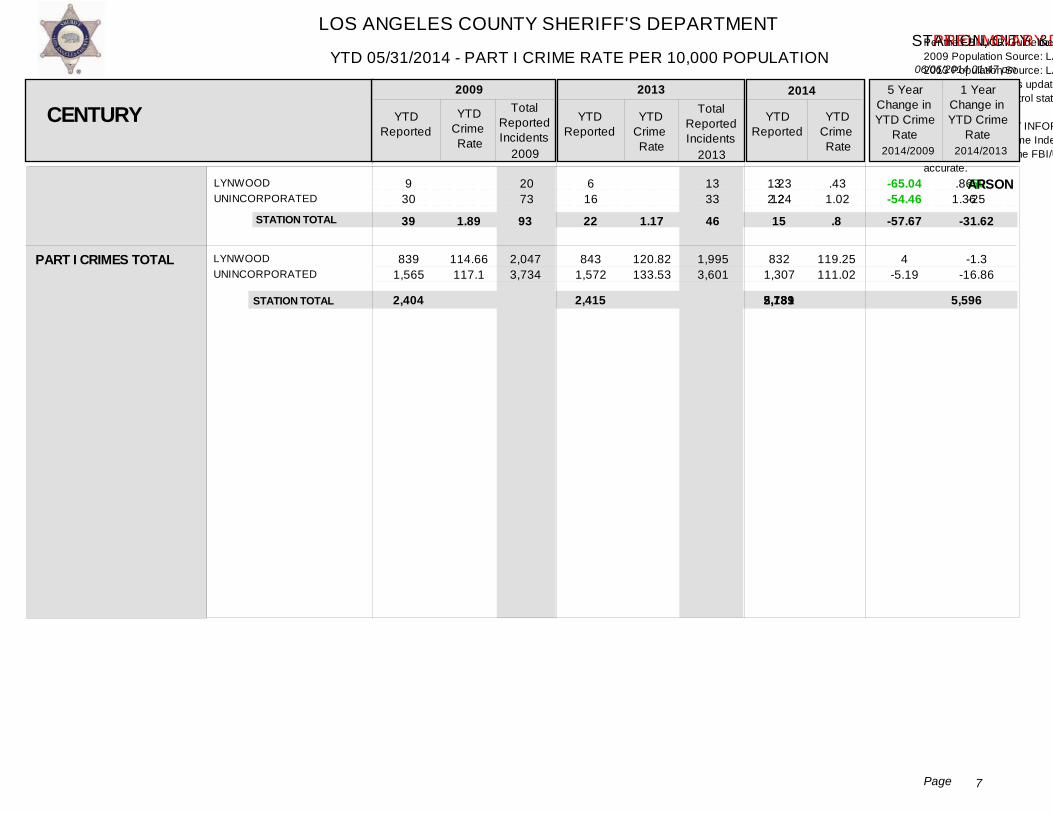
LOS ANGELES COUNTY SHERIFF'S DEPARTMENT
06/06/2014 01:47 pm
STATION, CITY & UNINCORPORATED DETAIL BY STATION & CRIME TYPE
Ver: 10.02.19.2013.0
YTD 05/31/2014 - PART I CRIME RATE PER 10,000 POPULATION
7Page
- PRELIMINARY DATA
Per the FBI UCR Guidelines Homicide, Rape and Aggravated Assault are counted by victim. All other crimes are counted by incident, except Arson which is always counted.2009 Population Source: LA County Internal Services Department (based on the 2000 US Census and CA Department of Finance estimates).2013 Population Source: LA County Internal Services Department (based on the 2010 US Census and CA Department of Finance estimates). 2014 YTD Crime Rates based on 2013 population estimates. 2013 population estimates updated for the city of Santa Clarita and the Santa Clarita Valley Station unincorporated area, due to 2012 year end annexations.Crime counts for patrol station areas only; red depicts +30% increases and green depicts -30% decreases. N/C = Not Calculable
This PRELIMINARY INFORMATION is used on an ongoing basis by the LASD for strategic planning and as a tactical early warning system. This data is not final and thus is not the crime data that is reported to the FBI Uniform Crime Index (UCI). This is because some of the most recent reports have not been written yet, nor reviewed by investigators. Once it is reported by investigators and supervisors, the crime data is reported to the FBI/UCI and is available via the pertinent LASD patrol station, pending publication by the FBI/UCI. Once it is reported by the LASD to the FBI, the FBI/UCI crime data is considered the most accurate.
LYNWOODUNINCORPORATED
9 30
20 73
6 16
13 33
3 12
1.232.24
.861.36
.431.02
-65.04-54.46
-50-25
ARSON
CENTURY YTDReported
YTDCrime Rate
TotalReportedIncidents
YTDReported
YTDCrime Rate
TotalReportedIncidents
YTDReported
YTDCrime Rate
5 YearChange inYTD Crime
Rate
1 YearChange inYTD Crime
Rate
2009 2013 2014
2014/2009 2014/2013
PART I CRIMES TOTAL
STATION TOTAL
LYNWOODUNINCORPORATED
839 1,565
2009
843 1,572
2013
832 1,307
39 22 15
114.66117.1
2,047 3,734
93 46
120.82133.53
1,995 3,601
1.89 1.17
119.25111.02
.8
4-5.19
-31.62
STATION TOTAL
-1.3-16.86
2,404 2,415
-57.67
2,139 5,781 5,596 114.08116.24 128.8 -1.86 -11.43
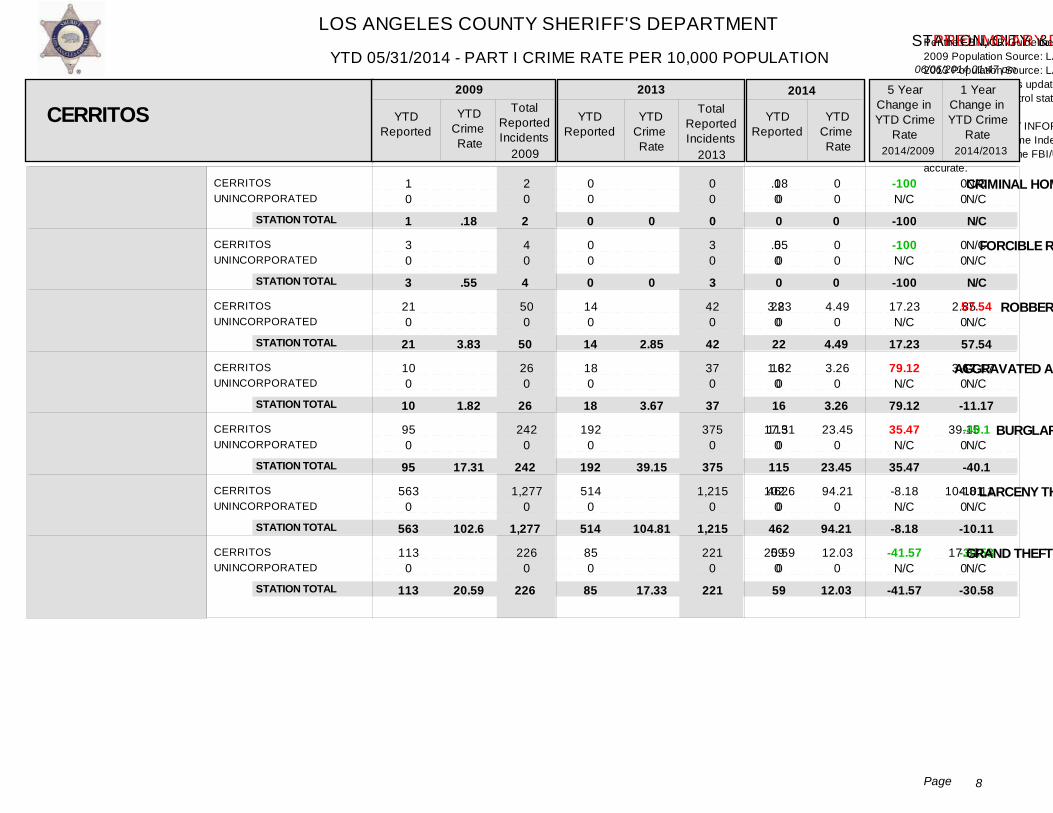
LOS ANGELES COUNTY SHERIFF'S DEPARTMENT
06/06/2014 01:47 pm
STATION, CITY & UNINCORPORATED DETAIL BY STATION & CRIME TYPE
Ver: 10.02.19.2013.0
YTD 05/31/2014 - PART I CRIME RATE PER 10,000 POPULATION
8Page
- PRELIMINARY DATA
Per the FBI UCR Guidelines Homicide, Rape and Aggravated Assault are counted by victim. All other crimes are counted by incident, except Arson which is always counted.2009 Population Source: LA County Internal Services Department (based on the 2000 US Census and CA Department of Finance estimates).2013 Population Source: LA County Internal Services Department (based on the 2010 US Census and CA Department of Finance estimates). 2014 YTD Crime Rates based on 2013 population estimates. 2013 population estimates updated for the city of Santa Clarita and the Santa Clarita Valley Station unincorporated area, due to 2012 year end annexations.Crime counts for patrol station areas only; red depicts +30% increases and green depicts -30% decreases. N/C = Not Calculable
This PRELIMINARY INFORMATION is used on an ongoing basis by the LASD for strategic planning and as a tactical early warning system. This data is not final and thus is not the crime data that is reported to the FBI Uniform Crime Index (UCI). This is because some of the most recent reports have not been written yet, nor reviewed by investigators. Once it is reported by investigators and supervisors, the crime data is reported to the FBI/UCI and is available via the pertinent LASD patrol station, pending publication by the FBI/UCI. Once it is reported by the LASD to the FBI, the FBI/UCI crime data is considered the most accurate.
CERRITOSUNINCORPORATED
CERRITOSUNINCORPORATED
CERRITOSUNINCORPORATED
CERRITOSUNINCORPORATED
CERRITOSUNINCORPORATED
CERRITOSUNINCORPORATED
CERRITOSUNINCORPORATED
1 0
3 0
21 0
10 0
95 0
563 0
113 0
2 0
4 0
50 0
26 0
242 0
1,277 0
226 0
0 0
0 0
14 0
18 0
192 0
514 0
85 0
0 0
3 0
42 0
37 0
375 0
1,215 0
221 0
0 0
0 0
22 0
16 0
115 0
462 0
59 0
.180
.550
3.830
1.820
17.310
102.60
20.590
00
00
2.850
3.670
39.150
104.810
17.330
00
00
4.490
3.260
23.450
94.210
12.030
-100N/C
-100N/C
17.23N/C
79.12N/C
35.47N/C
-8.18N/C
-41.57N/C
N/CN/C
N/CN/C
57.54N/C
-11.17N/C
-40.1N/C
-10.11N/C
-30.58N/C
CRIMINAL HOMICIDE
FORCIBLE RAPE
ROBBERY
AGGRAVATED ASSAULT
BURGLARY
LARCENY THEFT
GRAND THEFT AUTO
CERRITOS YTDReported
YTDCrime Rate
TotalReportedIncidents
YTDReported
YTDCrime Rate
TotalReportedIncidents
YTDReported
YTDCrime Rate
5 YearChange inYTD Crime
Rate
1 YearChange inYTD Crime
Rate
2009 2013 2014
2014/2009 2014/2013
STATION TOTAL
STATION TOTAL
STATION TOTAL
STATION TOTAL
STATION TOTAL
STATION TOTAL
STATION TOTAL
2009 2013
1
3
21
10
95
563
113
0
0
14
18
192
514
85
0
0
22
16
115
462
59
2
4
50
26
242
1,277
226
0
3
42
37
375
1,215
221
.18
.55
3.83
1.82
17.31
102.6
20.59
0
0
2.85
3.67
39.15
104.81
17.33
0
0
4.49
3.26
23.45
94.21
12.03
N/C
N/C
57.54
-11.17
-40.1
-10.11
-30.58
-100
-100
17.23
79.12
35.47
-8.18
-41.57
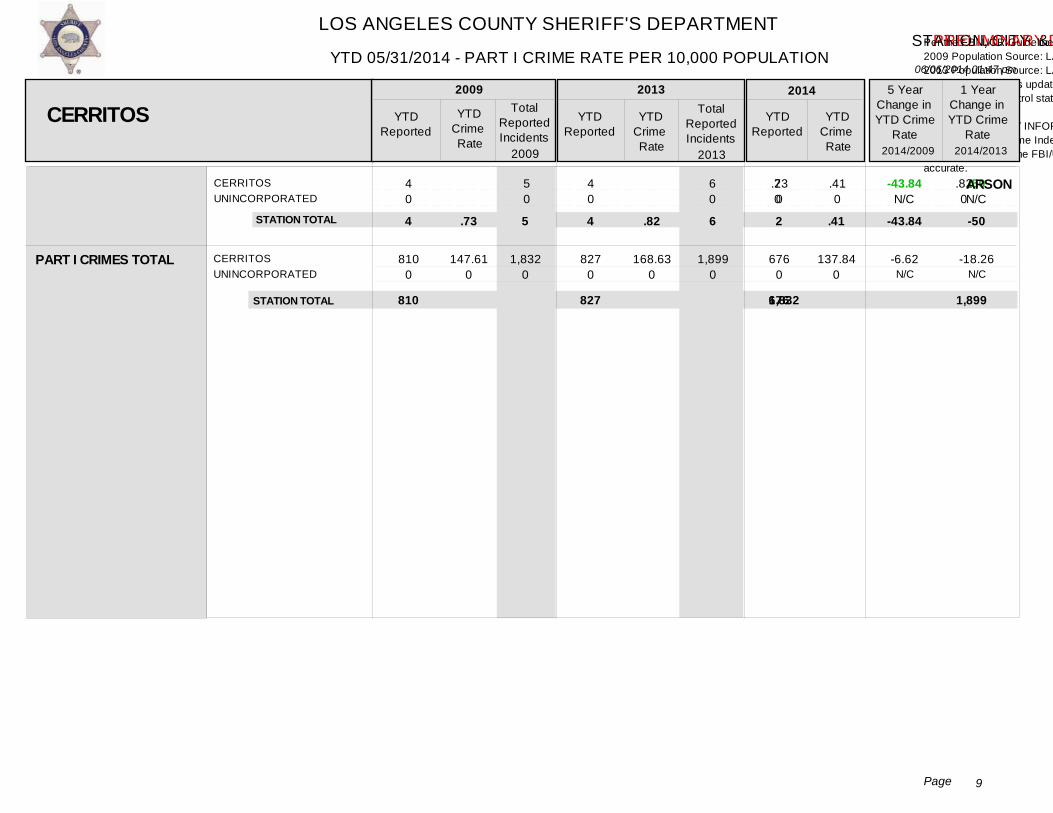
LOS ANGELES COUNTY SHERIFF'S DEPARTMENT
06/06/2014 01:47 pm
STATION, CITY & UNINCORPORATED DETAIL BY STATION & CRIME TYPE
Ver: 10.02.19.2013.0
YTD 05/31/2014 - PART I CRIME RATE PER 10,000 POPULATION
9Page
- PRELIMINARY DATA
Per the FBI UCR Guidelines Homicide, Rape and Aggravated Assault are counted by victim. All other crimes are counted by incident, except Arson which is always counted.2009 Population Source: LA County Internal Services Department (based on the 2000 US Census and CA Department of Finance estimates).2013 Population Source: LA County Internal Services Department (based on the 2010 US Census and CA Department of Finance estimates). 2014 YTD Crime Rates based on 2013 population estimates. 2013 population estimates updated for the city of Santa Clarita and the Santa Clarita Valley Station unincorporated area, due to 2012 year end annexations.Crime counts for patrol station areas only; red depicts +30% increases and green depicts -30% decreases. N/C = Not Calculable
This PRELIMINARY INFORMATION is used on an ongoing basis by the LASD for strategic planning and as a tactical early warning system. This data is not final and thus is not the crime data that is reported to the FBI Uniform Crime Index (UCI). This is because some of the most recent reports have not been written yet, nor reviewed by investigators. Once it is reported by investigators and supervisors, the crime data is reported to the FBI/UCI and is available via the pertinent LASD patrol station, pending publication by the FBI/UCI. Once it is reported by the LASD to the FBI, the FBI/UCI crime data is considered the most accurate.
CERRITOSUNINCORPORATED
4 0
5 0
4 0
6 0
2 0
.730
.820
.410
-43.84N/C
-50N/C
ARSON
CERRITOS YTDReported
YTDCrime Rate
TotalReportedIncidents
YTDReported
YTDCrime Rate
TotalReportedIncidents
YTDReported
YTDCrime Rate
5 YearChange inYTD Crime
Rate
1 YearChange inYTD Crime
Rate
2009 2013 2014
2014/2009 2014/2013
PART I CRIMES TOTAL
STATION TOTAL
CERRITOSUNINCORPORATED
810 0
2009
827 0
2013
676 0
4 4 2
147.610
1,832 0
5 6
168.630
1,899 0
.73 .82
137.840
.41
-6.62N/C
-50
STATION TOTAL
-18.26N/C
810 827
-43.84
676 1,832 1,899 137.84147.61 168.63 -6.62 -18.26
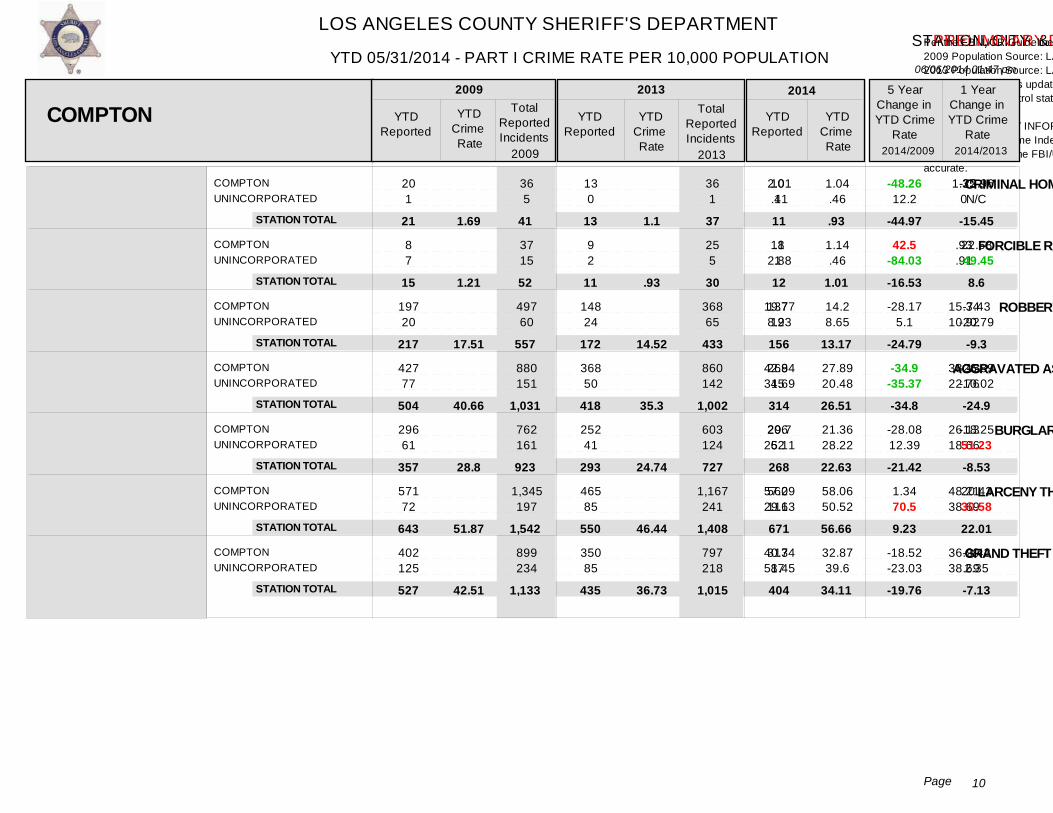
LOS ANGELES COUNTY SHERIFF'S DEPARTMENT
06/06/2014 01:47 pm
STATION, CITY & UNINCORPORATED DETAIL BY STATION & CRIME TYPE
Ver: 10.02.19.2013.0
YTD 05/31/2014 - PART I CRIME RATE PER 10,000 POPULATION
10Page
- PRELIMINARY DATA
Per the FBI UCR Guidelines Homicide, Rape and Aggravated Assault are counted by victim. All other crimes are counted by incident, except Arson which is always counted.2009 Population Source: LA County Internal Services Department (based on the 2000 US Census and CA Department of Finance estimates).2013 Population Source: LA County Internal Services Department (based on the 2010 US Census and CA Department of Finance estimates). 2014 YTD Crime Rates based on 2013 population estimates. 2013 population estimates updated for the city of Santa Clarita and the Santa Clarita Valley Station unincorporated area, due to 2012 year end annexations.Crime counts for patrol station areas only; red depicts +30% increases and green depicts -30% decreases. N/C = Not Calculable
This PRELIMINARY INFORMATION is used on an ongoing basis by the LASD for strategic planning and as a tactical early warning system. This data is not final and thus is not the crime data that is reported to the FBI Uniform Crime Index (UCI). This is because some of the most recent reports have not been written yet, nor reviewed by investigators. Once it is reported by investigators and supervisors, the crime data is reported to the FBI/UCI and is available via the pertinent LASD patrol station, pending publication by the FBI/UCI. Once it is reported by the LASD to the FBI, the FBI/UCI crime data is considered the most accurate.
COMPTONUNINCORPORATED
COMPTONUNINCORPORATED
COMPTONUNINCORPORATED
COMPTONUNINCORPORATED
COMPTONUNINCORPORATED
COMPTONUNINCORPORATED
COMPTONUNINCORPORATED
20 1
8 7
197 20
427 77
296 61
571 72
402 125
36 5
37 15
497 60
880 151
762 161
1,345 197
899 234
13 0
9 2
148 24
368 50
252 41
465 85
350 85
36 1
25 5
368 65
860 142
603 124
1,167 241
797 218
10 1
11 1
137 19
269 45
206 62
560 111
317 87
2.01.41
.82.88
19.778.23
42.8431.69
29.725.11
57.2929.63
40.3451.45
1.350
.93
.91
15.3410.92
38.1522.76
26.1318.66
48.2138.69
36.2938.69
1.04.46
1.14.46
14.28.65
27.8920.48
21.3628.22
58.0650.52
32.8739.6
-48.2612.2
42.5-84.03
-28.175.1
-34.9-35.37
-28.0812.39
1.3470.5
-18.52-23.03
-22.96N/C
22.58-49.45
-7.43-20.79
-26.89-10.02
-18.2551.23
20.4330.58
-9.422.35
CRIMINAL HOMICIDE
FORCIBLE RAPE
ROBBERY
AGGRAVATED ASSAULT
BURGLARY
LARCENY THEFT
GRAND THEFT AUTO
COMPTON YTDReported
YTDCrime Rate
TotalReportedIncidents
YTDReported
YTDCrime Rate
TotalReportedIncidents
YTDReported
YTDCrime Rate
5 YearChange inYTD Crime
Rate
1 YearChange inYTD Crime
Rate
2009 2013 2014
2014/2009 2014/2013
STATION TOTAL
STATION TOTAL
STATION TOTAL
STATION TOTAL
STATION TOTAL
STATION TOTAL
STATION TOTAL
2009 2013
21
15
217
504
357
643
527
13
11
172
418
293
550
435
11
12
156
314
268
671
404
41
52
557
1,031
923
1,542
1,133
37
30
433
1,002
727
1,408
1,015
1.69
1.21
17.51
40.66
28.8
51.87
42.51
1.1
.93
14.52
35.3
24.74
46.44
36.73
.93
1.01
13.17
26.51
22.63
56.66
34.11
-15.45
8.6
-9.3
-24.9
-8.53
22.01
-7.13
-44.97
-16.53
-24.79
-34.8
-21.42
9.23
-19.76

LOS ANGELES COUNTY SHERIFF'S DEPARTMENT
06/06/2014 01:47 pm
STATION, CITY & UNINCORPORATED DETAIL BY STATION & CRIME TYPE
Ver: 10.02.19.2013.0
YTD 05/31/2014 - PART I CRIME RATE PER 10,000 POPULATION
11Page
- PRELIMINARY DATA
Per the FBI UCR Guidelines Homicide, Rape and Aggravated Assault are counted by victim. All other crimes are counted by incident, except Arson which is always counted.2009 Population Source: LA County Internal Services Department (based on the 2000 US Census and CA Department of Finance estimates).2013 Population Source: LA County Internal Services Department (based on the 2010 US Census and CA Department of Finance estimates). 2014 YTD Crime Rates based on 2013 population estimates. 2013 population estimates updated for the city of Santa Clarita and the Santa Clarita Valley Station unincorporated area, due to 2012 year end annexations.Crime counts for patrol station areas only; red depicts +30% increases and green depicts -30% decreases. N/C = Not Calculable
This PRELIMINARY INFORMATION is used on an ongoing basis by the LASD for strategic planning and as a tactical early warning system. This data is not final and thus is not the crime data that is reported to the FBI Uniform Crime Index (UCI). This is because some of the most recent reports have not been written yet, nor reviewed by investigators. Once it is reported by investigators and supervisors, the crime data is reported to the FBI/UCI and is available via the pertinent LASD patrol station, pending publication by the FBI/UCI. Once it is reported by the LASD to the FBI, the FBI/UCI crime data is considered the most accurate.
COMPTONUNINCORPORATED
42 8
89 17
14 3
36 8
24 6
4.213.29
1.451.37
2.492.73
-40.86-17.02
71.7299.27
ARSON
COMPTON YTDReported
YTDCrime Rate
TotalReportedIncidents
YTDReported
YTDCrime Rate
TotalReportedIncidents
YTDReported
YTDCrime Rate
5 YearChange inYTD Crime
Rate
1 YearChange inYTD Crime
Rate
2009 2013 2014
2014/2009 2014/2013
PART I CRIMES TOTAL
STATION TOTAL
COMPTONUNINCORPORATED
1,963 371
2009
1,619 290
2013
1,534 332
50 17 30
196.97152.69
4,545 840
106 44
167.85132
3,892 804
4.03 1.44
159.04151.12
2.53
-19.26-1.03
75.69
STATION TOTAL
-5.2514.48
2,334 1,909
-37.22
1,866 5,385 4,696 157.57188.29 161.2 -16.32 -2.25
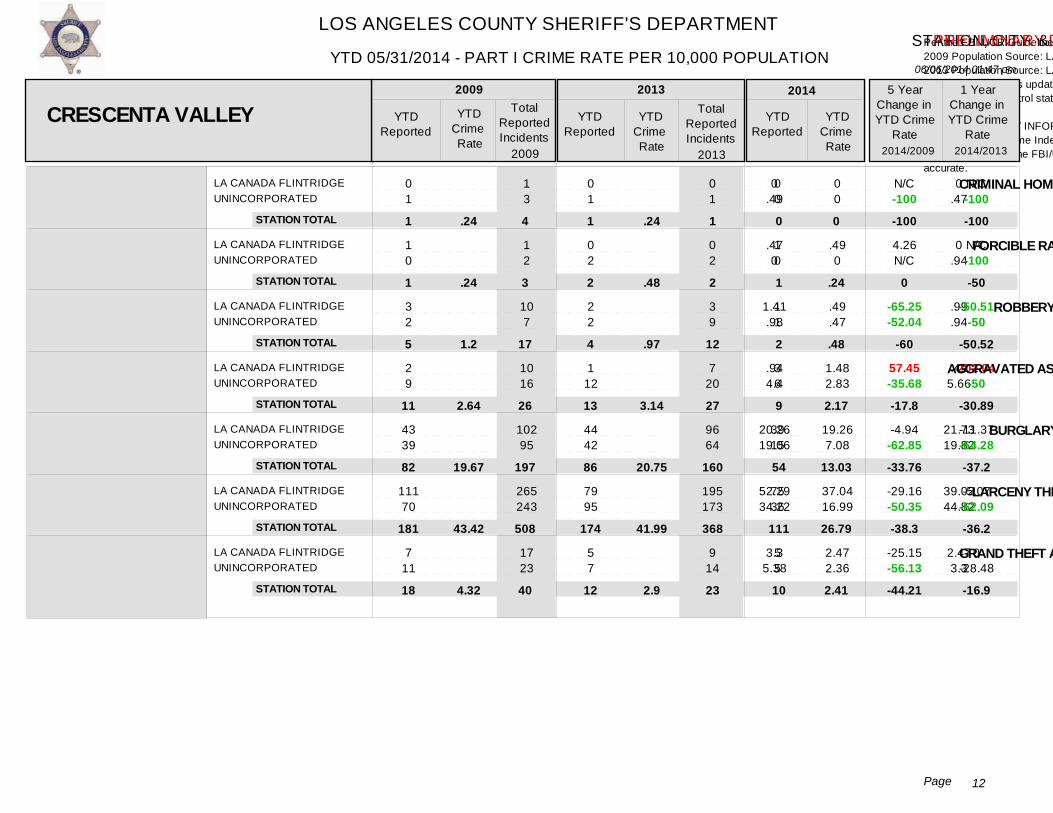
LOS ANGELES COUNTY SHERIFF'S DEPARTMENT
06/06/2014 01:47 pm
STATION, CITY & UNINCORPORATED DETAIL BY STATION & CRIME TYPE
Ver: 10.02.19.2013.0
YTD 05/31/2014 - PART I CRIME RATE PER 10,000 POPULATION
12Page
- PRELIMINARY DATA
Per the FBI UCR Guidelines Homicide, Rape and Aggravated Assault are counted by victim. All other crimes are counted by incident, except Arson which is always counted.2009 Population Source: LA County Internal Services Department (based on the 2000 US Census and CA Department of Finance estimates).2013 Population Source: LA County Internal Services Department (based on the 2010 US Census and CA Department of Finance estimates). 2014 YTD Crime Rates based on 2013 population estimates. 2013 population estimates updated for the city of Santa Clarita and the Santa Clarita Valley Station unincorporated area, due to 2012 year end annexations.Crime counts for patrol station areas only; red depicts +30% increases and green depicts -30% decreases. N/C = Not Calculable
This PRELIMINARY INFORMATION is used on an ongoing basis by the LASD for strategic planning and as a tactical early warning system. This data is not final and thus is not the crime data that is reported to the FBI Uniform Crime Index (UCI). This is because some of the most recent reports have not been written yet, nor reviewed by investigators. Once it is reported by investigators and supervisors, the crime data is reported to the FBI/UCI and is available via the pertinent LASD patrol station, pending publication by the FBI/UCI. Once it is reported by the LASD to the FBI, the FBI/UCI crime data is considered the most accurate.
LA CANADA FLINTRIDGEUNINCORPORATED
LA CANADA FLINTRIDGEUNINCORPORATED
LA CANADA FLINTRIDGEUNINCORPORATED
LA CANADA FLINTRIDGEUNINCORPORATED
LA CANADA FLINTRIDGEUNINCORPORATED
LA CANADA FLINTRIDGEUNINCORPORATED
LA CANADA FLINTRIDGEUNINCORPORATED
0 1
1 0
3 2
2 9
43 39
111 70
7 11
1 3
1 2
10 7
10 16
102 95
265 243
17 23
0 1
0 2
2 2
1 12
44 42
79 95
5 7
0 1
0 2
3 9
7 20
96 64
195 173
9 14
0 0
1 0
1 1
3 6
39 15
75 36
5 5
0.49
.470
1.41.98
.944.4
20.2619.06
52.2934.22
3.35.38
0.47
0.94
.99
.94
.495.66
21.7319.82
39.0244.82
2.473.3
00
.490
.49
.47
1.482.83
19.267.08
37.0416.99
2.472.36
N/C-100
4.26N/C
-65.25-52.04
57.45-35.68
-4.94-62.85
-29.16-50.35
-25.15-56.13
N/C-100
N/C-100
-50.51-50
202.04-50
-11.37-64.28
-5.07-62.09
0-28.48
CRIMINAL HOMICIDE
FORCIBLE RAPE
ROBBERY
AGGRAVATED ASSAULT
BURGLARY
LARCENY THEFT
GRAND THEFT AUTO
CRESCENTA VALLEY YTDReported
YTDCrime Rate
TotalReportedIncidents
YTDReported
YTDCrime Rate
TotalReportedIncidents
YTDReported
YTDCrime Rate
5 YearChange inYTD Crime
Rate
1 YearChange inYTD Crime
Rate
2009 2013 2014
2014/2009 2014/2013
STATION TOTAL
STATION TOTAL
STATION TOTAL
STATION TOTAL
STATION TOTAL
STATION TOTAL
STATION TOTAL
2009 2013
1
1
5
11
82
181
18
1
2
4
13
86
174
12
0
1
2
9
54
111
10
4
3
17
26
197
508
40
1
2
12
27
160
368
23
.24
.24
1.2
2.64
19.67
43.42
4.32
.24
.48
.97
3.14
20.75
41.99
2.9
0
.24
.48
2.17
13.03
26.79
2.41
-100
-50
-50.52
-30.89
-37.2
-36.2
-16.9
-100
0
-60
-17.8
-33.76
-38.3
-44.21

LOS ANGELES COUNTY SHERIFF'S DEPARTMENT
06/06/2014 01:47 pm
STATION, CITY & UNINCORPORATED DETAIL BY STATION & CRIME TYPE
Ver: 10.02.19.2013.0
YTD 05/31/2014 - PART I CRIME RATE PER 10,000 POPULATION
13Page
- PRELIMINARY DATA
Per the FBI UCR Guidelines Homicide, Rape and Aggravated Assault are counted by victim. All other crimes are counted by incident, except Arson which is always counted.2009 Population Source: LA County Internal Services Department (based on the 2000 US Census and CA Department of Finance estimates).2013 Population Source: LA County Internal Services Department (based on the 2010 US Census and CA Department of Finance estimates). 2014 YTD Crime Rates based on 2013 population estimates. 2013 population estimates updated for the city of Santa Clarita and the Santa Clarita Valley Station unincorporated area, due to 2012 year end annexations.Crime counts for patrol station areas only; red depicts +30% increases and green depicts -30% decreases. N/C = Not Calculable
This PRELIMINARY INFORMATION is used on an ongoing basis by the LASD for strategic planning and as a tactical early warning system. This data is not final and thus is not the crime data that is reported to the FBI Uniform Crime Index (UCI). This is because some of the most recent reports have not been written yet, nor reviewed by investigators. Once it is reported by investigators and supervisors, the crime data is reported to the FBI/UCI and is available via the pertinent LASD patrol station, pending publication by the FBI/UCI. Once it is reported by the LASD to the FBI, the FBI/UCI crime data is considered the most accurate.
LA CANADA FLINTRIDGEUNINCORPORATED
2 3
11 5
0 0
2 0
2 1
.941.47
00
.99
.475.32
-68.03N/CN/C
ARSON
CRESCENTA VALLEY YTDReported
YTDCrime Rate
TotalReportedIncidents
YTDReported
YTDCrime Rate
TotalReportedIncidents
YTDReported
YTDCrime Rate
5 YearChange inYTD Crime
Rate
1 YearChange inYTD Crime
Rate
2009 2013 2014
2014/2009 2014/2013
PART I CRIMES TOTAL
STATION TOTAL
LA CANADA FLINTRIDGEUNINCORPORATED
169 135
2009
131 161
2013
126 64
5 0 3
79.6265.99
417 394
16 2
64.775.96
312 283
1.2 0
62.2330.2
.72
-21.84-54.24
N/C
STATION TOTAL
-3.82-60.24
304 292
-40
190 811 595 45.8572.93 70.46 -37.13 -34.93
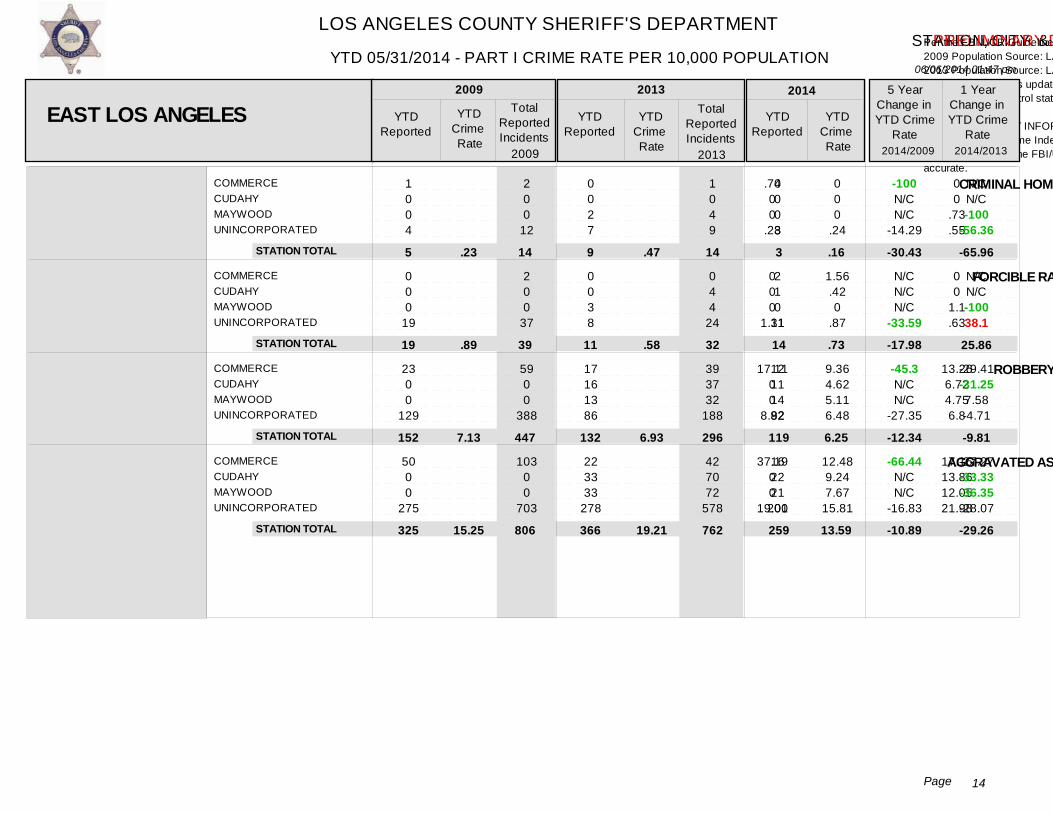
LOS ANGELES COUNTY SHERIFF'S DEPARTMENT
06/06/2014 01:47 pm
STATION, CITY & UNINCORPORATED DETAIL BY STATION & CRIME TYPE
Ver: 10.02.19.2013.0
YTD 05/31/2014 - PART I CRIME RATE PER 10,000 POPULATION
14Page
- PRELIMINARY DATA
Per the FBI UCR Guidelines Homicide, Rape and Aggravated Assault are counted by victim. All other crimes are counted by incident, except Arson which is always counted.2009 Population Source: LA County Internal Services Department (based on the 2000 US Census and CA Department of Finance estimates).2013 Population Source: LA County Internal Services Department (based on the 2010 US Census and CA Department of Finance estimates). 2014 YTD Crime Rates based on 2013 population estimates. 2013 population estimates updated for the city of Santa Clarita and the Santa Clarita Valley Station unincorporated area, due to 2012 year end annexations.Crime counts for patrol station areas only; red depicts +30% increases and green depicts -30% decreases. N/C = Not Calculable
This PRELIMINARY INFORMATION is used on an ongoing basis by the LASD for strategic planning and as a tactical early warning system. This data is not final and thus is not the crime data that is reported to the FBI Uniform Crime Index (UCI). This is because some of the most recent reports have not been written yet, nor reviewed by investigators. Once it is reported by investigators and supervisors, the crime data is reported to the FBI/UCI and is available via the pertinent LASD patrol station, pending publication by the FBI/UCI. Once it is reported by the LASD to the FBI, the FBI/UCI crime data is considered the most accurate.
COMMERCECUDAHYMAYWOODUNINCORPORATED
COMMERCECUDAHYMAYWOODUNINCORPORATED
COMMERCECUDAHYMAYWOODUNINCORPORATED
COMMERCECUDAHYMAYWOODUNINCORPORATED
1 0 0 4
0 0 0
19
23 0 0
129
50 0 0
275
2 0 0
12
2 0 0
37
59 0 0
388
103 0 0
703
0 0 2 7
0 0 3 8
17 16 13 86
22 33 33
278
1 0 4 9
0 4 4
24
39 37 32
188
42 70 72
578
0 0 0 3
2 1 0
11
12 11 14 82
16 22 21
200
.7400
.28
000
1.31
17.1100
8.92
37.1900
19.01
00
.73
.55
00
1.1.63
13.266.724.756.8
17.1613.8612.0521.98
000
.24
1.56.420
.87
9.364.625.116.48
12.489.247.67
15.81
-100N/CN/C
-14.29
N/CN/CN/C
-33.59
-45.3N/CN/C
-27.35
-66.44N/CN/C
-16.83
N/CN/C-100
-56.36
N/CN/C-10038.1
-29.41-31.257.58-4.71
-27.27-33.33-36.35-28.07
CRIMINAL HOMICIDE
FORCIBLE RAPE
ROBBERY
AGGRAVATED ASSAULT
EAST LOS ANGELES YTDReported
YTDCrime Rate
TotalReportedIncidents
YTDReported
YTDCrime Rate
TotalReportedIncidents
YTDReported
YTDCrime Rate
5 YearChange inYTD Crime
Rate
1 YearChange inYTD Crime
Rate
2009 2013 2014
2014/2009 2014/2013
STATION TOTAL
STATION TOTAL
STATION TOTAL
STATION TOTAL
2009 2013
5
19
152
325
9
11
132
366
3
14
119
259
14
39
447
806
14
32
296
762
.23
.89
7.13
15.25
.47
.58
6.93
19.21
.16
.73
6.25
13.59
-65.96
25.86
-9.81
-29.26
-30.43
-17.98
-12.34
-10.89
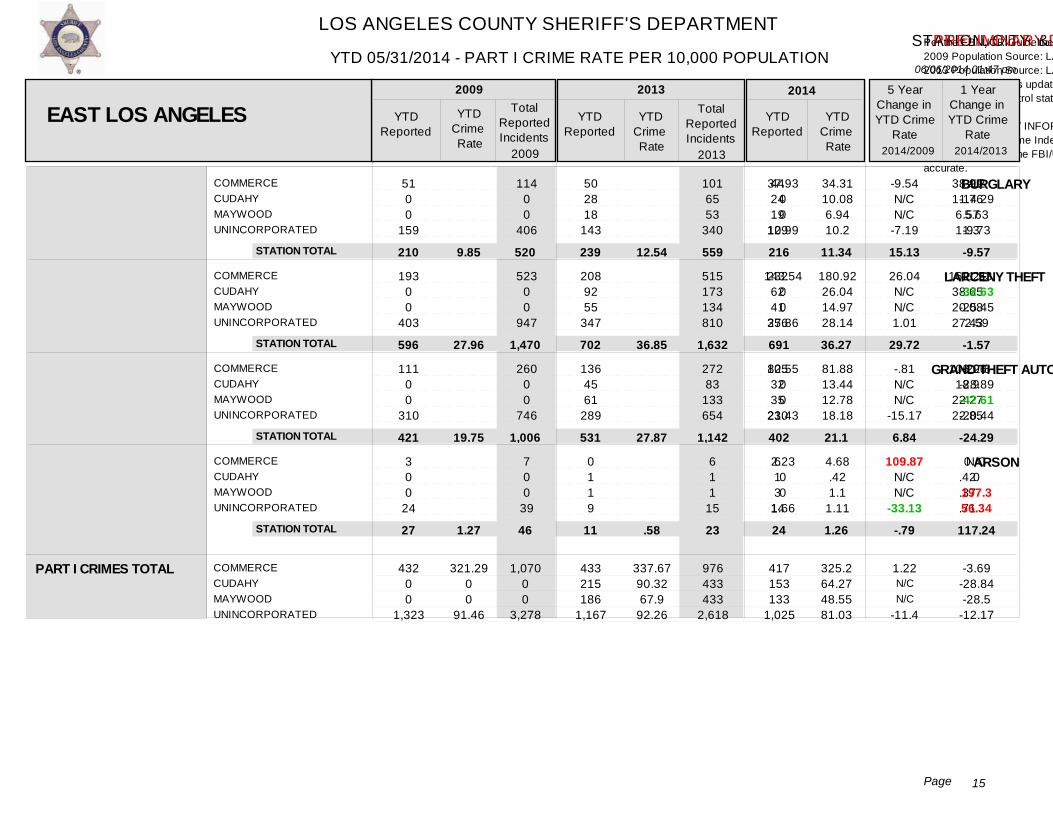
LOS ANGELES COUNTY SHERIFF'S DEPARTMENT
06/06/2014 01:47 pm
STATION, CITY & UNINCORPORATED DETAIL BY STATION & CRIME TYPE
Ver: 10.02.19.2013.0
YTD 05/31/2014 - PART I CRIME RATE PER 10,000 POPULATION
15Page
- PRELIMINARY DATA
Per the FBI UCR Guidelines Homicide, Rape and Aggravated Assault are counted by victim. All other crimes are counted by incident, except Arson which is always counted.2009 Population Source: LA County Internal Services Department (based on the 2000 US Census and CA Department of Finance estimates).2013 Population Source: LA County Internal Services Department (based on the 2010 US Census and CA Department of Finance estimates). 2014 YTD Crime Rates based on 2013 population estimates. 2013 population estimates updated for the city of Santa Clarita and the Santa Clarita Valley Station unincorporated area, due to 2012 year end annexations.Crime counts for patrol station areas only; red depicts +30% increases and green depicts -30% decreases. N/C = Not Calculable
This PRELIMINARY INFORMATION is used on an ongoing basis by the LASD for strategic planning and as a tactical early warning system. This data is not final and thus is not the crime data that is reported to the FBI Uniform Crime Index (UCI). This is because some of the most recent reports have not been written yet, nor reviewed by investigators. Once it is reported by investigators and supervisors, the crime data is reported to the FBI/UCI and is available via the pertinent LASD patrol station, pending publication by the FBI/UCI. Once it is reported by the LASD to the FBI, the FBI/UCI crime data is considered the most accurate.
COMMERCECUDAHYMAYWOODUNINCORPORATED
COMMERCECUDAHYMAYWOODUNINCORPORATED
COMMERCECUDAHYMAYWOODUNINCORPORATED
COMMERCECUDAHYMAYWOODUNINCORPORATED
51 0 0
159
193 0 0
403
111 0 0
310
3 0 0
24
114 0 0
406
523 0 0
947
260 0 0
746
7 0 0
39
50 28 18
143
208 92 55
347
136 45 61
289
0 1 1 9
101 65 53
340
515 173 134 810
272 83
133 654
6 1 1
15
44 24 19
129
232 62 41
356
105 32 35
230
6 1 3
14
37.9300
10.99
143.5400
27.86
82.5500
21.43
2.2300
1.66
38.9911.766.5711.3
162.2138.6520.0827.43
106.0618.9
22.2722.85
0.42.37.71
34.3110.086.9410.2
180.9226.0414.9728.14
81.8813.4412.7818.18
4.68.421.1
1.11
-9.54N/CN/C
-7.19
26.04N/CN/C1.01
-.81N/CN/C
-15.17
109.87N/CN/C
-33.13
-12-14.295.63-9.73
11.53-32.63-25.452.59
-22.8-28.89-42.61-20.44
N/C0
197.356.34
BURGLARY
LARCENY THEFT
GRAND THEFT AUTO
ARSON
EAST LOS ANGELES YTDReported
YTDCrime Rate
TotalReportedIncidents
YTDReported
YTDCrime Rate
TotalReportedIncidents
YTDReported
YTDCrime Rate
5 YearChange inYTD Crime
Rate
1 YearChange inYTD Crime
Rate
2009 2013 2014
2014/2009 2014/2013
PART I CRIMES TOTAL
STATION TOTAL
STATION TOTAL
STATION TOTAL
STATION TOTAL
COMMERCECUDAHYMAYWOODUNINCORPORATED
432 0 0
1,323
2009
433 215 186
1,167
2013
417 153 133
1,025
210
596
421
27
239
702
531
11
216
691
402
24
321.2900
91.46
1,070 0 0
3,278
520
1,470
1,006
46
559
1,632
1,142
23
337.6790.3267.9
92.26
976 433 433
2,618
9.85
27.96
19.75
1.27
12.54
36.85
27.87
.58
325.264.2748.5581.03
11.34
36.27
21.1
1.26
1.22N/CN/C
-11.4
-9.57
-1.57
-24.29
117.24
-3.69-28.84-28.5
-12.17
15.13
29.72
6.84
-.79
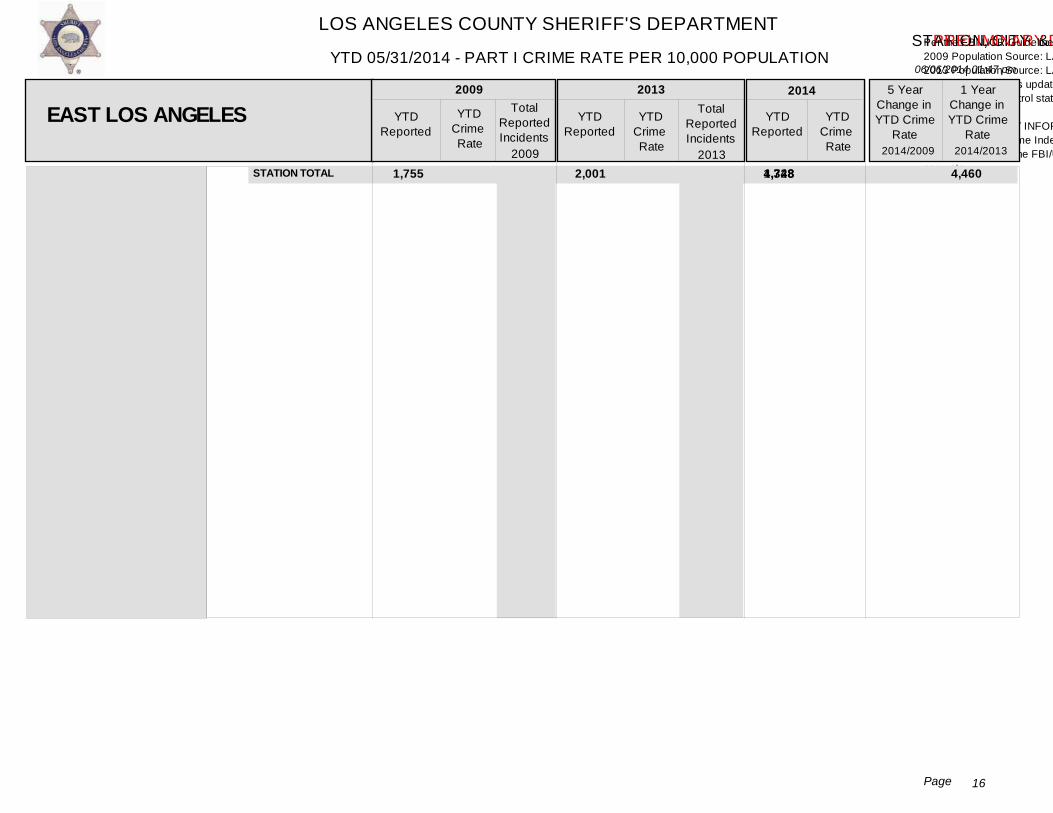
LOS ANGELES COUNTY SHERIFF'S DEPARTMENT
06/06/2014 01:47 pm
STATION, CITY & UNINCORPORATED DETAIL BY STATION & CRIME TYPE
Ver: 10.02.19.2013.0
YTD 05/31/2014 - PART I CRIME RATE PER 10,000 POPULATION
16Page
- PRELIMINARY DATA
Per the FBI UCR Guidelines Homicide, Rape and Aggravated Assault are counted by victim. All other crimes are counted by incident, except Arson which is always counted.2009 Population Source: LA County Internal Services Department (based on the 2000 US Census and CA Department of Finance estimates).2013 Population Source: LA County Internal Services Department (based on the 2010 US Census and CA Department of Finance estimates). 2014 YTD Crime Rates based on 2013 population estimates. 2013 population estimates updated for the city of Santa Clarita and the Santa Clarita Valley Station unincorporated area, due to 2012 year end annexations.Crime counts for patrol station areas only; red depicts +30% increases and green depicts -30% decreases. N/C = Not Calculable
This PRELIMINARY INFORMATION is used on an ongoing basis by the LASD for strategic planning and as a tactical early warning system. This data is not final and thus is not the crime data that is reported to the FBI Uniform Crime Index (UCI). This is because some of the most recent reports have not been written yet, nor reviewed by investigators. Once it is reported by investigators and supervisors, the crime data is reported to the FBI/UCI and is available via the pertinent LASD patrol station, pending publication by the FBI/UCI. Once it is reported by the LASD to the FBI, the FBI/UCI crime data is considered the most accurate.
EAST LOS ANGELES YTDReported
YTDCrime Rate
TotalReportedIncidents
YTDReported
YTDCrime Rate
TotalReportedIncidents
YTDReported
YTDCrime Rate
5 YearChange inYTD Crime
Rate
1 YearChange inYTD Crime
Rate
2009 2013 2014
2014/2009 2014/20132009 2013 STATION TOTAL 1,755 2,001 1,728 4,348 4,460 90.782.32 105.03 10.18 -13.64
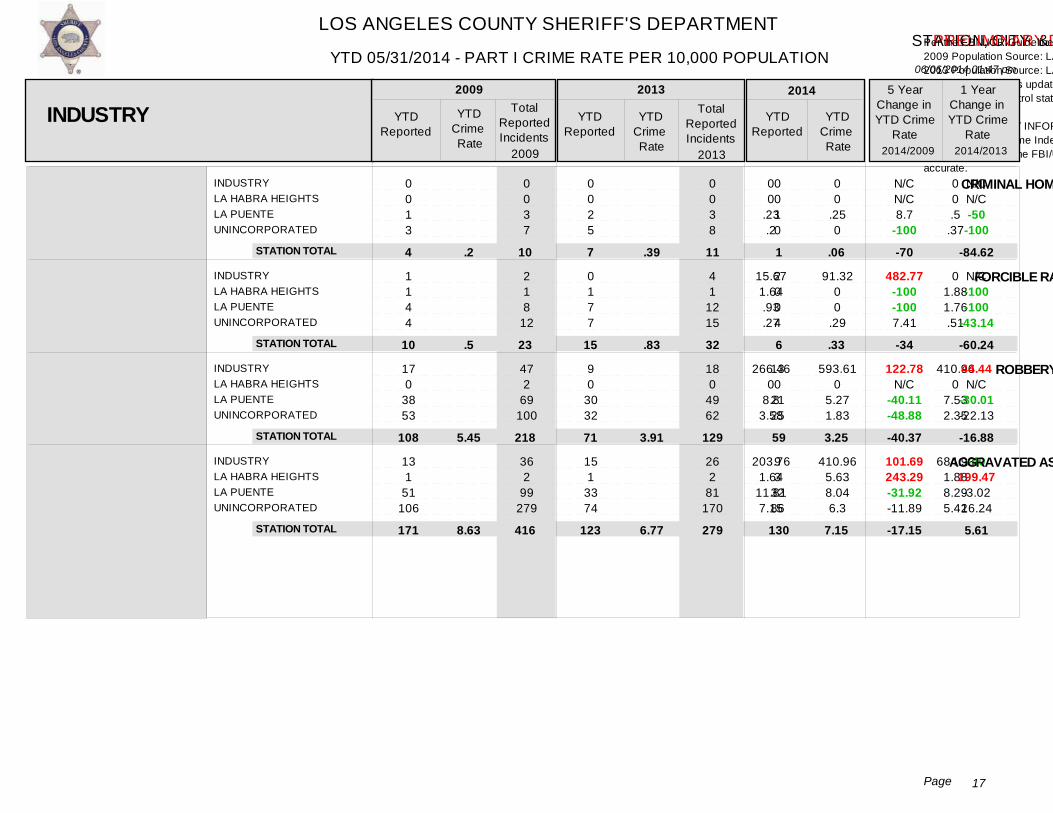
LOS ANGELES COUNTY SHERIFF'S DEPARTMENT
06/06/2014 01:47 pm
STATION, CITY & UNINCORPORATED DETAIL BY STATION & CRIME TYPE
Ver: 10.02.19.2013.0
YTD 05/31/2014 - PART I CRIME RATE PER 10,000 POPULATION
17Page
- PRELIMINARY DATA
Per the FBI UCR Guidelines Homicide, Rape and Aggravated Assault are counted by victim. All other crimes are counted by incident, except Arson which is always counted.2009 Population Source: LA County Internal Services Department (based on the 2000 US Census and CA Department of Finance estimates).2013 Population Source: LA County Internal Services Department (based on the 2010 US Census and CA Department of Finance estimates). 2014 YTD Crime Rates based on 2013 population estimates. 2013 population estimates updated for the city of Santa Clarita and the Santa Clarita Valley Station unincorporated area, due to 2012 year end annexations.Crime counts for patrol station areas only; red depicts +30% increases and green depicts -30% decreases. N/C = Not Calculable
This PRELIMINARY INFORMATION is used on an ongoing basis by the LASD for strategic planning and as a tactical early warning system. This data is not final and thus is not the crime data that is reported to the FBI Uniform Crime Index (UCI). This is because some of the most recent reports have not been written yet, nor reviewed by investigators. Once it is reported by investigators and supervisors, the crime data is reported to the FBI/UCI and is available via the pertinent LASD patrol station, pending publication by the FBI/UCI. Once it is reported by the LASD to the FBI, the FBI/UCI crime data is considered the most accurate.
INDUSTRYLA HABRA HEIGHTSLA PUENTEUNINCORPORATED
INDUSTRYLA HABRA HEIGHTSLA PUENTEUNINCORPORATED
INDUSTRYLA HABRA HEIGHTSLA PUENTEUNINCORPORATED
INDUSTRYLA HABRA HEIGHTSLA PUENTEUNINCORPORATED
0 0 1 3
1 1 4 4
17 0
38 53
13 1
51 106
0 0 3 7
2 1 8
12
47 2
69 100
36 2
99 279
0 0 2 5
0 1 7 7
9 0
30 32
15 1
33 74
0 0 3 8
4 1
12 15
18 0
49 62
26 2
81 170
0 0 1 0
2 0 0 4
13 0
21 25
9 3
32 86
00
.23.2
15.671.64.93.27
266.460
8.83.58
203.761.64
11.817.15
00.5
.37
01.881.76.51
410.960
7.532.35
684.931.888.295.42
00
.250
91.3200
.29
593.610
5.271.83
410.965.638.046.3
N/CN/C8.7
-100
482.77-100-1007.41
122.78N/C
-40.11-48.88
101.69243.29-31.92-11.89
N/CN/C-50
-100
N/C-100-100
-43.14
44.44N/C
-30.01-22.13
-40199.47-3.0216.24
CRIMINAL HOMICIDE
FORCIBLE RAPE
ROBBERY
AGGRAVATED ASSAULT
INDUSTRY YTDReported
YTDCrime Rate
TotalReportedIncidents
YTDReported
YTDCrime Rate
TotalReportedIncidents
YTDReported
YTDCrime Rate
5 YearChange inYTD Crime
Rate
1 YearChange inYTD Crime
Rate
2009 2013 2014
2014/2009 2014/2013
STATION TOTAL
STATION TOTAL
STATION TOTAL
STATION TOTAL
2009 2013
4
10
108
171
7
15
71
123
1
6
59
130
10
23
218
416
11
32
129
279
.2
.5
5.45
8.63
.39
.83
3.91
6.77
.06
.33
3.25
7.15
-84.62
-60.24
-16.88
5.61
-70
-34
-40.37
-17.15
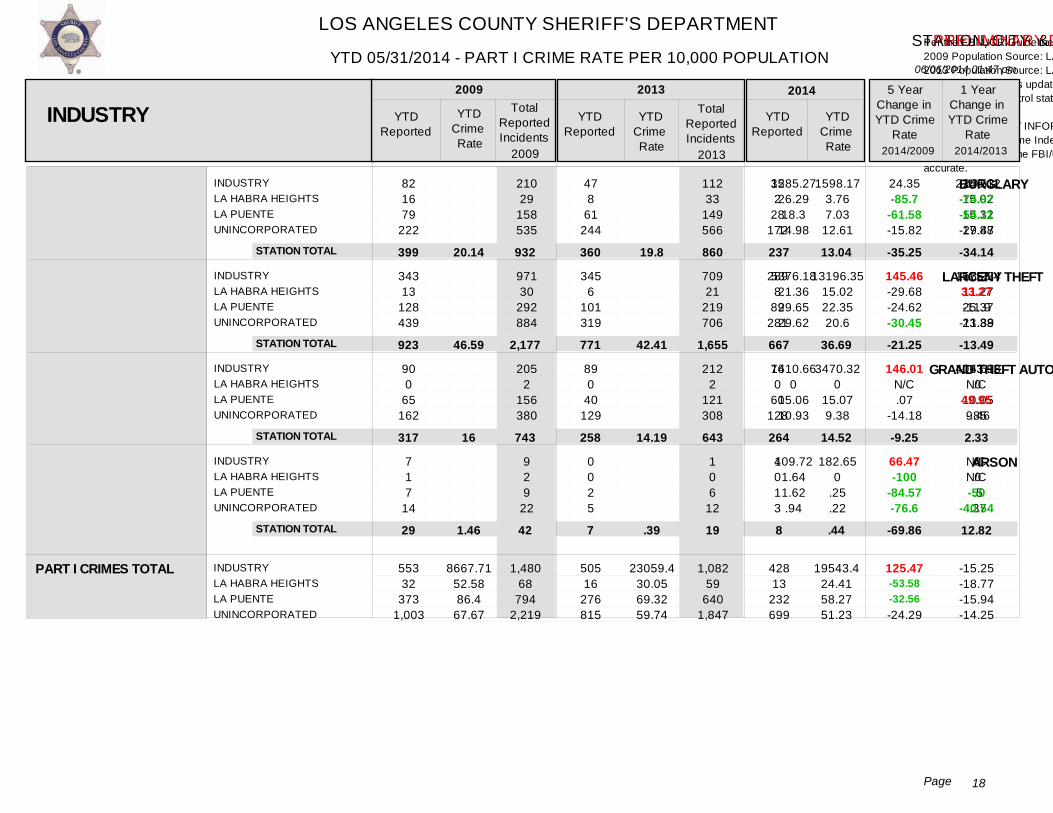
LOS ANGELES COUNTY SHERIFF'S DEPARTMENT
06/06/2014 01:47 pm
STATION, CITY & UNINCORPORATED DETAIL BY STATION & CRIME TYPE
Ver: 10.02.19.2013.0
YTD 05/31/2014 - PART I CRIME RATE PER 10,000 POPULATION
18Page
- PRELIMINARY DATA
Per the FBI UCR Guidelines Homicide, Rape and Aggravated Assault are counted by victim. All other crimes are counted by incident, except Arson which is always counted.2009 Population Source: LA County Internal Services Department (based on the 2000 US Census and CA Department of Finance estimates).2013 Population Source: LA County Internal Services Department (based on the 2010 US Census and CA Department of Finance estimates). 2014 YTD Crime Rates based on 2013 population estimates. 2013 population estimates updated for the city of Santa Clarita and the Santa Clarita Valley Station unincorporated area, due to 2012 year end annexations.Crime counts for patrol station areas only; red depicts +30% increases and green depicts -30% decreases. N/C = Not Calculable
This PRELIMINARY INFORMATION is used on an ongoing basis by the LASD for strategic planning and as a tactical early warning system. This data is not final and thus is not the crime data that is reported to the FBI Uniform Crime Index (UCI). This is because some of the most recent reports have not been written yet, nor reviewed by investigators. Once it is reported by investigators and supervisors, the crime data is reported to the FBI/UCI and is available via the pertinent LASD patrol station, pending publication by the FBI/UCI. Once it is reported by the LASD to the FBI, the FBI/UCI crime data is considered the most accurate.
INDUSTRYLA HABRA HEIGHTSLA PUENTEUNINCORPORATED
INDUSTRYLA HABRA HEIGHTSLA PUENTEUNINCORPORATED
INDUSTRYLA HABRA HEIGHTSLA PUENTEUNINCORPORATED
INDUSTRYLA HABRA HEIGHTSLA PUENTEUNINCORPORATED
82 16 79
222
343 13
128 439
90 0
65 162
7 1 7
14
210 29
158 535
971 30
292 884
205 2
156 380
9 2 9
22
47 8
61 244
345 6
101 319
89 0
40 129
0 0 2 5
112 33
149 566
709 21
219 706
212 2
121 308
1 0 6
12
35 2
28 172
289 8
89 281
76 0
60 128
4 0 1 3
1285.2726.2918.3
14.98
5376.1821.3629.6529.62
1410.660
15.0610.93
109.721.641.62.94
2146.1215.0215.3217.88
15753.411.2725.3723.38
4063.930
10.059.46
00.5
.37
1598.173.767.03
12.61
13196.3515.0222.3520.6
3470.320
15.079.38
182.650
.25
.22
24.35-85.7
-61.58-15.82
145.46-29.68-24.62-30.45
146.01N/C.07
-14.18
66.47-100
-84.57-76.6
-25.53-74.97-54.11-29.47
-16.2333.27-11.9
-11.89
-14.61N/C
49.95-.85
N/CN/C-50
-40.54
BURGLARY
LARCENY THEFT
GRAND THEFT AUTO
ARSON
INDUSTRY YTDReported
YTDCrime Rate
TotalReportedIncidents
YTDReported
YTDCrime Rate
TotalReportedIncidents
YTDReported
YTDCrime Rate
5 YearChange inYTD Crime
Rate
1 YearChange inYTD Crime
Rate
2009 2013 2014
2014/2009 2014/2013
PART I CRIMES TOTAL
STATION TOTAL
STATION TOTAL
STATION TOTAL
STATION TOTAL
INDUSTRYLA HABRA HEIGHTSLA PUENTEUNINCORPORATED
553 32
373 1,003
2009
505 16
276 815
2013
428 13
232 699
399
923
317
29
360
771
258
7
237
667
264
8
8667.7152.5886.4
67.67
1,480 68
794 2,219
932
2,177
743
42
860
1,655
643
19
23059.430.0569.3259.74
1,082 59
640 1,847
20.14
46.59
16
1.46
19.8
42.41
14.19
.39
19543.424.4158.2751.23
13.04
36.69
14.52
.44
125.47-53.58-32.56-24.29
-34.14
-13.49
2.33
12.82
-15.25-18.77-15.94-14.25
-35.25
-21.25
-9.25
-69.86
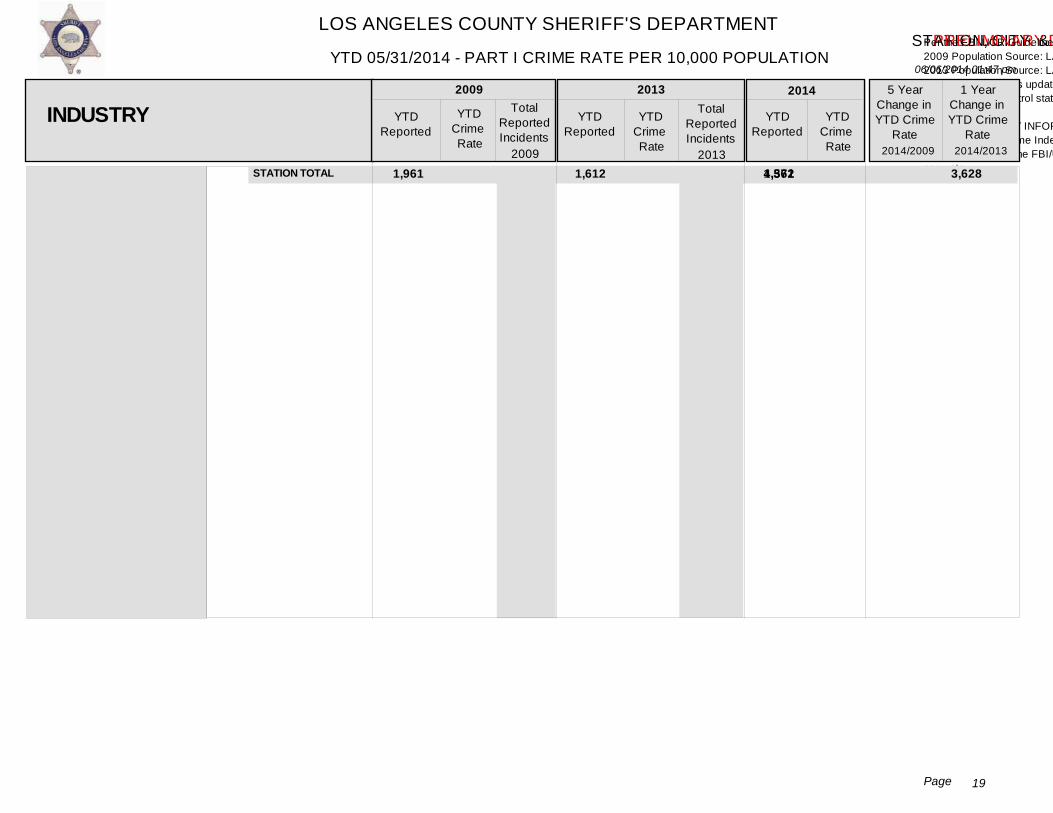
LOS ANGELES COUNTY SHERIFF'S DEPARTMENT
06/06/2014 01:47 pm
STATION, CITY & UNINCORPORATED DETAIL BY STATION & CRIME TYPE
Ver: 10.02.19.2013.0
YTD 05/31/2014 - PART I CRIME RATE PER 10,000 POPULATION
19Page
- PRELIMINARY DATA
Per the FBI UCR Guidelines Homicide, Rape and Aggravated Assault are counted by victim. All other crimes are counted by incident, except Arson which is always counted.2009 Population Source: LA County Internal Services Department (based on the 2000 US Census and CA Department of Finance estimates).2013 Population Source: LA County Internal Services Department (based on the 2010 US Census and CA Department of Finance estimates). 2014 YTD Crime Rates based on 2013 population estimates. 2013 population estimates updated for the city of Santa Clarita and the Santa Clarita Valley Station unincorporated area, due to 2012 year end annexations.Crime counts for patrol station areas only; red depicts +30% increases and green depicts -30% decreases. N/C = Not Calculable
This PRELIMINARY INFORMATION is used on an ongoing basis by the LASD for strategic planning and as a tactical early warning system. This data is not final and thus is not the crime data that is reported to the FBI Uniform Crime Index (UCI). This is because some of the most recent reports have not been written yet, nor reviewed by investigators. Once it is reported by investigators and supervisors, the crime data is reported to the FBI/UCI and is available via the pertinent LASD patrol station, pending publication by the FBI/UCI. Once it is reported by the LASD to the FBI, the FBI/UCI crime data is considered the most accurate.
INDUSTRY YTDReported
YTDCrime Rate
TotalReportedIncidents
YTDReported
YTDCrime Rate
TotalReportedIncidents
YTDReported
YTDCrime Rate
5 YearChange inYTD Crime
Rate
1 YearChange inYTD Crime
Rate
2009 2013 2014
2014/2009 2014/20132009 2013 STATION TOTAL 1,961 1,612 1,372 4,561 3,628 75.4798.98 88.67 -23.75 -14.89
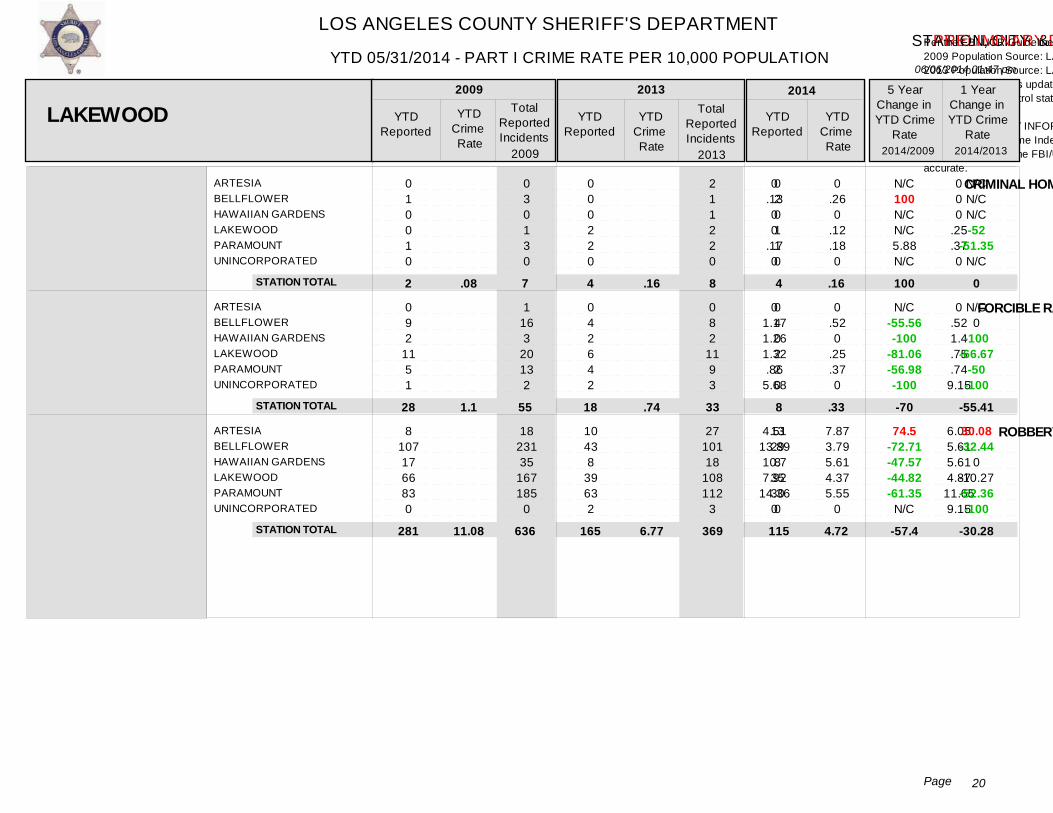
LOS ANGELES COUNTY SHERIFF'S DEPARTMENT
06/06/2014 01:47 pm
STATION, CITY & UNINCORPORATED DETAIL BY STATION & CRIME TYPE
Ver: 10.02.19.2013.0
YTD 05/31/2014 - PART I CRIME RATE PER 10,000 POPULATION
20Page
- PRELIMINARY DATA
Per the FBI UCR Guidelines Homicide, Rape and Aggravated Assault are counted by victim. All other crimes are counted by incident, except Arson which is always counted.2009 Population Source: LA County Internal Services Department (based on the 2000 US Census and CA Department of Finance estimates).2013 Population Source: LA County Internal Services Department (based on the 2010 US Census and CA Department of Finance estimates). 2014 YTD Crime Rates based on 2013 population estimates. 2013 population estimates updated for the city of Santa Clarita and the Santa Clarita Valley Station unincorporated area, due to 2012 year end annexations.Crime counts for patrol station areas only; red depicts +30% increases and green depicts -30% decreases. N/C = Not Calculable
This PRELIMINARY INFORMATION is used on an ongoing basis by the LASD for strategic planning and as a tactical early warning system. This data is not final and thus is not the crime data that is reported to the FBI Uniform Crime Index (UCI). This is because some of the most recent reports have not been written yet, nor reviewed by investigators. Once it is reported by investigators and supervisors, the crime data is reported to the FBI/UCI and is available via the pertinent LASD patrol station, pending publication by the FBI/UCI. Once it is reported by the LASD to the FBI, the FBI/UCI crime data is considered the most accurate.
ARTESIABELLFLOWERHAWAIIAN GARDENSLAKEWOODPARAMOUNTUNINCORPORATED
ARTESIABELLFLOWERHAWAIIAN GARDENSLAKEWOODPARAMOUNTUNINCORPORATED
ARTESIABELLFLOWERHAWAIIAN GARDENSLAKEWOODPARAMOUNTUNINCORPORATED
0 1 0 0 1 0
0 9 2
11 5 1
8 107 17 66 83 0
0 3 0 1 3 0
1 16 3
20 13 2
18 231 35
167 185
0
0 0 0 2 2 0
0 4 2 6 4 2
10 43 8
39 63 2
2 1 1 2 2 0
0 8 2
11 9 3
27 101 18
108 112
3
0 2 0 1 1 0
0 4 0 2 2 0
13 29 8
35 30 0
0.1300
.170
01.171.261.32.86
5.68
4.5113.8910.77.92
14.360
000
.25
.370
0.521.4.75.74
9.15
6.055.615.614.87
11.659.15
0.260
.12
.180
0.520
.25
.370
7.873.795.614.375.55
0
N/C100N/CN/C5.88N/C
N/C-55.56-100
-81.06-56.98-100
74.5-72.71-47.57-44.82-61.35
N/C
N/CN/CN/C-52
-51.35N/C
N/C0
-100-66.67
-50-100
30.08-32.44
0-10.27-52.36-100
CRIMINAL HOMICIDE
FORCIBLE RAPE
ROBBERY
LAKEWOOD YTDReported
YTDCrime Rate
TotalReportedIncidents
YTDReported
YTDCrime Rate
TotalReportedIncidents
YTDReported
YTDCrime Rate
5 YearChange inYTD Crime
Rate
1 YearChange inYTD Crime
Rate
2009 2013 2014
2014/2009 2014/2013
STATION TOTAL
STATION TOTAL
STATION TOTAL
2009 2013
2
28
281
4
18
165
4
8
115
7
55
636
8
33
369
.08
1.1
11.08
.16
.74
6.77
.16
.33
4.72
0
-55.41
-30.28
100
-70
-57.4
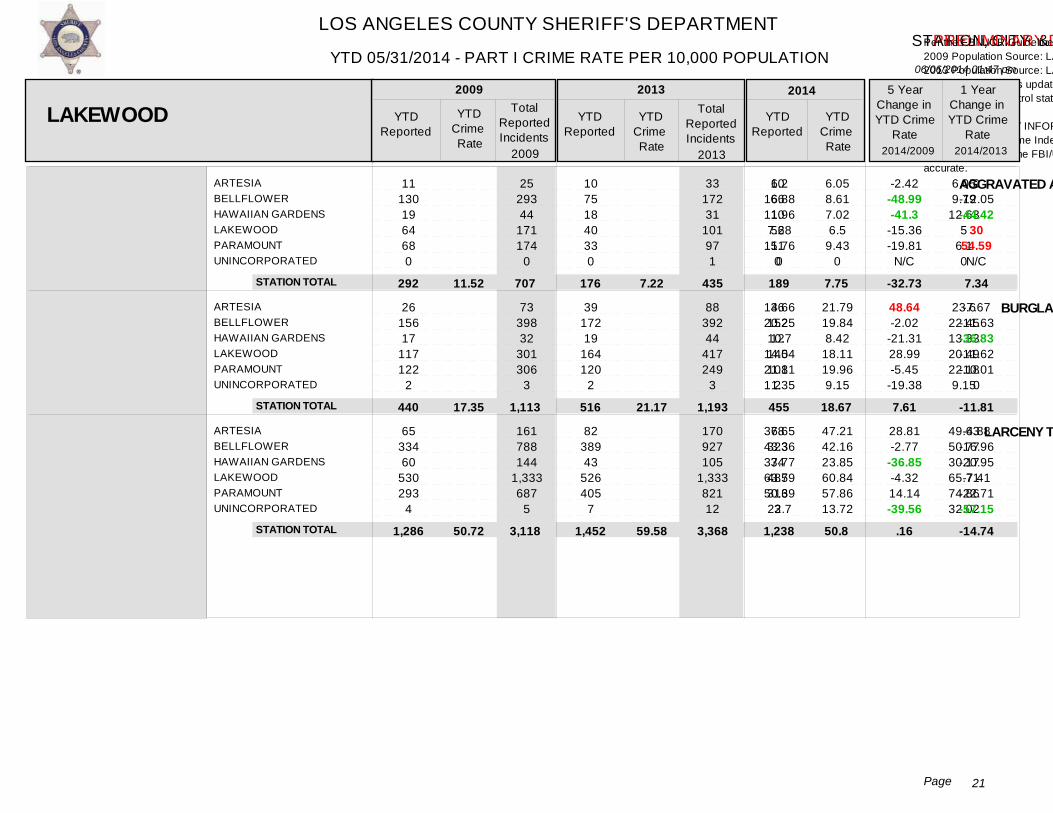
LOS ANGELES COUNTY SHERIFF'S DEPARTMENT
06/06/2014 01:47 pm
STATION, CITY & UNINCORPORATED DETAIL BY STATION & CRIME TYPE
Ver: 10.02.19.2013.0
YTD 05/31/2014 - PART I CRIME RATE PER 10,000 POPULATION
21Page
- PRELIMINARY DATA
Per the FBI UCR Guidelines Homicide, Rape and Aggravated Assault are counted by victim. All other crimes are counted by incident, except Arson which is always counted.2009 Population Source: LA County Internal Services Department (based on the 2000 US Census and CA Department of Finance estimates).2013 Population Source: LA County Internal Services Department (based on the 2010 US Census and CA Department of Finance estimates). 2014 YTD Crime Rates based on 2013 population estimates. 2013 population estimates updated for the city of Santa Clarita and the Santa Clarita Valley Station unincorporated area, due to 2012 year end annexations.Crime counts for patrol station areas only; red depicts +30% increases and green depicts -30% decreases. N/C = Not Calculable
This PRELIMINARY INFORMATION is used on an ongoing basis by the LASD for strategic planning and as a tactical early warning system. This data is not final and thus is not the crime data that is reported to the FBI Uniform Crime Index (UCI). This is because some of the most recent reports have not been written yet, nor reviewed by investigators. Once it is reported by investigators and supervisors, the crime data is reported to the FBI/UCI and is available via the pertinent LASD patrol station, pending publication by the FBI/UCI. Once it is reported by the LASD to the FBI, the FBI/UCI crime data is considered the most accurate.
ARTESIABELLFLOWERHAWAIIAN GARDENSLAKEWOODPARAMOUNTUNINCORPORATED
ARTESIABELLFLOWERHAWAIIAN GARDENSLAKEWOODPARAMOUNTUNINCORPORATED
ARTESIABELLFLOWERHAWAIIAN GARDENSLAKEWOODPARAMOUNTUNINCORPORATED
11 130 19 64 68 0
26 156 17
117 122
2
65 334 60
530 293
4
25 293 44
171 174
0
73 398 32
301 306
3
161 788 144
1,333 687
5
10 75 18 40 33 0
39 172 19
164 120
2
82 389 43
526 405
7
33 172 31
101 97 1
88 392 44
417 249
3
170 927 105
1,333 821 12
10 66 10 52 51 0
36 152 12
145 108
2
78 323 34
487 313
3
6.216.8811.967.68
11.760
14.6620.2510.7
14.0421.1111.35
36.6543.3637.7763.5950.6922.7
6.059.79
12.635
6.10
23.622.4513.3320.4922.189.15
49.6350.7730.1765.7174.8632.02
6.058.617.026.5
9.430
21.7919.848.42
18.1119.969.15
47.2142.1623.8560.8457.8613.72
-2.42-48.99-41.3
-15.36-19.81
N/C
48.64-2.02
-21.3128.99-5.45
-19.38
28.81-2.77
-36.85-4.3214.14-39.56
0-12.05-44.42
3054.59N/C
-7.67-11.63-36.83-11.62-10.01
0
-4.88-16.96-20.95-7.41
-22.71-57.15
AGGRAVATED ASSAULT
BURGLARY
LARCENY THEFT
LAKEWOOD YTDReported
YTDCrime Rate
TotalReportedIncidents
YTDReported
YTDCrime Rate
TotalReportedIncidents
YTDReported
YTDCrime Rate
5 YearChange inYTD Crime
Rate
1 YearChange inYTD Crime
Rate
2009 2013 2014
2014/2009 2014/2013
STATION TOTAL
STATION TOTAL
STATION TOTAL
2009 2013
292
440
1,286
176
516
1,452
189
455
1,238
707
1,113
3,118
435
1,193
3,368
11.52
17.35
50.72
7.22
21.17
59.58
7.75
18.67
50.8
7.34
-11.81
-14.74
-32.73
7.61
.16
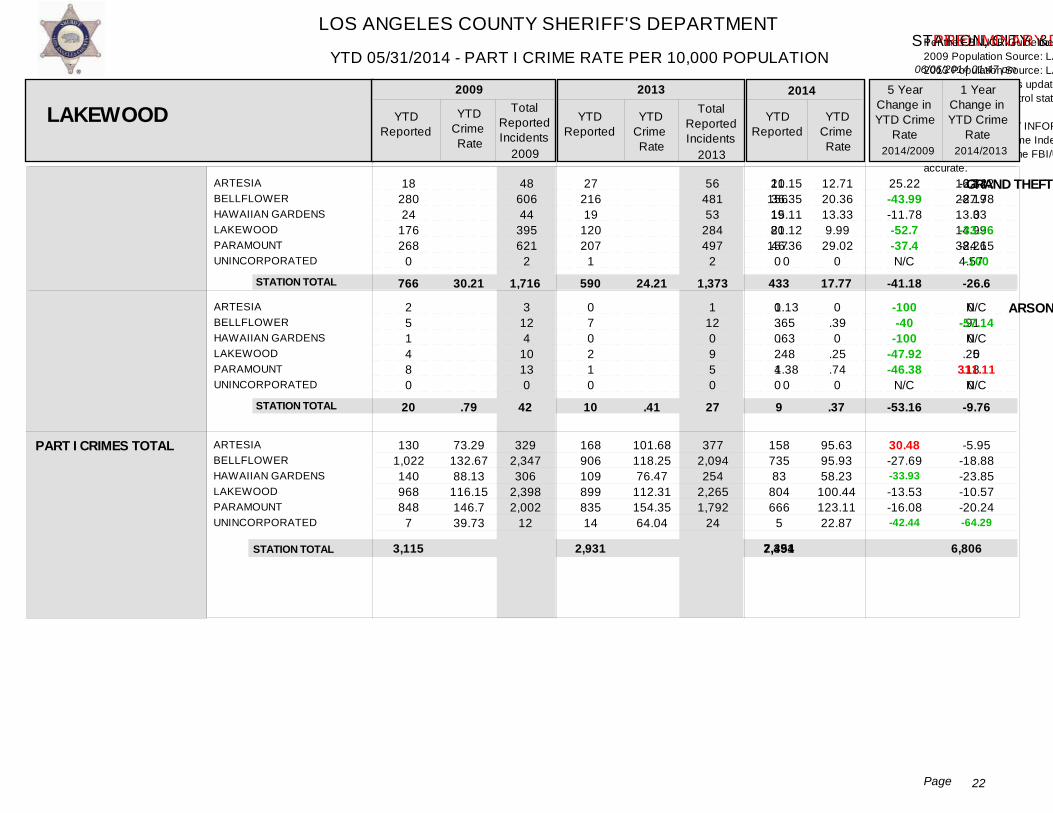
LOS ANGELES COUNTY SHERIFF'S DEPARTMENT
06/06/2014 01:47 pm
STATION, CITY & UNINCORPORATED DETAIL BY STATION & CRIME TYPE
Ver: 10.02.19.2013.0
YTD 05/31/2014 - PART I CRIME RATE PER 10,000 POPULATION
22Page
- PRELIMINARY DATA
Per the FBI UCR Guidelines Homicide, Rape and Aggravated Assault are counted by victim. All other crimes are counted by incident, except Arson which is always counted.2009 Population Source: LA County Internal Services Department (based on the 2000 US Census and CA Department of Finance estimates).2013 Population Source: LA County Internal Services Department (based on the 2010 US Census and CA Department of Finance estimates). 2014 YTD Crime Rates based on 2013 population estimates. 2013 population estimates updated for the city of Santa Clarita and the Santa Clarita Valley Station unincorporated area, due to 2012 year end annexations.Crime counts for patrol station areas only; red depicts +30% increases and green depicts -30% decreases. N/C = Not Calculable
This PRELIMINARY INFORMATION is used on an ongoing basis by the LASD for strategic planning and as a tactical early warning system. This data is not final and thus is not the crime data that is reported to the FBI Uniform Crime Index (UCI). This is because some of the most recent reports have not been written yet, nor reviewed by investigators. Once it is reported by investigators and supervisors, the crime data is reported to the FBI/UCI and is available via the pertinent LASD patrol station, pending publication by the FBI/UCI. Once it is reported by the LASD to the FBI, the FBI/UCI crime data is considered the most accurate.
ARTESIABELLFLOWERHAWAIIAN GARDENSLAKEWOODPARAMOUNTUNINCORPORATED
ARTESIABELLFLOWERHAWAIIAN GARDENSLAKEWOODPARAMOUNTUNINCORPORATED
18 280 24
176 268
0
2 5 1 4 8 0
48 606 44
395 621
2
3 12 4
10 13 0
27 216 19
120 207
1
0 7 0 2 1 0
56 481 53
284 497
2
1 12 0 9 5 0
21 156 19 80
157 0
0 3 0 2 4 0
10.1536.3515.1121.1246.36
0
1.13.65.63.48
1.380
16.3428.1913.3314.9938.264.57
0.910
.25
.180
12.7120.3613.339.99
29.020
0.390
.25
.740
25.22-43.99-11.78-52.7-37.4N/C
-100-40
-100-47.92-46.38
N/C
-22.22-27.78
0-33.36-24.15-100
N/C-57.14
N/C0
311.11N/C
GRAND THEFT AUTO
ARSON
LAKEWOOD YTDReported
YTDCrime Rate
TotalReportedIncidents
YTDReported
YTDCrime Rate
TotalReportedIncidents
YTDReported
YTDCrime Rate
5 YearChange inYTD Crime
Rate
1 YearChange inYTD Crime
Rate
2009 2013 2014
2014/2009 2014/2013
PART I CRIMES TOTAL
STATION TOTAL
STATION TOTAL
ARTESIABELLFLOWERHAWAIIAN GARDENSLAKEWOODPARAMOUNTUNINCORPORATED
130 1,022 140 968 848
7
2009
168 906 109 899 835 14
2013
158 735 83
804 666
5
766
20
590
10
433
9
73.29132.6788.13
116.15146.739.73
329 2,347 306
2,398 2,002
12
1,716
42
1,373
27
101.68118.2576.47
112.31154.3564.04
377 2,094 254
2,265 1,792
24
30.21
.79
24.21
.41
95.6395.9358.23
100.44123.1122.87
17.77
.37
30.48-27.69-33.93-13.53-16.08-42.44
-26.6
-9.76
STATION TOTAL
-5.95-18.88-23.85-10.57-20.24-64.29
3,115 2,931
-41.18
-53.16
2,451 7,394 6,806 100.56122.85 120.26 -18.14 -16.38
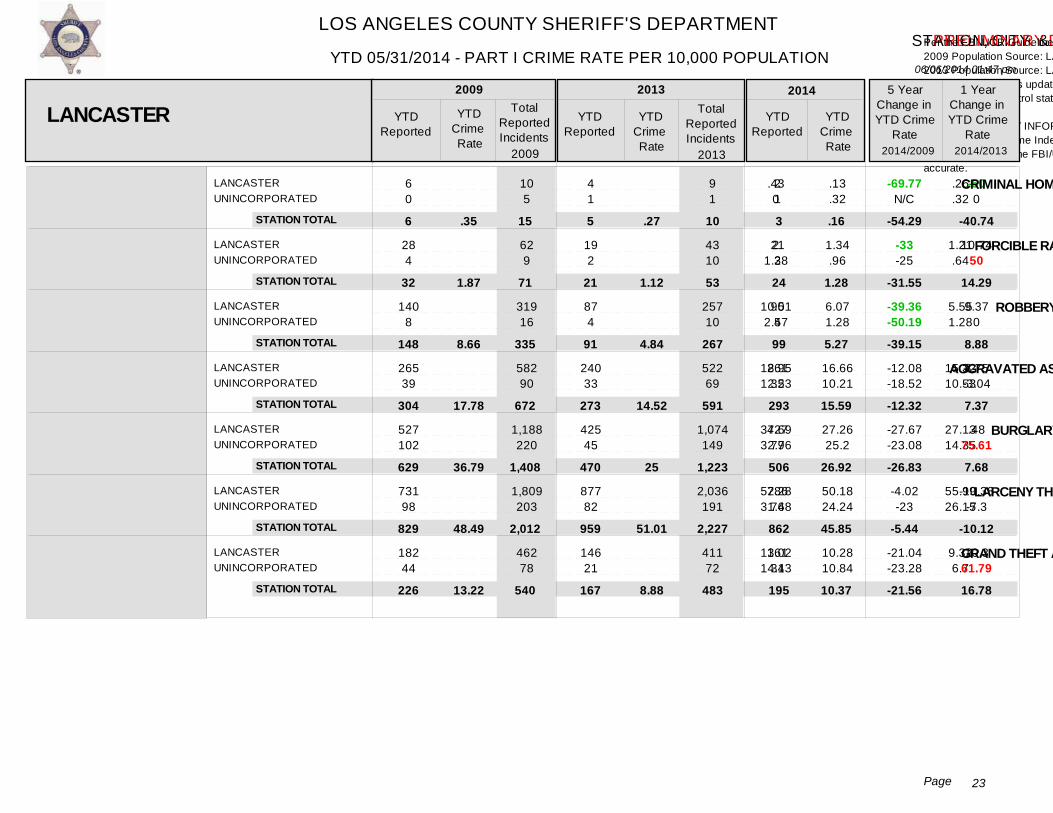
LOS ANGELES COUNTY SHERIFF'S DEPARTMENT
06/06/2014 01:47 pm
STATION, CITY & UNINCORPORATED DETAIL BY STATION & CRIME TYPE
Ver: 10.02.19.2013.0
YTD 05/31/2014 - PART I CRIME RATE PER 10,000 POPULATION
23Page
- PRELIMINARY DATA
Per the FBI UCR Guidelines Homicide, Rape and Aggravated Assault are counted by victim. All other crimes are counted by incident, except Arson which is always counted.2009 Population Source: LA County Internal Services Department (based on the 2000 US Census and CA Department of Finance estimates).2013 Population Source: LA County Internal Services Department (based on the 2010 US Census and CA Department of Finance estimates). 2014 YTD Crime Rates based on 2013 population estimates. 2013 population estimates updated for the city of Santa Clarita and the Santa Clarita Valley Station unincorporated area, due to 2012 year end annexations.Crime counts for patrol station areas only; red depicts +30% increases and green depicts -30% decreases. N/C = Not Calculable
This PRELIMINARY INFORMATION is used on an ongoing basis by the LASD for strategic planning and as a tactical early warning system. This data is not final and thus is not the crime data that is reported to the FBI Uniform Crime Index (UCI). This is because some of the most recent reports have not been written yet, nor reviewed by investigators. Once it is reported by investigators and supervisors, the crime data is reported to the FBI/UCI and is available via the pertinent LASD patrol station, pending publication by the FBI/UCI. Once it is reported by the LASD to the FBI, the FBI/UCI crime data is considered the most accurate.
LANCASTERUNINCORPORATED
LANCASTERUNINCORPORATED
LANCASTERUNINCORPORATED
LANCASTERUNINCORPORATED
LANCASTERUNINCORPORATED
LANCASTERUNINCORPORATED
LANCASTERUNINCORPORATED
6 0
28 4
140 8
265 39
527 102
731 98
182 44
10 5
62 9
319 16
582 90
1,188 220
1,809 203
462 78
4 1
19 2
87 4
240 33
425 45
877 82
146 21
9 1
43 10
257 10
522 69
1,074 149
2,036 191
411 72
2 1
21 3
95 4
261 32
427 79
786 76
161 34
.430
21.28
10.012.57
18.9512.53
37.6932.76
52.2831.48
13.0214.13
.26
.32
1.21.64
5.551.28
15.3210.53
27.1314.35
55.9926.15
9.326.7
.13
.32
1.34.96
6.071.28
16.6610.21
27.2625.2
50.1824.24
10.2810.84
-69.77N/C
-33-25
-39.36-50.19
-12.08-18.52
-27.67-23.08
-4.02-23
-21.04-23.28
-500
10.7450
9.370
8.75-3.04
.4875.61
-10.38-7.3
10.361.79
CRIMINAL HOMICIDE
FORCIBLE RAPE
ROBBERY
AGGRAVATED ASSAULT
BURGLARY
LARCENY THEFT
GRAND THEFT AUTO
LANCASTER YTDReported
YTDCrime Rate
TotalReportedIncidents
YTDReported
YTDCrime Rate
TotalReportedIncidents
YTDReported
YTDCrime Rate
5 YearChange inYTD Crime
Rate
1 YearChange inYTD Crime
Rate
2009 2013 2014
2014/2009 2014/2013
STATION TOTAL
STATION TOTAL
STATION TOTAL
STATION TOTAL
STATION TOTAL
STATION TOTAL
STATION TOTAL
2009 2013
6
32
148
304
629
829
226
5
21
91
273
470
959
167
3
24
99
293
506
862
195
15
71
335
672
1,408
2,012
540
10
53
267
591
1,223
2,227
483
.35
1.87
8.66
17.78
36.79
48.49
13.22
.27
1.12
4.84
14.52
25
51.01
8.88
.16
1.28
5.27
15.59
26.92
45.85
10.37
-40.74
14.29
8.88
7.37
7.68
-10.12
16.78
-54.29
-31.55
-39.15
-12.32
-26.83
-5.44
-21.56

LOS ANGELES COUNTY SHERIFF'S DEPARTMENT
06/06/2014 01:47 pm
STATION, CITY & UNINCORPORATED DETAIL BY STATION & CRIME TYPE
Ver: 10.02.19.2013.0
YTD 05/31/2014 - PART I CRIME RATE PER 10,000 POPULATION
24Page
- PRELIMINARY DATA
Per the FBI UCR Guidelines Homicide, Rape and Aggravated Assault are counted by victim. All other crimes are counted by incident, except Arson which is always counted.2009 Population Source: LA County Internal Services Department (based on the 2000 US Census and CA Department of Finance estimates).2013 Population Source: LA County Internal Services Department (based on the 2010 US Census and CA Department of Finance estimates). 2014 YTD Crime Rates based on 2013 population estimates. 2013 population estimates updated for the city of Santa Clarita and the Santa Clarita Valley Station unincorporated area, due to 2012 year end annexations.Crime counts for patrol station areas only; red depicts +30% increases and green depicts -30% decreases. N/C = Not Calculable
This PRELIMINARY INFORMATION is used on an ongoing basis by the LASD for strategic planning and as a tactical early warning system. This data is not final and thus is not the crime data that is reported to the FBI Uniform Crime Index (UCI). This is because some of the most recent reports have not been written yet, nor reviewed by investigators. Once it is reported by investigators and supervisors, the crime data is reported to the FBI/UCI and is available via the pertinent LASD patrol station, pending publication by the FBI/UCI. Once it is reported by the LASD to the FBI, the FBI/UCI crime data is considered the most accurate.
LANCASTERUNINCORPORATED
21 16
45 36
12 3
45 8
17 12
1.55.14
.77
.961.093.83
-27.33-25.49
41.56298.96
ARSON
LANCASTER YTDReported
YTDCrime Rate
TotalReportedIncidents
YTDReported
YTDCrime Rate
TotalReportedIncidents
YTDReported
YTDCrime Rate
5 YearChange inYTD Crime
Rate
1 YearChange inYTD Crime
Rate
2009 2013 2014
2014/2009 2014/2013
PART I CRIMES TOTAL
STATION TOTAL
LANCASTERUNINCORPORATED
1,900 311
2009
1,810 191
2013
1,770 241
37 15 29
135.8999.89
4,477 657
81 53
115.5660.92
4,397 510
2.16 .8
11376.87
1.54
-16.84-23.05
92.5
STATION TOTAL
-2.2226.18
2,211 2,001
-28.7
2,011 5,134 4,907 106.98129.34 106.44 -17.29 .51

LOS ANGELES COUNTY SHERIFF'S DEPARTMENT
06/06/2014 01:47 pm
STATION, CITY & UNINCORPORATED DETAIL BY STATION & CRIME TYPE
Ver: 10.02.19.2013.0
YTD 05/31/2014 - PART I CRIME RATE PER 10,000 POPULATION
25Page
- PRELIMINARY DATA
Per the FBI UCR Guidelines Homicide, Rape and Aggravated Assault are counted by victim. All other crimes are counted by incident, except Arson which is always counted.2009 Population Source: LA County Internal Services Department (based on the 2000 US Census and CA Department of Finance estimates).2013 Population Source: LA County Internal Services Department (based on the 2010 US Census and CA Department of Finance estimates). 2014 YTD Crime Rates based on 2013 population estimates. 2013 population estimates updated for the city of Santa Clarita and the Santa Clarita Valley Station unincorporated area, due to 2012 year end annexations.Crime counts for patrol station areas only; red depicts +30% increases and green depicts -30% decreases. N/C = Not Calculable
This PRELIMINARY INFORMATION is used on an ongoing basis by the LASD for strategic planning and as a tactical early warning system. This data is not final and thus is not the crime data that is reported to the FBI Uniform Crime Index (UCI). This is because some of the most recent reports have not been written yet, nor reviewed by investigators. Once it is reported by investigators and supervisors, the crime data is reported to the FBI/UCI and is available via the pertinent LASD patrol station, pending publication by the FBI/UCI. Once it is reported by the LASD to the FBI, the FBI/UCI crime data is considered the most accurate.
LOMITARANCHO PALOS VERDESROLLING HILLSROLLING HILLS ESTATESUNINCORPORATED
LOMITARANCHO PALOS VERDESROLLING HILLSROLLING HILLS ESTATESUNINCORPORATED
LOMITARANCHO PALOS VERDESROLLING HILLSROLLING HILLS ESTATESUNINCORPORATED
LOMITARANCHO PALOS VERDESROLLING HILLSROLLING HILLS ESTATESUNINCORPORATED
0 0 0 0 0
1 2 0 1 0
12 7 0 2 2
26 16 2 4 7
1 0 0 1 0
3 2 0 1 0
24 8 0 5 3
68 30 2
10 13
0 0 0 0 0
1 1 0 0 0
8 5 0 0 0
19 6 0 1 1
0 0 0 0 0
1 1 0 0 0
16 7 0 1 1
52 19 0 2 7
0 0 0 0 0
1 2 0 0 0
8 2 0 2 0
21 3 0 1 4
00000
.47
.470
1.240
5.71.63
02.495.08
12.343.73
10.194.97
17.77
00000
.49
.24000
3.951.2000
9.381.44
01.243.21
00000
.49
.48000
3.95.480
2.480
10.37.720
1.2412.84
N/CN/CN/CN/CN/C
4.262.13N/C-100N/C
-30.7-70.55
N/C-.4
-100
-15.96-80.7-100
-75.05-27.74
N/CN/CN/CN/CN/C
0100N/CN/CN/C
0-60N/CN/CN/C
10.55-50N/C
0300
CRIMINAL HOMICIDE
FORCIBLE RAPE
ROBBERY
AGGRAVATED ASSAULT
LOMITA YTDReported
YTDCrime Rate
TotalReportedIncidents
YTDReported
YTDCrime Rate
TotalReportedIncidents
YTDReported
YTDCrime Rate
5 YearChange inYTD Crime
Rate
1 YearChange inYTD Crime
Rate
2009 2013 2014
2014/2009 2014/2013
STATION TOTAL
STATION TOTAL
STATION TOTAL
STATION TOTAL
2009 2013
0
4
23
55
0
2
13
27
0
3
12
29
2
6
40
123
0
2
25
80
0
.51
2.95
7.06
0
.27
1.73
3.6
0
.4
1.6
3.87
N/C
48.15
-7.51
7.5
N/C
-21.57
-45.76
-45.18
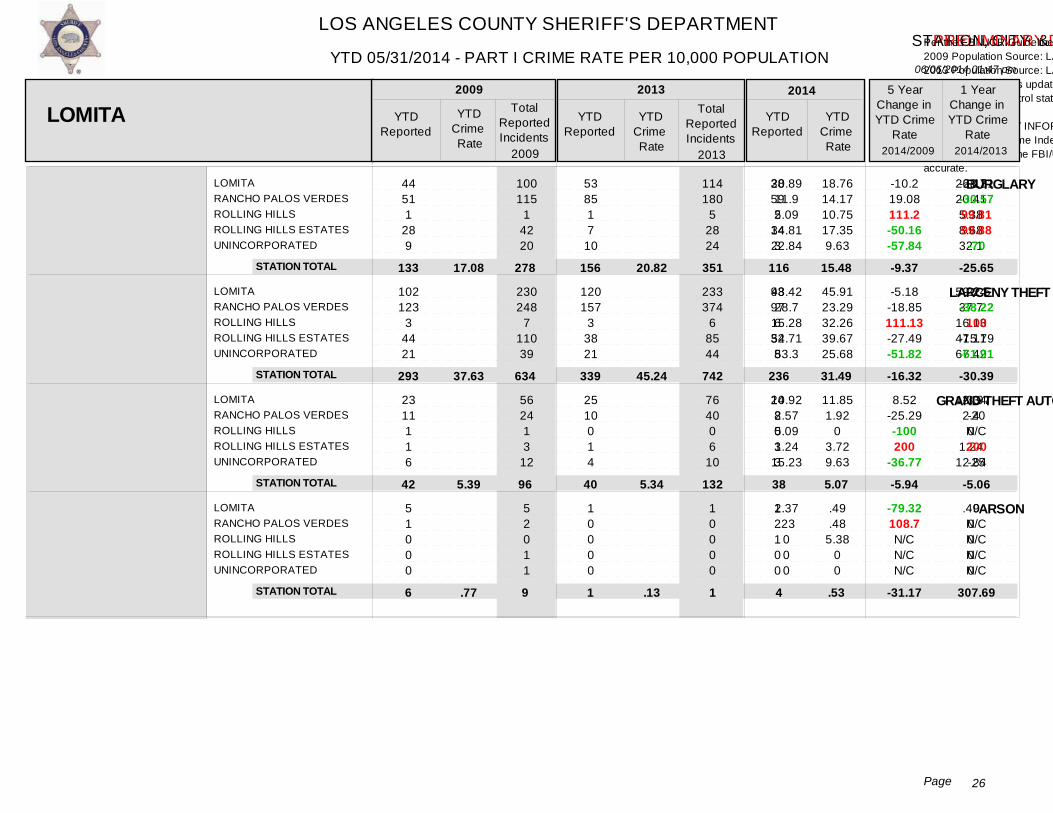
LOS ANGELES COUNTY SHERIFF'S DEPARTMENT
06/06/2014 01:47 pm
STATION, CITY & UNINCORPORATED DETAIL BY STATION & CRIME TYPE
Ver: 10.02.19.2013.0
YTD 05/31/2014 - PART I CRIME RATE PER 10,000 POPULATION
26Page
- PRELIMINARY DATA
Per the FBI UCR Guidelines Homicide, Rape and Aggravated Assault are counted by victim. All other crimes are counted by incident, except Arson which is always counted.2009 Population Source: LA County Internal Services Department (based on the 2000 US Census and CA Department of Finance estimates).2013 Population Source: LA County Internal Services Department (based on the 2010 US Census and CA Department of Finance estimates). 2014 YTD Crime Rates based on 2013 population estimates. 2013 population estimates updated for the city of Santa Clarita and the Santa Clarita Valley Station unincorporated area, due to 2012 year end annexations.Crime counts for patrol station areas only; red depicts +30% increases and green depicts -30% decreases. N/C = Not Calculable
This PRELIMINARY INFORMATION is used on an ongoing basis by the LASD for strategic planning and as a tactical early warning system. This data is not final and thus is not the crime data that is reported to the FBI Uniform Crime Index (UCI). This is because some of the most recent reports have not been written yet, nor reviewed by investigators. Once it is reported by investigators and supervisors, the crime data is reported to the FBI/UCI and is available via the pertinent LASD patrol station, pending publication by the FBI/UCI. Once it is reported by the LASD to the FBI, the FBI/UCI crime data is considered the most accurate.
LOMITARANCHO PALOS VERDESROLLING HILLSROLLING HILLS ESTATESUNINCORPORATED
LOMITARANCHO PALOS VERDESROLLING HILLSROLLING HILLS ESTATESUNINCORPORATED
LOMITARANCHO PALOS VERDESROLLING HILLSROLLING HILLS ESTATESUNINCORPORATED
LOMITARANCHO PALOS VERDESROLLING HILLSROLLING HILLS ESTATESUNINCORPORATED
44 51 1
28 9
102 123
3 44 21
23 11 1 1 6
5 1 0 0 0
100 115
1 42 20
230 248
7 110 39
56 24 1 3
12
5 2 0 1 1
53 85 1 7
10
120 157
3 38 21
25 10 0 1 4
1 0 0 0 0
114 180
5 28 24
233 374
6 85 44
76 40 0 6
10
1 0 0 0 0
38 59 2
14 3
93 97 6
32 8
24 8 0 3 3
1 2 1 0 0
20.8911.95.09
34.8122.84
48.4228.7
15.2854.7153.3
10.922.575.091.24
15.23
2.37.23000
26.1720.415.388.6832.1
59.2437.7
16.1347.1167.42
12.342.40
1.2412.84
.490000
18.7614.1710.7517.359.63
45.9123.2932.2639.6725.68
11.851.92
03.729.63
.49
.485.38
00
-10.219.08111.2-50.16-57.84
-5.18-18.85111.13-27.49-51.82
8.52-25.29-100200
-36.77
-79.32108.7N/CN/CN/C
-28.31-30.5799.8199.88
-70
-22.5-38.22
100-15.79-61.91
-3.97-20N/C200-25
0N/CN/CN/CN/C
BURGLARY
LARCENY THEFT
GRAND THEFT AUTO
ARSON
LOMITA YTDReported
YTDCrime Rate
TotalReportedIncidents
YTDReported
YTDCrime Rate
TotalReportedIncidents
YTDReported
YTDCrime Rate
5 YearChange inYTD Crime
Rate
1 YearChange inYTD Crime
Rate
2009 2013 2014
2014/2009 2014/2013
STATION TOTAL
STATION TOTAL
STATION TOTAL
STATION TOTAL
2009 2013
133
293
42
6
156
339
40
1
116
236
38
4
278
634
96
9
351
742
132
1
17.08
37.63
5.39
.77
20.82
45.24
5.34
.13
15.48
31.49
5.07
.53
-25.65
-30.39
-5.06
307.69
-9.37
-16.32
-5.94
-31.17
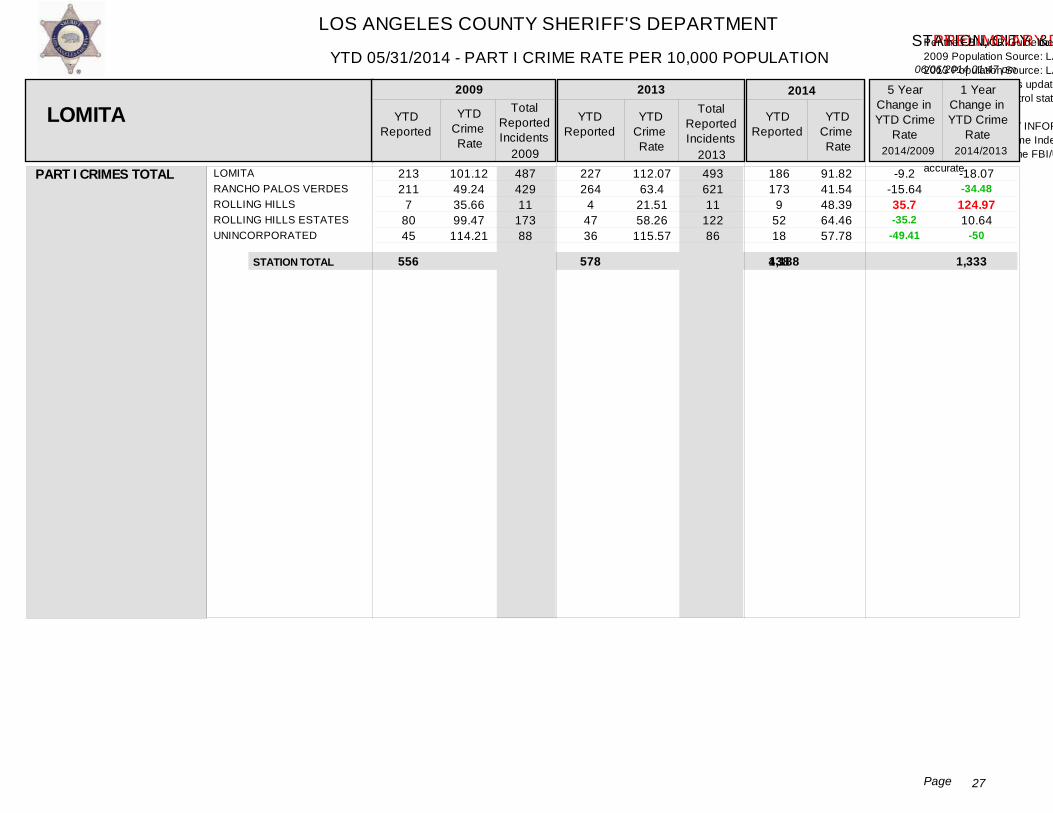
LOS ANGELES COUNTY SHERIFF'S DEPARTMENT
06/06/2014 01:47 pm
STATION, CITY & UNINCORPORATED DETAIL BY STATION & CRIME TYPE
Ver: 10.02.19.2013.0
YTD 05/31/2014 - PART I CRIME RATE PER 10,000 POPULATION
27Page
- PRELIMINARY DATA
Per the FBI UCR Guidelines Homicide, Rape and Aggravated Assault are counted by victim. All other crimes are counted by incident, except Arson which is always counted.2009 Population Source: LA County Internal Services Department (based on the 2000 US Census and CA Department of Finance estimates).2013 Population Source: LA County Internal Services Department (based on the 2010 US Census and CA Department of Finance estimates). 2014 YTD Crime Rates based on 2013 population estimates. 2013 population estimates updated for the city of Santa Clarita and the Santa Clarita Valley Station unincorporated area, due to 2012 year end annexations.Crime counts for patrol station areas only; red depicts +30% increases and green depicts -30% decreases. N/C = Not Calculable
This PRELIMINARY INFORMATION is used on an ongoing basis by the LASD for strategic planning and as a tactical early warning system. This data is not final and thus is not the crime data that is reported to the FBI Uniform Crime Index (UCI). This is because some of the most recent reports have not been written yet, nor reviewed by investigators. Once it is reported by investigators and supervisors, the crime data is reported to the FBI/UCI and is available via the pertinent LASD patrol station, pending publication by the FBI/UCI. Once it is reported by the LASD to the FBI, the FBI/UCI crime data is considered the most accurate.
LOMITA YTDReported
YTDCrime Rate
TotalReportedIncidents
YTDReported
YTDCrime Rate
TotalReportedIncidents
YTDReported
YTDCrime Rate
5 YearChange inYTD Crime
Rate
1 YearChange inYTD Crime
Rate
2009 2013 2014
2014/2009 2014/2013
PART I CRIMES TOTAL LOMITARANCHO PALOS VERDESROLLING HILLSROLLING HILLS ESTATESUNINCORPORATED
213 211
7 80 45
2009 227 264
4 47 36
2013 186 173
9 52 18
101.1249.2435.6699.47
114.21
487 429 11
173 88
112.0763.4
21.5158.26
115.57
493 621 11
122 86
91.8241.5448.3964.4657.78
-9.2-15.6435.7-35.2
-49.41
STATION TOTAL
-18.07-34.48
124.9710.64
-50
556 578 438 1,188 1,333 58.4571.41 77.13 -18.15 -24.22
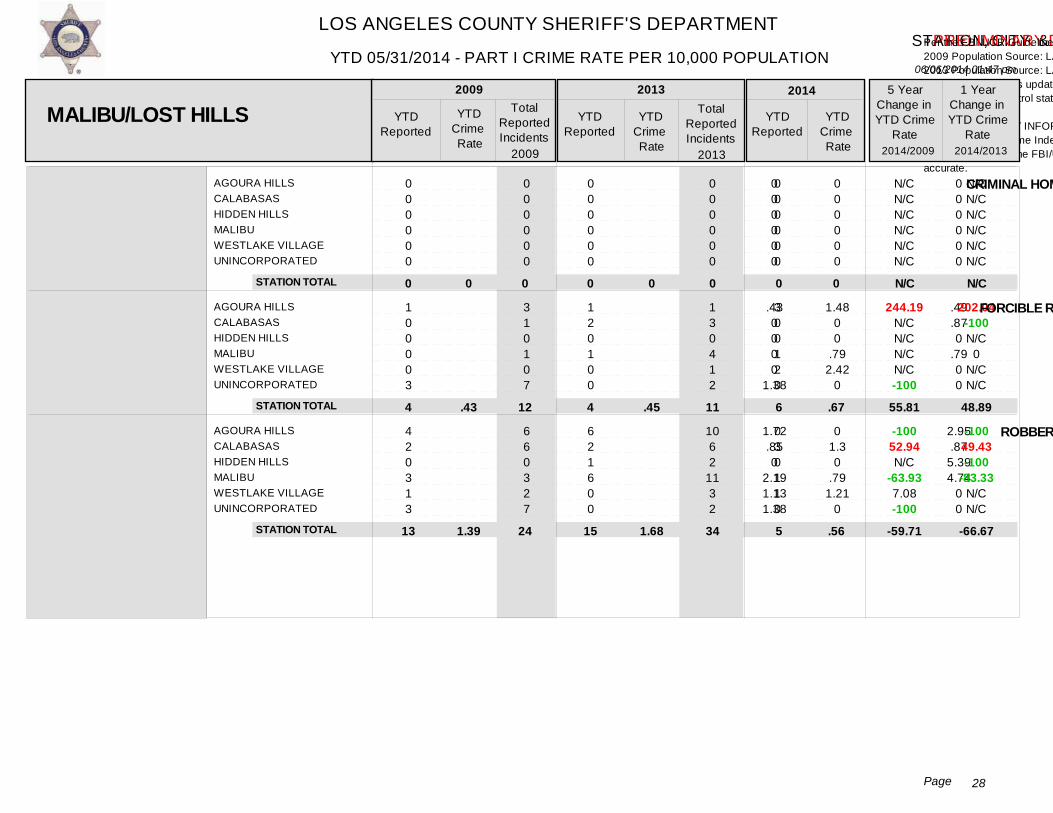
LOS ANGELES COUNTY SHERIFF'S DEPARTMENT
06/06/2014 01:47 pm
STATION, CITY & UNINCORPORATED DETAIL BY STATION & CRIME TYPE
Ver: 10.02.19.2013.0
YTD 05/31/2014 - PART I CRIME RATE PER 10,000 POPULATION
28Page
- PRELIMINARY DATA
Per the FBI UCR Guidelines Homicide, Rape and Aggravated Assault are counted by victim. All other crimes are counted by incident, except Arson which is always counted.2009 Population Source: LA County Internal Services Department (based on the 2000 US Census and CA Department of Finance estimates).2013 Population Source: LA County Internal Services Department (based on the 2010 US Census and CA Department of Finance estimates). 2014 YTD Crime Rates based on 2013 population estimates. 2013 population estimates updated for the city of Santa Clarita and the Santa Clarita Valley Station unincorporated area, due to 2012 year end annexations.Crime counts for patrol station areas only; red depicts +30% increases and green depicts -30% decreases. N/C = Not Calculable
This PRELIMINARY INFORMATION is used on an ongoing basis by the LASD for strategic planning and as a tactical early warning system. This data is not final and thus is not the crime data that is reported to the FBI Uniform Crime Index (UCI). This is because some of the most recent reports have not been written yet, nor reviewed by investigators. Once it is reported by investigators and supervisors, the crime data is reported to the FBI/UCI and is available via the pertinent LASD patrol station, pending publication by the FBI/UCI. Once it is reported by the LASD to the FBI, the FBI/UCI crime data is considered the most accurate.
AGOURA HILLSCALABASASHIDDEN HILLSMALIBUWESTLAKE VILLAGEUNINCORPORATED
AGOURA HILLSCALABASASHIDDEN HILLSMALIBUWESTLAKE VILLAGEUNINCORPORATED
AGOURA HILLSCALABASASHIDDEN HILLSMALIBUWESTLAKE VILLAGEUNINCORPORATED
0 0 0 0 0 0
1 0 0 0 0 3
4 2 0 3 1 3
0 0 0 0 0 0
3 1 0 1 0 7
6 6 0 3 2 7
0 0 0 0 0 0
1 2 0 1 0 0
6 2 1 6 0 0
0 0 0 0 0 0
1 3 0 4 1 2
10 6 2
11 3 2
0 0 0 0 0 0
3 0 0 1 2 0
0 3 0 1 1 0
000000
.430000
1.38
1.72.850
2.191.131.38
000000
.49
.870
.7900
2.95.87
5.394.74
00
000000
1.4800
.792.42
0
01.30
.791.21
0
N/CN/CN/CN/CN/CN/C
244.19N/CN/CN/CN/C-100
-10052.94N/C
-63.937.08-100
N/CN/CN/CN/CN/CN/C
202.04-100N/C
0N/CN/C
-10049.43-100
-83.33N/CN/C
CRIMINAL HOMICIDE
FORCIBLE RAPE
ROBBERY
MALIBU/LOST HILLS YTDReported
YTDCrime Rate
TotalReportedIncidents
YTDReported
YTDCrime Rate
TotalReportedIncidents
YTDReported
YTDCrime Rate
5 YearChange inYTD Crime
Rate
1 YearChange inYTD Crime
Rate
2009 2013 2014
2014/2009 2014/2013
STATION TOTAL
STATION TOTAL
STATION TOTAL
2009 2013
0
4
13
0
4
15
0
6
5
0
12
24
0
11
34
0
.43
1.39
0
.45
1.68
0
.67
.56
N/C
48.89
-66.67
N/C
55.81
-59.71
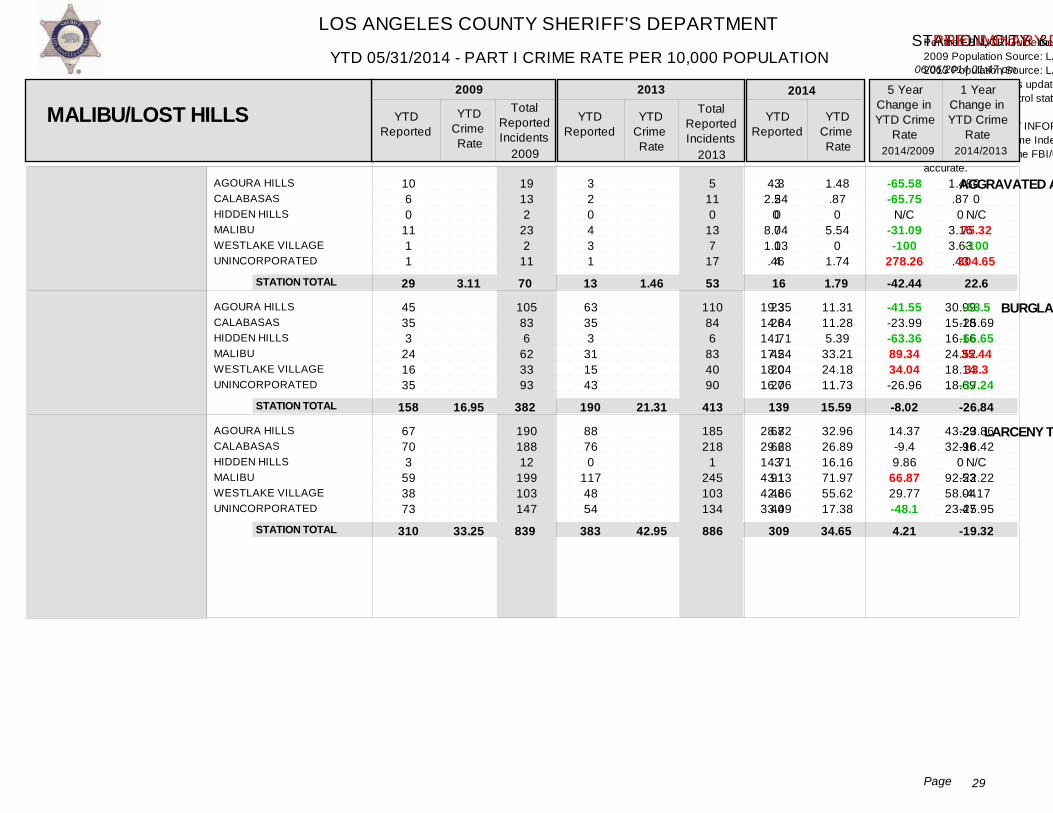
LOS ANGELES COUNTY SHERIFF'S DEPARTMENT
06/06/2014 01:47 pm
STATION, CITY & UNINCORPORATED DETAIL BY STATION & CRIME TYPE
Ver: 10.02.19.2013.0
YTD 05/31/2014 - PART I CRIME RATE PER 10,000 POPULATION
29Page
- PRELIMINARY DATA
Per the FBI UCR Guidelines Homicide, Rape and Aggravated Assault are counted by victim. All other crimes are counted by incident, except Arson which is always counted.2009 Population Source: LA County Internal Services Department (based on the 2000 US Census and CA Department of Finance estimates).2013 Population Source: LA County Internal Services Department (based on the 2010 US Census and CA Department of Finance estimates). 2014 YTD Crime Rates based on 2013 population estimates. 2013 population estimates updated for the city of Santa Clarita and the Santa Clarita Valley Station unincorporated area, due to 2012 year end annexations.Crime counts for patrol station areas only; red depicts +30% increases and green depicts -30% decreases. N/C = Not Calculable
This PRELIMINARY INFORMATION is used on an ongoing basis by the LASD for strategic planning and as a tactical early warning system. This data is not final and thus is not the crime data that is reported to the FBI Uniform Crime Index (UCI). This is because some of the most recent reports have not been written yet, nor reviewed by investigators. Once it is reported by investigators and supervisors, the crime data is reported to the FBI/UCI and is available via the pertinent LASD patrol station, pending publication by the FBI/UCI. Once it is reported by the LASD to the FBI, the FBI/UCI crime data is considered the most accurate.
AGOURA HILLSCALABASASHIDDEN HILLSMALIBUWESTLAKE VILLAGEUNINCORPORATED
AGOURA HILLSCALABASASHIDDEN HILLSMALIBUWESTLAKE VILLAGEUNINCORPORATED
AGOURA HILLSCALABASASHIDDEN HILLSMALIBUWESTLAKE VILLAGEUNINCORPORATED
10 6 0
11 1 1
45 35 3
24 16 35
67 70 3
59 38 73
19 13 2
23 2
11
105 83 6
62 33 93
190 188 12
199 103 147
3 2 0 4 3 1
63 35 3
31 15 43
88 76 0
117 48 54
5 11 0
13 7
17
110 84 6
83 40 90
185 218
1 245 103 134
3 2 0 7 0 4
23 26 1
42 20 27
67 62 3
91 46 40
4.32.54
08.041.13.46
19.3514.8414.7117.5418.0416.06
28.8229.6814.7143.1342.8633.49
1.48.870
3.163.63.43
30.9915.1816.1624.5218.1418.69
43.2932.96
092.5358.0423.47
1.48.870
5.540
1.74
11.3111.285.39
33.2124.1811.73
32.9626.8916.1671.9755.6217.38
-65.58-65.75
N/C-31.09-100
278.26
-41.55-23.99-63.3689.3434.04-26.96
14.37-9.49.86
66.8729.77-48.1
00
N/C75.32-100
304.65
-63.5-25.69-66.6535.4433.3
-37.24
-23.86-18.42
N/C-22.22-4.17
-25.95
AGGRAVATED ASSAULT
BURGLARY
LARCENY THEFT
MALIBU/LOST HILLS YTDReported
YTDCrime Rate
TotalReportedIncidents
YTDReported
YTDCrime Rate
TotalReportedIncidents
YTDReported
YTDCrime Rate
5 YearChange inYTD Crime
Rate
1 YearChange inYTD Crime
Rate
2009 2013 2014
2014/2009 2014/2013
STATION TOTAL
STATION TOTAL
STATION TOTAL
2009 2013
29
158
310
13
190
383
16
139
309
70
382
839
53
413
886
3.11
16.95
33.25
1.46
21.31
42.95
1.79
15.59
34.65
22.6
-26.84
-19.32
-42.44
-8.02
4.21

LOS ANGELES COUNTY SHERIFF'S DEPARTMENT
06/06/2014 01:47 pm
STATION, CITY & UNINCORPORATED DETAIL BY STATION & CRIME TYPE
Ver: 10.02.19.2013.0
YTD 05/31/2014 - PART I CRIME RATE PER 10,000 POPULATION
30Page
- PRELIMINARY DATA
Per the FBI UCR Guidelines Homicide, Rape and Aggravated Assault are counted by victim. All other crimes are counted by incident, except Arson which is always counted.2009 Population Source: LA County Internal Services Department (based on the 2000 US Census and CA Department of Finance estimates).2013 Population Source: LA County Internal Services Department (based on the 2010 US Census and CA Department of Finance estimates). 2014 YTD Crime Rates based on 2013 population estimates. 2013 population estimates updated for the city of Santa Clarita and the Santa Clarita Valley Station unincorporated area, due to 2012 year end annexations.Crime counts for patrol station areas only; red depicts +30% increases and green depicts -30% decreases. N/C = Not Calculable
This PRELIMINARY INFORMATION is used on an ongoing basis by the LASD for strategic planning and as a tactical early warning system. This data is not final and thus is not the crime data that is reported to the FBI Uniform Crime Index (UCI). This is because some of the most recent reports have not been written yet, nor reviewed by investigators. Once it is reported by investigators and supervisors, the crime data is reported to the FBI/UCI and is available via the pertinent LASD patrol station, pending publication by the FBI/UCI. Once it is reported by the LASD to the FBI, the FBI/UCI crime data is considered the most accurate.
AGOURA HILLSCALABASASHIDDEN HILLSMALIBUWESTLAKE VILLAGEUNINCORPORATED
AGOURA HILLSCALABASASHIDDEN HILLSMALIBUWESTLAKE VILLAGEUNINCORPORATED
8 9 0 7 2 5
1 0 0 1 0 0
11 14 1
19 5
15
7 3 0 2 0 2
7 2 0
12 0 4
5 1 0 0 1 0
12 7 0
22 6
12
7 7 0 1 1 0
1 3 0 3 4 7
0 3 0 1 1 2
3.443.82
05.122.262.29
.4300
.7300
3.44.870
9.490
1.74
2.46.4300
1.210
.491.30
2.374.843.04
01.30
.791.21.87
-85.76-65.97
N/C-53.71114.1632.75
-100N/CN/C8.22N/CN/C
-85.7649.43N/C
-75.03N/C
74.71
-100202.33
N/CN/C
0N/C
GRAND THEFT AUTO
ARSON
MALIBU/LOST HILLS YTDReported
YTDCrime Rate
TotalReportedIncidents
YTDReported
YTDCrime Rate
TotalReportedIncidents
YTDReported
YTDCrime Rate
5 YearChange inYTD Crime
Rate
1 YearChange inYTD Crime
Rate
2009 2013 2014
2014/2009 2014/2013
PART I CRIMES TOTAL
STATION TOTAL
STATION TOTAL
AGOURA HILLSCALABASASHIDDEN HILLSMALIBUUNINCORPORATEDWESTLAKE VILLAGE
136 122
6 105 120 58
2009
173 120
4 171 102 67
2013
97 99 4
146 80 74
31
2
25
7
18
7
58.4951.7229.4176.7555.0565.41
341 308 21
309 282 145
65
14
59
16
85.152.0421.55
135.2344.3381.02
330 336
9 379 257 161
3.33
.21
2.8
.79
47.7142.9421.55
115.4634.7789.48
2.02
.79
-18.43-16.98-26.7350.44-36.8436.8
-27.86
0
STATION TOTAL
-43.94-17.49
0-14.62-21.5710.44
547 637
-39.34
276.19
500 1,406 1,472 56.0758.68 71.44 -4.45 -21.51

LOS ANGELES COUNTY SHERIFF'S DEPARTMENT
06/06/2014 01:47 pm
STATION, CITY & UNINCORPORATED DETAIL BY STATION & CRIME TYPE
Ver: 10.02.19.2013.0
YTD 05/31/2014 - PART I CRIME RATE PER 10,000 POPULATION
31Page
- PRELIMINARY DATA
Per the FBI UCR Guidelines Homicide, Rape and Aggravated Assault are counted by victim. All other crimes are counted by incident, except Arson which is always counted.2009 Population Source: LA County Internal Services Department (based on the 2000 US Census and CA Department of Finance estimates).2013 Population Source: LA County Internal Services Department (based on the 2010 US Census and CA Department of Finance estimates). 2014 YTD Crime Rates based on 2013 population estimates. 2013 population estimates updated for the city of Santa Clarita and the Santa Clarita Valley Station unincorporated area, due to 2012 year end annexations.Crime counts for patrol station areas only; red depicts +30% increases and green depicts -30% decreases. N/C = Not Calculable
This PRELIMINARY INFORMATION is used on an ongoing basis by the LASD for strategic planning and as a tactical early warning system. This data is not final and thus is not the crime data that is reported to the FBI Uniform Crime Index (UCI). This is because some of the most recent reports have not been written yet, nor reviewed by investigators. Once it is reported by investigators and supervisors, the crime data is reported to the FBI/UCI and is available via the pertinent LASD patrol station, pending publication by the FBI/UCI. Once it is reported by the LASD to the FBI, the FBI/UCI crime data is considered the most accurate.
UNINCORPORATED
UNINCORPORATED
UNINCORPORATED
UNINCORPORATED
UNINCORPORATED
UNINCORPORATED
UNINCORPORATED
UNINCORPORATED
0
2
23
25
126
193
34
1
0
4
59
55
262
581
86
2
0
2
17
28
106
253
39
1
1
2
46
59
253
572
88
2
0
3
9
21
105
228
27
1
0
.79
9.13
9.92
50
76.58
13.49
.4
0
.75
6.37
10.49
39.71
94.78
14.61
.37
0
1.12
3.37
7.87
39.33
85.41
10.11
.37
N/C
41.77
-63.09
-20.67
-21.34
11.53
-25.06
-7.5
N/C
49.33
-47.1
-24.98
-.96
-9.89
-30.8
0
CRIMINAL HOMICIDE
FORCIBLE RAPE
ROBBERY
AGGRAVATED ASSAULT
BURGLARY
LARCENY THEFT
GRAND THEFT AUTO
ARSON
MARINA DEL REY YTDReported
YTDCrime Rate
TotalReportedIncidents
YTDReported
YTDCrime Rate
TotalReportedIncidents
YTDReported
YTDCrime Rate
5 YearChange inYTD Crime
Rate
1 YearChange inYTD Crime
Rate
2009 2013 2014
2014/2009 2014/2013
PART I CRIMES TOTAL
STATION TOTAL
STATION TOTAL
STATION TOTAL
STATION TOTAL
STATION TOTAL
STATION TOTAL
STATION TOTAL
STATION TOTAL
UNINCORPORATED 404
2009
446
2013
394
0
2
23
25
126
193
34
1
0
2
17
28
106
253
39
1
0
3
9
21
105
228
27
1
160.3 1,049
0
4
59
55
262
581
86
2
1
2
46
59
253
572
88
2
167.08 1,023
0
.79
9.13
9.92
50
76.58
13.49
.4
0
.75
6.37
10.49
39.71
94.78
14.61
.37
147.6
0
1.12
3.37
7.87
39.33
85.41
10.11
.37
-7.92
N/C
49.33
-47.1
-24.98
-.96
-9.89
-30.8
0
STATION TOTAL
-11.66
404 446
N/C
41.77
-63.09
-20.67
-21.34
11.53
-25.06
-7.5
394 1,049 1,023 147.6160.3 167.08 -7.92 -11.66
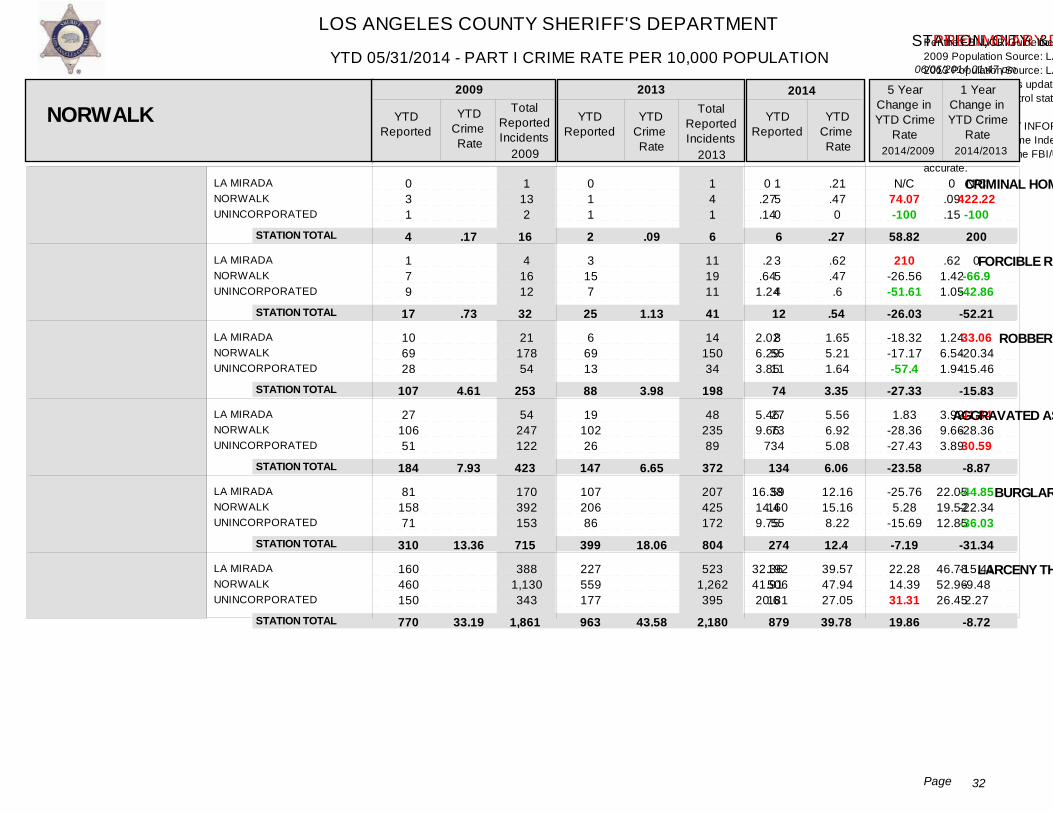
LOS ANGELES COUNTY SHERIFF'S DEPARTMENT
06/06/2014 01:47 pm
STATION, CITY & UNINCORPORATED DETAIL BY STATION & CRIME TYPE
Ver: 10.02.19.2013.0
YTD 05/31/2014 - PART I CRIME RATE PER 10,000 POPULATION
32Page
- PRELIMINARY DATA
Per the FBI UCR Guidelines Homicide, Rape and Aggravated Assault are counted by victim. All other crimes are counted by incident, except Arson which is always counted.2009 Population Source: LA County Internal Services Department (based on the 2000 US Census and CA Department of Finance estimates).2013 Population Source: LA County Internal Services Department (based on the 2010 US Census and CA Department of Finance estimates). 2014 YTD Crime Rates based on 2013 population estimates. 2013 population estimates updated for the city of Santa Clarita and the Santa Clarita Valley Station unincorporated area, due to 2012 year end annexations.Crime counts for patrol station areas only; red depicts +30% increases and green depicts -30% decreases. N/C = Not Calculable
This PRELIMINARY INFORMATION is used on an ongoing basis by the LASD for strategic planning and as a tactical early warning system. This data is not final and thus is not the crime data that is reported to the FBI Uniform Crime Index (UCI). This is because some of the most recent reports have not been written yet, nor reviewed by investigators. Once it is reported by investigators and supervisors, the crime data is reported to the FBI/UCI and is available via the pertinent LASD patrol station, pending publication by the FBI/UCI. Once it is reported by the LASD to the FBI, the FBI/UCI crime data is considered the most accurate.
LA MIRADANORWALKUNINCORPORATED
LA MIRADANORWALKUNINCORPORATED
LA MIRADANORWALKUNINCORPORATED
LA MIRADANORWALKUNINCORPORATED
LA MIRADANORWALKUNINCORPORATED
LA MIRADANORWALKUNINCORPORATED
0 3 1
1 7 9
10 69 28
27 106 51
81 158 71
160 460 150
1 13 2
4 16 12
21 178 54
54 247 122
170 392 153
388 1,130 343
0 1 1
3 15 7
6 69 13
19 102 26
107 206 86
227 559 177
1 4 1
11 19 11
14 150 34
48 235 89
207 425 172
523 1,262 395
1 5 0
3 5 4
8 55 11
27 73 34
59 160 55
192 506 181
0.27.14
.2.64
1.24
2.026.293.85
5.469.66
7
16.3814.49.75
32.3641.9120.6
0.09.15
.621.421.05
1.246.541.94
3.929.663.89
22.0519.5212.85
46.7852.9626.45
.21
.470
.62
.47.6
1.655.211.64
5.566.925.08
12.1615.168.22
39.5747.9427.05
N/C74.07-100
210-26.56-51.61
-18.32-17.17-57.4
1.83-28.36-27.43
-25.765.28
-15.69
22.2814.3931.31
N/C422.22
-100
0-66.9
-42.86
33.06-20.34-15.46
41.84-28.3630.59
-44.85-22.34-36.03
-15.41-9.482.27
CRIMINAL HOMICIDE
FORCIBLE RAPE
ROBBERY
AGGRAVATED ASSAULT
BURGLARY
LARCENY THEFT
NORWALK YTDReported
YTDCrime Rate
TotalReportedIncidents
YTDReported
YTDCrime Rate
TotalReportedIncidents
YTDReported
YTDCrime Rate
5 YearChange inYTD Crime
Rate
1 YearChange inYTD Crime
Rate
2009 2013 2014
2014/2009 2014/2013
STATION TOTAL
STATION TOTAL
STATION TOTAL
STATION TOTAL
STATION TOTAL
STATION TOTAL
2009 2013
4
17
107
184
310
770
2
25
88
147
399
963
6
12
74
134
274
879
16
32
253
423
715
1,861
6
41
198
372
804
2,180
.17
.73
4.61
7.93
13.36
33.19
.09
1.13
3.98
6.65
18.06
43.58
.27
.54
3.35
6.06
12.4
39.78
200
-52.21
-15.83
-8.87
-31.34
-8.72
58.82
-26.03
-27.33
-23.58
-7.19
19.86
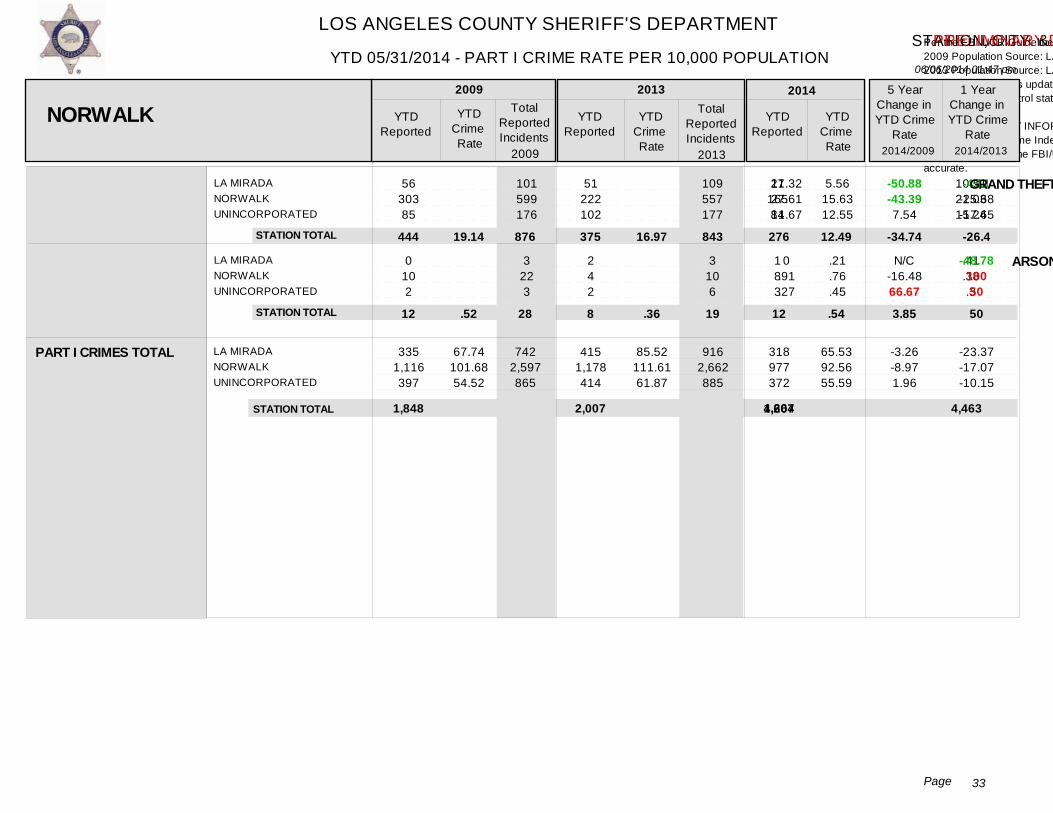
LOS ANGELES COUNTY SHERIFF'S DEPARTMENT
06/06/2014 01:47 pm
STATION, CITY & UNINCORPORATED DETAIL BY STATION & CRIME TYPE
Ver: 10.02.19.2013.0
YTD 05/31/2014 - PART I CRIME RATE PER 10,000 POPULATION
33Page
- PRELIMINARY DATA
Per the FBI UCR Guidelines Homicide, Rape and Aggravated Assault are counted by victim. All other crimes are counted by incident, except Arson which is always counted.2009 Population Source: LA County Internal Services Department (based on the 2000 US Census and CA Department of Finance estimates).2013 Population Source: LA County Internal Services Department (based on the 2010 US Census and CA Department of Finance estimates). 2014 YTD Crime Rates based on 2013 population estimates. 2013 population estimates updated for the city of Santa Clarita and the Santa Clarita Valley Station unincorporated area, due to 2012 year end annexations.Crime counts for patrol station areas only; red depicts +30% increases and green depicts -30% decreases. N/C = Not Calculable
This PRELIMINARY INFORMATION is used on an ongoing basis by the LASD for strategic planning and as a tactical early warning system. This data is not final and thus is not the crime data that is reported to the FBI Uniform Crime Index (UCI). This is because some of the most recent reports have not been written yet, nor reviewed by investigators. Once it is reported by investigators and supervisors, the crime data is reported to the FBI/UCI and is available via the pertinent LASD patrol station, pending publication by the FBI/UCI. Once it is reported by the LASD to the FBI, the FBI/UCI crime data is considered the most accurate.
LA MIRADANORWALKUNINCORPORATED
LA MIRADANORWALKUNINCORPORATED
56 303 85
0 10 2
101 599 176
3 22 3
51 222 102
2 4 2
109 557 177
3 10 6
27 165 84
1 8 3
11.3227.6111.67
0.91.27
10.5121.0315.24
.41
.38.3
5.5615.6312.55
.21
.76
.45
-50.88-43.397.54
N/C-16.4866.67
-47.1-25.68-17.65
-48.7810050
GRAND THEFT AUTO
ARSON
NORWALK YTDReported
YTDCrime Rate
TotalReportedIncidents
YTDReported
YTDCrime Rate
TotalReportedIncidents
YTDReported
YTDCrime Rate
5 YearChange inYTD Crime
Rate
1 YearChange inYTD Crime
Rate
2009 2013 2014
2014/2009 2014/2013
PART I CRIMES TOTAL
STATION TOTAL
STATION TOTAL
LA MIRADANORWALKUNINCORPORATED
335 1,116 397
2009
415 1,178 414
2013
318 977 372
444
12
375
8
276
12
67.74101.6854.52
742 2,597 865
876
28
843
19
85.52111.6161.87
916 2,662 885
19.14
.52
16.97
.36
65.5392.5655.59
12.49
.54
-3.26-8.971.96
-26.4
50
STATION TOTAL
-23.37-17.07-10.15
1,848 2,007
-34.74
3.85
1,667 4,204 4,463 75.4379.65 90.82 -5.3 -16.95

LOS ANGELES COUNTY SHERIFF'S DEPARTMENT
06/06/2014 01:47 pm
STATION, CITY & UNINCORPORATED DETAIL BY STATION & CRIME TYPE
Ver: 10.02.19.2013.0
YTD 05/31/2014 - PART I CRIME RATE PER 10,000 POPULATION
34Page
- PRELIMINARY DATA
Per the FBI UCR Guidelines Homicide, Rape and Aggravated Assault are counted by victim. All other crimes are counted by incident, except Arson which is always counted.2009 Population Source: LA County Internal Services Department (based on the 2000 US Census and CA Department of Finance estimates).2013 Population Source: LA County Internal Services Department (based on the 2010 US Census and CA Department of Finance estimates). 2014 YTD Crime Rates based on 2013 population estimates. 2013 population estimates updated for the city of Santa Clarita and the Santa Clarita Valley Station unincorporated area, due to 2012 year end annexations.Crime counts for patrol station areas only; red depicts +30% increases and green depicts -30% decreases. N/C = Not Calculable
This PRELIMINARY INFORMATION is used on an ongoing basis by the LASD for strategic planning and as a tactical early warning system. This data is not final and thus is not the crime data that is reported to the FBI Uniform Crime Index (UCI). This is because some of the most recent reports have not been written yet, nor reviewed by investigators. Once it is reported by investigators and supervisors, the crime data is reported to the FBI/UCI and is available via the pertinent LASD patrol station, pending publication by the FBI/UCI. Once it is reported by the LASD to the FBI, the FBI/UCI crime data is considered the most accurate.
PALMDALEUNINCORPORATED
PALMDALEUNINCORPORATED
PALMDALEUNINCORPORATED
PALMDALEUNINCORPORATED
PALMDALEUNINCORPORATED
PALMDALEUNINCORPORATED
PALMDALEUNINCORPORATED
1 0
13 6
107 16
205 46
473 86
828 126
211 48
9 2
42 8
262 24
504 98
1,066 218
2,000 271
445 89
3 3
10 2
98 8
175 34
502 77
779 126
160 14
9 4
28 6
255 17
477 102
1,063 166
1,962 241
385 50
5 0
10 4
96 2
212 37
292 58
813 94
138 24
.070
.912.01
7.475.36
14.3115.42
33.0228.83
57.842.24
14.7316.09
.2.68
.65
.45
6.421.82
11.467.72
32.8617.48
5128.6
10.473.18
.330
.65
.91
6.28.45
13.888.4
19.1213.17
53.2221.34
9.035.45
371.43N/C
-28.57-54.73
-15.93-91.6
-3-45.53
-42.1-54.32
-7.92-49.48
-38.7-66.13
65-100
0102.22
-2.18-75.27
21.128.81
-41.81-24.66
4.35-25.38
-13.7571.38
CRIMINAL HOMICIDE
FORCIBLE RAPE
ROBBERY
AGGRAVATED ASSAULT
BURGLARY
LARCENY THEFT
GRAND THEFT AUTO
PALMDALE YTDReported
YTDCrime Rate
TotalReportedIncidents
YTDReported
YTDCrime Rate
TotalReportedIncidents
YTDReported
YTDCrime Rate
5 YearChange inYTD Crime
Rate
1 YearChange inYTD Crime
Rate
2009 2013 2014
2014/2009 2014/2013
STATION TOTAL
STATION TOTAL
STATION TOTAL
STATION TOTAL
STATION TOTAL
STATION TOTAL
STATION TOTAL
2009 2013
1
19
123
251
559
954
259
6
12
106
209
579
905
174
5
14
98
249
350
907
162
11
50
286
602
1,284
2,271
534
13
34
272
579
1,229
2,203
435
.06
1.1
7.11
14.5
32.29
55.12
14.96
.3
.61
5.39
10.62
29.42
45.99
8.84
.25
.71
4.98
12.65
17.78
46.09
8.23
-16.67
16.39
-7.61
19.11
-39.56
.22
-6.9
316.67
-35.45
-29.96
-12.76
-44.94
-16.38
-44.99

LOS ANGELES COUNTY SHERIFF'S DEPARTMENT
06/06/2014 01:47 pm
STATION, CITY & UNINCORPORATED DETAIL BY STATION & CRIME TYPE
Ver: 10.02.19.2013.0
YTD 05/31/2014 - PART I CRIME RATE PER 10,000 POPULATION
35Page
- PRELIMINARY DATA
Per the FBI UCR Guidelines Homicide, Rape and Aggravated Assault are counted by victim. All other crimes are counted by incident, except Arson which is always counted.2009 Population Source: LA County Internal Services Department (based on the 2000 US Census and CA Department of Finance estimates).2013 Population Source: LA County Internal Services Department (based on the 2010 US Census and CA Department of Finance estimates). 2014 YTD Crime Rates based on 2013 population estimates. 2013 population estimates updated for the city of Santa Clarita and the Santa Clarita Valley Station unincorporated area, due to 2012 year end annexations.Crime counts for patrol station areas only; red depicts +30% increases and green depicts -30% decreases. N/C = Not Calculable
This PRELIMINARY INFORMATION is used on an ongoing basis by the LASD for strategic planning and as a tactical early warning system. This data is not final and thus is not the crime data that is reported to the FBI Uniform Crime Index (UCI). This is because some of the most recent reports have not been written yet, nor reviewed by investigators. Once it is reported by investigators and supervisors, the crime data is reported to the FBI/UCI and is available via the pertinent LASD patrol station, pending publication by the FBI/UCI. Once it is reported by the LASD to the FBI, the FBI/UCI crime data is considered the most accurate.
PALMDALEUNINCORPORATED
13 15
28 23
11 11
31 16
10 6
.915.03
.722.5
.651.36
-28.57-72.96
-9.72-45.6
ARSON
PALMDALE YTDReported
YTDCrime Rate
TotalReportedIncidents
YTDReported
YTDCrime Rate
TotalReportedIncidents
YTDReported
YTDCrime Rate
5 YearChange inYTD Crime
Rate
1 YearChange inYTD Crime
Rate
2009 2013 2014
2014/2009 2014/2013
PART I CRIMES TOTAL
STATION TOTAL
PALMDALEUNINCORPORATED
1,851 343
2009
1,738 275
2013
1,576 225
28 22 16
129.21114.98
4,356 733
51 47
113.7862.43
4,210 602
1.62 1.12
103.1851.08
.81
-20.15-55.57
-27.68
STATION TOTAL
-9.32-18.18
2,194 2,013
-50
1,801 5,089 4,812 91.51126.75 102.29 -27.8 -10.54

LOS ANGELES COUNTY SHERIFF'S DEPARTMENT
06/06/2014 01:47 pm
STATION, CITY & UNINCORPORATED DETAIL BY STATION & CRIME TYPE
Ver: 10.02.19.2013.0
YTD 05/31/2014 - PART I CRIME RATE PER 10,000 POPULATION
36Page
- PRELIMINARY DATA
Per the FBI UCR Guidelines Homicide, Rape and Aggravated Assault are counted by victim. All other crimes are counted by incident, except Arson which is always counted.2009 Population Source: LA County Internal Services Department (based on the 2000 US Census and CA Department of Finance estimates).2013 Population Source: LA County Internal Services Department (based on the 2010 US Census and CA Department of Finance estimates). 2014 YTD Crime Rates based on 2013 population estimates. 2013 population estimates updated for the city of Santa Clarita and the Santa Clarita Valley Station unincorporated area, due to 2012 year end annexations.Crime counts for patrol station areas only; red depicts +30% increases and green depicts -30% decreases. N/C = Not Calculable
This PRELIMINARY INFORMATION is used on an ongoing basis by the LASD for strategic planning and as a tactical early warning system. This data is not final and thus is not the crime data that is reported to the FBI Uniform Crime Index (UCI). This is because some of the most recent reports have not been written yet, nor reviewed by investigators. Once it is reported by investigators and supervisors, the crime data is reported to the FBI/UCI and is available via the pertinent LASD patrol station, pending publication by the FBI/UCI. Once it is reported by the LASD to the FBI, the FBI/UCI crime data is considered the most accurate.
PICO RIVERAUNINCORPORATED
PICO RIVERAUNINCORPORATED
PICO RIVERAUNINCORPORATED
PICO RIVERAUNINCORPORATED
PICO RIVERAUNINCORPORATED
PICO RIVERAUNINCORPORATED
PICO RIVERAUNINCORPORATED
0 1
3 1
33 11
42 40
98 43
336 127
157 64
6 2
15 3
79 23
106 86
192 102
819 308
345 147
0 0
4 1
24 8
57 37
95 35
399 123
145 47
3 1
8 2
65 20
140 78
268 113
928 261
336 99
2 0
3 2
28 10
75 18
139 43
309 100
129 42
0.28
.45
.28
4.923.13
6.2711.38
14.6212.23
50.1336.12
23.4218.2
00
.64
.33
3.812.6
9.0612.03
15.0911.38
63.3940
23.0415.29
.320
.48
.65
4.453.25
11.925.85
22.0813.99
49.0932.52
20.513.66
N/C-100
6.67132.14
-9.553.83
90.11-48.59
51.0314.39
-2.07-9.97
-12.47-24.95
N/CN/C
-2596.97
16.825
31.57-51.37
46.3222.93
-22.56-18.7
-11.02-10.66
CRIMINAL HOMICIDE
FORCIBLE RAPE
ROBBERY
AGGRAVATED ASSAULT
BURGLARY
LARCENY THEFT
GRAND THEFT AUTO
PICO RIVERA YTDReported
YTDCrime Rate
TotalReportedIncidents
YTDReported
YTDCrime Rate
TotalReportedIncidents
YTDReported
YTDCrime Rate
5 YearChange inYTD Crime
Rate
1 YearChange inYTD Crime
Rate
2009 2013 2014
2014/2009 2014/2013
STATION TOTAL
STATION TOTAL
STATION TOTAL
STATION TOTAL
STATION TOTAL
STATION TOTAL
STATION TOTAL
2009 2013
1
4
44
82
141
463
221
0
5
32
94
130
522
192
2
5
38
93
182
409
171
8
18
102
192
294
1,127
492
4
10
85
218
381
1,189
435
.1
.39
4.31
8.02
13.8
45.31
21.63
0
.53
3.42
10.03
13.88
55.72
20.49
.21
.53
4.06
9.93
19.43
43.66
18.25
N/C
0
18.71
-1
39.99
-21.64
-10.93
110
35.9
-5.8
23.82
40.8
-3.64
-15.63

LOS ANGELES COUNTY SHERIFF'S DEPARTMENT
06/06/2014 01:47 pm
STATION, CITY & UNINCORPORATED DETAIL BY STATION & CRIME TYPE
Ver: 10.02.19.2013.0
YTD 05/31/2014 - PART I CRIME RATE PER 10,000 POPULATION
37Page
- PRELIMINARY DATA
Per the FBI UCR Guidelines Homicide, Rape and Aggravated Assault are counted by victim. All other crimes are counted by incident, except Arson which is always counted.2009 Population Source: LA County Internal Services Department (based on the 2000 US Census and CA Department of Finance estimates).2013 Population Source: LA County Internal Services Department (based on the 2010 US Census and CA Department of Finance estimates). 2014 YTD Crime Rates based on 2013 population estimates. 2013 population estimates updated for the city of Santa Clarita and the Santa Clarita Valley Station unincorporated area, due to 2012 year end annexations.Crime counts for patrol station areas only; red depicts +30% increases and green depicts -30% decreases. N/C = Not Calculable
This PRELIMINARY INFORMATION is used on an ongoing basis by the LASD for strategic planning and as a tactical early warning system. This data is not final and thus is not the crime data that is reported to the FBI Uniform Crime Index (UCI). This is because some of the most recent reports have not been written yet, nor reviewed by investigators. Once it is reported by investigators and supervisors, the crime data is reported to the FBI/UCI and is available via the pertinent LASD patrol station, pending publication by the FBI/UCI. Once it is reported by the LASD to the FBI, the FBI/UCI crime data is considered the most accurate.
PICO RIVERAUNINCORPORATED
4 1
6 1
4 1
12 4
2 0
.6.28
.64
.33.320
-46.67-100
-50-100
ARSON
PICO RIVERA YTDReported
YTDCrime Rate
TotalReportedIncidents
YTDReported
YTDCrime Rate
TotalReportedIncidents
YTDReported
YTDCrime Rate
5 YearChange inYTD Crime
Rate
1 YearChange inYTD Crime
Rate
2009 2013 2014
2014/2009 2014/2013
PART I CRIMES TOTAL
STATION TOTAL
PICO RIVERAUNINCORPORATED
673 288
2009
728 252
2013
687 215
5 5 2
100.4181.9
1,568 672
7 16
115.6681.96
1,760 578
.49 .53
109.1569.93
.21
8.7-14.62
-60.38
STATION TOTAL
-5.63-14.68
961 980
-57.14
902 2,240 2,338 96.2894.04 104.6 2.38 -7.95
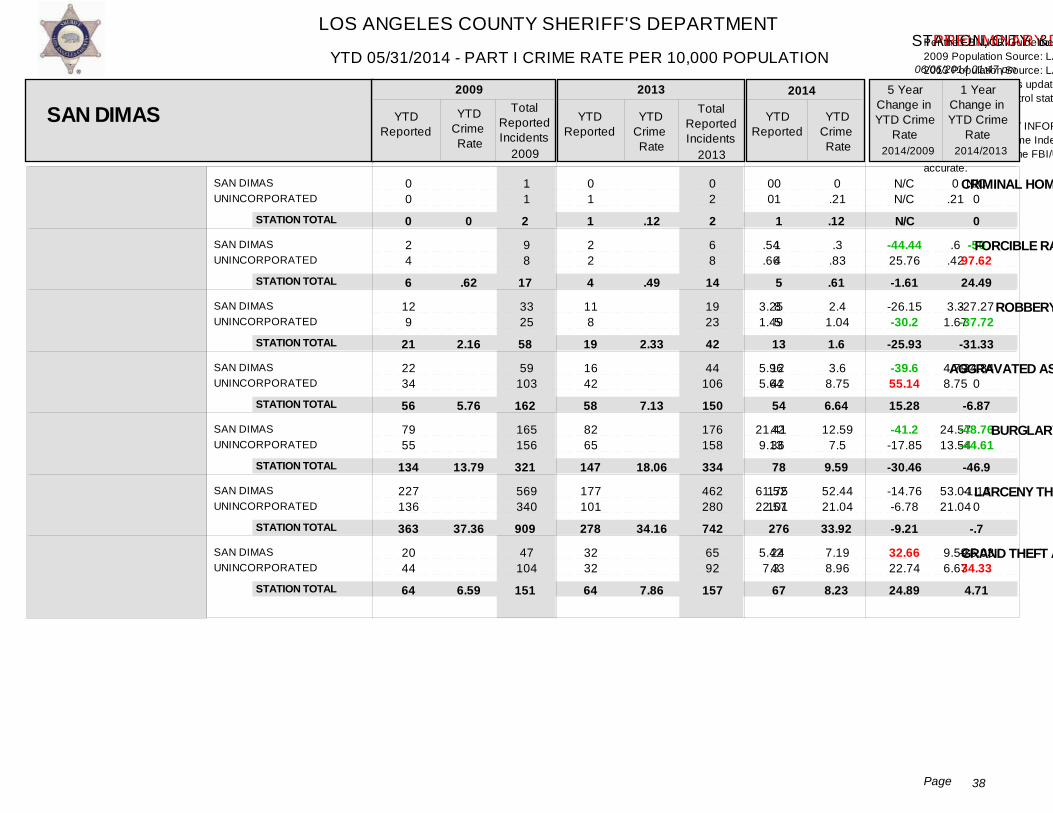
LOS ANGELES COUNTY SHERIFF'S DEPARTMENT
06/06/2014 01:47 pm
STATION, CITY & UNINCORPORATED DETAIL BY STATION & CRIME TYPE
Ver: 10.02.19.2013.0
YTD 05/31/2014 - PART I CRIME RATE PER 10,000 POPULATION
38Page
- PRELIMINARY DATA
Per the FBI UCR Guidelines Homicide, Rape and Aggravated Assault are counted by victim. All other crimes are counted by incident, except Arson which is always counted.2009 Population Source: LA County Internal Services Department (based on the 2000 US Census and CA Department of Finance estimates).2013 Population Source: LA County Internal Services Department (based on the 2010 US Census and CA Department of Finance estimates). 2014 YTD Crime Rates based on 2013 population estimates. 2013 population estimates updated for the city of Santa Clarita and the Santa Clarita Valley Station unincorporated area, due to 2012 year end annexations.Crime counts for patrol station areas only; red depicts +30% increases and green depicts -30% decreases. N/C = Not Calculable
This PRELIMINARY INFORMATION is used on an ongoing basis by the LASD for strategic planning and as a tactical early warning system. This data is not final and thus is not the crime data that is reported to the FBI Uniform Crime Index (UCI). This is because some of the most recent reports have not been written yet, nor reviewed by investigators. Once it is reported by investigators and supervisors, the crime data is reported to the FBI/UCI and is available via the pertinent LASD patrol station, pending publication by the FBI/UCI. Once it is reported by the LASD to the FBI, the FBI/UCI crime data is considered the most accurate.
SAN DIMASUNINCORPORATED
SAN DIMASUNINCORPORATED
SAN DIMASUNINCORPORATED
SAN DIMASUNINCORPORATED
SAN DIMASUNINCORPORATED
SAN DIMASUNINCORPORATED
SAN DIMASUNINCORPORATED
0 0
2 4
12 9
22 34
79 55
227 136
20 44
1 1
9 8
33 25
59 103
165 156
569 340
47 104
0 1
2 2
11 8
16 42
82 65
177 101
32 32
0 2
6 8
19 23
44 106
176 158
462 280
65 92
0 1
1 4
8 5
12 42
42 36
175 101
24 43
00
.54
.66
3.251.49
5.965.64
21.419.13
61.5222.57
5.427.3
0.21
.6.42
3.31.67
4.798.75
24.5713.54
53.0421.04
9.596.67
0.21
.3.83
2.41.04
3.68.75
12.597.5
52.4421.04
7.198.96
N/CN/C
-44.4425.76
-26.15-30.2
-39.655.14
-41.2-17.85
-14.76-6.78
32.6622.74
N/C0
-5097.62
-27.27-37.72
-24.840
-48.76-44.61
-1.130
-25.0334.33
CRIMINAL HOMICIDE
FORCIBLE RAPE
ROBBERY
AGGRAVATED ASSAULT
BURGLARY
LARCENY THEFT
GRAND THEFT AUTO
SAN DIMAS YTDReported
YTDCrime Rate
TotalReportedIncidents
YTDReported
YTDCrime Rate
TotalReportedIncidents
YTDReported
YTDCrime Rate
5 YearChange inYTD Crime
Rate
1 YearChange inYTD Crime
Rate
2009 2013 2014
2014/2009 2014/2013
STATION TOTAL
STATION TOTAL
STATION TOTAL
STATION TOTAL
STATION TOTAL
STATION TOTAL
STATION TOTAL
2009 2013
0
6
21
56
134
363
64
1
4
19
58
147
278
64
1
5
13
54
78
276
67
2
17
58
162
321
909
151
2
14
42
150
334
742
157
0
.62
2.16
5.76
13.79
37.36
6.59
.12
.49
2.33
7.13
18.06
34.16
7.86
.12
.61
1.6
6.64
9.59
33.92
8.23
0
24.49
-31.33
-6.87
-46.9
-.7
4.71
N/C
-1.61
-25.93
15.28
-30.46
-9.21
24.89
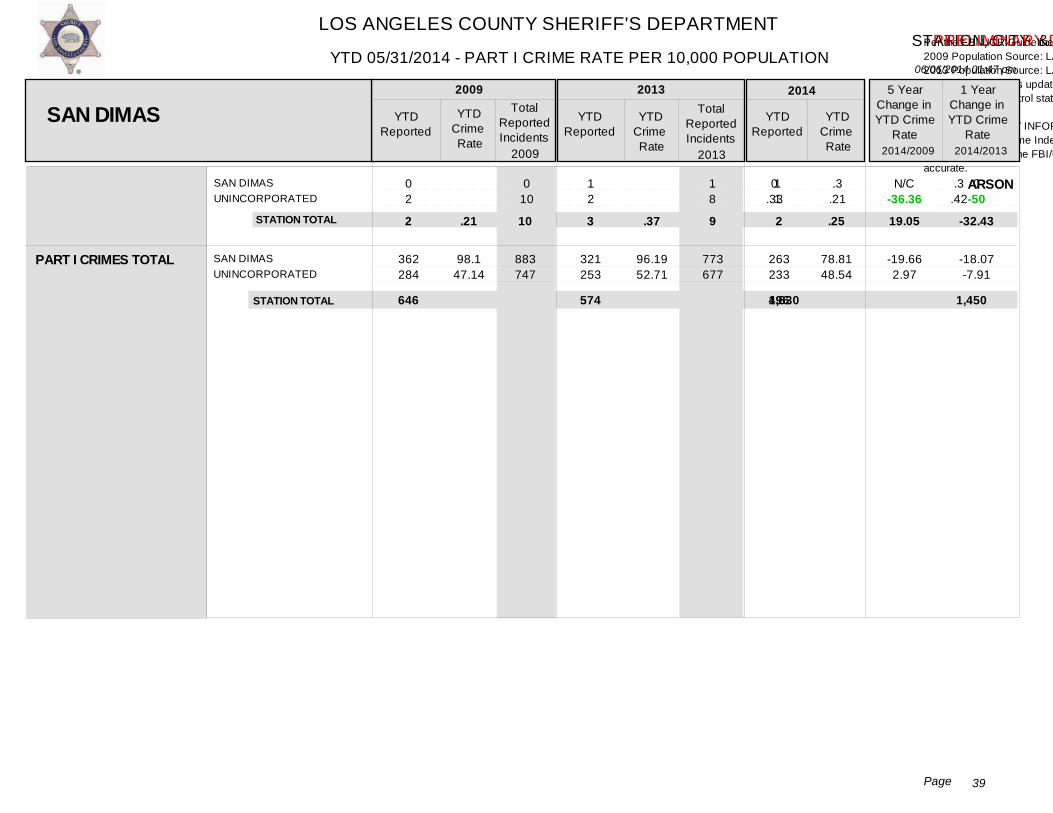
LOS ANGELES COUNTY SHERIFF'S DEPARTMENT
06/06/2014 01:47 pm
STATION, CITY & UNINCORPORATED DETAIL BY STATION & CRIME TYPE
Ver: 10.02.19.2013.0
YTD 05/31/2014 - PART I CRIME RATE PER 10,000 POPULATION
39Page
- PRELIMINARY DATA
Per the FBI UCR Guidelines Homicide, Rape and Aggravated Assault are counted by victim. All other crimes are counted by incident, except Arson which is always counted.2009 Population Source: LA County Internal Services Department (based on the 2000 US Census and CA Department of Finance estimates).2013 Population Source: LA County Internal Services Department (based on the 2010 US Census and CA Department of Finance estimates). 2014 YTD Crime Rates based on 2013 population estimates. 2013 population estimates updated for the city of Santa Clarita and the Santa Clarita Valley Station unincorporated area, due to 2012 year end annexations.Crime counts for patrol station areas only; red depicts +30% increases and green depicts -30% decreases. N/C = Not Calculable
This PRELIMINARY INFORMATION is used on an ongoing basis by the LASD for strategic planning and as a tactical early warning system. This data is not final and thus is not the crime data that is reported to the FBI Uniform Crime Index (UCI). This is because some of the most recent reports have not been written yet, nor reviewed by investigators. Once it is reported by investigators and supervisors, the crime data is reported to the FBI/UCI and is available via the pertinent LASD patrol station, pending publication by the FBI/UCI. Once it is reported by the LASD to the FBI, the FBI/UCI crime data is considered the most accurate.
SAN DIMASUNINCORPORATED
0 2
0 10
1 2
1 8
1 1
0.33
.3.42
.3.21
N/C-36.36
0-50
ARSON
SAN DIMAS YTDReported
YTDCrime Rate
TotalReportedIncidents
YTDReported
YTDCrime Rate
TotalReportedIncidents
YTDReported
YTDCrime Rate
5 YearChange inYTD Crime
Rate
1 YearChange inYTD Crime
Rate
2009 2013 2014
2014/2009 2014/2013
PART I CRIMES TOTAL
STATION TOTAL
SAN DIMASUNINCORPORATED
362 284
2009
321 253
2013
263 233
2 3 2
98.147.14
883 747
10 9
96.1952.71
773 677
.21 .37
78.8148.54
.25
-19.662.97
-32.43
STATION TOTAL
-18.07-7.91
646 574
19.05
496 1,630 1,450 60.9566.5 70.54 -8.35 -13.6
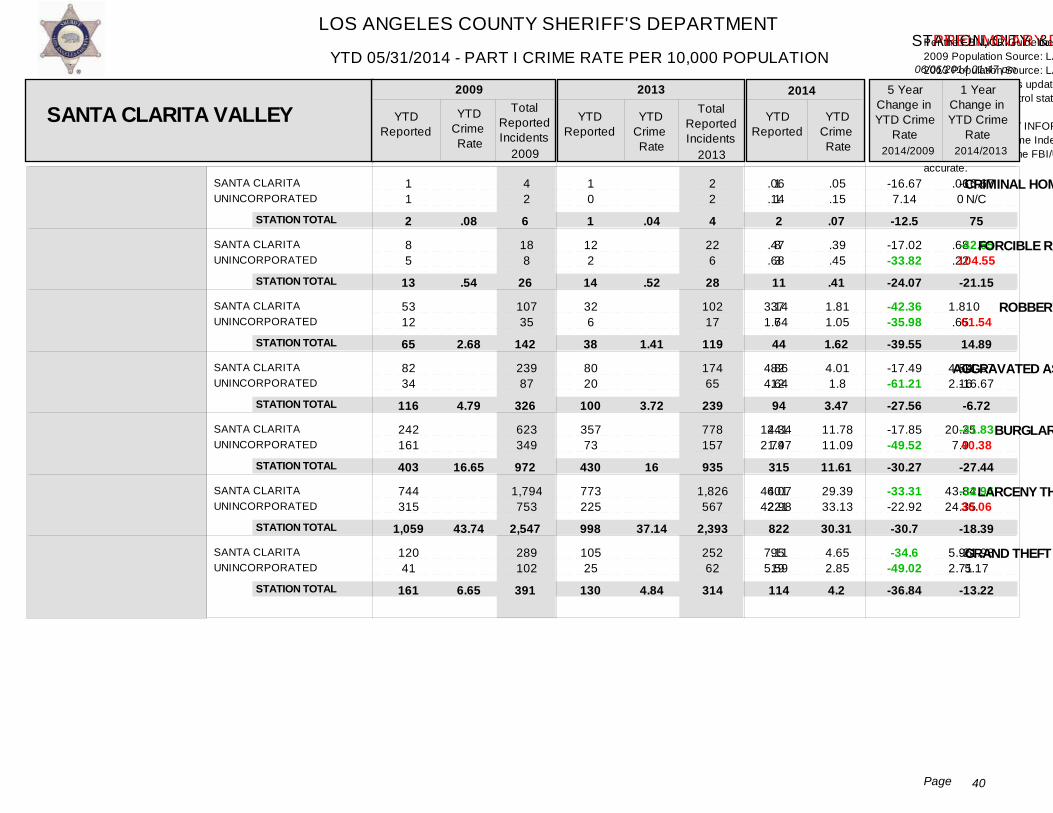
LOS ANGELES COUNTY SHERIFF'S DEPARTMENT
06/06/2014 01:47 pm
STATION, CITY & UNINCORPORATED DETAIL BY STATION & CRIME TYPE
Ver: 10.02.19.2013.0
YTD 05/31/2014 - PART I CRIME RATE PER 10,000 POPULATION
40Page
- PRELIMINARY DATA
Per the FBI UCR Guidelines Homicide, Rape and Aggravated Assault are counted by victim. All other crimes are counted by incident, except Arson which is always counted.2009 Population Source: LA County Internal Services Department (based on the 2000 US Census and CA Department of Finance estimates).2013 Population Source: LA County Internal Services Department (based on the 2010 US Census and CA Department of Finance estimates). 2014 YTD Crime Rates based on 2013 population estimates. 2013 population estimates updated for the city of Santa Clarita and the Santa Clarita Valley Station unincorporated area, due to 2012 year end annexations.Crime counts for patrol station areas only; red depicts +30% increases and green depicts -30% decreases. N/C = Not Calculable
This PRELIMINARY INFORMATION is used on an ongoing basis by the LASD for strategic planning and as a tactical early warning system. This data is not final and thus is not the crime data that is reported to the FBI Uniform Crime Index (UCI). This is because some of the most recent reports have not been written yet, nor reviewed by investigators. Once it is reported by investigators and supervisors, the crime data is reported to the FBI/UCI and is available via the pertinent LASD patrol station, pending publication by the FBI/UCI. Once it is reported by the LASD to the FBI, the FBI/UCI crime data is considered the most accurate.
SANTA CLARITAUNINCORPORATED
SANTA CLARITAUNINCORPORATED
SANTA CLARITAUNINCORPORATED
SANTA CLARITAUNINCORPORATED
SANTA CLARITAUNINCORPORATED
SANTA CLARITAUNINCORPORATED
SANTA CLARITAUNINCORPORATED
1 1
8 5
53 12
82 34
242 161
744 315
120 41
4 2
18 8
107 35
239 87
623 349
1,794 753
289 102
1 0
12 2
32 6
80 20
357 73
773 225
105 25
2 2
22 6
102 17
174 65
778 157
1,826 567
252 62
1 1
8 3
37 7
82 12
241 74
601 221
95 19
.06
.14
.47
.68
3.141.64
4.864.64
14.3421.97
44.0742.98
7.115.59
.060
.68
.22
1.81.65
4.542.16
20.257.9
43.8424.35
5.962.71
.05
.15
.39
.45
1.811.05
4.011.8
11.7811.09
29.3933.13
4.652.85
-16.677.14
-17.02-33.82
-42.36-35.98
-17.49-61.21
-17.85-49.52
-33.31-22.92
-34.6-49.02
-16.67N/C
-42.65104.55
061.54
-11.67-16.67
-41.8340.38
-32.9636.06
-21.985.17
CRIMINAL HOMICIDE
FORCIBLE RAPE
ROBBERY
AGGRAVATED ASSAULT
BURGLARY
LARCENY THEFT
GRAND THEFT AUTO
SANTA CLARITA VALLEY YTDReported
YTDCrime Rate
TotalReportedIncidents
YTDReported
YTDCrime Rate
TotalReportedIncidents
YTDReported
YTDCrime Rate
5 YearChange inYTD Crime
Rate
1 YearChange inYTD Crime
Rate
2009 2013 2014
2014/2009 2014/2013
STATION TOTAL
STATION TOTAL
STATION TOTAL
STATION TOTAL
STATION TOTAL
STATION TOTAL
STATION TOTAL
2009 2013
2
13
65
116
403
1,059
161
1
14
38
100
430
998
130
2
11
44
94
315
822
114
6
26
142
326
972
2,547
391
4
28
119
239
935
2,393
314
.08
.54
2.68
4.79
16.65
43.74
6.65
.04
.52
1.41
3.72
16
37.14
4.84
.07
.41
1.62
3.47
11.61
30.31
4.2
75
-21.15
14.89
-6.72
-27.44
-18.39
-13.22
-12.5
-24.07
-39.55
-27.56
-30.27
-30.7
-36.84
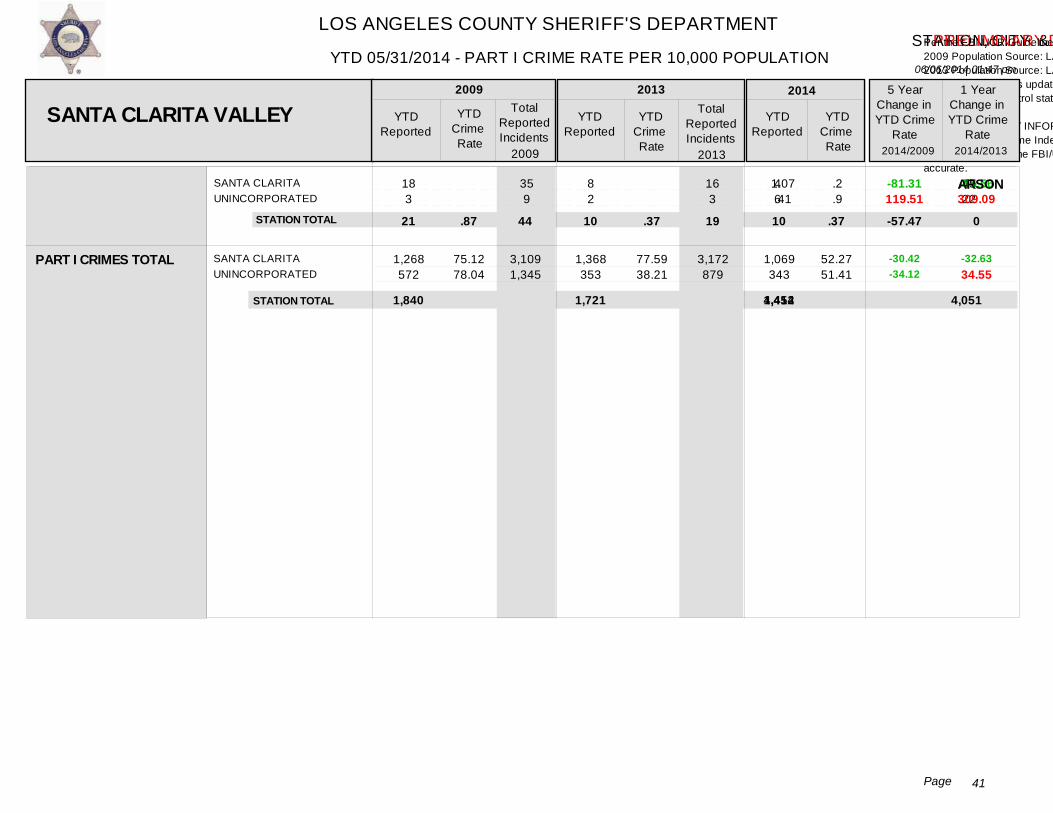
LOS ANGELES COUNTY SHERIFF'S DEPARTMENT
06/06/2014 01:47 pm
STATION, CITY & UNINCORPORATED DETAIL BY STATION & CRIME TYPE
Ver: 10.02.19.2013.0
YTD 05/31/2014 - PART I CRIME RATE PER 10,000 POPULATION
41Page
- PRELIMINARY DATA
Per the FBI UCR Guidelines Homicide, Rape and Aggravated Assault are counted by victim. All other crimes are counted by incident, except Arson which is always counted.2009 Population Source: LA County Internal Services Department (based on the 2000 US Census and CA Department of Finance estimates).2013 Population Source: LA County Internal Services Department (based on the 2010 US Census and CA Department of Finance estimates). 2014 YTD Crime Rates based on 2013 population estimates. 2013 population estimates updated for the city of Santa Clarita and the Santa Clarita Valley Station unincorporated area, due to 2012 year end annexations.Crime counts for patrol station areas only; red depicts +30% increases and green depicts -30% decreases. N/C = Not Calculable
This PRELIMINARY INFORMATION is used on an ongoing basis by the LASD for strategic planning and as a tactical early warning system. This data is not final and thus is not the crime data that is reported to the FBI Uniform Crime Index (UCI). This is because some of the most recent reports have not been written yet, nor reviewed by investigators. Once it is reported by investigators and supervisors, the crime data is reported to the FBI/UCI and is available via the pertinent LASD patrol station, pending publication by the FBI/UCI. Once it is reported by the LASD to the FBI, the FBI/UCI crime data is considered the most accurate.
SANTA CLARITAUNINCORPORATED
18 3
35 9
8 2
16 3
4 6
1.07.41
.45
.22.2.9
-81.31119.51
-55.56309.09
ARSON
SANTA CLARITA VALLEY YTDReported
YTDCrime Rate
TotalReportedIncidents
YTDReported
YTDCrime Rate
TotalReportedIncidents
YTDReported
YTDCrime Rate
5 YearChange inYTD Crime
Rate
1 YearChange inYTD Crime
Rate
2009 2013 2014
2014/2009 2014/2013
PART I CRIMES TOTAL
STATION TOTAL
SANTA CLARITAUNINCORPORATED
1,268 572
2009
1,368 353
2013
1,069 343
21 10 10
75.1278.04
3,109 1,345
44 19
77.5938.21
3,172 879
.87 .37
52.2751.41
.37
-30.42-34.12
0
STATION TOTAL
-32.6334.55
1,840 1,721
-57.47
1,412 4,454 4,051 52.0676 64.05 -31.5 -18.72
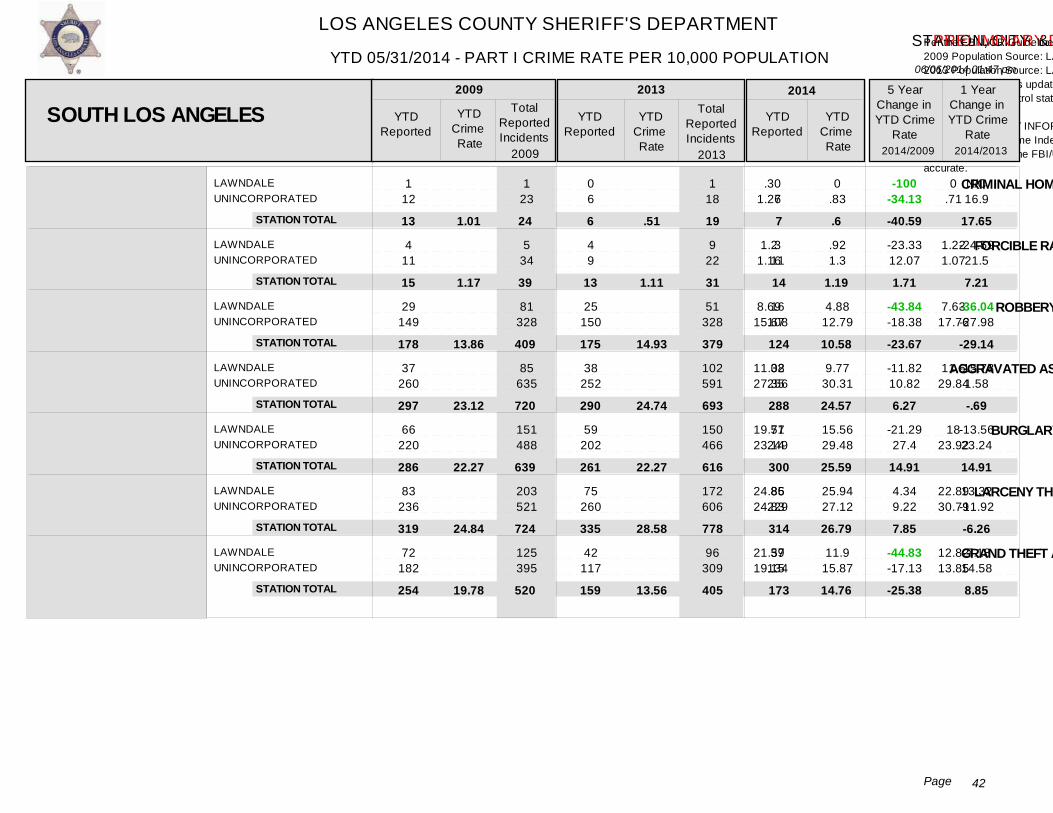
LOS ANGELES COUNTY SHERIFF'S DEPARTMENT
06/06/2014 01:47 pm
STATION, CITY & UNINCORPORATED DETAIL BY STATION & CRIME TYPE
Ver: 10.02.19.2013.0
YTD 05/31/2014 - PART I CRIME RATE PER 10,000 POPULATION
42Page
- PRELIMINARY DATA
Per the FBI UCR Guidelines Homicide, Rape and Aggravated Assault are counted by victim. All other crimes are counted by incident, except Arson which is always counted.2009 Population Source: LA County Internal Services Department (based on the 2000 US Census and CA Department of Finance estimates).2013 Population Source: LA County Internal Services Department (based on the 2010 US Census and CA Department of Finance estimates). 2014 YTD Crime Rates based on 2013 population estimates. 2013 population estimates updated for the city of Santa Clarita and the Santa Clarita Valley Station unincorporated area, due to 2012 year end annexations.Crime counts for patrol station areas only; red depicts +30% increases and green depicts -30% decreases. N/C = Not Calculable
This PRELIMINARY INFORMATION is used on an ongoing basis by the LASD for strategic planning and as a tactical early warning system. This data is not final and thus is not the crime data that is reported to the FBI Uniform Crime Index (UCI). This is because some of the most recent reports have not been written yet, nor reviewed by investigators. Once it is reported by investigators and supervisors, the crime data is reported to the FBI/UCI and is available via the pertinent LASD patrol station, pending publication by the FBI/UCI. Once it is reported by the LASD to the FBI, the FBI/UCI crime data is considered the most accurate.
LAWNDALEUNINCORPORATED
LAWNDALEUNINCORPORATED
LAWNDALEUNINCORPORATED
LAWNDALEUNINCORPORATED
LAWNDALEUNINCORPORATED
LAWNDALEUNINCORPORATED
LAWNDALEUNINCORPORATED
1 12
4 11
29 149
37 260
66 220
83 236
72 182
1 23
5 34
81 328
85 635
151 488
203 521
125 395
0 6
4 9
25 150
38 252
59 202
75 260
42 117
1 18
9 22
51 328
102 591
150 466
172 606
96 309
0 7
3 11
16 108
32 256
51 249
85 229
39 134
.31.26
1.21.16
8.6915.67
11.0827.35
19.7723.14
24.8624.83
21.5719.15
0.71
1.221.07
7.6317.76
11.629.84
1823.92
22.8930.79
12.8213.85
0.83
.921.3
4.8812.79
9.7730.31
15.5629.48
25.9427.12
11.915.87
-100-34.13
-23.3312.07
-43.84-18.38
-11.8210.82
-21.2927.4
4.349.22
-44.83-17.13
N/C16.9
-24.5921.5
-36.04-27.98
-15.781.58
-13.5623.24
13.32-11.92
-7.1814.58
CRIMINAL HOMICIDE
FORCIBLE RAPE
ROBBERY
AGGRAVATED ASSAULT
BURGLARY
LARCENY THEFT
GRAND THEFT AUTO
SOUTH LOS ANGELES YTDReported
YTDCrime Rate
TotalReportedIncidents
YTDReported
YTDCrime Rate
TotalReportedIncidents
YTDReported
YTDCrime Rate
5 YearChange inYTD Crime
Rate
1 YearChange inYTD Crime
Rate
2009 2013 2014
2014/2009 2014/2013
STATION TOTAL
STATION TOTAL
STATION TOTAL
STATION TOTAL
STATION TOTAL
STATION TOTAL
STATION TOTAL
2009 2013
13
15
178
297
286
319
254
6
13
175
290
261
335
159
7
14
124
288
300
314
173
24
39
409
720
639
724
520
19
31
379
693
616
778
405
1.01
1.17
13.86
23.12
22.27
24.84
19.78
.51
1.11
14.93
24.74
22.27
28.58
13.56
.6
1.19
10.58
24.57
25.59
26.79
14.76
17.65
7.21
-29.14
-.69
14.91
-6.26
8.85
-40.59
1.71
-23.67
6.27
14.91
7.85
-25.38
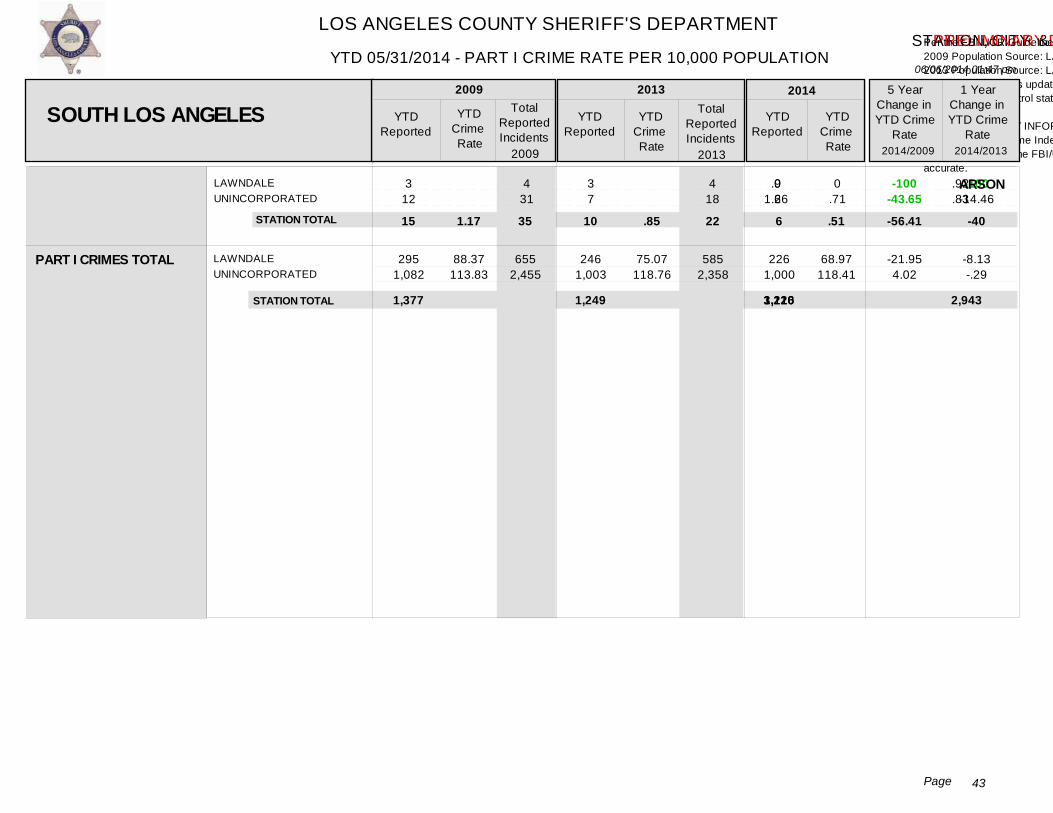
LOS ANGELES COUNTY SHERIFF'S DEPARTMENT
06/06/2014 01:47 pm
STATION, CITY & UNINCORPORATED DETAIL BY STATION & CRIME TYPE
Ver: 10.02.19.2013.0
YTD 05/31/2014 - PART I CRIME RATE PER 10,000 POPULATION
43Page
- PRELIMINARY DATA
Per the FBI UCR Guidelines Homicide, Rape and Aggravated Assault are counted by victim. All other crimes are counted by incident, except Arson which is always counted.2009 Population Source: LA County Internal Services Department (based on the 2000 US Census and CA Department of Finance estimates).2013 Population Source: LA County Internal Services Department (based on the 2010 US Census and CA Department of Finance estimates). 2014 YTD Crime Rates based on 2013 population estimates. 2013 population estimates updated for the city of Santa Clarita and the Santa Clarita Valley Station unincorporated area, due to 2012 year end annexations.Crime counts for patrol station areas only; red depicts +30% increases and green depicts -30% decreases. N/C = Not Calculable
This PRELIMINARY INFORMATION is used on an ongoing basis by the LASD for strategic planning and as a tactical early warning system. This data is not final and thus is not the crime data that is reported to the FBI Uniform Crime Index (UCI). This is because some of the most recent reports have not been written yet, nor reviewed by investigators. Once it is reported by investigators and supervisors, the crime data is reported to the FBI/UCI and is available via the pertinent LASD patrol station, pending publication by the FBI/UCI. Once it is reported by the LASD to the FBI, the FBI/UCI crime data is considered the most accurate.
LAWNDALEUNINCORPORATED
3 12
4 31
3 7
4 18
0 6
.91.26
.92
.830
.71-100
-43.65-100
-14.46ARSON
SOUTH LOS ANGELES YTDReported
YTDCrime Rate
TotalReportedIncidents
YTDReported
YTDCrime Rate
TotalReportedIncidents
YTDReported
YTDCrime Rate
5 YearChange inYTD Crime
Rate
1 YearChange inYTD Crime
Rate
2009 2013 2014
2014/2009 2014/2013
PART I CRIMES TOTAL
STATION TOTAL
LAWNDALEUNINCORPORATED
295 1,082
2009
246 1,003
2013
226 1,000
15 10 6
88.37113.83
655 2,455
35 22
75.07118.76
585 2,358
1.17 .85
68.97118.41
.51
-21.954.02
-40
STATION TOTAL
-8.13-.29
1,377 1,249
-56.41
1,226 3,110 2,943 104.59107.21 106.55 -2.44 -1.84
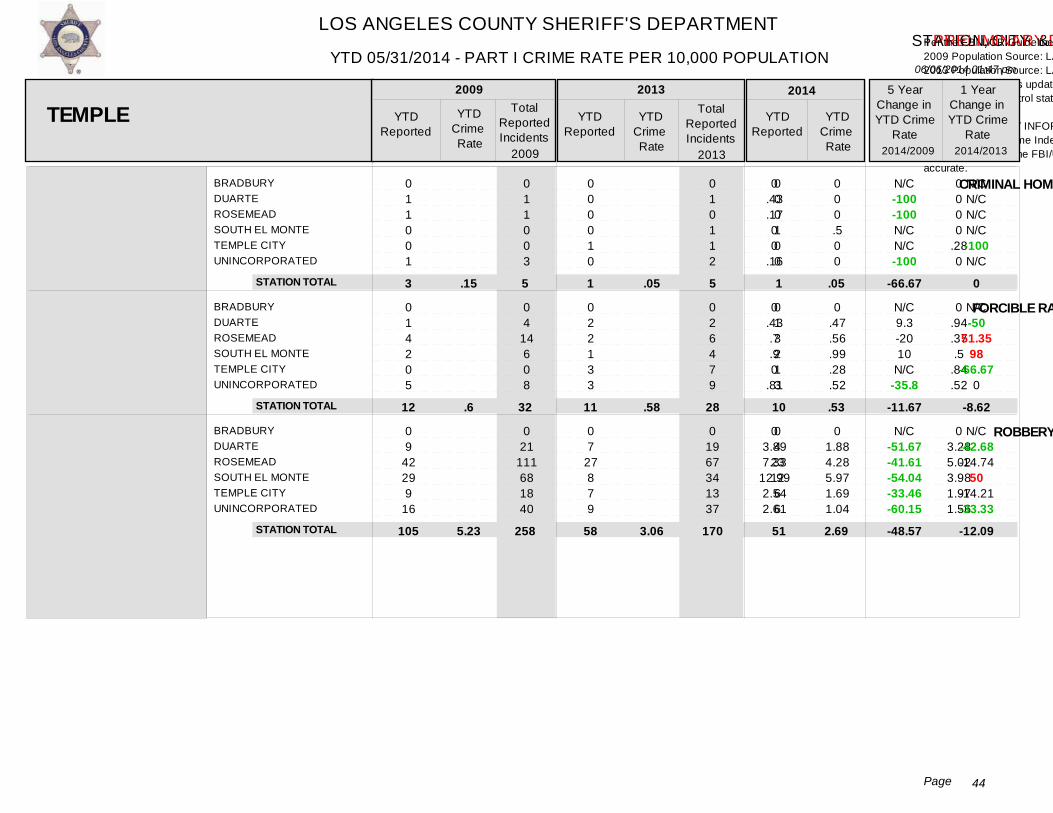
LOS ANGELES COUNTY SHERIFF'S DEPARTMENT
06/06/2014 01:47 pm
STATION, CITY & UNINCORPORATED DETAIL BY STATION & CRIME TYPE
Ver: 10.02.19.2013.0
YTD 05/31/2014 - PART I CRIME RATE PER 10,000 POPULATION
44Page
- PRELIMINARY DATA
Per the FBI UCR Guidelines Homicide, Rape and Aggravated Assault are counted by victim. All other crimes are counted by incident, except Arson which is always counted.2009 Population Source: LA County Internal Services Department (based on the 2000 US Census and CA Department of Finance estimates).2013 Population Source: LA County Internal Services Department (based on the 2010 US Census and CA Department of Finance estimates). 2014 YTD Crime Rates based on 2013 population estimates. 2013 population estimates updated for the city of Santa Clarita and the Santa Clarita Valley Station unincorporated area, due to 2012 year end annexations.Crime counts for patrol station areas only; red depicts +30% increases and green depicts -30% decreases. N/C = Not Calculable
This PRELIMINARY INFORMATION is used on an ongoing basis by the LASD for strategic planning and as a tactical early warning system. This data is not final and thus is not the crime data that is reported to the FBI Uniform Crime Index (UCI). This is because some of the most recent reports have not been written yet, nor reviewed by investigators. Once it is reported by investigators and supervisors, the crime data is reported to the FBI/UCI and is available via the pertinent LASD patrol station, pending publication by the FBI/UCI. Once it is reported by the LASD to the FBI, the FBI/UCI crime data is considered the most accurate.
BRADBURYDUARTEROSEMEADSOUTH EL MONTETEMPLE CITYUNINCORPORATED
BRADBURYDUARTEROSEMEADSOUTH EL MONTETEMPLE CITYUNINCORPORATED
BRADBURYDUARTEROSEMEADSOUTH EL MONTETEMPLE CITYUNINCORPORATED
0 1 1 0 0 1
0 1 4 2 0 5
0 9
42 29 9
16
0 1 1 0 0 3
0 4
14 6 0 8
0 21
111 68 18 40
0 0 0 0 1 0
0 2 2 1 3 3
0 7
27 8 7 9
0 1 0 1 1 2
0 2 6 4 7 9
0 19 67 34 13 37
0 0 0 1 0 0
0 1 3 2 1 3
0 4
23 12 6 6
0.43.1700
.16
0.43.7.90
.81
03.897.33
12.992.542.61
0000
.280
0.94.37.5
.84
.52
03.285.023.981.971.56
000.500
0.47.56.99.28.52
01.884.285.971.691.04
N/C-100-100N/CN/C-100
N/C9.3-2010
N/C-35.8
N/C-51.67-41.61-54.04-33.46-60.15
N/CN/CN/CN/C-100N/C
N/C-50
51.3598
-66.670
N/C-42.68-14.74
50-14.21-33.33
CRIMINAL HOMICIDE
FORCIBLE RAPE
ROBBERY
TEMPLE YTDReported
YTDCrime Rate
TotalReportedIncidents
YTDReported
YTDCrime Rate
TotalReportedIncidents
YTDReported
YTDCrime Rate
5 YearChange inYTD Crime
Rate
1 YearChange inYTD Crime
Rate
2009 2013 2014
2014/2009 2014/2013
STATION TOTAL
STATION TOTAL
STATION TOTAL
2009 2013
3
12
105
1
11
58
1
10
51
5
32
258
5
28
170
.15
.6
5.23
.05
.58
3.06
.05
.53
2.69
0
-8.62
-12.09
-66.67
-11.67
-48.57
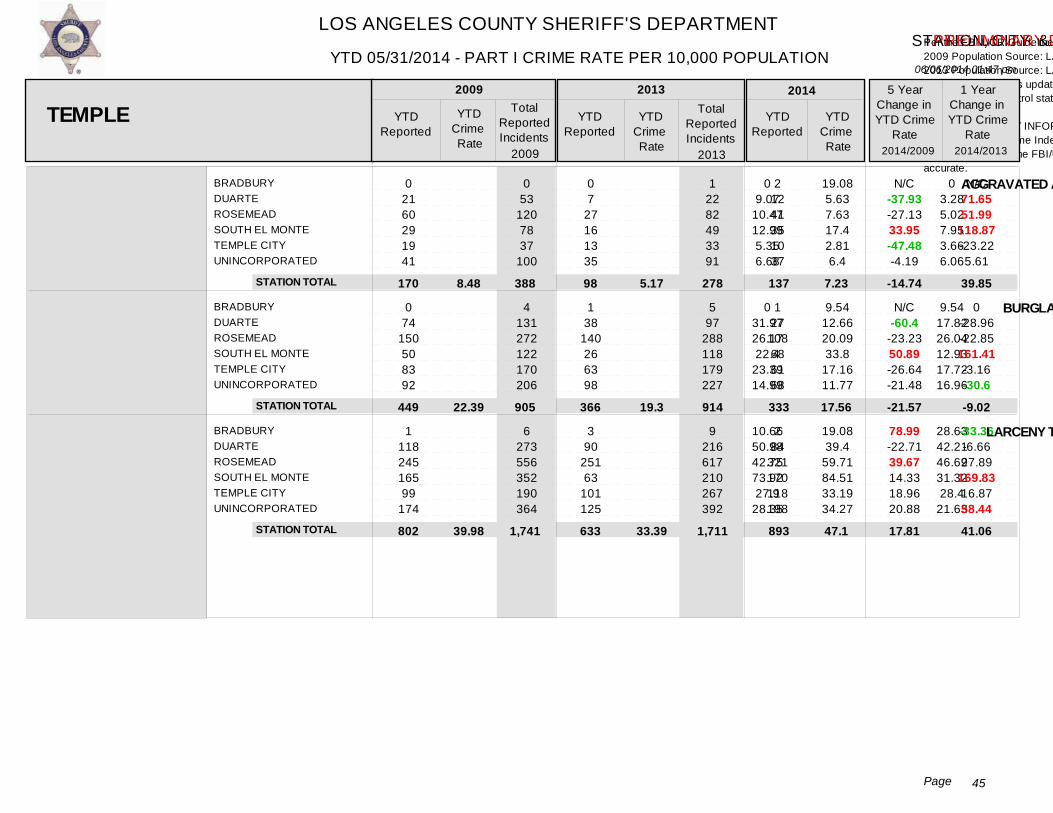
LOS ANGELES COUNTY SHERIFF'S DEPARTMENT
06/06/2014 01:47 pm
STATION, CITY & UNINCORPORATED DETAIL BY STATION & CRIME TYPE
Ver: 10.02.19.2013.0
YTD 05/31/2014 - PART I CRIME RATE PER 10,000 POPULATION
45Page
- PRELIMINARY DATA
Per the FBI UCR Guidelines Homicide, Rape and Aggravated Assault are counted by victim. All other crimes are counted by incident, except Arson which is always counted.2009 Population Source: LA County Internal Services Department (based on the 2000 US Census and CA Department of Finance estimates).2013 Population Source: LA County Internal Services Department (based on the 2010 US Census and CA Department of Finance estimates). 2014 YTD Crime Rates based on 2013 population estimates. 2013 population estimates updated for the city of Santa Clarita and the Santa Clarita Valley Station unincorporated area, due to 2012 year end annexations.Crime counts for patrol station areas only; red depicts +30% increases and green depicts -30% decreases. N/C = Not Calculable
This PRELIMINARY INFORMATION is used on an ongoing basis by the LASD for strategic planning and as a tactical early warning system. This data is not final and thus is not the crime data that is reported to the FBI Uniform Crime Index (UCI). This is because some of the most recent reports have not been written yet, nor reviewed by investigators. Once it is reported by investigators and supervisors, the crime data is reported to the FBI/UCI and is available via the pertinent LASD patrol station, pending publication by the FBI/UCI. Once it is reported by the LASD to the FBI, the FBI/UCI crime data is considered the most accurate.
BRADBURYDUARTEROSEMEADSOUTH EL MONTETEMPLE CITYUNINCORPORATED
BRADBURYDUARTEROSEMEADSOUTH EL MONTETEMPLE CITYUNINCORPORATED
BRADBURYDUARTEROSEMEADSOUTH EL MONTETEMPLE CITYUNINCORPORATED
0 21 60 29 19 41
0 74
150 50 83 92
1 118 245 165 99
174
0 53
120 78 37
100
4 131 272 122 170 206
6 273 556 352 190 364
0 7
27 16 13 35
1 38
140 26 63 98
3 90
251 63
101 125
1 22 82 49 33 91
5 97
288 118 179 227
9 216 617 210 267 392
2 12 41 35 10 37
1 27
108 68 61 68
2 84
321 170 118 198
09.07
10.4712.995.356.68
031.9726.1722.4
23.3914.99
10.6650.9842.7573.9227.9
28.35
03.285.027.953.666.06
9.5417.8226.0412.9317.7216.96
28.6342.2146.6931.3228.4
21.63
19.085.637.6317.42.816.4
9.5412.6620.0933.8
17.1611.77
19.0839.4
59.7184.5133.1934.27
N/C-37.93-27.1333.95-47.48-4.19
N/C-60.4
-23.2350.89-26.64-21.48
78.99-22.7139.6714.3318.9620.88
N/C71.6551.99
118.87-23.225.61
0-28.96-22.85161.41-3.16-30.6
-33.36-6.6627.89
169.8316.8758.44
AGGRAVATED ASSAULT
BURGLARY
LARCENY THEFT
TEMPLE YTDReported
YTDCrime Rate
TotalReportedIncidents
YTDReported
YTDCrime Rate
TotalReportedIncidents
YTDReported
YTDCrime Rate
5 YearChange inYTD Crime
Rate
1 YearChange inYTD Crime
Rate
2009 2013 2014
2014/2009 2014/2013
STATION TOTAL
STATION TOTAL
STATION TOTAL
2009 2013
170
449
802
98
366
633
137
333
893
388
905
1,741
278
914
1,711
8.48
22.39
39.98
5.17
19.3
33.39
7.23
17.56
47.1
39.85
-9.02
41.06
-14.74
-21.57
17.81

LOS ANGELES COUNTY SHERIFF'S DEPARTMENT
06/06/2014 01:47 pm
STATION, CITY & UNINCORPORATED DETAIL BY STATION & CRIME TYPE
Ver: 10.02.19.2013.0
YTD 05/31/2014 - PART I CRIME RATE PER 10,000 POPULATION
46Page
- PRELIMINARY DATA
Per the FBI UCR Guidelines Homicide, Rape and Aggravated Assault are counted by victim. All other crimes are counted by incident, except Arson which is always counted.2009 Population Source: LA County Internal Services Department (based on the 2000 US Census and CA Department of Finance estimates).2013 Population Source: LA County Internal Services Department (based on the 2010 US Census and CA Department of Finance estimates). 2014 YTD Crime Rates based on 2013 population estimates. 2013 population estimates updated for the city of Santa Clarita and the Santa Clarita Valley Station unincorporated area, due to 2012 year end annexations.Crime counts for patrol station areas only; red depicts +30% increases and green depicts -30% decreases. N/C = Not Calculable
This PRELIMINARY INFORMATION is used on an ongoing basis by the LASD for strategic planning and as a tactical early warning system. This data is not final and thus is not the crime data that is reported to the FBI Uniform Crime Index (UCI). This is because some of the most recent reports have not been written yet, nor reviewed by investigators. Once it is reported by investigators and supervisors, the crime data is reported to the FBI/UCI and is available via the pertinent LASD patrol station, pending publication by the FBI/UCI. Once it is reported by the LASD to the FBI, the FBI/UCI crime data is considered the most accurate.
BRADBURYDUARTEROSEMEADSOUTH EL MONTETEMPLE CITYUNINCORPORATED
BRADBURYDUARTEROSEMEADSOUTH EL MONTETEMPLE CITYUNINCORPORATED
0 23
110 54 17 63
0 1 2 5 0 2
0 66
227 130 63
131
0 3 4 9 0 4
0 20 48 34 10 52
0 0 1 2 0 1
2 55
165 115 33
114
0 0 3 4 0
10
0 17 75 49 16 42
0 0 1 0 0 1
09.94
19.1924.194.79
10.27
0.43.35
2.240
.33
09.388.9316.92.81
9
00
.19
.990
.17
07.97
13.9524.36
4.57.27
00
.1900
.17
N/C-19.82-27.31
.7-6.05
-29.21
N/C-100
-45.71-100N/C
-48.48
N/C-15.0356.2244.1460.14-19.22
N/CN/C
0-100N/C
0
GRAND THEFT AUTO
ARSON
TEMPLE YTDReported
YTDCrime Rate
TotalReportedIncidents
YTDReported
YTDCrime Rate
TotalReportedIncidents
YTDReported
YTDCrime Rate
5 YearChange inYTD Crime
Rate
1 YearChange inYTD Crime
Rate
2009 2013 2014
2014/2009 2014/2013
PART I CRIMES TOTAL
STATION TOTAL
STATION TOTAL
BRADBURYDUARTEROSEMEADSOUTH EL MONTETEMPLE CITYUNINCORPORATED
1 248 614 334 227 394
2009
4 164 496 150 198 323
2013
5 145 572 337 212 355
267
10
164
4
199
2
10.66107.14107.13149.6363.9764.2
10 552
1,305 765 478 856
617
20
484
17
38.1776.9292.2674.5755.6855.9
17 412
1,228 535 533 882
13.31
.5
8.65
.21
47.7168.01
106.39167.5359.6261.44
10.5
.11
347.56-36.52-.69
11.96-6.8-4.3
21.39
-47.62
STATION TOTAL
24.99-11.5815.32
124.667.089.91
1,818 1,335
-21.11
-78
1,626 3,966 3,607 85.7690.64 70.41 -5.38 21.8

LOS ANGELES COUNTY SHERIFF'S DEPARTMENT
06/06/2014 01:47 pm
STATION, CITY & UNINCORPORATED DETAIL BY STATION & CRIME TYPE
Ver: 10.02.19.2013.0
YTD 05/31/2014 - PART I CRIME RATE PER 10,000 POPULATION
47Page
- PRELIMINARY DATA
Per the FBI UCR Guidelines Homicide, Rape and Aggravated Assault are counted by victim. All other crimes are counted by incident, except Arson which is always counted.2009 Population Source: LA County Internal Services Department (based on the 2000 US Census and CA Department of Finance estimates).2013 Population Source: LA County Internal Services Department (based on the 2010 US Census and CA Department of Finance estimates). 2014 YTD Crime Rates based on 2013 population estimates. 2013 population estimates updated for the city of Santa Clarita and the Santa Clarita Valley Station unincorporated area, due to 2012 year end annexations.Crime counts for patrol station areas only; red depicts +30% increases and green depicts -30% decreases. N/C = Not Calculable
This PRELIMINARY INFORMATION is used on an ongoing basis by the LASD for strategic planning and as a tactical early warning system. This data is not final and thus is not the crime data that is reported to the FBI Uniform Crime Index (UCI). This is because some of the most recent reports have not been written yet, nor reviewed by investigators. Once it is reported by investigators and supervisors, the crime data is reported to the FBI/UCI and is available via the pertinent LASD patrol station, pending publication by the FBI/UCI. Once it is reported by the LASD to the FBI, the FBI/UCI crime data is considered the most accurate.
DIAMOND BARWALNUTUNINCORPORATED
DIAMOND BARWALNUTUNINCORPORATED
DIAMOND BARWALNUTUNINCORPORATED
DIAMOND BARWALNUTUNINCORPORATED
DIAMOND BARWALNUTUNINCORPORATED
DIAMOND BARWALNUTUNINCORPORATED
0 0 1
1 0 0
21 12 38
24 11 37
113 51
131
266 158 224
0 0 1
4 3 2
40 21 68
42 19 74
244 121 296
561 291 442
0 0 0
2 1 2
14 2 8
16 9
32
167 77
155
234 118 196
0 0 1
3 1 3
24 10 23
35 26 54
345 220 306
475 207 396
0 0 0
3 1 1
6 7 9
19 12 33
116 48
109
153 59
190
00
.18
.1700
3.513.7
6.78
4.013.396.6
18.915.7423.38
44.4948.7639.98
000
.36
.34
.38
2.52.69
1.51
2.883.096.06
30.0726.4
29.35
42.1340.4537.12
000
.54
.34
.19
1.082.41.7
3.424.116.25
20.8816.4520.64
27.5520.2235.98
N/CN/C-100
217.65N/CN/C
-69.23-35.14-74.93
-14.7121.24-5.3
10.484.51
-11.72
-38.08-58.53-10.01
N/CN/CN/C
500
-50
-57.14247.8312.58
18.7533.013.14
-30.56-37.69-29.68
-34.61-50.01-3.07
CRIMINAL HOMICIDE
FORCIBLE RAPE
ROBBERY
AGGRAVATED ASSAULT
BURGLARY
LARCENY THEFT
WALNUT YTDReported
YTDCrime Rate
TotalReportedIncidents
YTDReported
YTDCrime Rate
TotalReportedIncidents
YTDReported
YTDCrime Rate
5 YearChange inYTD Crime
Rate
1 YearChange inYTD Crime
Rate
2009 2013 2014
2014/2009 2014/2013
STATION TOTAL
STATION TOTAL
STATION TOTAL
STATION TOTAL
STATION TOTAL
STATION TOTAL
2009 2013
1
1
71
72
295
648
0
5
24
57
399
548
0
5
22
64
273
402
1
9
129
135
661
1,294
1
7
57
115
871
1,078
.07
.07
4.79
4.86
19.9
43.72
0
.36
1.75
4.14
29.01
39.85
0
.36
1.6
4.65
19.85
29.23
N/C
0
-8.57
12.32
-31.58
-26.65
-100
414.29
-66.6
-4.32
-.25
-33.14
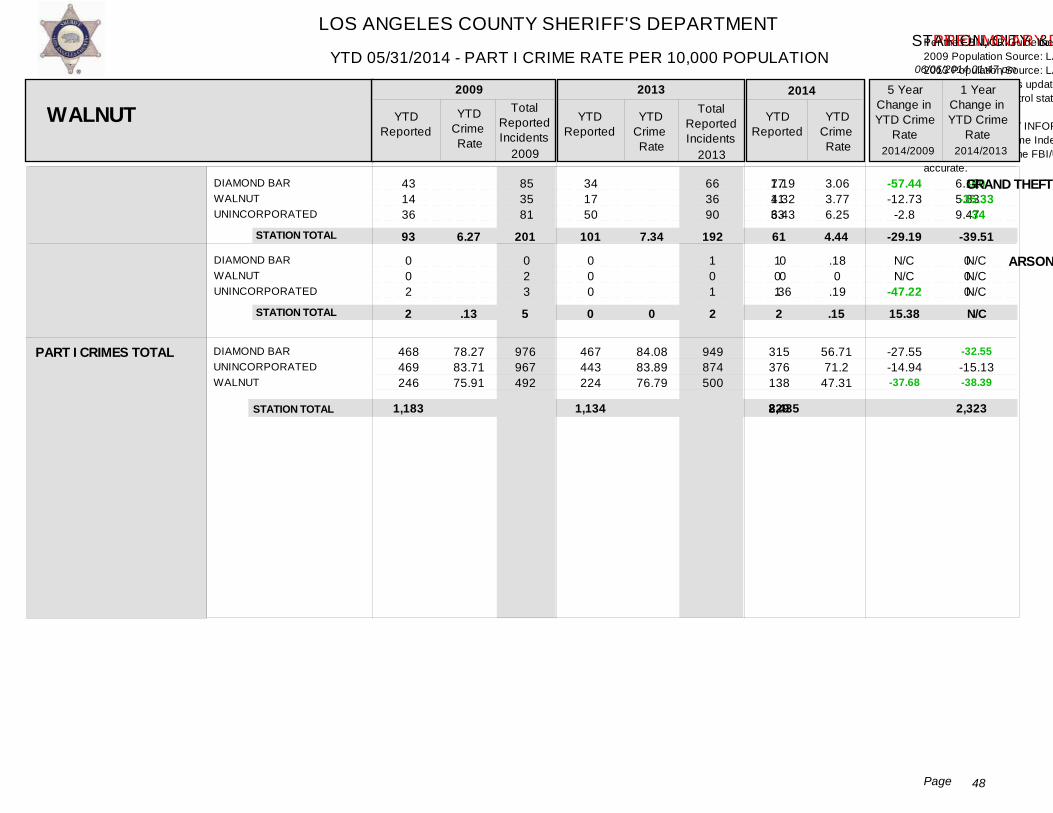
LOS ANGELES COUNTY SHERIFF'S DEPARTMENT
06/06/2014 01:47 pm
STATION, CITY & UNINCORPORATED DETAIL BY STATION & CRIME TYPE
Ver: 10.02.19.2013.0
YTD 05/31/2014 - PART I CRIME RATE PER 10,000 POPULATION
48Page
- PRELIMINARY DATA
Per the FBI UCR Guidelines Homicide, Rape and Aggravated Assault are counted by victim. All other crimes are counted by incident, except Arson which is always counted.2009 Population Source: LA County Internal Services Department (based on the 2000 US Census and CA Department of Finance estimates).2013 Population Source: LA County Internal Services Department (based on the 2010 US Census and CA Department of Finance estimates). 2014 YTD Crime Rates based on 2013 population estimates. 2013 population estimates updated for the city of Santa Clarita and the Santa Clarita Valley Station unincorporated area, due to 2012 year end annexations.Crime counts for patrol station areas only; red depicts +30% increases and green depicts -30% decreases. N/C = Not Calculable
This PRELIMINARY INFORMATION is used on an ongoing basis by the LASD for strategic planning and as a tactical early warning system. This data is not final and thus is not the crime data that is reported to the FBI Uniform Crime Index (UCI). This is because some of the most recent reports have not been written yet, nor reviewed by investigators. Once it is reported by investigators and supervisors, the crime data is reported to the FBI/UCI and is available via the pertinent LASD patrol station, pending publication by the FBI/UCI. Once it is reported by the LASD to the FBI, the FBI/UCI crime data is considered the most accurate.
DIAMOND BARWALNUTUNINCORPORATED
DIAMOND BARWALNUTUNINCORPORATED
43 14 36
0 0 2
85 35 81
0 2 3
34 17 50
0 0 0
66 36 90
1 0 1
17 11 33
1 0 1
7.194.326.43
00
.36
6.125.839.47
000
3.063.776.25
.180
.19
-57.44-12.73
-2.8
N/CN/C
-47.22
-50-35.33
-34
N/CN/CN/C
GRAND THEFT AUTO
ARSON
WALNUT YTDReported
YTDCrime Rate
TotalReportedIncidents
YTDReported
YTDCrime Rate
TotalReportedIncidents
YTDReported
YTDCrime Rate
5 YearChange inYTD Crime
Rate
1 YearChange inYTD Crime
Rate
2009 2013 2014
2014/2009 2014/2013
PART I CRIMES TOTAL
STATION TOTAL
STATION TOTAL
DIAMOND BARUNINCORPORATEDWALNUT
468 469 246
2009
467 443 224
2013
315 376 138
93
2
101
0
61
2
78.2783.7175.91
976 967 492
201
5
192
2
84.0883.8976.79
949 874 500
6.27
.13
7.34
0
56.7171.2
47.31
4.44
.15
-27.55-14.94-37.68
-39.51
N/C
STATION TOTAL
-32.55-15.13-38.39
1,183 1,134
-29.19
15.38
829 2,435 2,323 60.2879.81 82.46 -24.47 -26.9

LOS ANGELES COUNTY SHERIFF'S DEPARTMENT
06/06/2014 01:47 pm
STATION, CITY & UNINCORPORATED DETAIL BY STATION & CRIME TYPE
Ver: 10.02.19.2013.0
YTD 05/31/2014 - PART I CRIME RATE PER 10,000 POPULATION
49Page
- PRELIMINARY DATA
Per the FBI UCR Guidelines Homicide, Rape and Aggravated Assault are counted by victim. All other crimes are counted by incident, except Arson which is always counted.2009 Population Source: LA County Internal Services Department (based on the 2000 US Census and CA Department of Finance estimates).2013 Population Source: LA County Internal Services Department (based on the 2010 US Census and CA Department of Finance estimates). 2014 YTD Crime Rates based on 2013 population estimates. 2013 population estimates updated for the city of Santa Clarita and the Santa Clarita Valley Station unincorporated area, due to 2012 year end annexations.Crime counts for patrol station areas only; red depicts +30% increases and green depicts -30% decreases. N/C = Not Calculable
This PRELIMINARY INFORMATION is used on an ongoing basis by the LASD for strategic planning and as a tactical early warning system. This data is not final and thus is not the crime data that is reported to the FBI Uniform Crime Index (UCI). This is because some of the most recent reports have not been written yet, nor reviewed by investigators. Once it is reported by investigators and supervisors, the crime data is reported to the FBI/UCI and is available via the pertinent LASD patrol station, pending publication by the FBI/UCI. Once it is reported by the LASD to the FBI, the FBI/UCI crime data is considered the most accurate.
WEST HOLLYWOODUNINCORPORATED
WEST HOLLYWOODUNINCORPORATED
WEST HOLLYWOODUNINCORPORATED
WEST HOLLYWOODUNINCORPORATED
WEST HOLLYWOODUNINCORPORATED
WEST HOLLYWOODUNINCORPORATED
WEST HOLLYWOODUNINCORPORATED
0 0
8 2
55 2
82 8
122 5
476 26
55 4
0 0
13 2
113 3
200 17
288 14
1,125 87
127 13
0 0
4 0
23 1
57 5
107 4
517 57
35 1
0 0
14 0
67 3
136 17
287 6
1,044 130
100 2
1 0
1 0
42 0
72 8
83 4
434 59
32 1
00
2.1430.96
14.730.96
21.92123.84
32.6177.4
127.23402.48
14.761.92
00
1.160
6.6914.14
16.5770.72
31.1156.58
150.3806.22
10.1714.14
.290
.290
12.210
20.93113.15
24.1356.58
126.17834.51
9.314.14
N/CN/C
-86.45-100
-16.94-100
-4.52-8.63
-26-26.9
-.83107.34
-36.73-77.16
N/CN/C
-75N/C
82.51-100
26.3160
-22.440
-16.053.51
-8.550
CRIMINAL HOMICIDE
FORCIBLE RAPE
ROBBERY
AGGRAVATED ASSAULT
BURGLARY
LARCENY THEFT
GRAND THEFT AUTO
WEST HOLLYWOOD YTDReported
YTDCrime Rate
TotalReportedIncidents
YTDReported
YTDCrime Rate
TotalReportedIncidents
YTDReported
YTDCrime Rate
5 YearChange inYTD Crime
Rate
1 YearChange inYTD Crime
Rate
2009 2013 2014
2014/2009 2014/2013
STATION TOTAL
STATION TOTAL
STATION TOTAL
STATION TOTAL
STATION TOTAL
STATION TOTAL
STATION TOTAL
2009 2013
0
10
57
90
127
502
59
0
4
24
62
111
574
36
1
1
42
80
87
493
33
0
15
116
217
302
1,212
140
0
14
70
153
293
1,174
102
0
2.63
14.98
23.65
33.37
131.9
15.5
0
1.14
6.84
17.66
31.62
163.5
10.25
.28
.28
11.96
22.79
24.78
140.43
9.4
N/C
-75.44
74.85
29.05
-21.63
-14.11
-8.29
N/C
-89.35
-20.16
-3.64
-25.74
6.47
-39.35
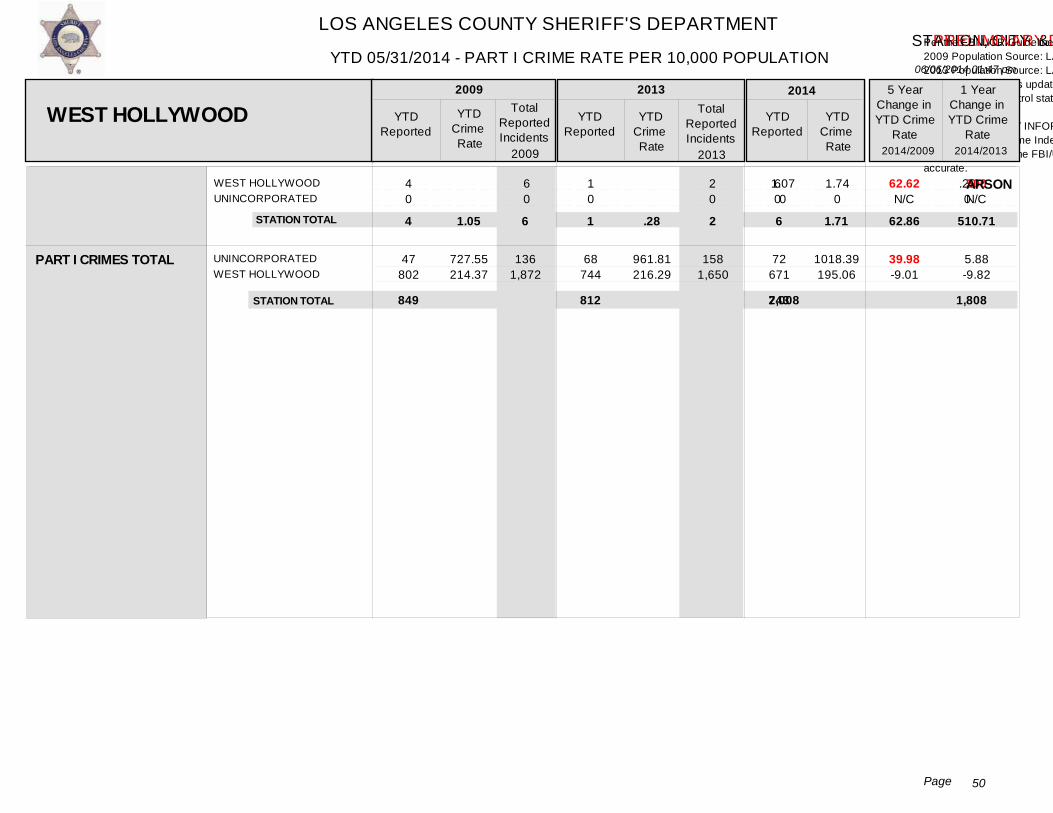
LOS ANGELES COUNTY SHERIFF'S DEPARTMENT
06/06/2014 01:47 pm
STATION, CITY & UNINCORPORATED DETAIL BY STATION & CRIME TYPE
Ver: 10.02.19.2013.0
YTD 05/31/2014 - PART I CRIME RATE PER 10,000 POPULATION
50Page
- PRELIMINARY DATA
Per the FBI UCR Guidelines Homicide, Rape and Aggravated Assault are counted by victim. All other crimes are counted by incident, except Arson which is always counted.2009 Population Source: LA County Internal Services Department (based on the 2000 US Census and CA Department of Finance estimates).2013 Population Source: LA County Internal Services Department (based on the 2010 US Census and CA Department of Finance estimates). 2014 YTD Crime Rates based on 2013 population estimates. 2013 population estimates updated for the city of Santa Clarita and the Santa Clarita Valley Station unincorporated area, due to 2012 year end annexations.Crime counts for patrol station areas only; red depicts +30% increases and green depicts -30% decreases. N/C = Not Calculable
This PRELIMINARY INFORMATION is used on an ongoing basis by the LASD for strategic planning and as a tactical early warning system. This data is not final and thus is not the crime data that is reported to the FBI Uniform Crime Index (UCI). This is because some of the most recent reports have not been written yet, nor reviewed by investigators. Once it is reported by investigators and supervisors, the crime data is reported to the FBI/UCI and is available via the pertinent LASD patrol station, pending publication by the FBI/UCI. Once it is reported by the LASD to the FBI, the FBI/UCI crime data is considered the most accurate.
WEST HOLLYWOODUNINCORPORATED
4 0
6 0
1 0
2 0
6 0
1.070
.290
1.740
62.62N/C
500N/C
ARSON
WEST HOLLYWOOD YTDReported
YTDCrime Rate
TotalReportedIncidents
YTDReported
YTDCrime Rate
TotalReportedIncidents
YTDReported
YTDCrime Rate
5 YearChange inYTD Crime
Rate
1 YearChange inYTD Crime
Rate
2009 2013 2014
2014/2009 2014/2013
PART I CRIMES TOTAL
STATION TOTAL
UNINCORPORATEDWEST HOLLYWOOD
47 802
2009
68 744
2013
72 671
4 1 6
727.55214.37
136 1,872
6 2
961.81216.29
158 1,650
1.05 .28
1018.39195.06
1.71
39.98-9.01
510.71
STATION TOTAL
5.88-9.82
849 812
62.86
743 2,008 1,808 211.64223.08 231.3 -5.13 -8.5
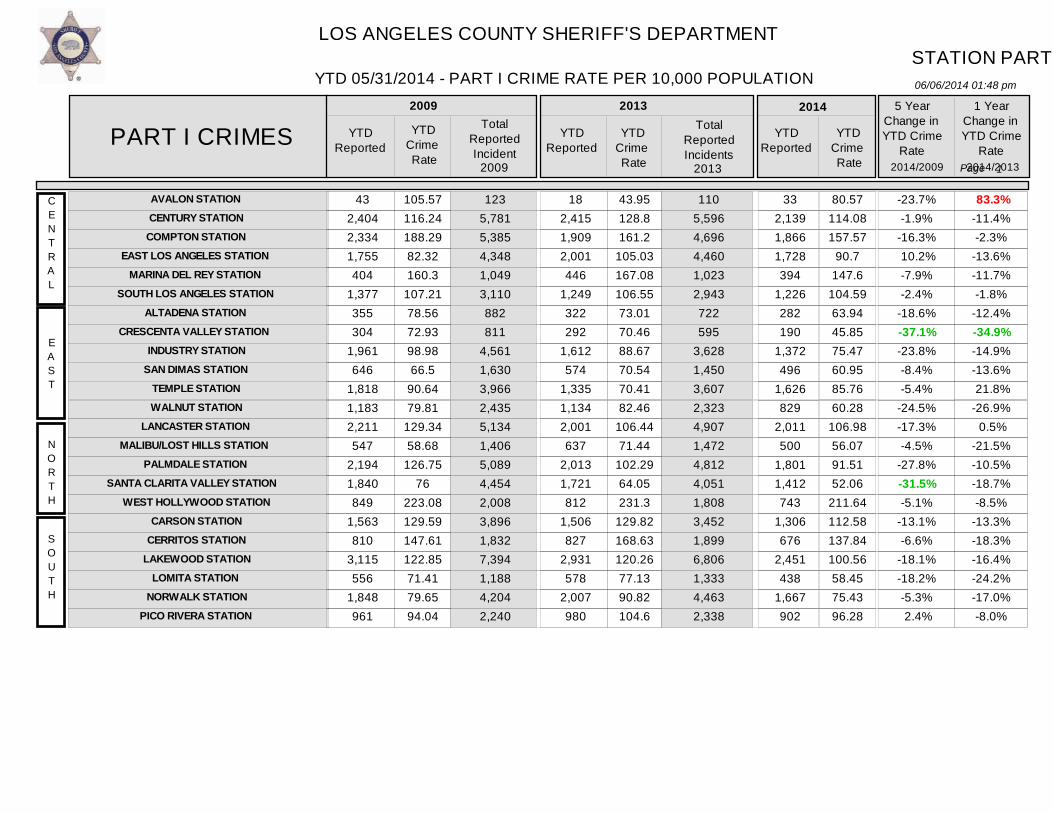
LOS ANGELES COUNTY SHERIFF'S DEPARTMENT
06/06/2014 01:48 pm
STATION PART I CRIME SUMMARY
Ver: 10.06.12.2013.0
YTDReported
YTDCrime Rate
TotalReportedIncident
YTDReported
YTDCrime Rate
TotalReportedIncidents
YTDReported
YTDCrime Rate
5 YearChange inYTD Crime
Rate
1 YearChange inYTD Crime
RatePART I CRIMES
2009 2013 2014
2014/2009 2014/2013
YTD 05/31/2014 - PART I CRIME RATE PER 10,000 POPULATION
2009 2013
1Page
- PRELIMINARY DATA
Per the FBI UCR Guidelines Homicide, Rape and Aggravated Assault are counted by victim. All other crimes are counted by incident, except Arson which is always counted.2009 Population Source: LA County Internal Services Department (based on the 2000 US Census and CA Department of Finance estimates).2013 Population Source: LA County Internal Services Department (based on the 2010 US Census and CA Department of Finance estimates). 2014 YTD Crime Rates based on 2013 population estimates. 2013 population estimates updated for the city of Santa Clarita and the Santa Clarita Valley Station unincorporated area, due to 2012 year end annexations.Crime counts for patrol station areas only; red depicts +30% increases and green depicts -30% decreases. N/C = Not Calculable
This PRELIMINARY INFORMATION is used on an ongoing basis by the LASD for strategic planning and as a tactical early warning system. This data is not final and thus is not the crime data that is reported to the FBI Uniform Crime Index (UCI). This is because some of the most recent reports have not been written yet, nor reviewed by investigators. Once it is reported by investigators and supervisors, the crime data is reported to the FBI/UCI and is available via the pertinent LASD patrol station, pending publication by the FBI/UCI. Once it is reported by the LASD to the FBI, the FBI/UCI crime data is considered the most accurate.
CENTRAL
EAST
NORTH
AVALON STATION
CENTURY STATION
COMPTON STATION
EAST LOS ANGELES STATION
MARINA DEL REY STATION
SOUTH LOS ANGELES STATION
ALTADENA STATION
CRESCENTA VALLEY STATION
INDUSTRY STATION
SAN DIMAS STATION
TEMPLE STATION
WALNUT STATION
LANCASTER STATION
MALIBU/LOST HILLS STATION
PALMDALE STATION
SANTA CLARITA VALLEY STATION
WEST HOLLYWOOD STATION
CARSON STATION
CERRITOS STATION
LAKEWOOD STATION
LOMITA STATION
NORWALK STATION
PICO RIVERA STATION
43 2,404 2,334 1,755 404
1,377 355 304
1,961 646
1,818 1,183 2,211 547
2,194 1,840 849
1,563 810
3,115 556
1,848 961
123 5,781 5,385 4,348 1,049 3,110 882 811
4,561 1,630 3,966 2,435 5,134 1,406 5,089 4,454 2,008 3,896 1,832 7,394 1,188 4,204 2,240
18 2,415 1,909 2,001 446
1,249 322 292
1,612 574
1,335 1,134 2,001 637
2,013 1,721 812
1,506 827
2,931 578
2,007 980
110 5,596 4,696 4,460 1,023 2,943 722 595
3,628 1,450 3,607 2,323 4,907 1,472 4,812 4,051 1,808 3,452 1,899 6,806 1,333 4,463 2,338
33 2,139 1,866 1,728 394
1,226 282 190
1,372 496
1,626 829
2,011 500
1,801 1,412 743
1,306 676
2,451 438
1,667 902
105.57116.24188.2982.32160.3
107.2178.5672.9398.9866.5
90.6479.81
129.3458.68
126.7576
223.08129.59147.61122.8571.4179.6594.04
43.95128.8161.2
105.03167.08106.5573.0170.4688.6770.5470.4182.46
106.4471.44
102.2964.05231.3
129.82168.63120.2677.1390.82104.6
80.57114.08157.57
90.7147.6
104.5963.9445.8575.4760.9585.7660.28
106.9856.0791.5152.06
211.64112.58137.84100.5658.4575.4396.28
-23.7%-1.9%
-16.3% 10.2%-7.9%-2.4%
-18.6%-37.1%-23.8%-8.4%-5.4%
-24.5%-17.3%-4.5%
-27.8%-31.5%-5.1%
-13.1%-6.6%
-18.1%-18.2%-5.3% 2.4%
83.3%-11.4%-2.3%
-13.6%-11.7%-1.8%
-12.4%-34.9%-14.9%-13.6% 21.8%-26.9% 0.5%
-21.5%-10.5%-18.7%-8.5%
-13.3%-18.3%-16.4%-24.2%-17.0%-8.0%
SOUTH
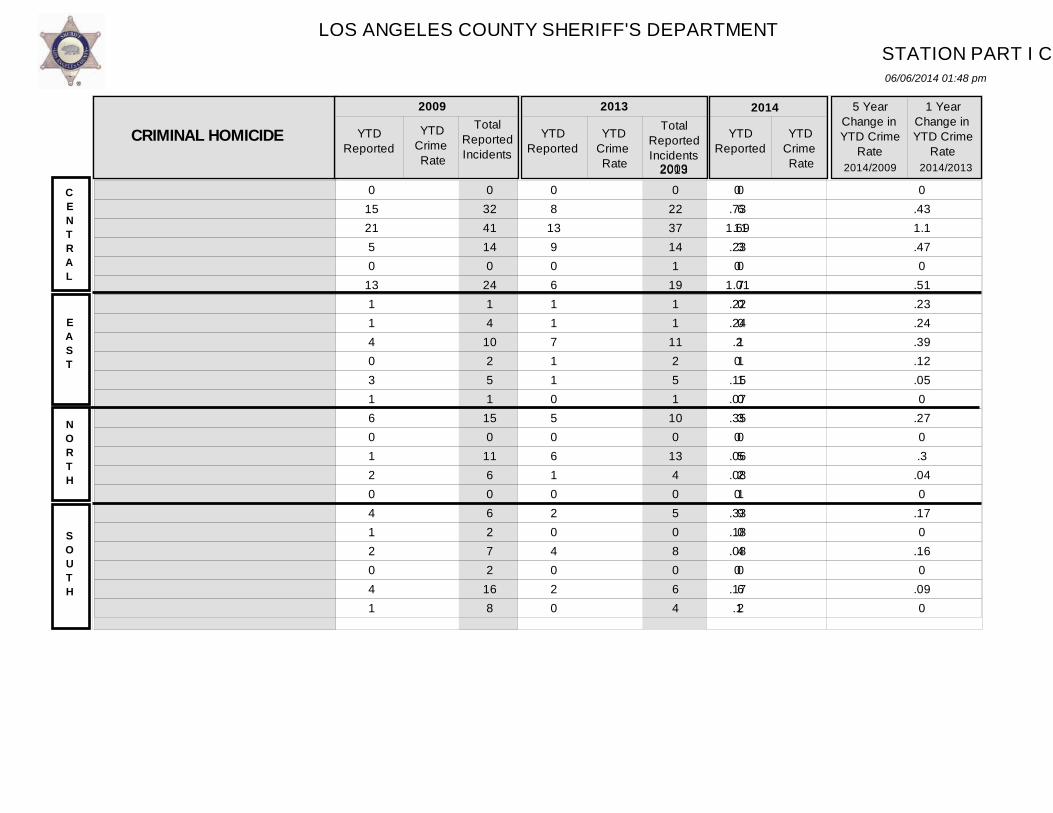
LOS ANGELES COUNTY SHERIFF'S DEPARTMENT
06/06/2014 01:48 pm
STATION PART I CRIME DETAIL
Ver: 10.06.12.2013.0
YTD 05/31/2014 - PART I CRIME RATE PER 10,000 POPULATION
1Page
- PRELIMINARY DATA
Per the FBI UCR Guidelines Homicide, Rape and Aggravated Assault are counted by victim. All other crimes are counted by incident, except Arson which is always counted.2009 Population Source: LA County Internal Services Department (based on the 2000 US Census and CA Department of Finance estimates).2013 Population Source: LA County Internal Services Department (based on the 2010 US Census and CA Department of Finance estimates). 2014 YTD Crime Rates based on 2013 population estimates. 2013 population estimates updated for the city of Santa Clarita and the Santa Clarita Valley Station unincorporated area, due to 2012 year end annexations.Crime counts for patrol station areas only; red depicts +30% increases and green depicts -30% decreases. N/C = Not Calculable
This PRELIMINARY INFORMATION is used on an ongoing basis by the LASD for strategic planning and as a tactical early warning system. This data is not final and thus is not the crime data thatis reported to the FBI Uniform Crime Index (UCI). This is because some of the most recent reports have not been written yet, nor reviewed by investigators. Once it is reported by investigators and supervisors, the crime data is reported to the FBI/UCI and is available via the pertinent LASD patrol station, pending publication by the FBI/UCI. Once it is reported by the LASD to the FBI, the FBI/UCI crime data is considered the most accurate.
0 15 21 5 0
13 1 1 4 0 3 1 6 0 1 2 0 4 1 2 0 4 1
0 32 41 14 0
24 1 4
10 2 5 1
15 0
11 6 0 6 2 7 2
16 8
0 8
13 9 0 6 1 1 7 1 1 0 5 0 6 1 0 2 0 4 0 2 0
0 22 37 14 1
19 1 1
11 2 5 1
10 0
13 4 0 5 0 8 0 6 4
0 6
11 3 0 7 0 0 1 1 1 0 3 0 5 2 1 9 0 4 0 6 2
0.73
1.69.230
1.01.22.24.20
.15
.07
.350
.06
.080
.33
.18
.080
.17.1
0.431.1.470
.51
.23
.24
.39
.12
.050
.270.3
.040
.170
.160
.090
0.32.93.160.600
.06
.12
.050
.160
.25
.07
.28
.780
.160
.27
.21
0.0%-56.2%-45.0%-30.4% 0.0%-40.6% 0.0% 0.0%-70.0% 0.0%-66.7% 0.0%-54.3% 0.0%
316.7%-12.5% 0.0%
136.4% 0.0%
100.0% 0.0% 58.8%
110.0%
0.0%-25.6%-15.5%-66.0% 0.0%
17.7% 0.0% 0.0%-84.6% 0.0% 0.0% 0.0%-40.7% 0.0%
-16.7% 75.0% 0.0%
358.8% 0.0% 0.0% 0.0%
200.0% 0.0%
AVALON STATION
CENTURY STATION
COMPTON STATION
EAST LOS ANGELES STATION
MARINA DEL REY STATION
SOUTH LOS ANGELES STATION
ALTADENA STATION
CRESCENTA VALLEY STATION
INDUSTRY STATION
SAN DIMAS STATION
TEMPLE STATION
WALNUT STATION
LANCASTER STATION
MALIBU/LOST HILLS STATION
PALMDALE STATION
SANTA CLARITA VALLEY STATION
WEST HOLLYWOOD STATION
CARSON STATION
CERRITOS STATION
LAKEWOOD STATION
LOMITA STATION
NORWALK STATION
PICO RIVERA STATION
CRIMINAL HOMICIDE YTDReported
YTDCrime Rate
TotalReportedIncidents
YTDReported
YTDCrime Rate
TotalReportedIncidents
YTDReported
YTDCrime Rate
5 YearChange inYTD Crime
Rate
1 YearChange inYTD Crime
Rate
2009 2013 2014
2014/2009 2014/2013
CENTRAL
EAST
NORTH
20132009
SOUTH

LOS ANGELES COUNTY SHERIFF'S DEPARTMENT
06/06/2014 01:48 pm
STATION PART I CRIME DETAIL
Ver: 10.06.12.2013.0
YTD 05/31/2014 - PART I CRIME RATE PER 10,000 POPULATION
2Page
- PRELIMINARY DATA
Per the FBI UCR Guidelines Homicide, Rape and Aggravated Assault are counted by victim. All other crimes are counted by incident, except Arson which is always counted.2009 Population Source: LA County Internal Services Department (based on the 2000 US Census and CA Department of Finance estimates).2013 Population Source: LA County Internal Services Department (based on the 2010 US Census and CA Department of Finance estimates). 2014 YTD Crime Rates based on 2013 population estimates. 2013 population estimates updated for the city of Santa Clarita and the Santa Clarita Valley Station unincorporated area, due to 2012 year end annexations.Crime counts for patrol station areas only; red depicts +30% increases and green depicts -30% decreases. N/C = Not Calculable
This PRELIMINARY INFORMATION is used on an ongoing basis by the LASD for strategic planning and as a tactical early warning system. This data is not final and thus is not the crime data thatis reported to the FBI Uniform Crime Index (UCI). This is because some of the most recent reports have not been written yet, nor reviewed by investigators. Once it is reported by investigators and supervisors, the crime data is reported to the FBI/UCI and is available via the pertinent LASD patrol station, pending publication by the FBI/UCI. Once it is reported by the LASD to the FBI, the FBI/UCI crime data is considered the most accurate.
0 19 15 19 2
15 3 1
10 6
12 1
32 4
19 13 10 6 3
28 4
17 4
0 42 52 39 4
39 5 3
23 17 32 9
71 12 50 26 15 18 4
55 6
32 18
0 19 11 11 2
13 6 2
15 4
11 5
21 4
12 14 4 7 0
18 2
25 5
0 42 30 32 2
31 12 2
32 14 28 7
53 11 34 28 14 17 3
33 2
41 10
1 23 12 14 3
14 1 1 6 5
10 5
24 6
14 11 1 8 0 8 3
12 5
0.92
1.21.89.79
1.17.66.24.5
.62.6
.071.87.431.1.54
2.63.5
.551.1.51.73.39
01.01.93.58.75
1.111.36.48.83.49.58.36
1.12.45.61.52
1.14.60
.74
.271.13.53
2.441.231.01.73
1.121.19.23.24.33.61.53.36
1.28.67.71.41.28.690
.33.4
.54
.53
0.0% 33.7%-16.5%-18.0% 41.8% 1.7%-65.2% 0.0%-34.0%-1.6%
-11.7% 414.3%-31.6% 55.8%-35.5%-24.1%-89.4% 38.0% 0.0%-70.0%-21.6%-26.0% 35.9%
0.0% 21.8% 8.6%
25.9% 49.3% 7.2%-83.1%-50.0%-60.2% 24.5%-8.6% 0.0%
14.3% 48.9% 16.4%-21.2%-75.4% 15.0% 0.0%-55.4% 48.2%-52.2% 0.0%
AVALON STATION
CENTURY STATION
COMPTON STATION
EAST LOS ANGELES STATION
MARINA DEL REY STATION
SOUTH LOS ANGELES STATION
ALTADENA STATION
CRESCENTA VALLEY STATION
INDUSTRY STATION
SAN DIMAS STATION
TEMPLE STATION
WALNUT STATION
LANCASTER STATION
MALIBU/LOST HILLS STATION
PALMDALE STATION
SANTA CLARITA VALLEY STATION
WEST HOLLYWOOD STATION
CARSON STATION
CERRITOS STATION
LAKEWOOD STATION
LOMITA STATION
NORWALK STATION
PICO RIVERA STATION
FORCIBLE RAPE YTDReported
YTDCrime Rate
TotalReportedIncidents
YTDReported
YTDCrime Rate
TotalReportedIncidents
YTDReported
YTDCrime Rate
5 YearChange inYTD Crime
Rate
1 YearChange inYTD Crime
Rate
2009 2013 2014
2014/2009 2014/2013
CENTRAL
EAST
NORTH
20132009
SOUTH

LOS ANGELES COUNTY SHERIFF'S DEPARTMENT
06/06/2014 01:48 pm
STATION PART I CRIME DETAIL
Ver: 10.06.12.2013.0
YTD 05/31/2014 - PART I CRIME RATE PER 10,000 POPULATION
3Page
- PRELIMINARY DATA
Per the FBI UCR Guidelines Homicide, Rape and Aggravated Assault are counted by victim. All other crimes are counted by incident, except Arson which is always counted.2009 Population Source: LA County Internal Services Department (based on the 2000 US Census and CA Department of Finance estimates).2013 Population Source: LA County Internal Services Department (based on the 2010 US Census and CA Department of Finance estimates). 2014 YTD Crime Rates based on 2013 population estimates. 2013 population estimates updated for the city of Santa Clarita and the Santa Clarita Valley Station unincorporated area, due to 2012 year end annexations.Crime counts for patrol station areas only; red depicts +30% increases and green depicts -30% decreases. N/C = Not Calculable
This PRELIMINARY INFORMATION is used on an ongoing basis by the LASD for strategic planning and as a tactical early warning system. This data is not final and thus is not the crime data thatis reported to the FBI Uniform Crime Index (UCI). This is because some of the most recent reports have not been written yet, nor reviewed by investigators. Once it is reported by investigators and supervisors, the crime data is reported to the FBI/UCI and is available via the pertinent LASD patrol station, pending publication by the FBI/UCI. Once it is reported by the LASD to the FBI, the FBI/UCI crime data is considered the most accurate.
0 288 217 152 23
178 10 5
108 21
105 71
148 13
123 65 57 72 21
281 23
107 44
1 735 557 447 59
409 34 17
218 58
258 129 335 24
286 142 116 199 50
636 40
253 102
1 261 172 132 17
175 6 4
71 19 58 24 91 15
106 38 24 68 14
165 13 88 32
2 618 433 296 46
379 12 12
129 42
170 57
267 34
272 119 70
181 42
369 25
198 85
0 239 156 119
9 124
7 2
59 13 51 22 99 5
98 44 42 53 22
115 12 74 38
013.9317.517.139.13
13.862.211.2
5.452.165.234.798.661.397.112.68
14.985.973.83
11.082.954.614.31
2.4413.9214.526.936.37
14.931.36.97
3.912.333.061.754.841.685.391.416.845.862.856.771.733.983.42
012.7513.176.253.37
10.581.59.48
3.251.6
2.691.6
5.27.56
4.981.62
11.964.574.494.721.6
3.354.06
0.0%-8.5%
-24.8%-12.3%-63.1%-23.7%-28.1%-60.0%-40.4%-25.9%-48.6%-66.6%-39.2%-59.7%-30.0%-39.6%-20.2%-23.5% 17.2%-57.4%-45.8%-27.3%-5.8%
0.0%-8.4%-9.3%-9.8%-47.1%-29.1% 16.9%-50.5%-16.9%-31.3%-12.1%-8.6% 8.9%-66.7%-7.6% 14.9% 74.9%-22.0% 57.5%-30.3%-7.5%
-15.8% 18.7%
AVALON STATION
CENTURY STATION
COMPTON STATION
EAST LOS ANGELES STATION
MARINA DEL REY STATION
SOUTH LOS ANGELES STATION
ALTADENA STATION
CRESCENTA VALLEY STATION
INDUSTRY STATION
SAN DIMAS STATION
TEMPLE STATION
WALNUT STATION
LANCASTER STATION
MALIBU/LOST HILLS STATION
PALMDALE STATION
SANTA CLARITA VALLEY STATION
WEST HOLLYWOOD STATION
CARSON STATION
CERRITOS STATION
LAKEWOOD STATION
LOMITA STATION
NORWALK STATION
PICO RIVERA STATION
ROBBERY YTDReported
YTDCrime Rate
TotalReportedIncidents
YTDReported
YTDCrime Rate
TotalReportedIncidents
YTDReported
YTDCrime Rate
5 YearChange inYTD Crime
Rate
1 YearChange inYTD Crime
Rate
2009 2013 2014
2014/2009 2014/2013
CENTRAL
EAST
NORTH
20132009
SOUTH
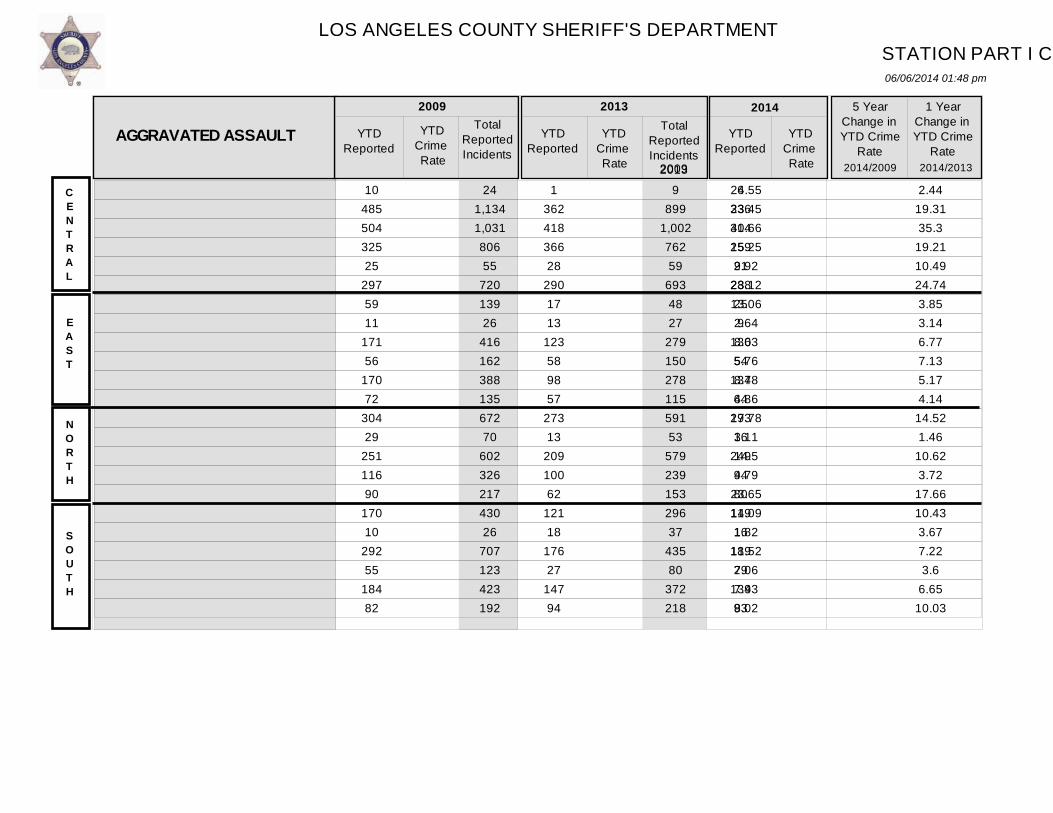
LOS ANGELES COUNTY SHERIFF'S DEPARTMENT
06/06/2014 01:48 pm
STATION PART I CRIME DETAIL
Ver: 10.06.12.2013.0
YTD 05/31/2014 - PART I CRIME RATE PER 10,000 POPULATION
4Page
- PRELIMINARY DATA
Per the FBI UCR Guidelines Homicide, Rape and Aggravated Assault are counted by victim. All other crimes are counted by incident, except Arson which is always counted.2009 Population Source: LA County Internal Services Department (based on the 2000 US Census and CA Department of Finance estimates).2013 Population Source: LA County Internal Services Department (based on the 2010 US Census and CA Department of Finance estimates). 2014 YTD Crime Rates based on 2013 population estimates. 2013 population estimates updated for the city of Santa Clarita and the Santa Clarita Valley Station unincorporated area, due to 2012 year end annexations.Crime counts for patrol station areas only; red depicts +30% increases and green depicts -30% decreases. N/C = Not Calculable
This PRELIMINARY INFORMATION is used on an ongoing basis by the LASD for strategic planning and as a tactical early warning system. This data is not final and thus is not the crime data thatis reported to the FBI Uniform Crime Index (UCI). This is because some of the most recent reports have not been written yet, nor reviewed by investigators. Once it is reported by investigators and supervisors, the crime data is reported to the FBI/UCI and is available via the pertinent LASD patrol station, pending publication by the FBI/UCI. Once it is reported by the LASD to the FBI, the FBI/UCI crime data is considered the most accurate.
10 485 504 325 25
297 59 11
171 56
170 72
304 29
251 116 90
170 10
292 55
184 82
24 1,134 1,031 806 55
720 139 26
416 162 388 135 672 70
602 326 217 430 26
707 123 423 192
1 362 418 366 28
290 17 13
123 58 98 57
273 13
209 100 62
121 18
176 27
147 94
9 899
1,002 762 59
693 48 27
279 150 278 115 591 53
579 239 153 296 37
435 80
372 218
6 336 314 259 21
288 25 9
130 54
137 64
293 16
249 94 80
119 16
189 29
134 93
24.5523.4540.6615.259.92
23.1213.062.648.635.768.484.86
17.783.1114.54.79
23.6514.091.82
11.527.067.938.02
2.4419.3135.3
19.2110.4924.743.853.146.777.135.174.14
14.521.46
10.623.72
17.6610.433.677.223.6
6.6510.03
14.6517.9226.5113.597.87
24.575.672.177.156.647.234.65
15.591.79
12.653.47
22.7910.263.267.753.876.069.93
-40.3%-23.6%-34.8%-10.9%-20.7% 6.3%-56.6%-17.8%-17.2% 15.3%-14.7%-4.3%
-12.3%-42.4%-12.8%-27.6%-3.6%
-27.2% 79.1%-32.7%-45.2%-23.6% 23.8%
500.4%-7.2%
-24.9%-29.3%-25.0%-0.7% 47.3%-30.9% 5.6%-6.9% 39.9% 12.3% 7.4%
22.6% 19.1%-6.7% 29.1%-1.6%
-11.2% 7.3% 7.5%-8.9%-1.0%
AVALON STATION
CENTURY STATION
COMPTON STATION
EAST LOS ANGELES STATION
MARINA DEL REY STATION
SOUTH LOS ANGELES STATION
ALTADENA STATION
CRESCENTA VALLEY STATION
INDUSTRY STATION
SAN DIMAS STATION
TEMPLE STATION
WALNUT STATION
LANCASTER STATION
MALIBU/LOST HILLS STATION
PALMDALE STATION
SANTA CLARITA VALLEY STATION
WEST HOLLYWOOD STATION
CARSON STATION
CERRITOS STATION
LAKEWOOD STATION
LOMITA STATION
NORWALK STATION
PICO RIVERA STATION
AGGRAVATED ASSAULT YTDReported
YTDCrime Rate
TotalReportedIncidents
YTDReported
YTDCrime Rate
TotalReportedIncidents
YTDReported
YTDCrime Rate
5 YearChange inYTD Crime
Rate
1 YearChange inYTD Crime
Rate
2009 2013 2014
2014/2009 2014/2013
CENTRAL
EAST
NORTH
20132009
SOUTH
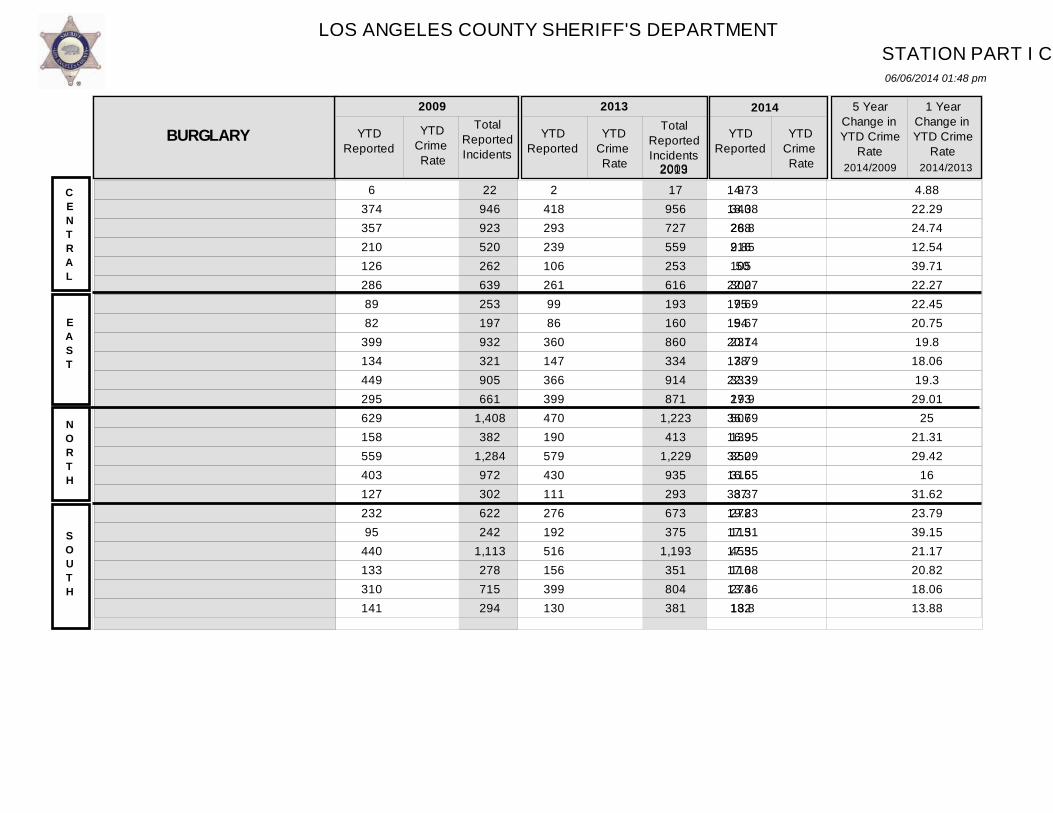
LOS ANGELES COUNTY SHERIFF'S DEPARTMENT
06/06/2014 01:48 pm
STATION PART I CRIME DETAIL
Ver: 10.06.12.2013.0
YTD 05/31/2014 - PART I CRIME RATE PER 10,000 POPULATION
5Page
- PRELIMINARY DATA
Per the FBI UCR Guidelines Homicide, Rape and Aggravated Assault are counted by victim. All other crimes are counted by incident, except Arson which is always counted.2009 Population Source: LA County Internal Services Department (based on the 2000 US Census and CA Department of Finance estimates).2013 Population Source: LA County Internal Services Department (based on the 2010 US Census and CA Department of Finance estimates). 2014 YTD Crime Rates based on 2013 population estimates. 2013 population estimates updated for the city of Santa Clarita and the Santa Clarita Valley Station unincorporated area, due to 2012 year end annexations.Crime counts for patrol station areas only; red depicts +30% increases and green depicts -30% decreases. N/C = Not Calculable
This PRELIMINARY INFORMATION is used on an ongoing basis by the LASD for strategic planning and as a tactical early warning system. This data is not final and thus is not the crime data thatis reported to the FBI Uniform Crime Index (UCI). This is because some of the most recent reports have not been written yet, nor reviewed by investigators. Once it is reported by investigators and supervisors, the crime data is reported to the FBI/UCI and is available via the pertinent LASD patrol station, pending publication by the FBI/UCI. Once it is reported by the LASD to the FBI, the FBI/UCI crime data is considered the most accurate.
6 374 357 210 126 286 89 82
399 134 449 295 629 158 559 403 127 232 95
440 133 310 141
22 946 923 520 262 639 253 197 932 321 905 661
1,408 382
1,284 972 302 622 242
1,113 278 715 294
2 418 293 239 106 261 99 86
360 147 366 399 470 190 579 430 111 276 192 516 156 399 130
17 956 727 559 253 616 193 160 860 334 914 871
1,223 413
1,229 935 293 673 375
1,193 351 804 381
9 343 268 216 105 300 75 54
237 78
333 273 506 139 350 315 87
278 115 455 116 274 182
14.7318.0828.89.8550
22.2719.6919.6720.1413.7922.3919.9
36.7916.9532.2916.6533.3719.2317.3117.3517.0813.3613.8
4.8822.2924.7412.5439.7122.2722.4520.7519.8
18.0619.3
29.0125
21.3129.42
1631.6223.7939.1521.1720.8218.0613.88
21.9718.2922.6311.3439.3325.59
1713.0313.049.59
17.5619.8526.9215.5917.7811.6124.7823.9623.4518.6715.4812.4
19.43
49.2% 1.2%
-21.4% 15.1%-21.3% 14.9%-13.7%-33.8%-35.3%-30.5%-21.6%-0.3%
-26.8%-8.0%-44.9%-30.3%-25.7% 24.6% 35.5% 7.6%-9.4%-7.2% 40.8%
350.2%-18.0%-8.5%-9.6%-1.0% 14.9%-24.3%-37.2%-34.1%-46.9%-9.0%-31.6% 7.7%
-26.8%-39.6%-27.4%-21.6% 0.7%-40.1%-11.8%-25.7%-31.3% 40.0%
AVALON STATION
CENTURY STATION
COMPTON STATION
EAST LOS ANGELES STATION
MARINA DEL REY STATION
SOUTH LOS ANGELES STATION
ALTADENA STATION
CRESCENTA VALLEY STATION
INDUSTRY STATION
SAN DIMAS STATION
TEMPLE STATION
WALNUT STATION
LANCASTER STATION
MALIBU/LOST HILLS STATION
PALMDALE STATION
SANTA CLARITA VALLEY STATION
WEST HOLLYWOOD STATION
CARSON STATION
CERRITOS STATION
LAKEWOOD STATION
LOMITA STATION
NORWALK STATION
PICO RIVERA STATION
BURGLARY YTDReported
YTDCrime Rate
TotalReportedIncidents
YTDReported
YTDCrime Rate
TotalReportedIncidents
YTDReported
YTDCrime Rate
5 YearChange inYTD Crime
Rate
1 YearChange inYTD Crime
Rate
2009 2013 2014
2014/2009 2014/2013
CENTRAL
EAST
NORTH
20132009
SOUTH

LOS ANGELES COUNTY SHERIFF'S DEPARTMENT
06/06/2014 01:48 pm
STATION PART I CRIME DETAIL
Ver: 10.06.12.2013.0
YTD 05/31/2014 - PART I CRIME RATE PER 10,000 POPULATION
6Page
- PRELIMINARY DATA
Per the FBI UCR Guidelines Homicide, Rape and Aggravated Assault are counted by victim. All other crimes are counted by incident, except Arson which is always counted.2009 Population Source: LA County Internal Services Department (based on the 2000 US Census and CA Department of Finance estimates).2013 Population Source: LA County Internal Services Department (based on the 2010 US Census and CA Department of Finance estimates). 2014 YTD Crime Rates based on 2013 population estimates. 2013 population estimates updated for the city of Santa Clarita and the Santa Clarita Valley Station unincorporated area, due to 2012 year end annexations.Crime counts for patrol station areas only; red depicts +30% increases and green depicts -30% decreases. N/C = Not Calculable
This PRELIMINARY INFORMATION is used on an ongoing basis by the LASD for strategic planning and as a tactical early warning system. This data is not final and thus is not the crime data thatis reported to the FBI Uniform Crime Index (UCI). This is because some of the most recent reports have not been written yet, nor reviewed by investigators. Once it is reported by investigators and supervisors, the crime data is reported to the FBI/UCI and is available via the pertinent LASD patrol station, pending publication by the FBI/UCI. Once it is reported by the LASD to the FBI, the FBI/UCI crime data is considered the most accurate.
19 515 643 596 193 319 161 181 923 363 802 648 829 310 954
1,059 502 814 563
1,286 293 770 463
59 1,248 1,542 1,470 581 724 377 508
2,177 909
1,741 1,294 2,012 839
2,271 2,547 1,212 1,906 1,277 3,118 634
1,861 1,127
12 723 550 702 253 335 180 174 771 278 633 548 959 383 905 998 574 746 514
1,452 339 963 522
61 1,696 1,408 1,632 572 778 397 368
1,655 742
1,711 1,078 2,227 886
2,203 2,393 1,174 1,648 1,215 3,368 742
2,180 1,189
16 651 671 691 228 314 146 111 667 276 893 402 862 309 907 822 493 638 462
1,238 236 879 409
46.6524.9
51.8727.9676.5824.8435.6343.4246.5937.3639.9843.7248.4933.2555.1243.74131.967.49102.650.7237.6333.1945.31
29.338.5646.4436.8594.7828.5840.8141.9942.4134.1633.3939.8551.0142.9545.9937.14163.564.3
104.8159.5845.2443.5855.72
39.0634.7256.6636.2785.4126.7933.1
26.7936.6933.9247.1
29.2345.8534.6546.0930.31
140.4354.9994.2150.8
31.4939.7843.66
-16.3% 39.4% 9.2%
29.7% 11.5% 7.9%-7.1%-38.3%-21.3%-9.2% 17.8%-33.1%-5.4% 4.2%
-16.4%-30.7% 6.5%
-18.5%-8.2% 0.2%
-16.3% 19.9%-3.6%
33.3%-10.0% 22.0%-1.6%-9.9%-6.3%
-18.9%-36.2%-13.5%-0.7% 41.1%-26.7%-10.1%-19.3% 0.2%
-18.4%-14.1%-14.5%-10.1%-14.7%-30.4%-8.7%
-21.6%
AVALON STATION
CENTURY STATION
COMPTON STATION
EAST LOS ANGELES STATION
MARINA DEL REY STATION
SOUTH LOS ANGELES STATION
ALTADENA STATION
CRESCENTA VALLEY STATION
INDUSTRY STATION
SAN DIMAS STATION
TEMPLE STATION
WALNUT STATION
LANCASTER STATION
MALIBU/LOST HILLS STATION
PALMDALE STATION
SANTA CLARITA VALLEY STATION
WEST HOLLYWOOD STATION
CARSON STATION
CERRITOS STATION
LAKEWOOD STATION
LOMITA STATION
NORWALK STATION
PICO RIVERA STATION
LARCENY THEFT YTDReported
YTDCrime Rate
TotalReportedIncidents
YTDReported
YTDCrime Rate
TotalReportedIncidents
YTDReported
YTDCrime Rate
5 YearChange inYTD Crime
Rate
1 YearChange inYTD Crime
Rate
2009 2013 2014
2014/2009 2014/2013
CENTRAL
EAST
NORTH
20132009
SOUTH

LOS ANGELES COUNTY SHERIFF'S DEPARTMENT
06/06/2014 01:48 pm
STATION PART I CRIME DETAIL
Ver: 10.06.12.2013.0
YTD 05/31/2014 - PART I CRIME RATE PER 10,000 POPULATION
7Page
- PRELIMINARY DATA
Per the FBI UCR Guidelines Homicide, Rape and Aggravated Assault are counted by victim. All other crimes are counted by incident, except Arson which is always counted.2009 Population Source: LA County Internal Services Department (based on the 2000 US Census and CA Department of Finance estimates).2013 Population Source: LA County Internal Services Department (based on the 2010 US Census and CA Department of Finance estimates). 2014 YTD Crime Rates based on 2013 population estimates. 2013 population estimates updated for the city of Santa Clarita and the Santa Clarita Valley Station unincorporated area, due to 2012 year end annexations.Crime counts for patrol station areas only; red depicts +30% increases and green depicts -30% decreases. N/C = Not Calculable
This PRELIMINARY INFORMATION is used on an ongoing basis by the LASD for strategic planning and as a tactical early warning system. This data is not final and thus is not the crime data thatis reported to the FBI Uniform Crime Index (UCI). This is because some of the most recent reports have not been written yet, nor reviewed by investigators. Once it is reported by investigators and supervisors, the crime data is reported to the FBI/UCI and is available via the pertinent LASD patrol station, pending publication by the FBI/UCI. Once it is reported by the LASD to the FBI, the FBI/UCI crime data is considered the most accurate.
8 669 527 421 34
254 29 18
317 64
267 93
226 31
259 161 59
252 113 766 42
444 221
16 1,551 1,133 1,006
86 520 66 40
743 151 617 201 540 65
534 391 140 679 226
1,716 96
876 492
2 602 435 531 39
159 13 12
258 64
164 101 167 25
174 130 36
280 85
590 40
375 192
17 1,317 1,015 1,142
88 405 56 23
643 157 484 192 483 59
435 314 102 616 221
1,373 132 843 435
0 526 404 402 27
173 25 10
264 67
199 61
195 18
162 114 33
195 59
433 38
276 171
19.6432.3542.5119.7513.4919.786.424.3216
6.5913.316.27
13.223.33
14.966.6515.5
20.8920.5930.215.39
19.1421.63
4.8832.1136.7327.8714.6113.562.952.9
14.197.868.657.348.882.8
8.844.84
10.2524.1417.3324.215.34
16.9720.49
028.0534.1121.1
10.1114.765.672.41
14.528.2310.54.44
10.372.028.234.29.4
16.8112.0317.775.07
12.4918.25
0.0%-13.3%-19.8% 6.8%
-25.1%-25.4%-11.7%-44.2%-9.3% 24.9%-21.1%-29.2%-21.6%-39.3%-45.0%-36.8%-39.4%-19.5%-41.6%-41.2%-5.9%-34.7%-15.6%
0.0%-12.6%-7.1%
-24.3%-30.8% 8.9% 92.2%-16.9% 2.3% 4.7%
21.4%-39.5% 16.8%-27.9%-6.9%
-13.2%-8.3%-30.4%-30.6%-26.6%-5.1%
-26.4%-10.9%
AVALON STATION
CENTURY STATION
COMPTON STATION
EAST LOS ANGELES STATION
MARINA DEL REY STATION
SOUTH LOS ANGELES STATION
ALTADENA STATION
CRESCENTA VALLEY STATION
INDUSTRY STATION
SAN DIMAS STATION
TEMPLE STATION
WALNUT STATION
LANCASTER STATION
MALIBU/LOST HILLS STATION
PALMDALE STATION
SANTA CLARITA VALLEY STATION
WEST HOLLYWOOD STATION
CARSON STATION
CERRITOS STATION
LAKEWOOD STATION
LOMITA STATION
NORWALK STATION
PICO RIVERA STATION
GRAND THEFT AUTO YTDReported
YTDCrime Rate
TotalReportedIncidents
YTDReported
YTDCrime Rate
TotalReportedIncidents
YTDReported
YTDCrime Rate
5 YearChange inYTD Crime
Rate
1 YearChange inYTD Crime
Rate
2009 2013 2014
2014/2009 2014/2013
CENTRAL
EAST
NORTH
20132009
SOUTH

LOS ANGELES COUNTY SHERIFF'S DEPARTMENT
06/06/2014 01:48 pm
STATION PART I CRIME DETAIL
Ver: 10.06.12.2013.0
YTD 05/31/2014 - PART I CRIME RATE PER 10,000 POPULATION
8Page
- PRELIMINARY DATA
Per the FBI UCR Guidelines Homicide, Rape and Aggravated Assault are counted by victim. All other crimes are counted by incident, except Arson which is always counted.2009 Population Source: LA County Internal Services Department (based on the 2000 US Census and CA Department of Finance estimates).2013 Population Source: LA County Internal Services Department (based on the 2010 US Census and CA Department of Finance estimates). 2014 YTD Crime Rates based on 2013 population estimates. 2013 population estimates updated for the city of Santa Clarita and the Santa Clarita Valley Station unincorporated area, due to 2012 year end annexations.Crime counts for patrol station areas only; red depicts +30% increases and green depicts -30% decreases. N/C = Not Calculable
This PRELIMINARY INFORMATION is used on an ongoing basis by the LASD for strategic planning and as a tactical early warning system. This data is not final and thus is not the crime data thatis reported to the FBI Uniform Crime Index (UCI). This is because some of the most recent reports have not been written yet, nor reviewed by investigators. Once it is reported by investigators and supervisors, the crime data is reported to the FBI/UCI and is available via the pertinent LASD patrol station, pending publication by the FBI/UCI. Once it is reported by the LASD to the FBI, the FBI/UCI crime data is considered the most accurate.
0 39 50 27 1
15 3 5
29 2
10 2
37 2
28 21 4
13 4
20 6
12 5
1 93
106 46 2
35 7
16 42 10 20 5
81 14 51 44 6
36 5
42 9
28 7
0 22 17 11 1
10 0 0 7 3 4 0
15 7
22 10 1 6 4
10 1 8 5
4 46 44 23 2
22 3 2
19 9
17 2
53 16 47 19 2
16 6
27 1
19 16
1 15 30 24 1 6 3 3 8 2 2 2
29 7
16 10 6 6 2 9 4
12 2
01.894.031.27
.41.17.661.2
1.46.21.5
.132.16.21
1.62.87
1.051.08.73.79.77.52.49
01.171.44.58.37.8500
.39
.37
.210.8
.791.12.37.28.52.82.41.13.36.53
2.44.8
2.531.26.37.51.68.72.44.25.11.15
1.54.79.81.37
1.71.52.41.37.53.54.21
0.0%-57.7%-37.2%-0.8%-7.5%-56.4% 3.0%-40.0%-69.9% 19.1%-78.0% 15.4%-28.7% 276.2%-50.0%-57.5% 62.9%-51.9%-43.8%-53.2%-31.2% 3.9%-57.1%
0.0%-31.6% 75.7%
117.2% 0.0%-40.0% 0.0% 0.0%
12.8%-32.4%-47.6% 0.0% 92.5% 0.0%
-27.7% 0.0%
510.7% 0.0%-50.0%-9.8%
307.7% 50.0%-60.4%
AVALON STATION
CENTURY STATION
COMPTON STATION
EAST LOS ANGELES STATION
MARINA DEL REY STATION
SOUTH LOS ANGELES STATION
ALTADENA STATION
CRESCENTA VALLEY STATION
INDUSTRY STATION
SAN DIMAS STATION
TEMPLE STATION
WALNUT STATION
LANCASTER STATION
MALIBU/LOST HILLS STATION
PALMDALE STATION
SANTA CLARITA VALLEY STATION
WEST HOLLYWOOD STATION
CARSON STATION
CERRITOS STATION
LAKEWOOD STATION
LOMITA STATION
NORWALK STATION
PICO RIVERA STATION
ARSON YTDReported
YTDCrime Rate
TotalReportedIncidents
YTDReported
YTDCrime Rate
TotalReportedIncidents
YTDReported
YTDCrime Rate
5 YearChange inYTD Crime
Rate
1 YearChange inYTD Crime
Rate
2009 2013 2014
2014/2009 2014/2013
CENTRAL
EAST
NORTH
20132009
SOUTH


![Los Angeles herald (Los Angeles, Calif. : 1900) (San ... · Los Angeles herald (Los Angeles, Calif. : 1900) (San Francisco) 1907-02-17 [p 10]](https://img.pdfslide.us/doc/110x75/5acba5097f8b9aa1518b6473/los-angeles-herald-los-angeles-calif-1900-san-angeles-herald-los-angeles.jpg)