Embed Size (px)
Citation preview

Nat Hazards (2018) 91:1097–1112https://doi.org/10.1007/s11069-018-3169-3
1 3
ORIGINAL PAPER
Characteristics of cloud‑to‑ground lightning and its relationship with climate change in Muli, Sichuan province, China
YanRong Yang1 · Die Song2 · ShengYan Wang1 · Ping Li1 · Yi Xu1
Received: 2 November 2017 / Accepted: 3 January 2018 / Published online: 27 January 2018 © The Author(s) 2018. This article is an open access publication
Abstract Along with climate change, cloud-to-ground lightning (CG)-caused forest fires are becoming increasingly pronounced. This study employed the Chinese lightning loca-tion system data (2009–2015) and worldwide lightning location network data (2005–2015) to jointly analyze CG characteristics and study the correlation between CG and climate change. The Muli county in southwest China was taken as research area. The CG num-ber showed a clear increasing trend on yearly timescale. At the monthly timescale, CG occurred from March to October, with a peak in June. At the daily timescale, 15:00–23:00 (local time) and 00:00–05:00 both had a high CG frequency, and the peak was at 18:00–19:00. We divided CG electric current intensity into six grades and found that negative CG accounted for more than 90% of total CG and, among these, the 3rd and 4th inten-sity grades accounted for about 70%. To examine the spatial distribution, we focused on lightning-caused forest fires high occurrence seasons. In spring, CG distribution changed from the initial southeast to the northwest, gradually spreading to the whole area of Muli, whereas the CG area gradually moved back to the southeast in autumn. Our research sug-gested that minimum temperature was the most sensitive temperature to CG change. In
* YanRong Yang [email protected]
Die Song [email protected]
ShengYan Wang [email protected]
Ping Li [email protected]
Yi Xu [email protected]
1 College of Biology and the Environment, Nanjing Forestry University, Longpan Road No. 159, Nanjing 210037, Jiangsu province, China
2 School of Agriculture and Biology, Shanghai Jiao Tong University, Dongchuan Road No. 800, Shanghai 200240, China

1098 Nat Hazards (2018) 91:1097–1112
1 3
March, the relationship between CG and minimum temperature showed a strong positive correlation. Considered jointly, we suggest the CG and related lightning-caused forest fires could increase in the future under an increased minimum temperature and decreased pre-cipitation, especially in March.
Keywords Cloud to ground lightning · Climate change · Lightning-caused forest fire · Southwest China
1 Introduction
Thunderstorms and lightning belong to meteorological phenomena. It is widely known that there is a close relationship between thunderstorms and climate change, especially for cloud to ground lightning (CG) (Fisher et al. 2014; Pinto and Pinto 2008; Price and Rind 1994; Kochtubajda et al. 2006; Romps et al. 2014; Wotton et al. 2005; Krause et al. 2014; Flannigan et al. 1998, 2008; Abatzoglou et al. 2016; Tippett et al. 2015; Williams 2005, 2012, 2015; Price 2009a, b, 2013; Reeve and Toumi 2010; Lutz et al. 2009; Sinha and Toumi 1997; Guo et al. 2014; Arif 2012), although this relation varies between differ-ent locations and timescales. The relation is mainly reflected in two aspects: firstly, future dryer and warmer climate conditions affect CG; and secondly, thunder and corresponding CG affect climate change.
Many researchers have suggested that CG seemed to show a trend of increasing along with warming (Pinto and Pinto 2008; Price and Rind 1994; Krause et al. 2014; Flanni-gan et al. 1998, 2008; Abatzoglou et al. 2016; Tippett et al. 2015; Price 2009a, b; Lutz et al. 2009; Guo et al. 2014; Arif 2012). Statistics have suggested that lightning activi-ties increased 30–40% with 1 °C warming (Pinto and Pinto 2008; Tippett et al. 2015), increasingly arid conditions resulting from climate change will theoretically decrease the number of CG occurrences, but in tropical areas, these dryer conditions cause increased thunderstorm activities (Price 2009a). Climate anomalies resulting from climate change are also related to lightning activities. Some investigations have shown that EI Nino, a widely known climatic anomaly, can cause the increase of lightning activity (Guo et al. 2014). Besides all of the above statistical findings, simulation methods which represent the com-mon method for solving meteorological problems provides similar information. Under the condition of a simulation of double CO2 concentration, global warming temperature will increase up to 4.2 °C, and global lightning activities will increase 30% (Price and Rind 1994). In Canada, this increase is larger at up to 36% (Arif 2012). Simulations of global temperature increase of about 1 °C indicate that the corresponding lightning activities will increase by 10% (Price 2009a). More importantly, although cloud-to-cloud lightning and CG are both lightning activities, the latter is more dangerous for human beings than the former. Moreover, research has shown that CG is more sensitive to climate change than cloud-to-cloud lightning (Price and Rind 1994), which means disasters caused by CG will increase under the condition of warming, especially in forest areas. In northern high latitudes such as North America and northeast Asia, burned area that was caused by CG showed severe increase (Krause et al. 2014), and ignition probabilities and burned areas of lightning-caused forest fire would both increase (Wotton et al. 2005; Flannigan et al. 1998, 2008; Abatzoglou et al. 2016; Lutz et al. 2009).
Furthermore, increasing lightning activities could have an influence on further cli-mate change; for instance, warming could intensify (Williams 2012; Price 2013; Sinha

1099Nat Hazards (2018) 91:1097–1112
1 3
and Toumi 1997). Some researchers have suggested that in-cloud electrification and cor-responding lightning activities can influence the climate (Williams 2012); the generated gases such as oxynitride and tropospheric ozone are greenhouse gases that will contribute to further climate change (Price 2013; Sinha and Toumi 1997).
The above discussions indicate that the climate change or warming affects lightning activities and causes CG increase, which has been certified by statistical methods and numerical modeling; although the amount of increase may not be sufficiently large or consistent between areas, the accompanying results, such as lightning-caused forest fire, are likely to produce ecological disasters. In turn, more greenhouse gases will be released by increased lightning activities, which is also likely to accelerate climate warming at the global or regional scale. In brief, there are very close relations between climate change and lightning, or warming and CG.
Based on this relationship, research studies carried out detailed analyses. They found that temperature was the most important factor on CG, and they were in good accord with each other over different temporal scales (Williams 2015); however, at the longer time-scales, a weaker sensitivity relation was observed between them (Pinto and Pinto 2008; Williams 2005). In the northern hemisphere, the change of CG was connected with wet bulb temperature (Reeve and Toumi 2010), and it was also related to season, location, time of day (Price and Rind 1994), precipitation (Sang and Gong 2015), and convective availa-ble potential energy (Romps et al. 2014). Furthermore, CG was relative to quantity of heat, humidity, terrain (Kochtubajda et al. 2006; Liu et al. 2014), in-cloud water content (Zhang et al. 2017), radar echo intensity, and altitude (Mecikalski and Carey 2017).
The situation varied from place to place, but may also have the same trend. Under the background of climate change, the number of CG occurrences also increased in China; the northeast and southwest areas are the main natural forest coverage areas, and an increasing amount of lightning-caused forest fires occurred in these regions. For instance, Heilongji-ang province (which is located in northeast China) had the greatest number of lightning-caused forest fire during 1999–2007 in China, closely followed by Sichuan province (which is located in southwest China) (Wang 2009). Furthermore, the lightning-caused forest fire in Muli county, Sichuan province, accounted for 35% of the total forest fires during 2005–2008 (Deng and Xia 2009). In this paper, we take Muli as an example to analyze the main spatial and temporal distribution of CG and the correlation between CG and climate change.
2 Introduction to the Muli region
The Muli Tibetan autonomous county (100°03′–101°40′E, 27°40′–29°10′N) is located in the southeast margin of the Qinghai–Tibet Plateau and the Hengduan mountains in its center. The administrative region of the county is 13,246.38 km2; it is about 160 km wide from west to east and about 170 km long from north to south. The east crosses Yalong river, west reaches to mount Gongga Mountain, south reaches Jinsha river, and Ganzi is located to its north. The county represents the transition zone between the Yungui Pla-teau and the Qinghai–Tibet Plateau, and the whole county includes three major landforms, namely the mountain plains in the northwest, the deep cut mountain in the southeast, and the mountain in the southwest. Muli county is the largest forestry county in the southwest China; forest resources are rich with a forested land area of 941,400 ha. Within this area, there is a natural forest area of 796,200 ha (85%) and plantation area of 145,200 ha (15%);

1100 Nat Hazards (2018) 91:1097–1112
1 3
the forest coverage is 67.3%, and the living wood growing stock is 177.65 million m3 (Deng 2011). It is not only an important source of water conservation in the upper reaches of the Yangtze river, but also one of the few remaining virgin forests in China.
Along with climate change, forest fires as a very common forest hazards have increased pronouncedly in recent years. The statistics showed that there were 60 times forest fire occurred in this area between 2005 and 2008, 45 of which were identified, while these 45 times, 21 of them was caused by lightning, i.e., CG, accounting for 46.7% (Deng and Xia 2009). For the sake of defense against lightning-caused forest fire, CG should be investi-gated primarily.
3 Data introduction
Two sources of CG data were used in this research. The first was the lightning location system (LLS) data of the Meteorological Observation Center of China Meteorological Administration, from which we can obtain information of CG occurrence time, intensity, and location. However, the LLS is new in China, and the starting year of Muli is 2009, representing only a short time series, so we employed the data of worldwide lightning loca-tion network (WWLLN) to supplement the LLS, jointly investigating CG characteristics in Muli. The WWLLN data began in 2005, and the ending year of both datasets was 2015. Therefore, we received more than 10 years of CG data. However, there are two problems associated with the WWLLN data. Firstly, it includes not only CG information but also in-cloud and cloud-to-cloud lightning, and they cannot be clearly distinguished, so we regarded about a fourth of the data as CG and the remainder as in-cloud or cloud-to-cloud lightning, as averagely cloud flashes are 3 times than that of CG (Rakov et al. 2004). In addition, the detection efficiencies of WWLLN and LLS have increased as the network has grown, and these data have been found to detect nearly every lightning-producing storm (Jacobson et al. 2006), but neither of the two data sources can be considered fully accurate. Therefore, the two sources of data were used to testify each other and analyze on the basis of CG trend rather than specific values. Furthermore, lightning disasters in the Muli natural forest area, mainly showed as forest fire, rarely occurred in summer and winter (Deng and Xia 2009; Deng 2011), so we focused on the time period of spring and autumn. Summer was only considered when we investigated the CG–climate relationship and hourly CG dis-tribution, and winter had no thunderstorms and thus is not considered in this study.
The climate data were taken from the Muli meteorological observation station (since 1960) and included air temperature, precipitation, wind, pressure, and humidity.
4 CG spatial and temporal distribution in Muli
4.1 Temporal distribution
Figure 1 shows the CG distribution from 2005 to 2015; the LLS data in 2013 were miss-ing. This indicates that the number of CG occurrences according to the WWLLN data was larger than that of LLS; the annual total CG number was about 10,000 based on WWLLN and about 8000 according to LLS. Both datasets present a clear increasing trend with R2 (trend line was ignored) values of 0.84 (WWLLN) and 0.49 (LLS) before 2013. After

1101Nat Hazards (2018) 91:1097–1112
1 3
2013, the increasing trend of LLS is less than that of WWLLN. Over the whole time period, WWLLN data show an overall increasing trend (R2 = 0.79).
Excluding the slight decreasing trend in summer, the other three seasons all showed the CG number increasing with time, especially in winter. However, the values were small, even zero, in winter, and no lightning-caused disasters occurred, so winter conditions are not discussed further. Figure 2 shows the CG change in spring and autumn according to the long-term WWLLN dataset; the ordinate represents the monthly average CG number in each season.
An increasing trend was shown in spring (R2 = 0.66) and autumn (R2 = 0.62). Although the LLS data were limited in time period, it showed a similar increasing trend (figure not shown).
The above analyses suggest that CG number has had an increasing trend for nearly 10 years, which was particularly apparent in the spring and autumn.
We employed the LLS data to examine the monthly distribution because its target is to detect CG specifically rather than including in-cloud and cloud-to-cloud lightning observed by WWLLN. As such, the smaller the timescale we research, the more accu-rate the CG provided by LLS. The annual monthly total value distribution is shown in Fig. 3. The maximum occurred in June, and summer (from June to August) was the season with the most frequent CG events (the magnitude was about 2000–3000 each
Fig. 1 CG distribution in 2005–2015 according to the WWLLN and LLS datasets
Fig. 2 CG distribution in spring and autumn during 2005–2015 according to the WWLLN dataset

1102 Nat Hazards (2018) 91:1097–1112
1 3
month), followed in turn by autumn (about 1000 each month), spring (about 300 each month) and winter (< 10 each month). The WWLLN data showed a similar trend (figure not shown).
Furthermore, we analyzed CG number at the hourly timescale in different seasons (Fig. 4). For the reasons discussed above, the LLS data were used rather than the WWLLN. This figure indicates that, in different seasons, CG number in hourly time-scale seems to have a similar trend. There are two peak periods in 1 day. The first was afternoon to night, from about 15:00 (presented throughout as local time, UTC time + 8) to 23:00, accounting for 86.1% of the total in spring, 78.9% in summer, and 60.6% in autumn. The second was the following morning from 00:00 to 05:00; the cor-responding ratio is 9.0, 10.5, and 19.8% in spring, summer, and autumn, respectively. The peak occurred at about 18:00–19:00; the number of CG occurrences in this single hour accounted for 22.6% of the total in spring, 11.6% in summer, and 8.8% in autumn. Moreover, CG occurrences were rare during the morning until noon.
Fig. 3 Monthly distribution of CG based on the LLS data
Fig. 4 Hourly distribution of CG based on the LLS data

1103Nat Hazards (2018) 91:1097–1112
1 3
4.2 Intensity distribution
Although detailed values of CG electric current can be obtained in the LLS dataset, we focused on the change trend, so we set six intensity grades, and found their numerical dis-tribution (Table 1). Most CG was negative CG, accounting for 90.7% of total CG, and the majority of negative CG electric current values were centered between − 60 and − 20 kA (grades 3 and 4), which accounted for nearly 70% of the total negative CG. In contrast, the numerical zones between − 20 and 0 kA (grades 1 and 2) and < − 60 kA (grade 5) were relatively small, each accounting for about 15% of negative CG.
4.3 Spatial distribution
The LLS data were employed to analyze spatial distribution of CG. Of course, different seasons result in different distributions, so we first divided the data by season and focused on the spring and autumn. The annual average spatial distribution in spring (March, April, and May) is shown in Fig. 5. In the figure, the terrain shape in the center is the Liangshan Yi autonomous prefecture, and Muli county is located in the northwest corner, as shown by the boxed area. Furthermore, the numbered locations indicate CG occurrences, and the numerical values represent the CG intensity grades of the event (Table 1).
Studies have already indicated that CG is affected by temperature. In the current study, the first CG occurred in the southeast area of Muli in March (a relatively cold month of spring); however, these occurrences were not located in the south (Fig. 5a) because of the terrain distribution. Most of Muli is mountainous, but the elevation difference is very large; the elevation gradually increases from the southeast to the northwest and the height dif-ference is more than 4000 m. Therefore, a considerable temperature difference is caused by this elevation difference, and in the same season, the warmest area is in the southeast, not the south, and temperature is lowest in the northwest. With gradual warming in April and May (shown in Fig. 5b, c, respectively), the main part of CG gradually began to move southward and, in the whole north area, the number of CG events increased gradually from east to west. This also indicates that the distribution of CG is affected by temperature, topography, and other factors jointly. In terms of the total number of CG events, April is 4.9 times greater than March, and May is 2.9 times greater than April. In addition, the intensity grade is consistent in spring, maintaining at 2, 3, or 4; the majority is 3. As the most frequent month of spring, the CG intensity in May (Fig. 5c) reflects a trend of gradual decrease from the southeast to the northwest, that is from grade 3 to grade 2.
In autumn, September appears to have maintained CG activities throughout Muli (Fig. 6a). In October, CG number in the north decreased clearly to only about 27.2%
Table 1 CG intensity distribution
CG sign Value range (unit: kA) Grade Proportion of total CG (%)
Proportion of negative CG
+ CG > 0 0 9.30 /− CG [− 10, 0] 1 90.70 0.40%
[− 20, − 10] 2 14.10%[− 30, − 20] 3 29.70%[− 60, − 30] 4 38.90%< − 60 5 16.80%

1104 Nat Hazards (2018) 91:1097–1112
1 3
of September and most CG occurrences were located in the south area (Fig. 6b). The intensity grade remained at 3 and 4. And as the most frequent month of autumn, the CG intensity in September (Fig. 6a) reflects a trend of gradual decrease from the east and southeast to the west and north, that is from grade 4 to grade 3.
(a) (b)
(c)
Fig. 5 CG spatial distribution in spring a March, b April, and c May, the boxed area means Muli region
(a) (b)
Fig. 6 CG spatial distribution in autumn, a September, b October, the boxed area means Muli region
1105Nat Hazards (2018) 91:1097–1112
1 3
5 The relationship between climatic factors and CG
The timescale has to be considered when assessing the relationship between climatic factors and CG. The yearly time period is too coarse to analyze in detail, but for hourly timescale, only the LLS data can be used, and thus, the sample quantity will be too small. Therefore, we carefully investigated the monthly timescale here (i.e., the relationship between monthly meteorological factors and CG change), focusing on air temperature and precipitation, which are the most widely assessed climate change factors.
5.1 Air temperature and CG
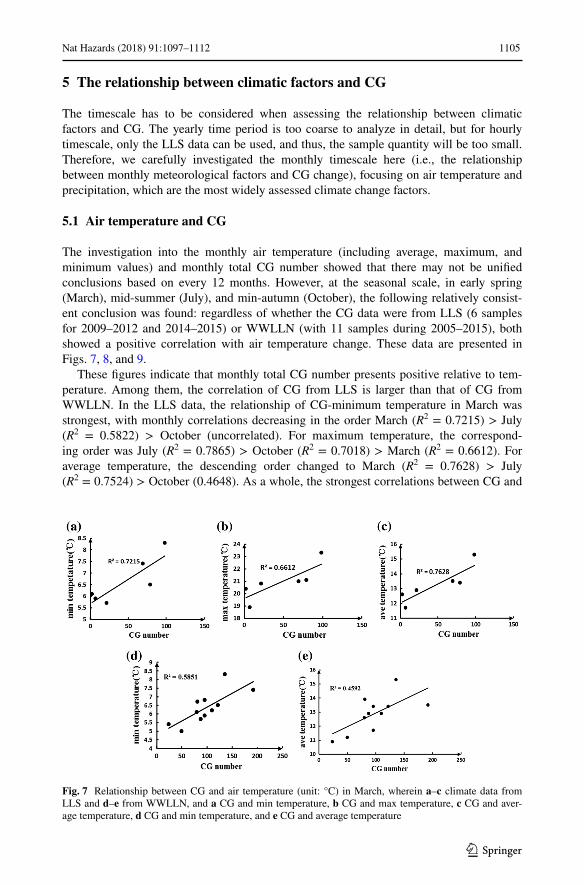
The investigation into the monthly air temperature (including average, maximum, and minimum values) and monthly total CG number showed that there may not be unified conclusions based on every 12 months. However, at the seasonal scale, in early spring (March), mid-summer (July), and min-autumn (October), the following relatively consist-ent conclusion was found: regardless of whether the CG data were from LLS (6 samples for 2009–2012 and 2014–2015) or WWLLN (with 11 samples during 2005–2015), both showed a positive correlation with air temperature change. These data are presented in Figs. 7, 8, and 9.
These figures indicate that monthly total CG number presents positive relative to tem-perature. Among them, the correlation of CG from LLS is larger than that of CG from WWLLN. In the LLS data, the relationship of CG-minimum temperature in March was strongest, with monthly correlations decreasing in the order March (R2 = 0.7215) > July (R2 = 0.5822) > October (uncorrelated). For maximum temperature, the correspond-ing order was July (R2 = 0.7865) > October (R2 = 0.7018) > March (R2 = 0.6612). For average temperature, the descending order changed to March (R2 = 0.7628) > July (R2 = 0.7524) > October (0.4648). As a whole, the strongest correlations between CG and
Fig. 7 Relationship between CG and air temperature (unit: °C) in March, wherein a–c climate data from LLS and d–e from WWLLN, and a CG and min temperature, b CG and max temperature, c CG and aver-age temperature, d CG and min temperature, and e CG and average temperature
1106 Nat Hazards (2018) 91:1097–1112
1 3
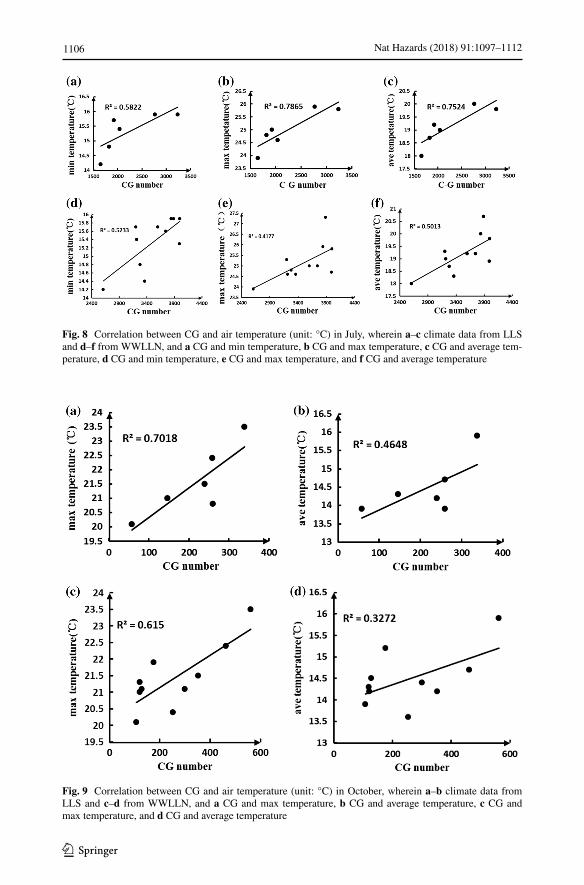
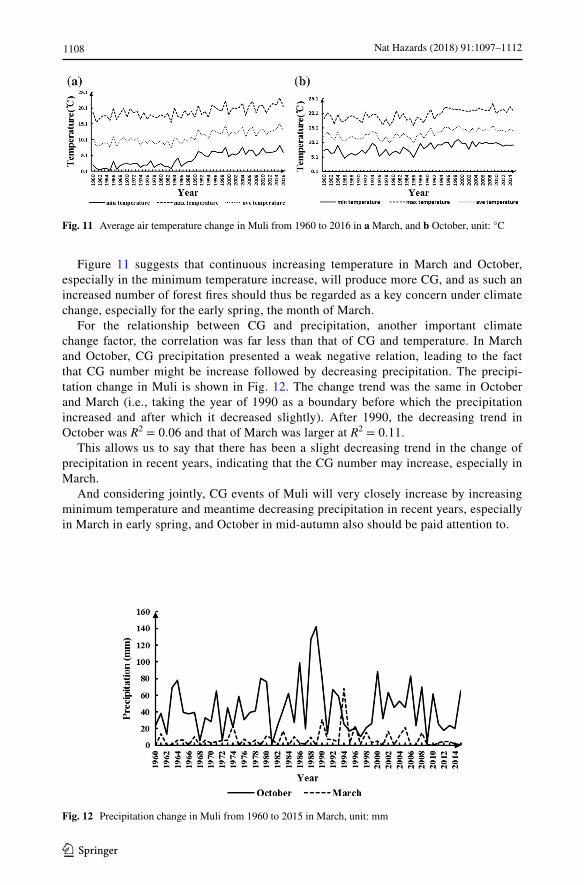
Fig. 8 Correlation between CG and air temperature (unit: °C) in July, wherein a–c climate data from LLS and d–f from WWLLN, and a CG and min temperature, b CG and max temperature, c CG and average tem-perature, d CG and min temperature, e CG and max temperature, and f CG and average temperature
Fig. 9 Correlation between CG and air temperature (unit: °C) in October, wherein a–b climate data from LLS and c–d from WWLLN, and a CG and max temperature, b CG and average temperature, c CG and max temperature, and d CG and average temperature

1107Nat Hazards (2018) 91:1097–1112
1 3
minimum or average temperature both occurred in March, especially for the correlation of CG and minimum temperature. The CG data from WWLLN of March also presented the same conclusion, and the corresponding R2 was 0.5851. The descending order for this dataset was as follows: March (R2 = 0.5851) > July (R2 = 0.5233) > October (uncorre-lated). This clearly indicates that there was a strong positive correlation between CG and minimum temperature.
5.2 Precipitation and CG
In the same way, correlations between CG and precipitation were investigated. In some months, the number of CG occurrences presented positive correlations with precipitation. The greatest correlation was in June and August; however, no lightning-caused forest disas-ters are likely to occur in these months, since summer is a very wet period in south China, and thus, these months were not considered here. As stated above, the focus was on spring and autumn (March and October, respectively) as shown in Fig. 10. Figure 10a presents the CG–precipitation correlation in March with CG from the LLS dataset as the WWLLN dataset showed no clear relation between CG and precipitation in this month. Figure 10b presents the corresponding correlation in October using CG data from WWLLN because the CG–precipitation relationship was unclear in the LLS dataset. According to the cor-relations presented in Fig. 10, R2 was 0.5334 in March and 0.3205 in October, indicating that there were weaker relationships between CG and precipitation than between CG and temperature.
5.3 Temperature and precipitation change and the corresponding CG trend
It is well known that the most outstanding reflection of climate change is the growth of minimum temperature and there is no exception in Muli (Fig. 11). Meteorological obser-vations from 1960 to 2016 were used to show the clear increasing trend of three kinds of temperature: the minimum temperature increases fastest (R2 = 0.771 in March and R2 = 0.476 in October, shown in Fig. 11a, b, respectively, the same below), followed by average temperature (R2 = 0.6084 in March and R2 = 0.443), and the maximum tempera-ture (R2 = 0.4030 in March and R2 = 0.431 in October).
Fig. 10 Correlation between CG and precipitation in a March with CG data from LLS, and b October with CG data from WWLLN
1108 Nat Hazards (2018) 91:1097–1112
1 3
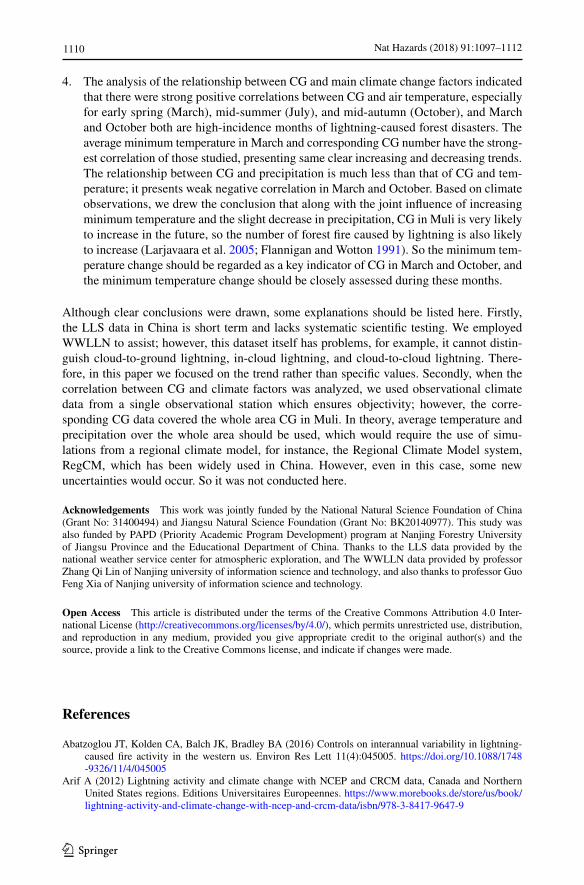
Figure 11 suggests that continuous increasing temperature in March and October, especially in the minimum temperature increase, will produce more CG, and as such an increased number of forest fires should thus be regarded as a key concern under climate change, especially for the early spring, the month of March.
For the relationship between CG and precipitation, another important climate change factor, the correlation was far less than that of CG and temperature. In March and October, CG precipitation presented a weak negative relation, leading to the fact that CG number might be increase followed by decreasing precipitation. The precipi-tation change in Muli is shown in Fig. 12. The change trend was the same in October and March (i.e., taking the year of 1990 as a boundary before which the precipitation increased and after which it decreased slightly). After 1990, the decreasing trend in October was R2 = 0.06 and that of March was larger at R2 = 0.11.
This allows us to say that there has been a slight decreasing trend in the change of precipitation in recent years, indicating that the CG number may increase, especially in March.
And considering jointly, CG events of Muli will very closely increase by increasing minimum temperature and meantime decreasing precipitation in recent years, especially in March in early spring, and October in mid-autumn also should be paid attention to.
Fig. 11 Average air temperature change in Muli from 1960 to 2016 in a March, and b October, unit: °C
Fig. 12 Precipitation change in Muli from 1960 to 2015 in March, unit: mm

1109Nat Hazards (2018) 91:1097–1112
1 3
6 Conclusions and discussion
The main areas of natural forest in China are in the northeast and southwest. In recent years, natural forests have been destroyed under environmental change. Natural haz-ards in forests, such as natural fires with the majority being lightning-caused forest fire, are non-negligible (Lampincabaret et al. 2002). This has been studied much in north-east China, but research in southwest China was limited because of the relatively wet climate. Along with drought and warming, lightning-caused forest fires have become increasingly prevalent in areas of southwest China, such as Sichuan province, such as Muli (Deng and Xia 2009). This paper investigated CG occurrences, one of the most necessary conditions of these natural fires. By assessing the distribution of CG, we indi-cated key spatial and temporal ranges of lightning-caused forest disasters; based on the relationship between CG temperature and CG precipitation, the most sensitive climate change factor on CG was found and possible future change of CG in Muli was also indi-cated. The detailed conclusions are:
1. The CG temporal distribution showed that cloud-to-ground lightning activities increased yearly (2005–2015) in the Muli natural forest area in southwest China. In the spring and autumn period when lightning strikes disasters (especially for lightning-caused forest fire) are relatively frequent, CG number also increased yearly. On a monthly basis, summer (June, July, and August) was the main season for CG events, followed by autumn (September, October, and November) and spring (March, April, and May), whereas CG in winter remained rare. Furthermore, at the daily timescale, there were two peaks in every lightning strike day (i.e., the local time 15:00–23:00 and 00:00–05:00, and the number of CG events at local time 15:00–23:00 was substantially greater than at 00:00–05:00, with a peak number occurring at 18:00–19:00). For Muli, CG disasters should be actively defended against in spring and autumn, because lightning-caused for-est disasters cannot easily occur in summer under the wet conditions. On lightning strike days, afternoon and before dawn should be the important defense periods, especially for time period of 18:00–19:00.
2. The CG intensity distribution suggested that most CG was negative CG, accounting for more than 90% of total CG, and the electric current of these negative CG events was between grades 3 and 4 (absolute value was between 20 to 60 kA). This not very large, not very small range accounted for nearly 70% of total negative CG occurrences is likely to be the main part of lightning that could cause disasters.
3. The CG spatial distribution was divided by season, and this research focused on spring and autumn. For spring (March–May), the CG occurrences initially took place in the southeast low elevation area, then gradually extended to the high elevation area of northwest Muli, indicating that CG distribution was affected not only by temperature but by terrain. For autumn, from September to October, the distribution center of CG gradually shifted from the whole area of Muli to southeast low elevation area. While whether in spring or in autumn, the intensity grade of CG remained between 2 and 4, and other grades did not appear. In relative warm months in each season, CG high inten-sity grade, such as grades 3 and 4, were easily concentrated in the east (September of autumn, mainly for the grade 4) and the southeast (May in spring, mainly for the grade 3) region. On the whole, CG events were concentrated in the southeast in both spring and in autumn and moved to northwest gradually with warming. This should be paid attention under CG disaster defense.
1110 Nat Hazards (2018) 91:1097–1112
1 3
4. The analysis of the relationship between CG and main climate change factors indicated that there were strong positive correlations between CG and air temperature, especially for early spring (March), mid-summer (July), and mid-autumn (October), and March and October both are high-incidence months of lightning-caused forest disasters. The average minimum temperature in March and corresponding CG number have the strong-est correlation of those studied, presenting same clear increasing and decreasing trends. The relationship between CG and precipitation is much less than that of CG and tem-perature; it presents weak negative correlation in March and October. Based on climate observations, we drew the conclusion that along with the joint influence of increasing minimum temperature and the slight decrease in precipitation, CG in Muli is very likely to increase in the future, so the number of forest fire caused by lightning is also likely to increase (Larjavaara et al. 2005; Flannigan and Wotton 1991). So the minimum tem-perature change should be regarded as a key indicator of CG in March and October, and the minimum temperature change should be closely assessed during these months.
Although clear conclusions were drawn, some explanations should be listed here. Firstly, the LLS data in China is short term and lacks systematic scientific testing. We employed WWLLN to assist; however, this dataset itself has problems, for example, it cannot distin-guish cloud-to-ground lightning, in-cloud lightning, and cloud-to-cloud lightning. There-fore, in this paper we focused on the trend rather than specific values. Secondly, when the correlation between CG and climate factors was analyzed, we used observational climate data from a single observational station which ensures objectivity; however, the corre-sponding CG data covered the whole area CG in Muli. In theory, average temperature and precipitation over the whole area should be used, which would require the use of simu-lations from a regional climate model, for instance, the Regional Climate Model system, RegCM, which has been widely used in China. However, even in this case, some new uncertainties would occur. So it was not conducted here.
Acknowledgements This work was jointly funded by the National Natural Science Foundation of China (Grant No: 31400494) and Jiangsu Natural Science Foundation (Grant No: BK20140977). This study was also funded by PAPD (Priority Academic Program Development) program at Nanjing Forestry University of Jiangsu Province and the Educational Department of China. Thanks to the LLS data provided by the national weather service center for atmospheric exploration, and The WWLLN data provided by professor Zhang Qi Lin of Nanjing university of information science and technology, and also thanks to professor Guo Feng Xia of Nanjing university of information science and technology.
Open Access This article is distributed under the terms of the Creative Commons Attribution 4.0 Inter-national License (http://creativecommons.org/licenses/by/4.0/), which permits unrestricted use, distribution, and reproduction in any medium, provided you give appropriate credit to the original author(s) and the source, provide a link to the Creative Commons license, and indicate if changes were made.
References
Abatzoglou JT, Kolden CA, Balch JK, Bradley BA (2016) Controls on interannual variability in lightning-caused fire activity in the western us. Environ Res Lett 11(4):045005. http s://doi.org/10.1088 /1748 -9326 /11/4/0450 05
Arif A (2012) Lightning activity and climate change with NCEP and CRCM data, Canada and Northern United States regions. Editions Universitaires Europeennes. http s://www.more book s.de/stor e/us/book /ligh tnin g-acti vity -and-clim ate-chan ge-with -ncep -and-crcm -data /isbn /978-3-8417 -9647 -9

1111Nat Hazards (2018) 91:1097–1112
1 3
Deng YM (2011) Discussion on forest fire saving tactics in Muli. Des Sichuan For Surv 3:56–59 (in Chinese)
Deng XW, Xia XZ (2009) Forest fire condition analysis and defense in Muli. Sichuan For Technol 30(6):126–130 (in Chinese)
Fisher J, Hoole PRP, Pirapaharan K, Thirukumaran S, Hoole SRH (2014) Cloud to ground and ground to cloud flashes in lightning protection: and future severe lightning and climate change. In: 2014 interna-tional conference on lightning protection (ICLP), Shanghai, pp 440–445. http s://doi.org/10.1109 /iclp .2014 .6973 164
Flannigan MD, Wotton BM (1991) Lightning-ignited forest fires in northwestern Ontario. Can J For Res 21(3):277–287. http s://doi.org/10.1139 /x91-035
Flannigan MD, Bergeron Y, Engelmark O, Wotton BM (1998) Future wildfire in circumoral forests in rela-tion to global warming. J Veg Sci 9(4):469–476. http s://doi.org/10.2307 /3237 261
Flannigan MD, Kochtubajda B, Logan KA (2008) Forest fires and climate change in the northwest ter-ritories. In: Cold region atmospheric and hydrologic studies. The Mackenzie GEWEX experience. Springer, Berlin, pp 403–418. http s://link .spri nger .com/cont ent/pdf/10.1007 %2F97 8-3-540-7393 6-4.pdf
Guo FX, Chen C, Ju X (2014) Response of lightning, NO and O3 to climate anomaly in China. Light Prot IEEE. http s://doi.org/10.1109 /ICLP .2014 .6973 185
Jacobson AR, Holzworth R, Harlin J, Dowden R, Lay E (2006) Performance assessment of the world wide lightning location network (wwlln), using the los alamos sferic array (lasa) as ground truth. J Atmos Ocean Technol 23(23):700–705. http s://doi.org/10.1175 /JTEC H190 2.1
Kochtubajda B, Flannigan M, Gyakum J, Stewart R, Logan K, Nguyen T (2006) Lightning and fires in the northwest territories and responses to future climate change. Arctic 59(2):211–221. http ://www.jsto r.org/stab le/4051 2795
Krause A, Kloster S, Wilkenskjeld S, Paeth H (2014) The sensitivity of global wildfires to simulated past, present, and future lightning frequency. J Geophys Res Biogeosci 119(3):312–322. http s://doi.org/10.1002 /2013 JG00 2502
Lampincabaret C, Jappiot M, Alibert N, Manlay R, Guillande R,Viegas DX (2002) Prototype of an intensity scale for the natural hazard: forest fire. In: Forest fire research and wildland fire safety. Proceedings of IV international conference on forest fire research 2002 wildland fire safety summit, Luso, Coimbra, Portugal, pp 18–23 November. http ://www.mill pres s.nl/shop /aboo ks/ICFF R4/pdf/157.pdf
Larjavaara M, Pennanen J, Tuomi TJ (2005) Lightning that ignites forest fires in finland. Agric For Meteorol 132(3):171–180. http s://doi.org/10.1016 /j.agrf orme t.2005 .07.005
Liu YL, Chan LY, Lin Qinhao, Feng Wanxing, Bi Xinhui, Chen Jiahong, Tao Hantao, Wang Xinming, Chen Duohong, Sheng Guoying, Jiamo Fu (2014) Physical and observable characteristics of cloud-to-ground lightning over the pearl river delta region of south china. J Geophys Res Atmos 119(10):5986–5999. http s://doi.org/10.1002 /2014 JD02 1559
Lutz JA, Wagtendonk JWV, Thode AE, Miller JD, Franklin JF (2009) Climate, lightning ignitions, and fire severity in Yosemite national park, California, USA. Int J Wildland Fire 18(7):765–774. http s://doi.org/10.1071 /WF08 117
Mecikalski RM, Carey LD (2017) Lightning characteristics relative to radar, altitude and temperature for a multicell, MCS and supercell over northern Alabama. Atmos Res 191:128–140. http s://doi.org/10.1016 /j.atmo sres .2017 .03.001
Pinto O, Pinto IRCA (2008) On the sensitivity of cloud-to-ground lightning activity to surface air tempera-ture changes at different time scales in São Paulo, Brazil. J Geophys Res Atmos 113(D20):347–348. http s://doi.org/10.1029 /2008 JD00 9841
Price C (2009a) Thunderstorms, lightning and climate change/lightning: principles, instruments and appli-cations. Springer, Berlin, pp 521–535. http s://doi.org/10.1007 /978-1-4020 -9079 -0
Price C (2009b) Will a drier climate result in more lightning? Atmos Res 91(2):479–484. http s://doi.org/10.1016 /j.atmo sres .2008 .05.016
Price C (2013) Lightning applications in weather and climate research. Surv Geophys 34(6):755–767. http s://doi.org/10.1007 /s107 12-012-9218 -7
Price C, Rind D (1994) Possible implications of global climate change on global lightning distributions and frequencies. J Geophys Res Atmos 99(D5):10823–10831. http s://doi.org/10.1029 /94JD 0001 9
Rakov VA, Uman MA, Raizer PY (2004) Lightning: physics and effects. Phys Today 57:63–64. http s://doi.org/10.1063 /1.1878 338
Reeve N, Toumi R (2010) Lightning activity as an indicator of climate change. Q J R Meteorol Soc 125(555):893–903. http s://doi.org/10.1002 /qj.4971 2555 507
1112 Nat Hazards (2018) 91:1097–1112
1 3
Romps DM, Seeley JT, Vollaro D, Molinari J (2014) Climate change projected increase in lightning strikes in the united states due to global warming. Science 346(6211):851–854. http s://doi.org/10.1126 /scie nce.1259 100
Sang LI, Gong D (2015) Statistical characteristics and variations of thunderstorm frequency in south China from 1980 to 2010. Plateau Meteorol 34(2):503–514. http s://doi.org/10.7522 /j.issn .1000 -0534 .2013 .0017 1 (in Chinese)
Sinha A, Toumi R (1997) Tropospheric ozone, lightning, and climate change. J Geophys Res Atmos 102(D9):10667–10672. http s://doi.org/10.1029 /96JD 0371 0
Tippett MK, Allen JT, Gensini VA, Brooks HE (2015) Climate and hazardous convective weather. Curr Clim Change Rep 1(2):60–73. http s://doi.org/10.1007 /s406 41-015-0006 -6
Wang MY (2009) Forest fire response characteristics and change trend under the background of climate change. Dissertation, Chinese Academy of Forestry Sciences, pp 82–100
Williams ER (2005) Lightning and climate: a review. Atmos Res 76(1):272–287. http s://doi.org/10.1016 /j.atmo sres .2004 .11.014
Williams ER (2012) Lightning and climate/American Geophysical Union Fall Meeting. AGU Fall Meeting Abstracts. Bibliographic Code: 2012AGUFMAE31A..01 W
Williams ER (2015) Electricity in the atmosphere global electrical circuit. Encycl Atmos Sci 67(385):1–8. http s://doi.org/10.1016 /B978 -0-12-3822 25-3.0014 4-4
Wotton M, Logan K, Mcalpine R(2005) Climate change and the future fire environment in Ontario: fire occurrence and fire management impacts. Climate change research report—Ontario Forest Research Institute. http ://www.clim ateo ntar io.ca/MNR_Publ icat ions /2769 20.pdf
Zhang T, Guo Z, Wei C, Yi G, Hai Y, Zhou F (2017) Relationships between cloud-to-ground flashes and hydrometeors in a thunderstorm in Fujian province. J Atmos Solar Terr Phys 154:226–235. http s://doi.org/10.1016 /j.jast p.2015 .11.007