Embed Size (px)
Citation preview

Youth’07 The Health and Wellbeing of Secondary School Students in New Zealand
November 2010
Students Who Truant:What Makes a Difference?
Title: Youth’07: The health and wellbeing of secondary school students in New Zealand. Students who truant: What makes a difference?
ISBN 978-0-473-18052-2 (paperback)
ISBN 978-0-473-18053-9 (electronic)
To be referenced as:
Denny, S., Galbreath, R.A., Grant, S. & Milfont, T.L. (2010). Youth’07: The health and wellbeing of secondary school students in New Zealand. Students who truant: What makes a difference? Auckland. The University of Auckland.
The AHRG investigators on the Youth’07 project are:
Simon Denny, Terry Fleming, Peter Watson Department of Community Paediatrics,
Shanthi Ameratunga, Elizabeth Robinson, Jennifer UtterSection of Epidemiology & Biostatistics, School of Population Health
Terryann Clark, Robyn DixonSchool of Nursing
Sue CrengleTe Kupenga Hauora Māori, School of Population Health
Sally MerryWerry Centre for Child and Adolescent Mental Health, Department of Psychological Medicine.
David Schaaf Pacific Health, School of Population Health
Acknowledgements
A big thank-you to the students and staff who participated in the survey. Without your patience and help the Youth’07 Health and Wellbeing Survey would not have been possible.
Also to the Youth’07 project team: Sue Grant, Ruth Herd, Taciano Milfont, Siosaia Helu, Catherine Jackson and Tania Milne. We would also like to thank Val Grey for her help in preparing this report.
The Youth’07 project was funded by the Health Research Council of New Zealand (grant 05/216), the Department of Labour, Families Commission, Accident Compensation Corporation of New Zealand, Sport and Recreation New Zealand, the Alcohol Advisory Council of New Zealand, and the Ministries of Youth Development, Justice, and Health. Support for the electronic communication of the Youth’07 project was provided by Vodafone New Zealand.
This report was funded by a grant from the Ministry of Youth Development.
All photographs in this report are used with the permission of the young people involved.
Contact details:
Dr Simon Denny (Principal Investigator)
Adolescent Health Research Group
School of Population Health
Tamaki Campus
The University of Auckland
Private Bag 92019, Victoria Street West
Auckland, 1142
Phone: 09 373 7599 ext 89400
Email: [email protected]
Further publications by the AHRG are available at www.youth2000.ac.nz.
1
YOUTH’07
The Health and Wellbeing of Secondary School Students in New Zealand
Students Who Truant:
What makes a difference?
Table of contents
Introduction.......................................................................................................... .2
The.survey............................................................................................................. .3
. Demographic.measures................................................................................ .3
. Measuring.truancy........................................................................................ .3
Results................................................................................................................... .4
. Another.way.of.looking.at.truancy.rates.................................................... .5
. Analysing.students’.emotional.and.behavioural.symptoms.
. and.their.associations.with.truanting......................................................... .5
. School.structure.and.truanting.revisited.................................................... .8
. Other.school.factors...................................................................................... .8
. School.climate.and.truanting....................................................................... .9.
Conclusions:.positives.and.negatives.and.what.they.mean......................... 11
Summary............................................................................................................... 11
Appendix:.Questionnaire.wording.of.school.climate.measures................... 12
2
Young.people.who.truant.are.a.problem.for.schools,.for.the.community,.and.especially.for.themselves...By.absenting.themselves.from.school.they.risk.missing.out.on.their.education,.getting.into.trouble.on.the.streets,.and.facing.future.problems.as.a.consequence.
What.can.be.done.about.it?.What.might.work.to.reduce.truanting?
How.much.is.truanting.influenced.by.school.factors.–.the.way.a.school.is.run,.the.way.teachers.relate.to.students,.the.whole.social.and.educational.atmosphere.of.the.school?
On.the.other.hand,.how.much.is.truanting.determined.by.student.factors.–.the.personal.propensities.and.problems.of.the.individual.student?
Research.internationally.suggests.that.a.combination.of.both.school.and.student.factors.influence.truanting.behaviours.among.students..In.this.report.we.look.at.school.factors,.student.factors,.and.the.interplay.between.them.–.whether.different.students.respond.differently.to.school.factors..In.practical.terms,.do.the.strategies.that.schools.might.use.to.reduce.truanting.work.the.same.for.different.kinds.of.students?.
We.investigated.this.by.analysing.information.drawn.from.Youth’07,.the.large.national.survey.of.secondary.school.students.throughout.New.Zealand.that.we.carried.out.in.2007.
.
Introduction

3
Youth’07.surveyed.9,107.randomly-chosen.students.from.96.randomly-chosen.schools..This.represented.about.3%.of.the.total.New.Zealand.secondary.school.roll.in.2007..Students.answered.questions.about.a.wide.range.of.issues.relating.to.their.health.and.wellbeing..For.this.report.we.have.drawn.on.the.results.from.questions.relating.to.basic.demographic.information.(age,.gender,.ethnicity,.and.socio-economic.factors),.school.attendance,.emotional.wellbeing,.relations.with.staff.and.students.at.school,.and.the.general.school.‘climate’.
At.the.same.time.we.surveyed.2,901.teachers.in.the.same.96.participating.schools.about.their.school.climate.–.what.the.school.was.like.and.what.supports.there.were.for.students.and.teachers..
Participation.in.the.student.and.teacher.surveys.was.voluntary,.and.we.took.care.to.ensure.confidentiality.so.that.no.participant.or.school.would.be.identifiable..For.details.of.how.the.survey.was.carried.out.see.the.Youth’07.reports.available.on.www.youth2000.ac.nz
Demographic measuresStudents.were.asked.their.age,.gender.and.ethnicity..Students.who.indicated.more.than.one.ethnicity.were.assigned.to.one.ethnic.group.by.the.prioritisation.procedure.used.by.Statistics.New.Zealand.in.the.2005.census..Apart.from.a.slightly.raised.percentage.of.male.students,.the.students.surveyed..were.similar.demographically.to.the.national.population.of.secondary.school.students.in.New.Zealand.
The.socio-economic.status.of.each.student.was.determined.based.on.their.answers.to.questions.about.how.often.they.moved.home;.how.often.their.parents.worried.about.having.enough.money.to.buy.food;.whether.their.family.had.a.car,.telephone,.mobile.phone,.computer/laptop.or.television;.and.whether.people.in.their.home.slept.in.rooms.other.than.bedrooms.(garage,.caravan,.living.room.etc)..These.results.were.combined.with.a.standard.measure.of.socio-economic.deprivation.for.the.student’s.home.
The survey
neighbourhood,.the.New.Zealand.Deprivation.Score.2006.(NZDep),.which.is.based.on.census.information.for.each.neighbourhood.
Note.that.NZDep.scores.are.calculated.in.a.similar.way,.using.the.same.census.data,.as.school.decile.ratings,.except.that.NZDep.is.scaled.in.the.opposite.direction–a.high.NZ.Deprivation.score.corresponds.to.a.low School.Decile.rating.
Measuring truancyStudents.were.asked.‘This.year.have.you.wagged.or.skipped.school.for.a.full.day.or.more.without.an.excuse?’.Students.who.answered.‘yes’.were.asked.a.further.question:.‘About.how.many.days.altogether.have.you.wagged.or.skipped.school.this.year?’,.with.response.options.‘1.to.2.days’,.‘3.to.9.days’,.‘10.to.20.days’,.‘more.than.20.days’,.‘not.sure’...As.the.survey.was.conducted.at.different.schools.at.various.dates.from.March.through.to.October,.different.criteria.for.‘truancy’.in.terms.of.the.number.of.days.away.in.that.school.year.were.used:.students.who.were.surveyed.in.March.and.April.were.counted.as.truant.if.they.indicated.they.had.skipped.one.or.more.days.that.year;.students.surveyed.from.May.through.to.September.were.counted.as.truant.if.they.had.skipped.three.or.more.days;.and.students.surveyed.in.October.if.they.had.skipped.ten.or.more.days.in.that.school.year..
The.particular.definition.of.‘truancy’.we.are.using.has.thus.been.determined.by.the.exigencies.of.our.survey.results,.and.may.be.slightly.different.from.the.definitions.used.elsewhere..Consequently,.the.results.we.give.for.truancy.rates.may.not.be.exactly.comparable.with.those.in.other.reports..However,.the.results.for.absolute.levels.of.truancy.are.less.important.than.the.comparative.results.–.the.comparisons.of.truancy.rate.between.different.kinds.of.schools.and.different.kinds.of.students.–.and.these.do.have.more.general.validity..When.we.indicate.that.some.factor.is.associated.with.a.decrease.in.truancy,.then.this.should.hold.true.for.truancy.however.it.is.measured.

4
Truancy.rates.of.students,.broken.down.by.demographic.factors,.are.given.in.Table.1..This.gives,.for.each.category.of.student,.the.percentage.who.had.truanted,.and.the.confidence.interval.for.that.percentage.result.(ie.the.interval.within.which.we.can.be.95%.confident.that.the.‘true’.rate.of.truanting.for.all.students.of.that.category.lies)..When.making.comparisons.between.results.for.two.different.ages,.genders.etc,.if.their.confidence.intervals.do.not.overlap.then.the.difference.between.them.is.significant.at.the.5%.level.–.ie.likely.to.be.a.real.difference.
Looking.first.at.all.students.in.all.schools,.15%.of.secondary.school.students.reported.truanting.as.defined.above..
Breaking.this.down.to.look.at.truancy.rates.for.different.categories.of.students,.we.find.that.male.and.female.students.had.similar.truancy.rates,.but.older.students.were.more.likely.to.truant.than.younger.students;.Maori.and.Pacific.students.were.more.likely.to.truant.than.NZ.European.and.Asian.students;.and.students.from.more.socio-economically.deprived.backgrounds.were.more.likely.to.truant.than.students.from.less.deprived.backgrounds..
Table 1: Rates of truanting among different categories of students
Category of student Truancy rate%..(95%.Confidence...Interval)
All.students.(n=.8628) 15.4.(14.0.-.16.8)
Age
13.years.and.younger ..8.5.(7.2.-.9.8)
14 12.6.(11.1.-.14.0)
15 16.0.(14.4.-.17.7)
16 19.9.(17.9.-.21.8)
17.years.and.older 22.1.(19.9.-.24.3)
Gender
Female 15.5.(13.6.-.17.3)
Male 15.3.(13.8.-.16.9)
Ethnicity
Māori 27.6.(24.8.-.30.4)
Pacific 21.1.(17.9.-.24.2)
Asian 10.6.(8.8.-.12.4)
NZ.European/.Other 11.7.(10.4.-.13.0)
Level of socio-economic deprivation*i....(low.deprivation;.equivalent.......to.high.decile)
12.2.(10.8.-.13.5)
ii 12.9.(11.5.-.14.3)
iii 15.1.(13.6.-.16.6)
iv..(high.deprivation) 21.6.(19.9.-.23.4)*Note.that.this.scale.runs.in.the.opposite.direction.to.school....decile.rating
Then.if.we.look.at.truancy.rates.in.different.categories.of.schools.(see.Table.2),.we.find.that.students.at.co-educational.schools.were.more.likely.to.truant.than.students.at.single-sex.schools;.students.at.publicly-funded.schools.were.more.likely.to.truant.than.students.at.privately-funded.schools;.students.at.low.decile.schools.(ie.coming.from.neighbourhoods.of.high.deprivation).were.more.likely.to.truant.than.students.from.high.decile.schools;.and.students.at.larger.schools.were.more.likely.to.truant.than.students.at.small.schools..
Results

5
Table 2: Rates of truanting at different categories of school
Category of schoolRate of truancy among students in these schools%..(95%.Confidence.Interval)
All.schools.(N=.96) 14.6.(13.1.-.16.1)
Gender composition
Co-educational 16.5.(14.9.-.18.1)
Single.sex 12.8.(10.5.-.15.2)
Funding source
Public 16.7.(15.3.-.18.2)
Private ..9.2.(4.0.-.14.4)
Integrated ..9.7.(6.9.-.12.5)
Location
Rural 13.7.(11.5.-.16.0)
Urban 15.5.(14.1.-.17.0)Socio-economic composition(school decile rating)Decile.8.-.10 14.0.(12.0.-.16.1)
Decile.4.-.7 15.6.(13.7.-.17.4)
Decile.1.-.3.(high.deprivation) 20.2.(17.5.-.22.9)
Size (school roll)
0.-.301 11.1.(8.4.-.13.8)
301.-.584 12.4.(9.5.-.15.3)
584.-.927 16.7.(13.8.-.19.6)
>.927 16.4.(14.4.-.18.3)
Another way of looking at truancy ratesThe.variations.in.truancy.rates.between.different.demographic.subgroups.of.students,.and.between.different.types.of.school,.have.been.pointed.out.many.times..The.Ministry.of.Education.in.its.reports.on.‘Attendance,.Absence.and.Truancy.in.New.Zealand.Schools’.regularly.notes.the.same.patterns.in.truancy.rates.between.different.types.of.schools..
But.looking.at.the.situation.this.way.is.not.very.helpful.–.especially.if.you.are.trying.to.deal.with.truanting.at.a.large,.co-educational,.low.decile,.publicly-funded.secondary.school..Pointing.out.these.disparities.does.not.help.understand.the.problem.or.suggest.what.approaches.or.interventions.might.be.used.to.reduce.truancy.
We.looked.at.the.results.in.another.way..We.looked.at.other.properties.of.students.and.of.schools.that.might.influence.a.student’s.propensity.to.truant..
Looking.first.at.students,.we.examined.whether.students.with.behavioural.problems.were.more.likely.to.truant..In.our.survey.the.best.indicator.of.behavioural.problems.was.part.of.a.wider.measure.of.emotional.and.behavioural.health.and.stability,.and.so.we.looked.at.emotional.as.well.as.behavioural.factors.
Analysing students’ emotional and behavioural symptoms and their associations with truantingThe.Youth’07.survey.included.one.of.the.standard.tools.used.to.assess.symptoms.of.emotional.and.behavioural.problems.among.young.people:.the.Strengths.and.Difficulties.Questionnaire,.or.SDQ..The.SDQ.covers.emotional.symptoms,.impulsive/aggressive.behaviour.problems,.hyperactivity-inattention.symptoms,.problems.with.peer.relationships,.and.pro-social.strengths..It.has.been.well.validated.as.a.screening.instrument.in.many.different.communities.and.populations.of.young.people..
We.analysed.the.SDQ.results.for.the.students.surveyed.in.Youth’07,.using.a.statistical.technique.called.latent.class.analysis.to.separate.out.different.groups.of.students.on.the.basis.of.their.levels.of.emotional.health.concerns.and.behaviour.problems,.and.their.propensity.to.truant.
This.analysis.separated.out.four.distinct.groups.or.clusters.of.students..While.these.groups.or.clusters.are.statistical.constructs.they.do.tell.us.something.important.about.real.students.and.their.different.behaviours.and.responses.

6
Table 3: Different groups of students based on their levels of emotional health concerns and behavioural problems, and their propensity to truant
Group 1(‘Mainstream’)
Group 2(‘Problem behaviour’)
Group 3(‘Anxious/
depressed’)
Group 4(‘Compound’)
Proportion.of.all.students: 45% 25% 20% 10%
Truanting behaviours
Rate.of.truanting: 6% 25% 16% 42%
Strengths and Difficulties scales
Emotional.symptoms: low low very.high high
Impulsive/aggressive.behaviour.problems:
low high high very.high
Hyperactivity/inattention.problems:
low high high very.high
Peer.problems: low high high very.high
Gender balance:
both mainly.male mainly.female both
Socio-economic background
%.from.high.deprivation.(ie.‘low.decile’).backgrounds:
14% 26% 28% 36%

7
1. The ‘mainstream’ group.makes.up.the.bulk.of.students.(45%.of.our.sample).and.are.those.without.any.significant.emotional.health.symptoms,.behaviour.problems,.hyperactivity-inattention.symptoms.or.peer.problems...These.are.the.ordinary.students,.the.ones.with.few.problems,.who.have.friends,.get.on.with.others,.and.generally.pay.attention.in.class..They.do.sometimes.skip.school,.but.only.occasionally.–.in.our.sample.their.rate.of.truancy.was.6%..
2. The ‘problem behaviour’ group.makes.up.about.a.quarter.of.students.(25%.of.our.sample).and.are.those.without.significant.emotional.health.symptoms,.but.with.moderately.high.levels.of.behaviour.problems,.hyperactivity-inattention.symptoms,.and.problems.with.peer.relationships..They.are.predominantly.male.and.are.twice.as.likely.as.‘mainstream’.students.to.come.from.backgrounds.of.high.levels.of.deprivation.
. The.‘problem.behaviour’.students.are.usually.boys;.they.are.often.impulsive.and.inattentive,.and.their.aggressive.behaviour.makes.them.few.friends.and.gets.them.into.trouble..These.students.are.much.more.likely.to.truant.–.in.our.sample.their.rate.of.truancy.was.25%,.four.times.higher.than.that.of.the.‘mainstream’.students.
3. The ‘anxious/depressed’ group.makes.up.about.a.fifth.of.students.(20%.of.our.sample).and.are.those.with.very.high.levels.of.emotional.health.symptoms,.along.with.moderately.high.levels.of.behaviour.problems,.hyperactivity-inattention.symptoms.and.problems.with.peer.relationships..They.are.predominantly.female.and,.like.the.‘problem.behaviour’.group,.they.are.twice.as.likely.as.‘mainstream’.students.to.come.from.backgrounds.of.high.levels.of.deprivation.
. The.‘anxious/depressed’.students.are.usually.girls;.they.have.difficulties.with.anxiety,.depression.or.other.emotional.problems.and.are.also.often.impulsive,.not.very.attentive,.and.don’t.get.on.easily.with.others.in.the.class..These.students.are.also.much.more.likely.to.truant.–.in.our.sample.their.rate.of.truancy.was16%,.nearly.three.times.higher.than.that.of.the.‘mainstream’.students..
4. The ‘compound’ group.are.the.small.number.of.students.(10%.of.our.sample).with.all.the.problems.of.both.the.previous.two.groups.combined:.very.high.levels.of.behaviour.problems,.hyperactivity-inattention.symptoms,.and.peer.relationship.problems;.and.high.levels.of.emotional.health.symptoms.as.well..They.include.both.males.and.females,.and.are.even.more.likely.than.the.‘problem.behaviour’.and.‘anxious/depressed’.students.to.come.from.backgrounds.of.high.levels.of.deprivation...
. The.‘compound’.students.are.those.with.the.highest.levels.of.emotional.and.behavioural.problems:.they.are.often.aggressive.and.destructive,.can’t.concentrate.in.class,.don’t.have.friends.to.help.them.and.keep.getting.into.trouble..These.students.very.often.truant.–.in.our.sample.their.rate.of.truancy.was.42%,.seven.times.higher.than.that.of.the.‘mainstream’.students..
. These.students.pose.the.greatest.challenge.for.schools:.they.truant.often,.but.their.behaviour.makes.them.so.difficult.and.unpopular.that.the.classroom.is.likely.to.be.easier.for.teachers.and.for.other.students.without.them..
As.the.above.analysis.makes.clear,.students.are.not.all.the.same.in.their.tendency.to.truant..The.students.with.emotional.or.behavioural.problems.truant.more,.and.those.students.with.high.levels.of.both.emotional.and.behavioural.problems.truant.the.most..
When.we.separate.out.these.different.groups.of.students.and.look.again.at.the.effects.of.school.variables,.then.a.rather.different.pattern.comes.into.focus.

8
School structure and truanting revisitedFirst,.looking.again.at.the.different.‘structural’.categories.of.schools,.we.recall.that.when.the.students.were.considered.a.whole,.comparisons.between.different.types.of.school.showed.distinct.differences.in.truancy.rates..However,.when.comparisons.between.schools.are.made.for.each.of.the.groups.of.students.separately,.most.of.those.apparent.differences.in.truancy.rates.between.schools.of.different.types.disappear..There.were.no.differences.in.truanting.in.single-sex.compared.to.co-educational.schools,.or.in.schools.of.different.socio-economic.composition.(ie.low.decile.compared.to.high.decile).in.any.of.the.groups.of.students..Truanting.was.slightly.higher.in.public.than.in.private.schools.among.‘mainstream’.students,.but.not.among.‘problem.behaviour’,.‘anxious/depressed’,.or.‘compound’.students..Truanting.was.higher.in.urban.than.in.rural.schools.among.‘anxious/depressed’.students,.but.not.among.any.of.the.other.groups.of.students..The.only.factor.where.there.was.a.significant.difference.in.more.than.one.of.the.four.groups.of.students.was.in.school.size:.truanting.was.higher.in.large.schools.than.in.smaller.schools.among.‘mainstream’.and.‘problem.behaviour’.students,.but.not.among.‘anxious/depressed’.or.‘compound’.students.
When.we.checked.the.numbers.of.students.in.each.group.at.schools.of.different.types.we.confirmed.what.many.school.principals.will.have.suspected:.that.the.publicly.funded,.co-educational,.and.especially.the.low.decile.schools.have.disproportionately.more.of.the.‘problem.behaviour’.and.‘compound’.students..
It.thus.appears.that.the.higher.overall.rates.oftruancy.seen.at.publicly.funded,.co-educational,or.low.decile.schools.are.largely.becausethese.schools.have.more.of.the.students.withemotional.and.behavioural.problems,.whotruant.more.often..
However,.this.does.not.explain.all.the.differences.between.schools,.in.particular.the.difference.between.larger.and.smaller.schools...There.are.evidently.other.factors.at.play.as.well..What.other.factors.that.vary.between.schools.might.influence.truanting.among.their.students?
Other school factorsResearchers.who.have.investigated.truancy.have.argued.that.it.is.influenced.by.the.social.and.educational.atmosphere.at.the.school.–.or.what.is.often.referred.to.as.the.school.‘climate’..Researchers.have.looked.at.one.aspect.of.school.climate.in.particular.and.argued.that.truancy.is.indicative.of.students.not.being.engaged.at.school,.either.socially.or.academically..As.the.Youth’07.survey.confirmed,.one.of.the.main.reasons.young.people.enjoy.school.and.want.to.attend.school.is.for.the.social.connectedness.–.to.be.with.their.friends.there..Therefore,.the.researchers.argue,.students.without.friends.at.school,.who.do.not.have.that.social.connection.or.engagement,.will.be.those.more.likely.to.truant..Academic.engagement.is.a.separate.but.related.notion,.associated.with.academic.achievement,.educational.stability,.positive.schooling.experience.and.supportive.relationships.with.teachers..Students.who.are.academically.engaged.gain.enjoyment.and.satisfaction.from.their.learning.and.again.would.therefore.be.less.likely.to.truant.
Various.other.factors.that.have.been.suggested.as.influences.on.truanting.behaviour.can.also.be.seen.as.aspects.of.the.school.climate:.high.academic.expectations.of.students,.positive.teacher-student.relationships,.student.participation.in.sports,.arts.or.cultural.activities,.the.level.of.safety.of.students.at.the.school,.and.the.availability.of.resources.for.students.with.behaviour.problems.and.health.concerns..We.examined.a.range.of.these.factors,.based.on.Youth’07.survey.data.for.students’.perceptions.and.on.the.associated.survey.of.teachers.for.their.perceptions.of.the.climate.at.the.same.schools..
9
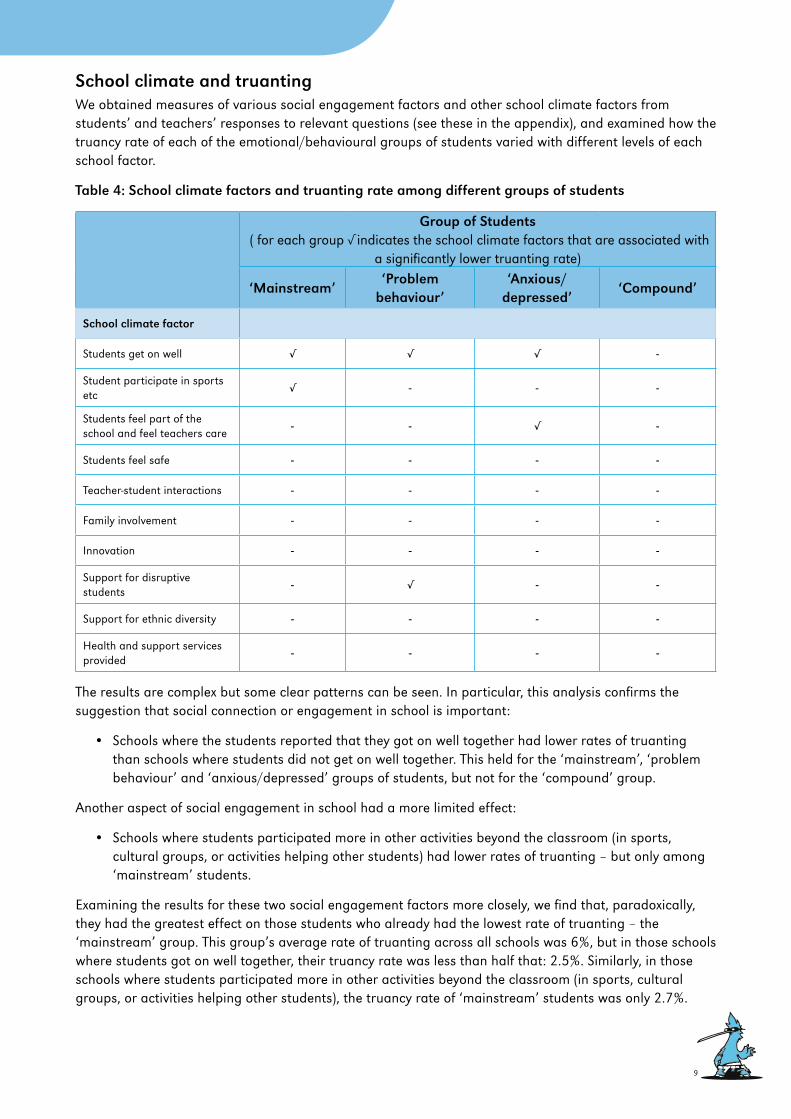
School climate and truanting We.obtained.measures.of.various.social.engagement.factors.and.other.school.climate.factors.from.students’.and.teachers’.responses.to.relevant.questions.(see.these.in.the.appendix),.and.examined.how.the.truancy.rate.of.each.of.the.emotional/behavioural.groups.of.students.varied.with.different.levels.of.each.school.factor..
Table 4: School climate factors and truanting rate among different groups of students
Group of Students.(.for.each.group.√.indicates.the.school.climate.factors.that.are.associated.with.
a.significantly.lower.truanting.rate)
‘Mainstream’‘Problem
behaviour’‘Anxious/
depressed’‘Compound’
School climate factor
Students.get.on.well √ √ √ -
Student.participate.in.sports.etc
√ - - -
Students.feel.part.of.the.school.and.feel.teachers.care
- - √ -
Students.feel.safe - - - -
Teacher-student.interactions - - - -
Family.involvement - - - -
Innovation - - - -
Support.for.disruptive.students
- √ - -
Support.for.ethnic.diversity - - - -
Health.and.support.services.provided
- - - -
The.results.are.complex.but.some.clear.patterns.can.be.seen..In.particular,.this.analysis.confirms.the.suggestion.that.social.connection.or.engagement.in.school.is.important:
•. Schools.where.the.students.reported.that.they.got.on.well.together.had.lower.rates.of.truanting.than.schools.where.students.did.not.get.on.well.together..This.held.for.the.‘mainstream’,.‘problem.behaviour’.and.‘anxious/depressed’.groups.of.students,.but.not.for.the.‘compound’.group..
Another.aspect.of.social.engagement.in.school.had.a.more.limited.effect:.
•. Schools.where.students.participated.more.in.other.activities.beyond.the.classroom.(in.sports,.cultural.groups,.or.activities.helping.other.students).had.lower.rates.of.truanting.–.but.only.among.‘mainstream’.students.
Examining.the.results.for.these.two.social.engagement.factors.more.closely,.we.find.that,.paradoxically,.they.had.the.greatest.effect.on.those.students.who.already.had.the.lowest.rate.of.truanting.–.the.‘mainstream’.group..This.group’s.average.rate.of.truanting.across.all.schools.was.6%,.but.in.those.schools.where.students.got.on.well.together,.their.truancy.rate.was.less.than.half.that:.2.5%..Similarly,.in.those.schools.where.students.participated.more.in.other.activities.beyond.the.classroom.(in.sports,.cultural.groups,.or.activities.helping.other.students),.the.truancy.rate.of.‘mainstream’.students.was.only.2.7%..
10
The.effect.of.these.social.engagement.factors.was.smaller.with.the.‘problem.behaviour’.and.‘anxious/depressed’.groups.of.students,.and.they.had.no.effect.at.all.on.the.highest-truanting.‘compound’.group.
Some.of.the.other.school.climate.factors.we.looked.at.had.limited.effects:.
•. Schools.where.students.felt.part.of.the.school.and.felt.that.teachers.cared.about.them,.treated.them.fairly,.and.expected.them.to.do.well.had.lower.rates.of.truanting.–.but.only.among.‘anxious/depressed’.students.
•. Schools.where.teachers.reported.that.they.made.greater.efforts.to.address.the.needs.of.disruptive.students.had.lower.rates.of.truanting.by.‘problem.behaviour’.students.(who.were.indeed.disruptive.students).
However,.many.of.the.school.climate.factors.that.we.looked.at.were.not.associated.with.any.significant.reductions.in.truanting.rates.at.all..These.included.one.factor.reported.on.by.students.(whether.they.felt.safe.at.the.school),.and.four.factors.reported.on.by.teachers.(whether.the.school.had.open.teacher-student.interactions,.encouraged.family.involvement.in.the.school,.supported.ethnic.diversity,.or.provided.health.and.support.services.for.students)..These.factors.did.not.appear.to.reduce.truanting.among.any.of.the.groups.of.students.
Altogether,.the.results.confirm.that.some.aspects.at.least.of.student.social.engagement.are.important.–.schools.where.students.get.on.well.together.have.reduced.rates.of.truancy.among.most.of.their.students,.with.the.reductions.in.truancy.generally.being.greater.among.the.lowest-truanting.‘mainstream’.students,.and.with.no.reduction.at.all.among.the.highest-truanting.‘compound’.students...Schools.where.students.participated.in.activities.beyond.the.classroom.and.where.they.felt.that.teachers.cared.about.them.and.expected.them.to.do.well.–.such.schools.also.had.lower.rates.of.truancy,.although.only.among.particular.groups.of.students.
With.these.results.in.mind.we.can.look.again.at.the.differences.in.truancy.rates.between.different.categories.of.school,.in.particular.between.small.and.large.schools..
When.we.look.at.student.social.connection.in.schools.of.different.size,.it.is.probably.no.surprise.that.students.at.small.schools,.on.average,.reported.that.they.got.on.together.better.than.students.at.large.schools.did..So.the.difference.in.truancy.rates.between.small.and.large.schools.can.be.explained,.at.least.in.part,.by.the.greater.social.connection.that.comes.more.easily.in.a.smaller.school.

11
Conclusions: positives and negatives and what they meanSo.far.we.have.concentrated.on.the.positive.results.–.the.combinations.of.school.factors.and.student.factors.where.there.are.lower.rates.of.truancy..But.there.is.also.an.important.negative.result..For.the.‘compound’.students,.those.with.the.highest.levels.of.emotional.and.behavioural.problems,.not.one.of.the.school.factors.we.examined,.neither.the.school.structural.factors.nor.any.of.the.school.climate.factors.–.not.even.the.engagement.factors.–.had.any.significant.effect.on.their.truanting..
For.these.students,.changes.in.school.policies,.practices.or.approaches.have.little.effect;.instead,.these.students.need.individual.treatment..They.need.intensive.targeted.mental.health.services.to.provide.treatment.for.their.emotional.health.concerns.and.behavioural.problems.
This.highlights.the.importance.of.evaluating.students.with.school.attendance.problems.for.mental.health.disorders..Given.that.none.of.the.approaches.available.to.schools.–.modifying.the.school.structure.or.school.climate.–.appear.to.make.much.difference.with.students.with.high.levels.of.emotional.and.behavioural.problems,.it.is.important.that.there.are.mental.health.services.for.these.students..Effective.interventions.are.available.for.their.emotional.health.concerns.and.behavioural.problems..
However,.for.most.students,.those.who.don’t.have.major.emotional.or.behavioural.issues,.the.social.climate.at.the.school.does.make.a.difference..Schools.that.foster.positive.student.relationships.and.high.levels.of.participation.in.school.activities.do.keep.these.students.more.engaged,.and.truanting.less.
SummaryThe.main.conclusions.of.this.report.can.be.simply.summed.up:
•.Students.differ.considerably.in.their. propensity.to.truant.–.students.with.. emotional.or.behavioural.problems.are. much.more.likely.to.truant.than.students.. without.such.problems.
•.Most.of.the.apparent.contrasts.between.. truanting.rates.at.different.types.of.. schools.(private.vs.publicly-funded;.. single-sex.vs.co-educational;.high.vs.low.. socio-economic.decile).are.explained.by. the.higher.proportions.of.students.with.. emotional.and.behavioural.problems.. at.publicly-funded,.co-educational,.low-.. decile.schools.
•.Most.students.–.those.with.low.to. moderate.emotional.or.behavioural.. problems.–.are.less.likely.to.truant.from.. schools.where.students.get.on.well.. together,.join.in.activities.beyond.the.. classroom,.and.feel.part.of.the.school... School.policies.which.enhance.this.. climate.of.connection.and.engagement.. are.likely.to.reduce.truanting.among.. these.students.
•.However,.this.is.not.the.case.with.. students.with.high.levels.of.both.emotional.. and.behavioural.problems..They.are.very. likely.to.truant.from.any.type.or.condition.. of.school,.whether.there.is.a.climate.. encouraging.engagement.or.not..For.. these.students,.targeted.mental.health.. services.are.needed.to.provide.treatment.. for.their.emotional.health.concerns.and.. behavioural.problems.
Conclusions &summary
12
Appendix: Questionnaire wording of school climate measures
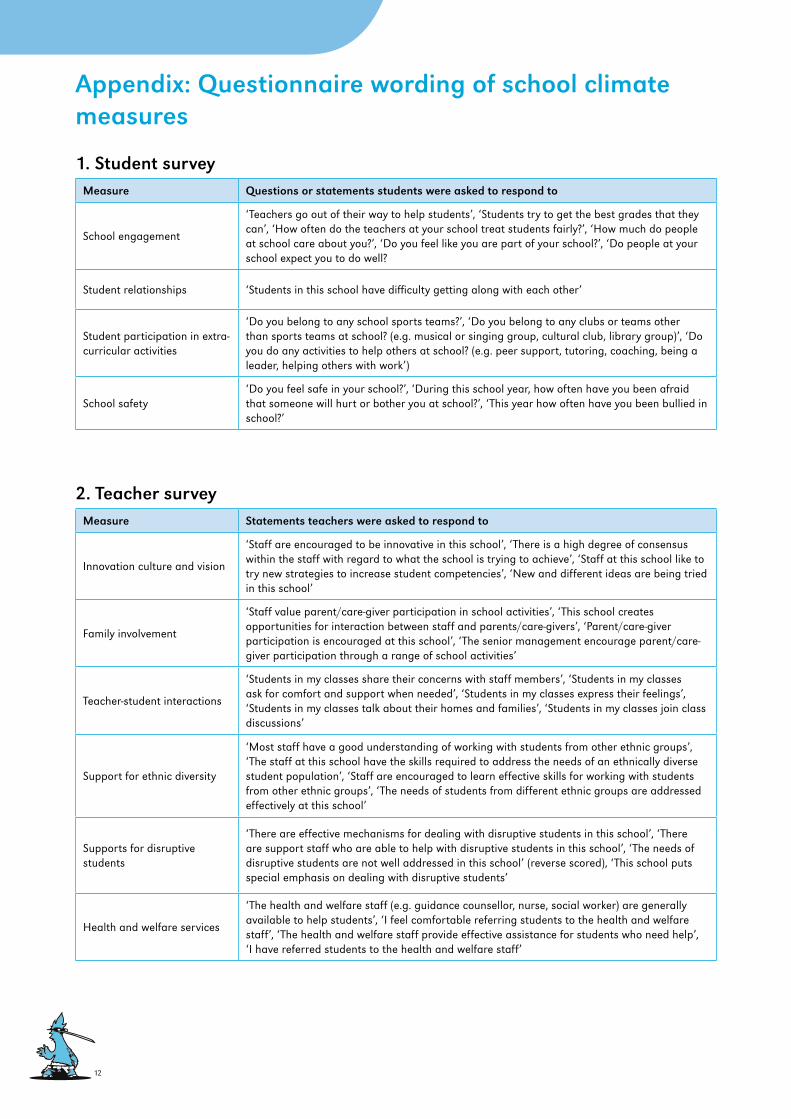
1. Student surveyMeasure Questions or statements students were asked to respond to
School.engagement
‘Teachers.go.out.of.their.way.to.help.students’,.‘Students.try.to.get.the.best.grades.that.they.can’,.‘How.often.do.the.teachers.at.your.school.treat.students.fairly?’,.‘How.much.do.people.at.school.care.about.you?’,.‘Do.you.feel.like.you.are.part.of.your.school?’,.‘Do.people.at.your.school.expect.you.to.do.well?.
Student.relationships ‘Students.in.this.school.have.difficulty.getting.along.with.each.other’.
Student.participation.in.extra-curricular.activities
‘Do.you.belong.to.any.school.sports.teams?’,.‘Do.you.belong.to.any.clubs.or.teams.other.than.sports.teams.at.school?.(e.g..musical.or.singing.group,.cultural.club,.library.group)’,.‘Do.you.do.any.activities.to.help.others.at.school?.(e.g..peer.support,.tutoring,.coaching,.being.a.leader,.helping.others.with.work’)
School.safety‘Do.you.feel.safe.in.your.school?’,.‘During.this.school.year,.how.often.have.you.been.afraid.that.someone.will.hurt.or.bother.you.at.school?’,.‘This.year.how.often.have.you.been.bullied.in.school?’.
2. Teacher surveyMeasure Statements teachers were asked to respond to
Innovation.culture.and.vision
‘Staff.are.encouraged.to.be.innovative.in.this.school’,.‘There.is.a.high.degree.of.consensus.within.the.staff.with.regard.to.what.the.school.is.trying.to.achieve’,.‘Staff.at.this.school.like.to.try.new.strategies.to.increase.student.competencies’,.‘New.and.different.ideas.are.being.tried.in.this.school’.
Family.involvement
‘Staff.value.parent/care-giver.participation.in.school.activities’,.‘This.school.creates.opportunities.for.interaction.between.staff.and.parents/care-givers’,.‘Parent/care-giver.participation.is.encouraged.at.this.school’,.‘The.senior.management.encourage.parent/care-giver.participation.through.a.range.of.school.activities’.
Teacher-student.interactions
‘Students.in.my.classes.share.their.concerns.with.staff.members’,.‘Students.in.my.classes.ask.for.comfort.and.support.when.needed’,.‘Students.in.my.classes.express.their.feelings’,.‘Students.in.my.classes.talk.about.their.homes.and.families’,.‘Students.in.my.classes.join.class.discussions’.
Support.for.ethnic.diversity
‘Most.staff.have.a.good.understanding.of.working.with.students.from.other.ethnic.groups’,.‘The.staff.at.this.school.have.the.skills.required.to.address.the.needs.of.an.ethnically.diverse.student.population’,.‘Staff.are.encouraged.to.learn.effective.skills.for.working.with.students.from.other.ethnic.groups’,.‘The.needs.of.students.from.different.ethnic.groups.are.addressed.effectively.at.this.school’.
Supports.for.disruptive.students
‘There.are.effective.mechanisms.for.dealing.with.disruptive.students.in.this.school’,.‘There.are.support.staff.who.are.able.to.help.with.disruptive.students.in.this.school’,.‘The.needs.of.disruptive.students.are.not.well.addressed.in.this.school’.(reverse.scored),.‘This.school.puts.special.emphasis.on.dealing.with.disruptive.students’.
Health.and.welfare.services
‘The.health.and.welfare.staff.(e.g..guidance.counsellor,.nurse,.social.worker).are.generally.available.to.help.students’,.‘I.feel.comfortable.referring.students.to.the.health.and.welfare.staff’,.‘The.health.and.welfare.staff.provide.effective.assistance.for.students.who.need.help’,.‘I.have.referred.students.to.the.health.and.welfare.staff’.
Adolescent Health Research Groupwww.youth2000.ac.nz
Proudly printed by