Embed Size (px)
Citation preview
Youth Career Selection in Secondary Schools,
an Antiguan & Barbudan Case Study.
by
Antigua & Barbuda Council on Sustainable Development
(ABCoSD) November
13th 2015.

Copyright 2015 ABCoSD. All rights reserved. Page 1 of 18
ACKNOWLEDGEMENTS
This paper would not be possible without the efforts of the members of the Antigua & Barbuda Council on Sustainable
Development and the support of the Ministry of Education, principals, teachers and students of all the participatory secondary
schools in Antigua and Barbuda.
Special thanks to the corporate patronage of Colombian Emeralds International, CJC Jenkins Design and stellar guidance
provided by the Antigua Coalition of Service Industries Inc., Antigua and Barbuda Statistical Division and Human Resource
Professionals of Antigua & Barbuda, with special mention Dr. Gale Archibald.

Copyright 2015 ABCoSD. All rights reserved. Page 2 of 18
“Education is the key to the future: You've heard it a million times, and it's not wrong. Educated people have higher wages and
lower unemployment rates, and better-educated countries grow faster and innovate more than other countries. But going to
college is not enough. You also have to study the right subjects.”
Alex Tabarrok.
Copyright 2015 ABCoSD. All rights reserved. Page 3 of 18
Glossaries
Anticipatory Socialisation – is the process, facilitated by
social interactions, in which non-group-members learn to take
on the values and standards of groups that they aspire to join,
so as to ease their entry into the group and help them interact
competently once they have been accepted by it.
Social Capital – refers to the collective value of all
"social networks" [who people know] and the inclinations that
arise from these networks to do things for each other [norms of
reciprocity].
Youth – individuals with ages ranging from 15 to 24 [1];
additionally referred to “transition from childhood to adulthood”,
expanding the demographic to 14 to 30 years of age [7].
Overview
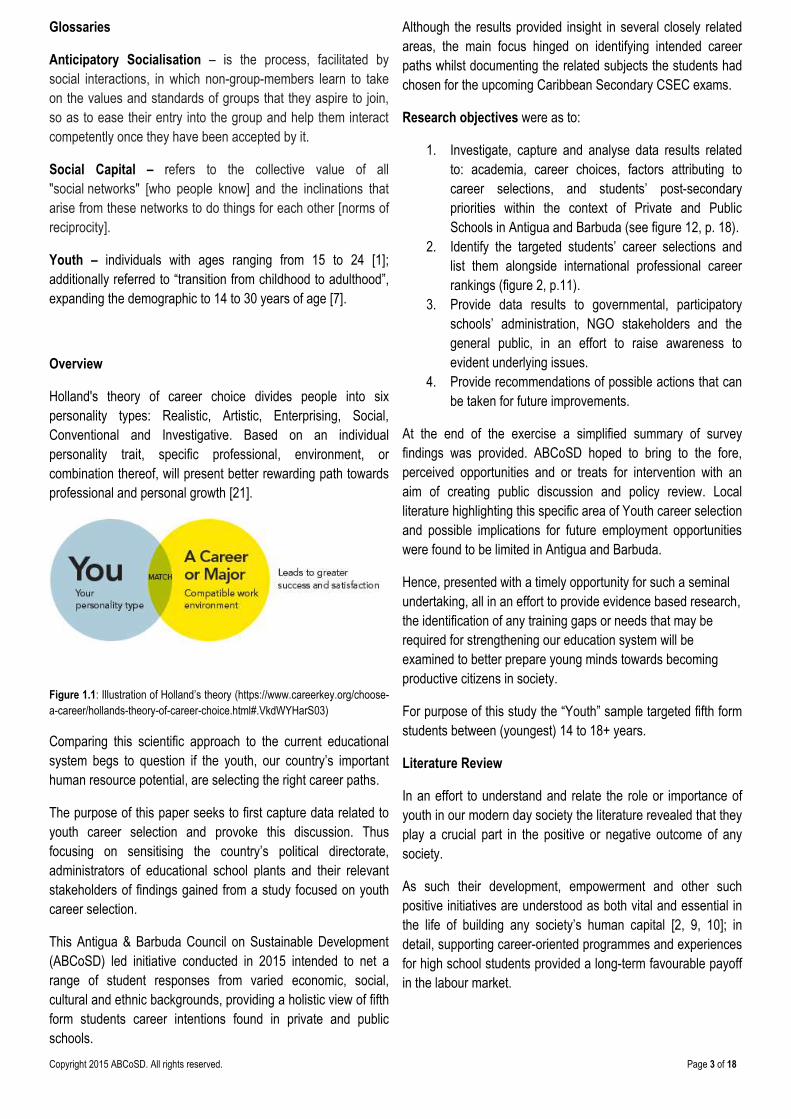
Holland's theory of career choice divides people into six
personality types: Realistic, Artistic, Enterprising, Social,
Conventional and Investigative. Based on an individual
personality trait, specific professional, environment, or
combination thereof, will present better rewarding path towards
professional and personal growth [21].
Figure 1.1: Illustration of Holland’s theory (https://www.careerkey.org/choose-
a-career/hollands-theory-of-career-choice.html#.VkdWYHarS03)
Comparing this scientific approach to the current educational
system begs to question if the youth, our country’s important
human resource potential, are selecting the right career paths.
The purpose of this paper seeks to first capture data related to
youth career selection and provoke this discussion. Thus
focusing on sensitising the country’s political directorate,
administrators of educational school plants and their relevant
stakeholders of findings gained from a study focused on youth
career selection.
This Antigua & Barbuda Council on Sustainable Development
(ABCoSD) led initiative conducted in 2015 intended to net a
range of student responses from varied economic, social,
cultural and ethnic backgrounds, providing a holistic view of fifth
form students career intentions found in private and public
schools.
Although the results provided insight in several closely related
areas, the main focus hinged on identifying intended career
paths whilst documenting the related subjects the students had
chosen for the upcoming Caribbean Secondary CSEC exams.
Research objectives were as to:
1. Investigate, capture and analyse data results related
to: academia, career choices, factors attributing to
career selections, and students’ post-secondary
priorities within the context of Private and Public
Schools in Antigua and Barbuda (see figure 12, p. 18).
2. Identify the targeted students’ career selections and
list them alongside international professional career
rankings (figure 2, p.11).
3. Provide data results to governmental, participatory
schools’ administration, NGO stakeholders and the
general public, in an effort to raise awareness to
evident underlying issues.
4. Provide recommendations of possible actions that can
be taken for future improvements.
At the end of the exercise a simplified summary of survey
findings was provided. ABCoSD hoped to bring to the fore,
perceived opportunities and or treats for intervention with an
aim of creating public discussion and policy review. Local
literature highlighting this specific area of Youth career selection
and possible implications for future employment opportunities
were found to be limited in Antigua and Barbuda.
Hence, presented with a timely opportunity for such a seminal
undertaking, all in an effort to provide evidence based research,
the identification of any training gaps or needs that may be
required for strengthening our education system will be
examined to better prepare young minds towards becoming
productive citizens in society.
For purpose of this study the “Youth” sample targeted fifth form
students between (youngest) 14 to 18+ years.
Literature Review
In an effort to understand and relate the role or importance of
youth in our modern day society the literature revealed that they
play a crucial part in the positive or negative outcome of any
society.
As such their development, empowerment and other such
positive initiatives are understood as both vital and essential in
the life of building any society’s human capital [2, 9, 10]; in
detail, supporting career-oriented programmes and experiences
for high school students provided a long-term favourable payoff
in the labour market.
Copyright 2015 ABCoSD. All rights reserved. Page 4 of 18
Literature Review cont’d
Despite this acknowledgement [8] insufficient Youth
interventions to combat major problems (for example present
and future unemployment) still remains a significant global
challenge.
Statistically speaking this challenge goes far, as written in detail
by the Saldru Research Brief in December 2013, expressing
that the Youth make up 25% of the world’s working population
yet account for 47% of those unemployed.
The disadvantage continues, with students choosing to leave
school early (due to lack of a stable family support system) in
today’s competitive employment environment. This makes
these youth vulnerable to instances of poverty, social exclusion,
and future unemployment leading to prospects of life in crime
[14, 15, 16, 17].
Trends over the last decade of youth unemployment
demonstrate the numbers have been steadily rising [1]; further
enhanced by the after effects of the World Financial Crisis 2008
and previously less than desirable employment conditions.
These aforementioned exponential effects can compound
systems which already suffered from lack of focus and sufficient
planning [6,9]; resulting in a significant number of students
graduating unprepared for postsecondary education or the
world of work.
Quite, pointedly, literature surrounding Youth Unemployment
resulted in being non-exhaustive, which is a cause for concern.
One such manifestation is found in the United Nations World
Youth Report of 2013. In summary, the report speaks to
opportunities becoming less available for the young people in
their country of birth; who then are pulled to cities or migrating
to countries with perceived greater job opportunities; a finality of
such actions separating themselves from their families and
social support networks with no guarantees of meaningful
employment for the expanding pool of young skilled graduates
[2, 7]. The Caribbean is not exempted from these issues [7].
This is not to suggest the problem is additional and ubiquitous
to early childhood education. Similar to other developed
countries, notable attention contextually has been paid to early
childhood development programmes [18].
By observation, the youth appear not sufficiently informed for
post high school career ventures based on various experiences
in multiple secondary career day interventions.
All, however, is not lost and remedies are possible. According
to scholarly references an effective integrated academic and
career oriented curriculum programme is one viable option.
These career programmes within secondary school’s curriculum
can commence very early and positively impact a young
person’s sense of direction and meaning in life [4].
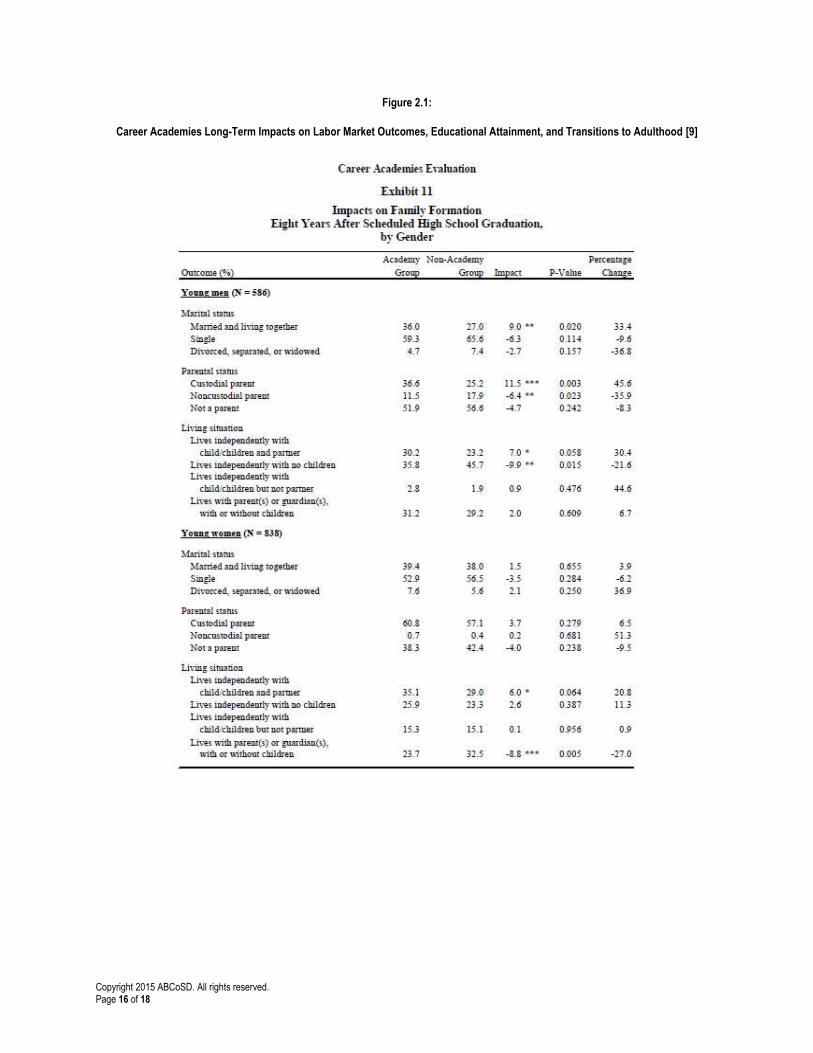
One such example [9] speaks to findings derived from a case
study focused on nine schools in urban districts in the United
States, with conclusions providing evidence that increased
investments in career-related experiences during high school
will improve student’s postsecondary labour market prospects
and subsequent societal benefits (see figure 2.1, p.16).
As with the case study, the school’s curriculum design and
administrators along with parents are responsible for ensuring
that young people are supported and informed of strategies,
resources and pathways that will increase their likelihood of
entering into meaningful employment or continue further aligned
education.
The aforementioned should be combined with a stable
environment in the home. Socially, the importance of providing
a stable environment, mentorship, effective careers and
transition pathways, especially for those at risk of dropping out
or disassociating with career and employment networks also
becomes key.
In the meantime the demands on employment entry standards
are not dissipating, but rather remaining competitive.
Employers have been continually demanding human resource
potentials and assets which will add value to their companies,
boosting capital and marketability [18]. As new companies
emerge and current ones expand to meet global demands and
competition grows.
Research Methodology:
The aim of this research centres on providing current
information as to the subject matter of youth career selection.
Gathering substantial data to validate this paper took a route of
a quantitative form of data collection; questionnaires.
As it pertains to the structure of the questionnaire, a total of 11
questions were asked ranging from: subjects selected for
CSEC; desired career choice; career exposure; counselling
services; intention post-secondary school; age and gender etc.
These questions were designed as sub research questions,
correlating to the first research objective.
The questionnaires were administered to a cluster sample
targeting only fifth form students in all Antigua and Barbuda’s
secondary schools.
Whilst third form can be considered a crucial point for selecting
subjects this form was not targeted. The rational was that
preparation and readiness for future college, university, work
and career ventures and ultimately professional employment
generally begins with a better level of maturity at this point [9].
Copyright 2015 ABCoSD. All rights reserved. Page 5 of 18
Research Methodology cont’d
The data collected was then aggregated revealing: nine
individual Private Secondary and 11 individual Public
Secondary Schools’ participation.
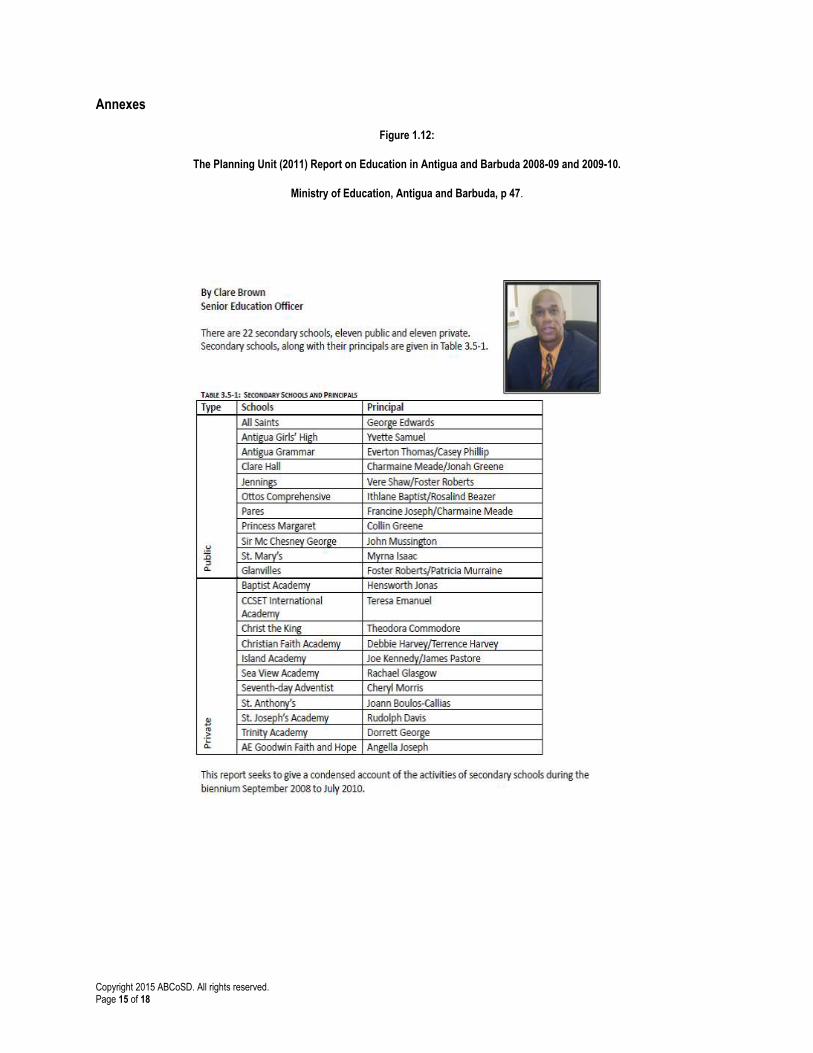
This represents 91% of the total number of secondary schools
as per overall figure provided by The Planning Unit (2011)
Report on Education in Antigua and Barbuda 2008-09 and
2009-10 (see figure 1.12).
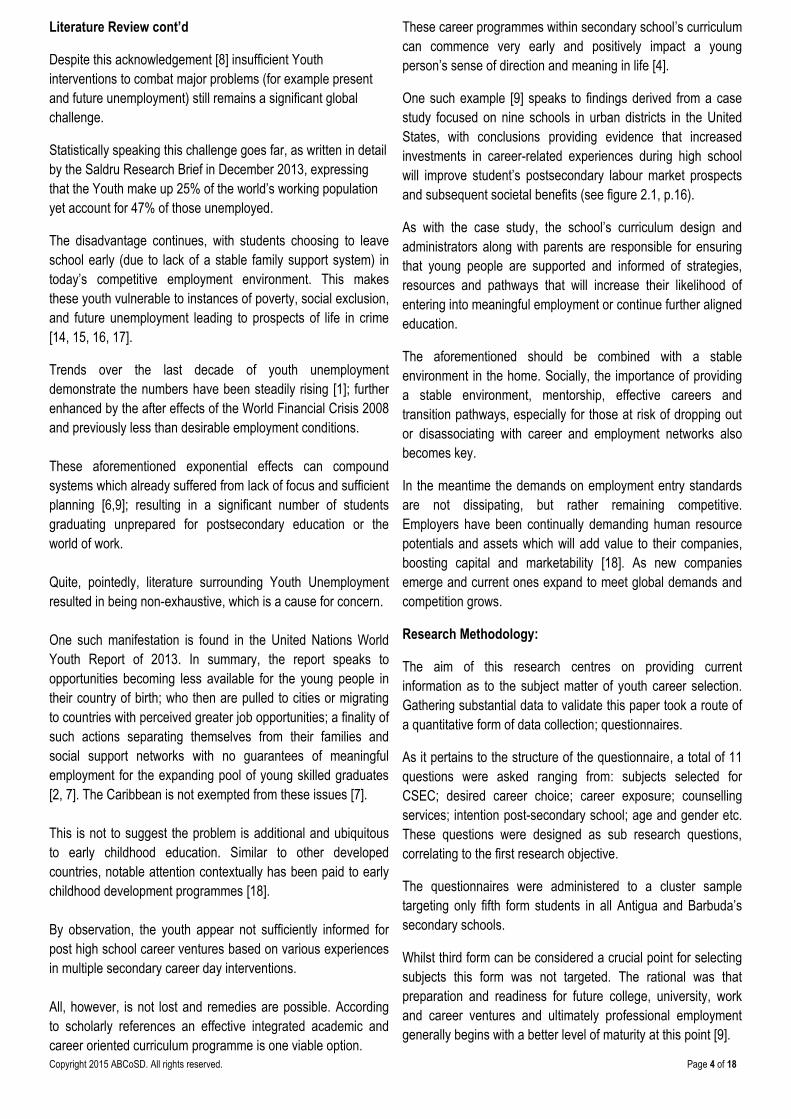
As it speaks to data validity, researchers Yehuda Baruch &
Brooks C. Holtom found an average response rate for studies
that utilized data collected from individuals being 52.7% with a
standard deviation of 20.4 and data collected from
organizations was 35.7% with a standard deviation of 18.8.
ABCoSD research capturing 78% indicates an overall
quantitative research statistical significance for an overall
sample student population of 1249 individuals, a confidence
interval (margin of error) of 2.19 and a confidence level of 99%
due to a sample size of 980 obtained.
Figure 1.2: Sample size calculator at Creative Research Systems
(http://www.surveysystem.com/sscalc.htm)
The data collected was ranked, analysed and subsequently
aligned to popular internet sites job market assessment from
the US and UK’s (see figure 1.8) similarly to the US Bureau of
Labor Statistics found at: www.bls.gov.
This paper was then presented to education stakeholders (to
include NGOs) and published for public consumption and
discussions.
By intention, it was not the aim to compare private against
public, nor one school against the next. For this reason, a
number system was assigned to each participatory school to
facilitate a reasonable confidentiality; and to be assessed from
a collective point of view. The entire survey and data collection
process began in March 2015 and ended in the first week of
November 2015. The results of the information garnered from
the exercise should be considered factual based on the
scientific process used.
Data Results & Findings
By way of summary and as previously mentioned, the survey
consists of 11 multiple choice questions covering the specific
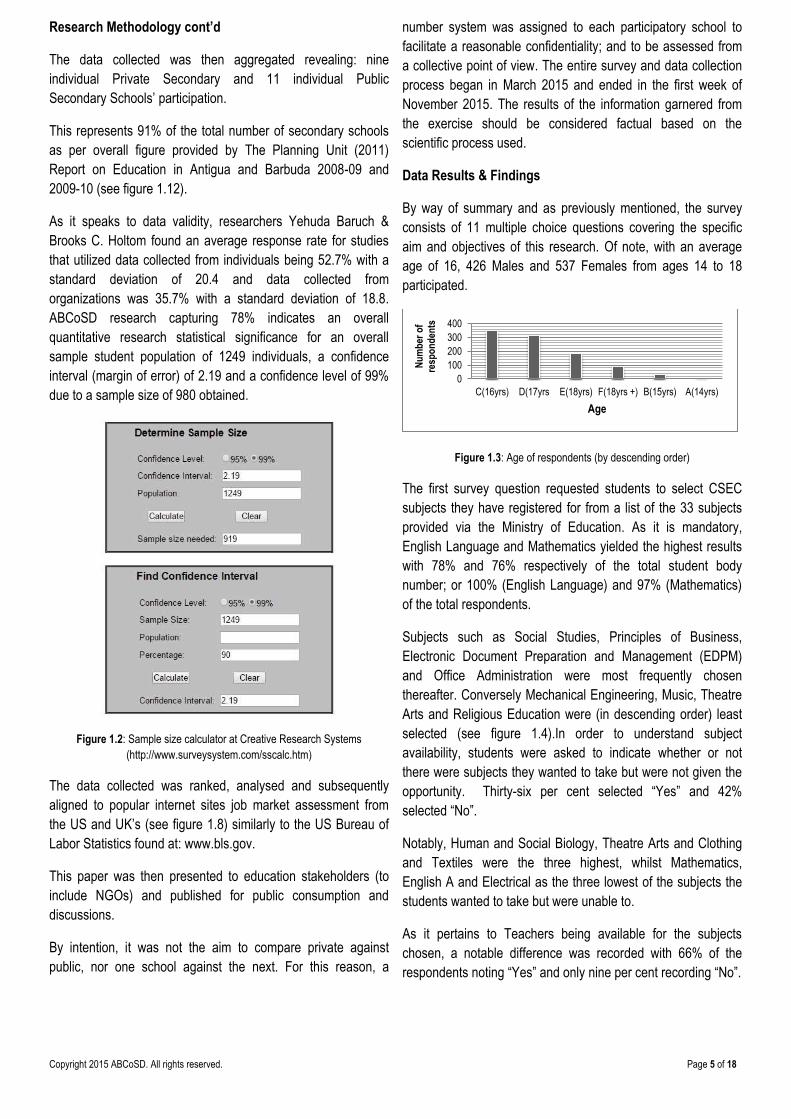
aim and objectives of this research. Of note, with an average
age of 16, 426 Males and 537 Females from ages 14 to 18
participated.
Figure 1.3: Age of respondents (by descending order)
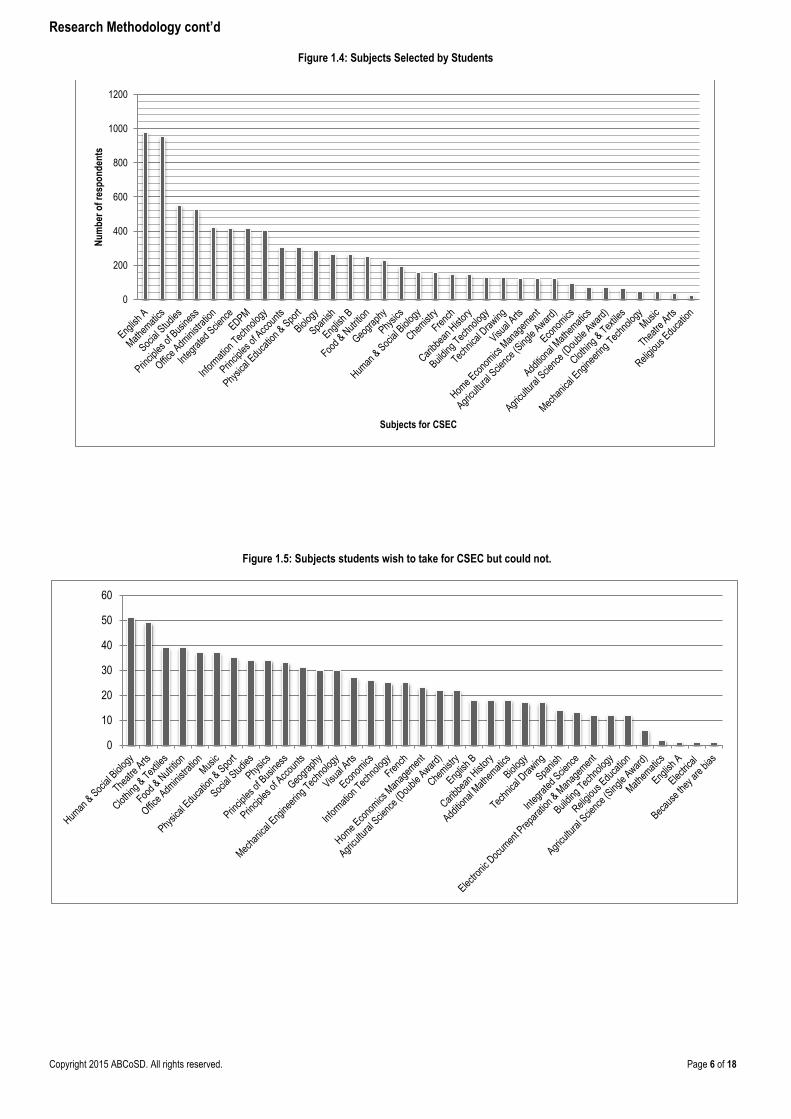
The first survey question requested students to select CSEC
subjects they have registered for from a list of the 33 subjects
provided via the Ministry of Education. As it is mandatory,
English Language and Mathematics yielded the highest results
with 78% and 76% respectively of the total student body
number; or 100% (English Language) and 97% (Mathematics)
of the total respondents.
Subjects such as Social Studies, Principles of Business,
Electronic Document Preparation and Management (EDPM)
and Office Administration were most frequently chosen
thereafter. Conversely Mechanical Engineering, Music, Theatre
Arts and Religious Education were (in descending order) least
selected (see figure 1.4).In order to understand subject
availability, students were asked to indicate whether or not
there were subjects they wanted to take but were not given the
opportunity. Thirty-six per cent selected “Yes” and 42%
selected “No”.
Notably, Human and Social Biology, Theatre Arts and Clothing
and Textiles were the three highest, whilst Mathematics,
English A and Electrical as the three lowest of the subjects the
students wanted to take but were unable to.
As it pertains to Teachers being available for the subjects
chosen, a notable difference was recorded with 66% of the
respondents noting “Yes” and only nine per cent recording “No”.
0
100
200
300
400
C(16yrs) D(17yrs E(18yrs) F(18yrs +) B(15yrs) A(14yrs)
Nu
mb
er o
f re
spo
nd
ents
Age
Copyright 2015 ABCoSD. All rights reserved. Page 6 of 18
Research Methodology cont’d
Figure 1.4: Subjects Selected by Students
Figure 1.5: Subjects students wish to take for CSEC but could not.
0
200
400
600
800
1000
1200N
um
ber
of
resp
on
den
ts
Subjects for CSEC
0
10
20
30
40
50
60

Copyright 2015 ABCoSD. All rights reserved. Page 7 of 18
Data Results & Findings cont’d
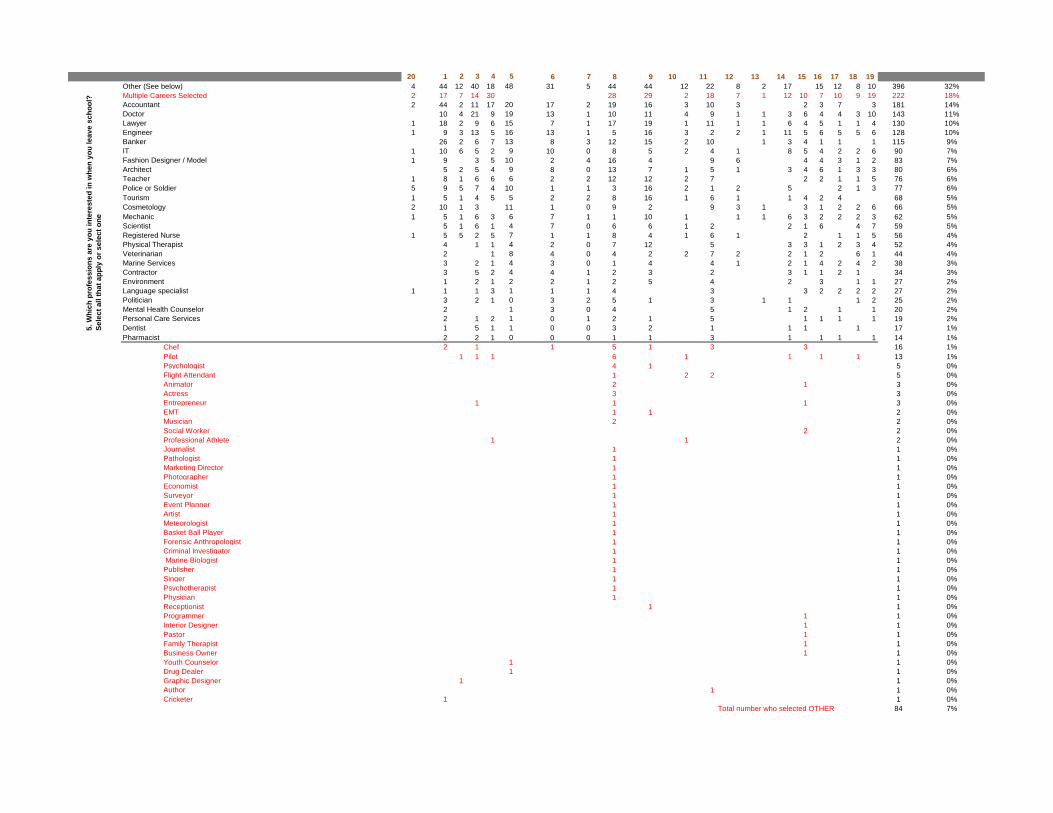
At the core of the research aims and objectives, question 5 asked students to select from the given careers which they were
inclined to venture in. These career options consist of a mixed compilation from the Board of Education’s priory list, UK and USA
top job rankings and the results are as illustrated:
Figure 1.6: Careers Selected by Students
Figure 1.7: Other Careers Selected by Students
0
50
100
150
200
250
300
350
400
450
Nu
mb
er o
f re
spo
nd
ents
Careers path selected
0
2
4
6
8
10
12
14
16
18
Che
f
Pilo
t
Psy
chol
ogis
t
Flig
ht A
ttend
ant
Ani
mat
or
Act
ress
Ent
repr
eneu
r
EM
T
Mus
icia
n
Soc
ial W
orke
r
Pro
fess
iona
l Ath
lete
Jour
nalis
t
Pat
holo
gist
Mar
ketin
g D
irect
or
Pho
togr
aphe
r
Eco
nom
ist
Sur
veyo
r
Eve
nt P
lann
er
Art
ist
Met
eoro
logi
st
Bas
ket B
all P
laye
r
For
ensi
c A
nthr
opol
ogis
t
Crim
inal
Inve
stig
ator
Mar
ine
Bio
logi
st
Pub
lishe
r
Sin
ger
Psy
chot
hera
pist
Phy
sici
an
Rec
eptio
nist
Pro
gram
mer
Inte
rior
Des
igne
r
Pas
tor
Fam
ily T
hera
pist
Bus
ines
s O
wne
r
You
th C
ouns
ello
r
Dru
g D
eale
r
Gra
hphi
c D
esig
ner
Aut
hor
Cric
kete
r

Copyright 2015 ABCoSD. All rights reserved. Page 8 of 18
Data Results & Findings cont’d
Figure 1.8:
Career Comparative Table
U.S. News Ranks Jobs Source: http://money.usnews.com/careers/best-jobs/rankings/the-100-best-jobs
Glassdoor Job Score Source: https://www.glassdoor.co.uk/Best-Jobs-in-UK-LST_KQ0,15.htm
Board of Education Priority List for 2015. Source: Board of Education, Antigua.
Careers selection results (in descending order) Source: ABCoSD’s Secondary School survey results 2015.
1. Dentist 2. Nurse Practitioner 3. Software Developer 4. Physician 5. Dental Hygienist 6. Physical Therapist 7. Computer Systems
Analyst 8. Information Security
Analyst 9. Registered Nurse 10. Physician Assistant 11. Web Developer 12. Diagnostic Medical
Sonographer 13. Occupational Therapist 14. Market Research Analyst 15. Marketing Manager 16. Accountant 17. School Psychologist 18. Mechanical Engineer 19. Occupational Therapy
Assistant 20. Operations Research
Analysis 21. IT Manager 22. Civil Engineer 23. Cost Estimator 24. Esthetician 25. Financial Advisor 26. Logistician 27. Pharmacist 28. Medical Equipment
Repairer 29. Dietitian and Nutritionist 30. Speech-Language
Pathologist 31. Computer Systems
Administrator
1. Marketing Manager
2. Finance Manager
3. Mechanical Engineer
4. Sales Manager
5. Business Analyst
6. IT Manager
7. Civil Engineer
8. Product Manager
9. Lawyer
10. Software Engineer
11. Human Resources
Manager
12. Business
Development
Manager
13. Internal Audit
Manager
14. Solutions Architect
15. Network Engineer
16. Investment Analyst
17. Operations Manager
18. Recruiter
19. Brand Manager
20. Office Manager
21. Executive Assistant
22. Accountant
23. Sales Engineer
24. UX Designer
25. Trader
1. Education (Early Childhood;
Guidance Counseling, Special
Education, IT, Math, Physics,
Chemistry, Biology,
Geography, Music and
Industrial Arts).
2. Tourism
3. Agriculture and Technology
4. Information Technology
5. Financial Services
Management
6. Architecture: Surveying,
Physical Planning, Building
Tech, Engineering.
7. Pure & Applied Sciences:
Math, Bio, Chemistry and
Physics.
8. Visual & Performing Arts
9. Forensic Science
10. Pharmacology
11. Modern Languages
12. Sports and Recreation.
1. Accountant (highest ranked career) 2. Doctor 3. Lawyer 4. Engineer 5. Banker 6. IT 7. Fashion Designer / Model 8. Architect 9. Teacher 10. Police or Soldier 11. Tourism 12. Cosmetology 13. Mechanic 14. Scientist 15. Registered Nurse 16. Physical Therapist 17. Veterinarian 18. Marine Services 19. Contractor 20. Environment 21. Language specialist 22. Politician 23. Mental Health Counselor 24. Personal Care Services 25. Dentist 26. Pharmacist 27. Pilot 28. Psychologist 29. Flight Attendant 30. Animator 31. Actress 32. Entrepreneur 33. EMT 34. Musician 35. Social Worker

Copyright 2015 ABCoSD. All rights reserved. Page 9 of 18
Data Results & Findings cont’d
Singularly, being an Accountant (14% or 181 no.) as a
prospective career choice was found at the top of the list,
followed by Medical Doctor (11% or 143no.) and Lawyer (10%
or 130no.). At the descending end of the scale Mental Health
Counsellor (2% or 20no.), Personal Care Services (2% or
19no.), Dentist (1% or 17), Pharmacist (1% or 14no.) were
noted as least desirables (see figure 1.6).
A notable number of students selected “Other” (32% or 396no)
but only 84 students provided a specified career alternative
other than was listed. Of that number 16 students mentioned
Chef, 13 students noted Pilot, and 5, Psychologist among the
top three most selected (see figure 1.7).
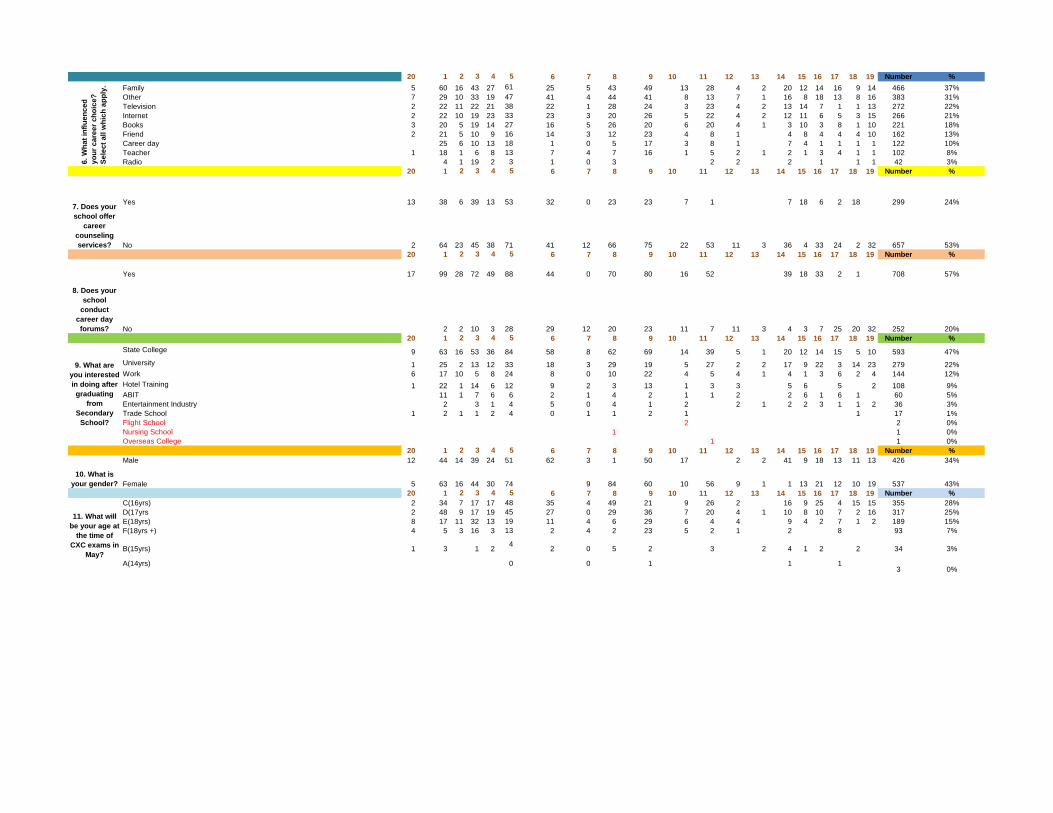
When questioned on their Post-Secondary School intentions,
596 students indicated attending The Antigua State College
(ASC), 279 University, 144 Employment, 108 Antigua &
Barbuda Hotel Training Institute (ABHTI), 60 Antigua & Barbuda
International Institute of Technology (ABIT), and 36 the
Entertainment industry with least desirables: Trade, Flight,
Nursing and Overseas College with less than 1% overall
number.
Figure 1.9: Interest Post- High School
Of the options provided (question 5) the career selections were
not always singular. The results revealed 222 students of those
surveyed selected multiple careers, at times being incongruent.
Thus demonstrating some level of the intended career
uncertainly and perhaps explaining why when asked about
Career Counselling services 53% responded “No” to its
availability.
Interestingly, these results were almost identical but in reverse
when questioned about the Career Day Activity. Fifty-seven per
cent confirmed “Yes” the school engaged in the activity and
20% disagreed.
However, questioned as to the factors which contributed to
career decision, singularly the data showed that by far the
greatest source of career influence was Family at 37% or 466;
followed by Television 22%; Internet 21%; Books 18%; Friends
13%; Career Day 10%; Teacher 8%; and Radio 3%.
“Other” (31%) was noted as the second highest influential factor
but students did not specify which factors were considered.
Figure 1.10: Factors influencing career choice
The data clearly shows “Family” being tallied as the most
influential factor for students’ career selection. This highlights
an issue as per the literature review [9].
Parents, as per literature, should not be an influencing factor for
career selection in principle, but instead act as a support
system [9] utilising tools available such as Career Key Test
(found on internet site: www.careerkey.org) grounded on
Holland’s theory of career choice to determine the best paths
for their future.
Whilst career day activity being held at school plants scored
57%, it remains a minimum influential factor to career choice
(10%) by virtue of results of question 6; suggesting the current
model requires an improvement or revision of its objectives.
The implications of the data need further investigation, as to
what factors affect the student’s perceptions of low levels of
career guidance (24% responding “Yes” there was career
guidance; 53% “No”).
Possible theories include but are not limited to, the need for
more guidance counsellors in the secondary schools, or a need
for more emphasis to be placed on the career guidance aspect
of the counsellor’s mandate. If capacity to provide career
guidance is sufficient the underlying issue may stem from
limited sensitization of students and parents about the
availability such services.
As it speaks to physical conditions and educators (available for
subject delivery 66%), “Delivery of the subject” in the students
view was considered secondary at 22% to “Condition of the
classroom at 23% as the factor which most negatively affects
their ability to learn, with “Learning disability” being the lesser of
the options provided.
0
100
200
300
400
500
600
700
Nu
mb
er o
f re
spo
nd
ents
0
100
200
300
400
500
Options
Nu
mb
er o
f re
spo
nd
ents

Copyright 2015 ABCoSD. All rights reserved. Page 10 of 18
Data Results & Findings cont’d
Figure 1.11:
Factors negatively affecting learning
From the survey results (except for IT related areas) artistic and
technical subjects provided for CSEC were among the least
chosen, such as Theatre Arts which ranked very low at 3%.
Agriculture (Single Award), Music, Mechanical, Building
Technology, Clothing and Textiles, Visual Arts and Technical
Drawing etc. fell under 15%. While improvement, as it relates to
a change in mentality of negating Art and Artisan skills and
Trades have been slowly evolving, greater attention, evaluation
and intervention is still required.
It is evident in the data that technical or hands-on subjects such
as Music, Mechanical, Building Technology, Clothing and
Textiles, Visual Arts and Technical Drawing etc. fell under 12%,
warranting further investigations.
The subject Religious Education (for CSEC 2016, two per cent
or 26 students) was noted as a challenge being the least
selected.
Foreign Languages, which are integral to individuals competing
in the global workforce and locally in the tourism industry,
showed low incidents of student selection and limited options.
Of the total number, 21% selected Spanish, while only 12%
French, with no other noted language provided by CSEC.
Lastly and most importantly, it is suggested within the data that
a significant anomaly exists between the subjects selected for
CSEC and the career paths indicated on the survey. In one
instance Accountant, Doctor, and Lawyer ranked highest in
descending order. It would be logical that such subjects related
to these various fields would have been highly or most
frequently chosen. However this was not the case. For
instance: Chemistry 13%; Biology 23%; English Literature 21%;
Physics 15%; Principles of Accounts 24%; Caribbean History
12%. These did not surpass Social Studies 44%; Office
Principles of Business 42%; EDPM 33%; Office Administration
34%; Integrated Science 33%; and IT 32%. This suggests the
overarching and collective proposed students’ career selection
are incongruent in some measure to the foundational CSEC
subjects. This as well will require further in-depth research.
Conclusions
Based on informal interviews conducted with employers in
Antigua and Barbuda, an increasing percentage prefer
graduates with a broader range of skills than just academic
knowledge and greater appreciation of business needs in
keeping with global trends [13], both of which recommended
through preliminary work experience and awareness of
employers' recruitment and selection procedures.
The results of the research when read in conjunction with the
research discussion disclose evident issues. A focus on early
career exposure that integrates counselling, applied and
vocational learning, technical activities and community
partnerships (with social capital at its centre) is more nationally
advantageous for the long term economic and social
sustainability within Antiguan & Barbudan society.
Tapping into this “advantage” first requires understanding.
Parents, teachers, schools and the broader professional
community are all stakeholders and all play a role of developing
and providing the correct information, critical career
sensitization and Youth support.
Recommendations
Subsequent to survey results and coupled with previous
literature findings referenced below, several conclusions were
arrived at. The following seek to simplify same for meaningful
consideration of all stakeholders:
1. There is a need for a more entrepreneurship
curriculum focused agenda [2]. “Instead of training
young people to seek jobs, they should train students
to create jobs” (Bwenje, Uganda - United Nations,
World Youth Report 2013). Evolving exploring trends,
emerging markets and new career avenues generated
from breakthrough technology such as 3D printing and
Product Design, Entrepreneurship, and Green
Industries to name a few.
2. It is not essential for parents to be career informants,
though there is no doubt that this can assist. However,
at the very least parents and guardians do need to be
career aspirants, supporting their children, family
friend or sibling to do well.
3. As with other developed countries, the construction of
innovative careers and transition programmes should
be developed in tandem with emphasis on the
development of Social Capital.
0
50
100
150
200
250
300
350

Copyright 2015 ABCoSD. All rights reserved. Page 11 of 18
Recommendations cont’d
That is, pathways, social networks and social agencies
those individuals rely on to give them meaning and
purpose in life [5, 8] being introduced early in
secondary school plants (see figure 4, p.13).
4. Data collection firstly should commence at 3rd form
(Administering a Career Key Test or similar) then at
the point of matriculation for CSEC. Such would
facilitate the regularisation of sources of data collection
over consecutive years.
5. Ideally a digital format would be preferred, however
conditions and context based on each school has to
be assessed.
6. There is a benefit of giving young people one-on-one
attention when mapping out career pathways [17, 20]
hence a need for further or strengthening of career
counselling.
7. Anticipatory Socialisation leads to more effective
career self-management and selection processes.
That is, the positive effect of recruitment and selection
experiences on career expectations in an effort to
expose students to the realities of the professional
world [12].
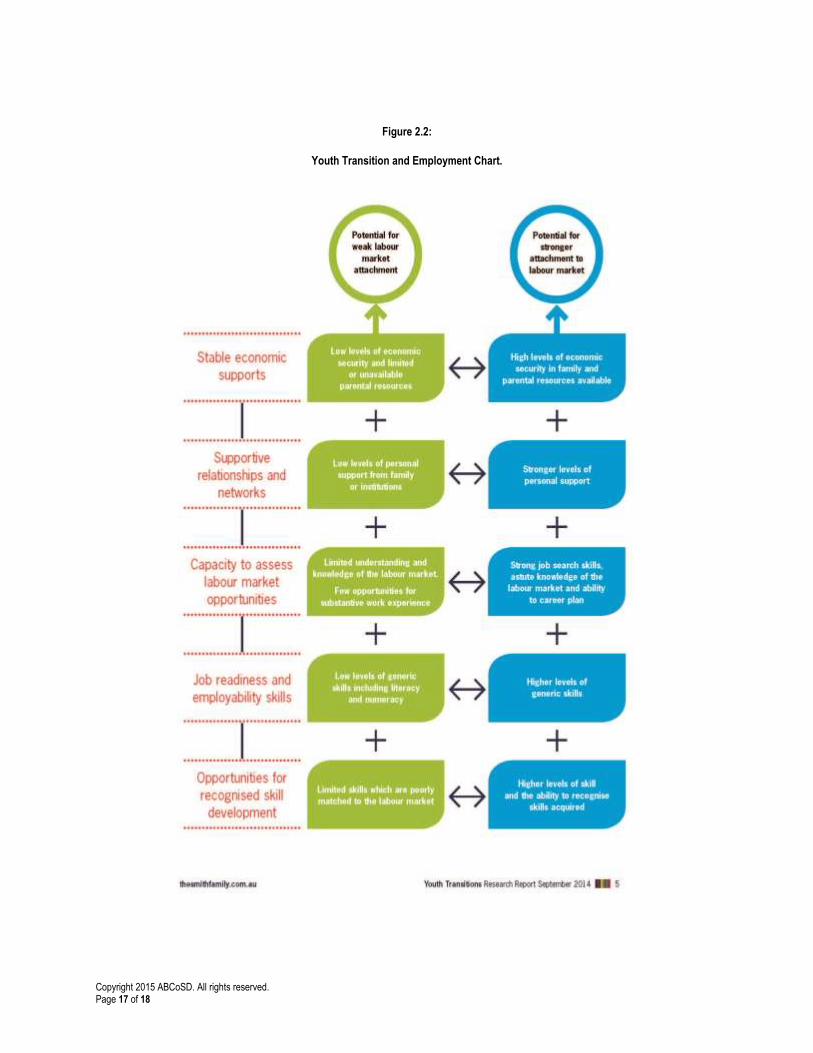
8. Students with strong interest in particular professions
should be assisted (as a symbiotic relationship) with
modified apprentice / internship opportunities (see
figure 2.2, p.17). Fostering workplace exposure after
hours, days off or on holidays. Ascertaining if such
intended work environments meets their expectations
or prompting revisiting the previous career choice.
(See German Model for Vocational Training Further
reading [7] )
9. Countries can and have exported skillsets facilitated
by suitable technological platform and or software
enablers. Other scenarios consist of a coordinated
physical professional migration programmes; providing
return on investments benefits via remittances.
Singularly or by combination this is an option for
further long term planning considerations. The premise
for this notion lies on small countries being unable to
absorb the large school leaving population and
external factors such as continual and even more
increasing effects of climate change on our tourism
product limits the possible growth of the traditional
model.
10. Educational investment differs from other types of
investment in that it is indivisible and non-tradable [11]
and should be understood as such. That is
appreciating each career choice with the associated
risks, heavy financial investment with likely lifelong
impactions. Prompting careful considerations before
educational commitment.
11. Encourage experienced professionals (especially
scholarship recipients) to establish or contribute,
maintain and upgrade career or professional
information and talks to a free and open source video
database.
12. Pedagogy best practices (see related information
online) and student learning could be enhanced further
by: the general improved ambient control (lighting,
acoustics and ventilation) of the classrooms;
integration of more digital media within the classrooms
themselves (e.g. interactive white boards) if feasible;
coupled with user-friendly educational tools, furniture
and a comprehensive upkeep of the physical school
plant.
Research Limitations
The research was not without challenge and inherent debilities.
As part of the reporting process it is critical that these areas be
underscored to aid similar or future research undertakings.
As a part of the initial research methodology, Survey Monkey
was used in an effort to provide a seamless and hassle free
process of data capturing thus minimising tally errors.
Notwithstanding the aforementioned, data collection suffered
significant delays, negatively impacting the overall project
schedule, from the point of the project’s commencement.
In the first instance after receiving official written commitment
and support of the Ministry of Education the questionnaires
were issued online to a few schools identified by the Think Tank
for the first intervention.
Green and paperless was thought to be the best approach;
however it was soon discovered that this was indeed and still
remains contextually an inefficient method of capturing data.
Students in some cases were not in the possession of email
addresses to which the questionnaires could be sent.
Those who sent the survey via email address produced dismal
response rates, suggesting they were not motivated use this
portal.
This occurred over a period of two to three months. No
meaningful or completed surveys were logged, in finality
prompting a subsequent decision to manually administer
surveys to each participatory secondary school – consuming
considerable time and effort.
Copyright 2015 ABCoSD. All rights reserved. Page 12 of 18
Research Limitations cont’d
From a management point of view, the members of ABCoSD
undertook the execution of this research without external grants
or funding. However stakeholders provided personal resource
contributions as mentioned in the acknowledgements which
made the conclusion of this research possible.
From an epistemological (philosophical) point of view, the
research whilst primarily designed to entail a mixed
methodology of positivists (quantitative- surveys or
questionnaires) and social constructivist’s (qualitative –
interviews) fell short of that initial objective.
After collating the surveys it was the intent to capture a sample
of subjective views by means of interviews from stakeholders
such as the Teachers, Officials from the Board of Education,
the Employer’s Federation and Establishment Division.
Upon review and advice by the Human Resource Association,
coupled with an acknowledgement of limited resources (to
include personal / professional time) the project constraints did
not allow ABCoSD’s members such flexibilities in this first
intervention. Ultimately a quantitative methodology was chosen.
This is not to suggest qualitative or interview methods are less
valid than surveys. The importance of using qualitative data
collection tools like focus groups, case studies and interviews
allow for the emergence of social patterns and social meanings
that can lead to the development of new ways of examining
social phenomena [3].
Therefore interviewers are being considered for a second
phase, to capture further insights into student career related
decisions or choices.
There was no question addressing the out-of-school or after-
school registration of students, which could in turn affect the
results of availability of in-school subjects and total number of
subjects written within the school and through private
institutions.
Reference:
1. Ardington , C., Case, A., Menendez, A., Barnighausen,
T., Lam, D. & Leibbrandt, M. (2014). Youth
unemployment and social protection.
2. Awogbenle, A. C. & Iwuamadi, K. C. (2010). Youth
unemployment: Entrepreneurship development
programme as an intervention mechanism. African
Journal of Business Management, 4, 831-835.
3. Bouma, G., & Ling, R. (2004). The Research Process.
South Melbourne, Australia.
4. Broadbent, R., Cacciattolo, M., & Papadopoulos, T.
(2012). Good practice in secondary school careers
programs: A case study of the approach of one inner
city school. Education+ Training, 54(2/3), 126-141.
5. Collin, P., Rahilly, K., Richardson, I., & Third, A.
(2011). The benefits of social networking services.
6. Choudhry, M. T., Marelli, E. & Signorelli, M. (2012).
Youth unemployment rate and impact of financial
crises. International journal of manpower, 33, 76-95.
7. D’Arcy, J., Dpadm, I. A. & Desa, U. (n.d.). United
Nations Sub Regional Workshop For The Caribbean
On Youth Employment Policies.
8. Fretwell,H, D & Watts.G.A (2004). Public Policies for
Career Development, Case Studies And Emerging
Issues For Designing Career Information And
Guidance Systems In Developing And Transition
Economies.
9. Kemple, J.J. & Willner,.J.C. (2008). Career Academies
Long-Term Impacts on Labor Market Outcomes,
Educational Attainment, and Transitions to Adulthood.
mdrc Building Knowledge to Improve Social Policy.
[Online] Available at:
http://www.mdrc.org/sites/default/files/full_50.pdf
10. Robichaud, L. B. and Anantatmula, V. S. (2010).
'Greening project management practices for
sustainable construction.' Journal of Management in
Engineering, 27(1) pp. 48-57.
11. Saks, R. E. & Shore, S. H. (2005). Risk and career
choice. Advances in Economic Analysis & Policy, 5.
12. Scholarios, D., Lockyer, C., & Johnson, H. (2003).
Anticipatory socialisation: the effect of recruitment and
selection experiences on career expectations. Career
Development International, 8(4), 182-197.
13. Sherriff, L. (2015). Ernst & Young removes degree
classification from entry criteria as there’s ‘no
evidence’ university equals success. Huffington Post
UK. Available [Online]
http://www.huffingtonpost.co.uk/2015/08/04/ernst-and-
young-removes-degree-classification-entry-
criteria_n_7932590.html?fb_action_ids=10153794662
639560&fb_action_types=og.likes
Copyright 2015 ABCoSD. All rights reserved. Page 13 of 18
Reference cont’d:
14. Taylor, A. (2003). A decent place to work: Youth
notions of the good workplace. Implications for work-
readiness and soft skills issues.
15. Taylor, A. (2004). Entering Industry: A Case Study of
Links between a School Vocational Program and the
Building and Construction Industry. Adelaide: NCVER
16. Taylor, A. (2005). What employers look for: the skills
debate and the fit with youth perceptions. Journal of
Education and Work. 18:2, pp. 201-218
17. Taylor, A. (2005). 'It's for the rest of your life': The
pragmatics of youth career decision-making. Youth &
Society, Vol 36, No 4, pp. 471-503
18. Thorarnarson, B. & Mitra, A. (2010). The Paternity
Leave Act in Iceland: implications for gender equality
in the labour market. Applied Economics Letters, 17,
677-680.
19. The Planning Unit (2011). Report on Education in
Antigua and Barbuda 2008-09 and 2009-10.Ministry of
Education, Antigua and Barbuda.
20. The Smith Family Research Report (2014). Young
people’s successful transition to work: What are the
pre-conditions? [Online] Available at:
https://www.thesmithfamily.com.au/~/media/Files/Rese
arch%20and%20Advocacy%20PDFs/Research%20an
d%20Evaluation%20page%20PDFs/Young-People-
Transition-to-Work-Report.ashx.
21. Spokane, A. R. (1985). A review of research on person-
environment congruence in Holland's theory of
careers. Journal of Vocational Behavior,26 (3), 306-343
Related information online:
1. Starting school even 1 hour later improves test results
https://www.google.com.ag/webhp?hl=en&gws_rd=ssl
#hl=en&q=scheduling+school+later+in+the+day+impro
ves+test+scores
2. Too much homework is counterproductive:
https://www.google.com.ag/webhp?hl=en&gws_rd=ssl
#hl=en-
AG&q=too+much+homework+is+counterproductive
3. Benefits of beginning school at a later age (The
Finland Phenomenon):
https://www.youtube.com/watch?v=bcC2l8zioIw
4. Khan Academy, solutions to homework & solving the
problem of students learning at different paces:
https://www.youtube.com/watch?v=gM95HHI4gLk
5. Ken Robinson: Do schools kill creativity?
https://www.ted.com/talks/ken_robinson_says_schools
_kill_creativity?language=en 6. Julian Treasure: Why architects need to use their ears.
https://www.youtube.com/watch?v=y5nbWUOc9tY
7. Vocational Education: International Approaches and
Development Systems :Chapter 4 “The German
Philosophy of Vocational Education”
https://books.google.com.ag/books?hl=en&lr=&id=N1t
3pp3WlDcC&oi=fnd&pg=PA49&dq=german+education
+model&ots=2jL_229guH&sig=95XSFRZ3g-
9urCUyNMt3i_Jf4fw&redir_esc=y#v=onepage&q=ger
man%20education%20model&f=false
Copyright 2015 ABCoSD. All rights reserved. Page 14 of 18
About
The Antigua Barbuda Council on Sustainable Development
(think tank)
The Antigua and Barbuda Council on Sustainable Development acronym ABCoSD is a nonprofit, nonpartisan Think Tank. It is an
organization that seeks to generate policy oriented research, analysis and advice on domestic & international issues in an effort to
affect national policy.
ABCoSD was founded on the principles of Sustainability [10] which at its core encapsulates the three pillars of contextual Society
& Culture, Economy and Environment; supporting the Proposed Sustainable Development Goals of 2014.
ABCoSD Members and Contributors
Colin John Jenkins (Research Project Leader), Elijah James, Daryl George, Zahra Airall, Petra Williams, Loretta Benjamin, Geoffrey Joseph,
Erica Edwards, Julianne Jarvis, Yvelle Charles-Jenkins, Faun Thomas, Carlon Knight, Linisa George, Abena St. Luce, Jermaine Paul,
Asha Philip, Lydia Camesha Howell, Malcolm Charles, Fayola Jardin, Aziza Lake, John Birk, Raymond Mansoor, Martin Dudley,
Kemaul J.C. Harrigan, Navida Alleyne and Sekou Luke.
Copyright 2015 ABCoSD. All rights reserved. Page 15 of 18
Annexes
Figure 1.12:
The Planning Unit (2011) Report on Education in Antigua and Barbuda 2008-09 and 2009-10.
Ministry of Education, Antigua and Barbuda, p 47.
Copyright 2015 ABCoSD. All rights reserved. Page 16 of 18
Figure 2.1:
Career Academies Long-Term Impacts on Labor Market Outcomes, Educational Attainment, and Transitions to Adulthood [9]
Copyright 2015 ABCoSD. All rights reserved. Page 17 of 18
Figure 2.2:
Youth Transition and Employment Chart.
Copyright 2015 ABCoSD. All rights reserved. Page 18 of 18
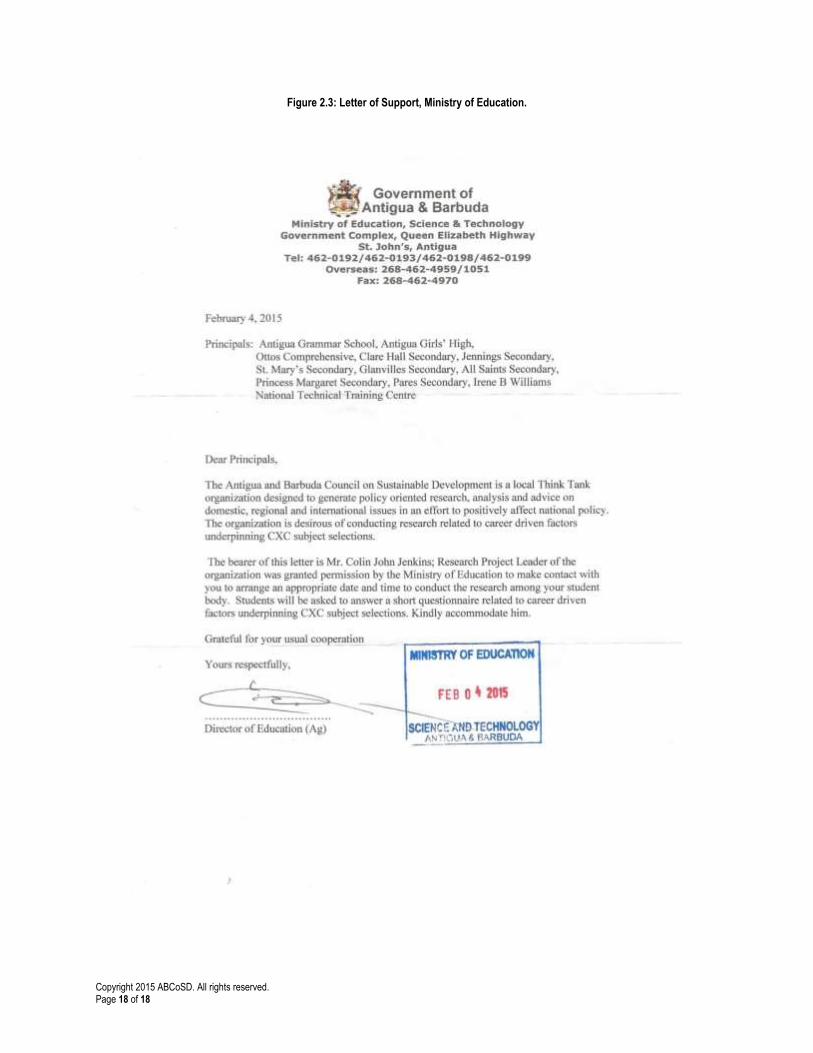
Figure 2.3: Letter of Support, Ministry of Education.
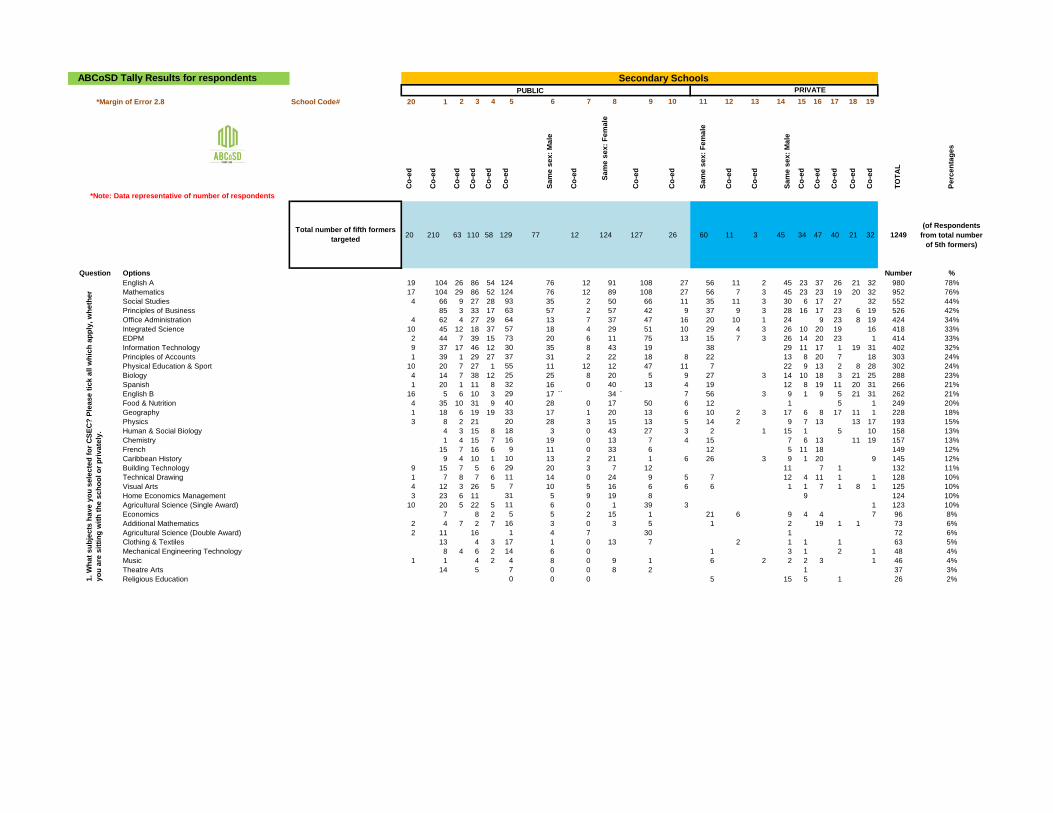
PUBLIC
*Margin of Error 2.8 School Code# 20 1 2 3 4 5 6 7 8 9 10 11 12 13 14 15 16 17 18 19
Co
-ed
Co
-ed
Co
-ed
Co
-ed
Co
-ed
Co
-ed
Sa
me
se
x:
Ma
le
Co
-ed
Sa
me
se
x:
Fe
ma
le
Co
-ed
Co
-ed
Sa
me
se
x:
Fe
ma
le
Co
-ed
Co
-ed
Sa
me
se
x:
Ma
le
Co
-ed
Co
-ed
Co
-ed
Co
-ed
Co
-ed
TO
TA
L
Pe
rce
nta
ge
s
*Note: Data representative of number of respondents
20 210 63 110 58 129 77 12 124 127 26 60 11 3 45 34 47 40 21 32 1249
(of Respondents
from total number
of 5th formers)
Question Options Number %
English A 19 104 26 86 54 124 76 12 91 108 27 56 11 2 45 23 37 26 21 32 980 78%
Mathematics 17 104 29 86 52 124 76 12 89 108 27 56 7 3 45 23 23 19 20 32 952 76%
Social Studies 4 66 9 27 28 93 35 2 50 66 11 35 11 3 30 6 17 27 32 552 44%
Principles of Business 85 3 33 17 63 57 2 57 42 9 37 9 3 28 16 17 23 6 19 526 42%
Office Administration 4 62 4 27 29 64 13 7 37 47 16 20 10 1 24 9 23 8 19 424 34%
Integrated Science 10 45 12 18 37 57 18 4 29 51 10 29 4 3 26 10 20 19 16 418 33%
EDPM 2 44 7 39 15 73 20 6 11 75 13 15 7 3 26 14 20 23 1 414 33%
Information Technology 9 37 17 46 12 30 35 8 43 19 38 29 11 17 1 19 31 402 32%
Principles of Accounts 1 39 1 29 27 37 31 2 22 18 8 22 13 8 20 7 18 303 24%
Physical Education & Sport 10 20 7 27 1 55 11 12 12 47 11 7 22 9 13 2 8 28 302 24%
Biology 4 14 7 38 12 25 25 8 20 5 9 27 3 14 10 18 3 21 25 288 23%
Spanish 1 20 1 11 8 32 16 0 40 13 4 19 12 8 19 11 20 31 266 21%
English B 16 5 6 10 3 29 17 `` 34 ` 7 56 3 9 1 9 5 21 31 262 21%
Food & Nutrition 4 35 10 31 9 40 28 0 17 50 6 12 1 5 1 249 20%
Geography 1 18 6 19 19 33 17 1 20 13 6 10 2 3 17 6 8 17 11 1 228 18%
Physics 3 8 2 21 20 28 3 15 13 5 14 2 9 7 13 13 17 193 15%
Human & Social Biology 4 3 15 8 18 3 0 43 27 3 2 1 15 1 5 10 158 13%
Chemistry 1 4 15 7 16 19 0 13 7 4 15 7 6 13 11 19 157 13%
French 15 7 16 6 9 11 0 33 6 12 5 11 18 149 12%
Caribbean History 9 4 10 1 10 13 2 21 1 6 26 3 9 1 20 9 145 12%
Building Technology 9 15 7 5 6 29 20 3 7 12 11 7 1 132 11%
Technical Drawing 1 7 8 7 6 11 14 0 24 9 5 7 12 4 11 1 1 128 10%
Visual Arts 4 12 3 26 5 7 10 5 16 6 6 6 1 1 7 1 8 1 125 10%
Home Economics Management 3 23 6 11 31 5 9 19 8 9 124 10%
Agricultural Science (Single Award) 10 20 5 22 5 11 6 0 1 39 3 1 123 10%
Economics 7 8 2 5 5 2 15 1 21 6 9 4 4 7 96 8%
Additional Mathematics 2 4 7 2 7 16 3 0 3 5 1 2 19 1 1 73 6%
Agricultural Science (Double Award) 2 11 16 1 4 7 30 1 72 6%
Clothing & Textiles 13 4 3 17 1 0 13 7 2 1 1 1 63 5%
Mechanical Engineering Technology 8 4 6 2 14 6 0 1 3 1 2 1 48 4%
Music 1 1 4 2 4 8 0 9 1 6 2 2 2 3 1 46 4%
Theatre Arts 14 5 7 0 0 8 2 1 37 3%
Religious Education 0 0 0 5 15 5 1 26 2%
Secondary SchoolsPRIVATE
ABCoSD Tally Results for respondents1
. W
ha
t s
ub
jec
ts h
av
e y
ou
se
lec
ted
fo
r C
SE
C?
Ple
as
e t
ick
all
wh
ich
ap
ply
, w
he
the
r
yo
u a
re s
itti
ng
wit
h t
he
sc
ho
ol
or
pri
va
tely
.
Total number of fifth formers
targeted

20 1 2 3 4 5 6 7 8 9 10 11 12 13 14 15 16 17 18 19 Number %
Yes 3 46 12 39 17 51 40 7 38 39 12 36 6 2 20 18 18 5 17 22 448 36%
No 15 56 15 44 34 71 33 5 54 72 15 21 5 1 23 4 22 20 4 8 522 42%
Number %
Human & Social Biology 2 8 7 1 1 14 1 1 10 2 4 51 4%
Theatre Arts 3 1 1 5 2 5 2 14 1 1 3 1 3 7 49 4%
Clothing & Textiles 2 3 1 2 1 3 1 1 13 1 3 1 2 5 39 3%
Food & Nutrition 4 1 1 1 4 2 2 4 1 5 7 1 2 4 39 3%
Office Administration 9 1 5 1 8 2 1 3 3 1 3 37 3%
Music 5 1 2 3 6 3 1 1 3 4 8 37 3%
Physical Education & Sport 8 1 3 2 3 1 3 3 1 1 2 3 4 35 3%
Social Studies 3 4 3 12 1 4 2 1 1 1 1 1 34 3%
Physics 1 1 3 2 8 4 5 1 1 1 3 1 2 1 34 3%
Principles of Business 6 3 1 3 9 2 1 1 3 2 2 33 3%
Principles of Accounts 13 1 3 4 1 2 2 4 1 31 2%
Geography 3 1 2 1 5 2 3 1 5 3 1 3 30 2%
Mechanical Engineering Technology 1 2 3 1 1 2 2 3 6 3 2 3 1 30 2%
Visual Arts 4 1 1 2 6 1 1 3 4 4 27 2%
Economics 1 2 1 3 1 4 1 4 2 7 1 27 2%
Information Technology 4 2 3 5 1 1 5 1 2 1 25 2%
French 1 1 1 1 1 2 2 1 1 1 1 1 1 8 2 25 2%
Home Economics Management 2 1 1 2 2 5 3 2 1 1 3 23 2%
Agricultural Science (Double Award) 2 4 4 1 6 1 1 1 1 1 22 2%
Chemistry 2 3 6 1 2 4 1 2 1 22 2%
English B 1 1 2 3 2 2 4 1 2 18 1%
Caribbean History 1 1 3 3 3 2 2 1 2 18 1%
Additional Mathematics 1 1 3 6 2 5 18 1%
Biology 2 3 2 1 1 2 1 1 2 1 1 17 1%
Technical Drawing 3 1 1 2 1 1 1 1 1 1 4 17 1%
Spanish 1 2 2 4 1 1 1 1 1 14 1%
Integrated Science 3 2 5 2 1 13 1%
Electronic Document Preparation & Management 5 2 3 1 1 12 1%
Building Technology 1 1 4 1 1 1 1 1 1 12 1%
Religious Education 1 1 5 2 1 2 12 1%
Agricultural Science (Single Award) 1 1 2 1 1 6 0%
Mathematics 1 1 2 0%
English A 1 1 0%
Electrical 1 1 0%
Because they are bias 1 1 0%
20 1 2 3 4 5 6 7 8 9 10 11 12 13 14 15 16 17 18 19 Number %
Yes 16 109 20 77 51 117 70 2 73 71 18 52 9 1 40 14 18 21 17 24 820 66%
No 2 4 1 2 2 9 5 10 8 9 8 3 2 2 3 8 22 2 4 4 110 9%
20 1 2 3 4 5 6 7 8 9 10 11 12 13 14 15 16 17 18 19 Number %
Condition of the classroom 38 14 14 25 47 30 3 30 23 2 27 1 1 13 7 1 3 4 3 286 23%
Delivery of the subject 19 6 15 7 30 37 3 48 13 4 26 1 2 14 14 14 1 7 15 276 22%
None of the above 14 29 4 35 11 29 17 3 11 43 15 6 2 13 4 22 11 7 13 289 23%
Lack of Materials 2 20 3 17 5 15 18 1 19 19 7 20 1 6 15 1 2 4 2 177 14%
Teacher Knowledge 14 10 11 5 20 21 6 14 19 1 17 3 6 3 5 1 4 4 164 13%
Accent 4 3 9 2 3 4 0 30 1 1 20 2 6 1 1 5 92 7%
All of the above 14 1 1 5 14 3 0 1 5 7 1 5 1 1 59 5%
Learning Disability 3 3 4 58
1 1 7 6 3 4 2 4 1 3 55 4%
2.
Are
th
ere
an
y s
ub
jec
ts f
rom
th
e p
rev
iou
s q
ue
sti
on
th
at
yo
u m
ay
ha
ve
wa
nte
d t
o c
ho
os
e b
ut
did
n’t
ha
ve
th
e o
pti
on
to
se
lec
t?
3. Are there
teachers
available for
all of the
subjects you
have chosen?
4. Which of
the following
negatively
affect your
ability to
learn?
20 1 2 3 4 5 6 7 8 9 10 11 12 13 14 15 16 17 18 19
Other (See below) 4 44 12 40 18 48 31 5 44 44 12 22 8 2 17 15 12 8 10 396 32%
Multiple Careers Selected 2 17 7 14 30 28 29 2 18 7 1 12 10 7 10 9 19 222 18%
Accountant 2 44 2 11 17 20 17 2 19 16 3 10 3 2 3 7 3 181 14%
Doctor 10 4 21 9 19 13 1 10 11 4 9 1 1 3 6 4 4 3 10 143 11%
Lawyer 1 18 2 9 6 15 7 1 17 19 1 11 1 1 6 4 5 1 1 4 130 10%
Engineer 1 9 3 13 5 16 13 1 5 16 3 2 2 1 11 5 6 5 5 6 128 10%
Banker 26 2 6 7 13 8 3 12 15 2 10 1 3 4 1 1 1 115 9%
IT 1 10 6 5 2 9 10 0 8 5 2 4 1 8 5 4 2 2 6 90 7%
Fashion Designer / Model 1 9 3 5 10 2 4 16 4 9 6 4 4 3 1 2 83 7%
Architect 5 2 5 4 9 8 0 13 7 1 5 1 3 4 6 1 3 3 80 6%
Teacher 1 8 1 6 6 6 2 2 12 12 2 7 2 2 1 1 5 76 6%
Police or Soldier 5 9 5 7 4 10 1 1 3 16 2 1 2 5 2 1 3 77 6%
Tourism 1 5 1 4 5 5 2 2 8 16 1 6 1 1 4 2 4 68 5%
Cosmetology 2 10 1 3 11 1 0 9 2 9 3 1 3 1 2 2 6 66 5%
Mechanic 1 5 1 6 3 6 7 1 1 10 1 1 1 6 3 2 2 2 3 62 5%
Scientist 5 1 6 1 4 7 0 6 6 1 2 2 1 6 4 7 59 5%
Registered Nurse 1 5 5 2 5 7 1 1 8 4 1 6 1 2 1 1 5 56 4%
Physical Therapist 4 1 1 4 2 0 7 12 5 3 3 1 2 3 4 52 4%
Veterinarian 2 1 8 4 0 4 2 2 7 2 2 1 2 6 1 44 4%
Marine Services 3 2 1 4 3 0 1 4 4 1 2 1 4 2 4 2 38 3%
Contractor 3 5 2 4 4 1 2 3 2 3 1 1 2 1 34 3%
Environment 1 2 1 2 2 1 2 5 4 2 3 1 1 27 2%
Language specialist 1 1 1 3 1 1 1 4 3 3 2 2 2 2 27 2%
Politician 3 2 1 0 3 2 5 1 3 1 1 1 2 25 2%
Mental Health Counselor 2 1 3 0 4 5 1 2 1 1 20 2%
Personal Care Services 2 1 2 1 0 1 2 1 5 1 1 1 1 19 2%
Dentist 1 5 1 1 0 0 3 2 1 1 1 1 17 1%
Pharmacist 2 2 1 0 0 0 1 1 3 1 1 1 1 14 1%
Chef 2 1 1 5 1 3 3 16 1%
Pilot 1 1 1 6 1 1 1 1 13 1%
Psychologist 4 1 5 0%
Flight Attendant 1 2 2 5 0%
Animator 2 1 3 0%
Actress 3 3 0%
Entrepreneur 1 1 1 3 0%
EMT 1 1 2 0%
Musician 2 2 0%
Social Worker 2 2 0%
Professional Athlete 1 1 2 0%
Journalist 1 1 0%
Pathologist 1 1 0%
Marketing Director 1 1 0%
Photographer 1 1 0%
Economist 1 1 0%
Surveyor 1 1 0%
Event Planner 1 1 0%
Artist 1 1 0%
Meteorologist 1 1 0%
Basket Ball Player 1 1 0%
Forensic Anthropologist 1 1 0%
Criminal Investigator 1 1 0%
Marine Biologist 1 1 0%
Publisher 1 1 0%
Singer 1 1 0%
Psychotherapist 1 1 0%
Physician 1 1 0%
Receptionist 1 1 0%
Programmer 1 1 0%
Interior Designer 1 1 0%
Pastor 1 1 0%
Family Therapist 1 1 0%
Business Owner 1 1 0%
Youth Counselor 1 1 0%
Drug Dealer 1 1 0%
Graphic Designer 1 1 0%
Author 1 1 0%
Cricketer 1 1 0%
Total number who selected OTHER 84 7%
5.
Wh
ich
pro
fes
sio
ns
are
yo
u i
nte
res
ted
in
wh
en
yo
u l
ea
ve
sc
ho
ol?
Se
lec
t a
ll t
ha
t a
pp
ly o
r s
ele
ct
on
e
20 1 2 3 4 5 6 7 8 9 10 11 12 13 14 15 16 17 18 19 Number %
Family 5 60 16 43 27 61 25 5 43 49 13 28 4 2 20 12 14 16 9 14 466 37%
Other 7 29 10 33 19 47 41 4 44 41 8 13 7 1 16 8 18 13 8 16 383 31%
Television 2 22 11 22 21 38 22 1 28 24 3 23 4 2 13 14 7 1 1 13 272 22%
Internet 2 22 10 19 23 33 23 3 20 26 5 22 4 2 12 11 6 5 3 15 266 21%
Books 3 20 5 19 14 27 16 5 26 20 6 20 4 1 3 10 3 8 1 10 221 18%
Friend 2 21 5 10 9 16 14 3 12 23 4 8 1 4 8 4 4 4 10 162 13%
Career day 25 6 10 13 18 1 0 5 17 3 8 1 7 4 1 1 1 1 122 10%
Teacher 1 18 1 6 8 13 7 4 7 16 1 5 2 1 2 1 3 4 1 1 102 8%
Radio 4 1 19 2 3 1 0 3 2 2 2 1 1 1 42 3%
20 1 2 3 4 5 6 7 8 9 10 11 12 13 14 15 16 17 18 19 Number %
Yes 13 38 6 39 13 53 32 0 23 23 7 1 7 18 6 2 18 299 24%
No 2 64 23 45 38 71 41 12 66 75 22 53 11 3 36 4 33 24 2 32 657 53%
20 1 2 3 4 5 6 7 8 9 10 11 12 13 14 15 16 17 18 19 Number %
Yes 17 99 28 72 49 88 44 0 70 80 16 52 39 18 33 2 1 708 57%
No 2 2 10 3 28 29 12 20 23 11 7 11 3 4 3 7 25 20 32 252 20%
20 1 2 3 4 5 6 7 8 9 10 11 12 13 14 15 16 17 18 19 Number %
State College 9 63 16 53 36 84 58 8 62 69 14 39 5 1 20 12 14 15 5 10 593 47%
University 1 25 2 13 12 33 18 3 29 19 5 27 2 2 17 9 22 3 14 23 279 22%
Work 6 17 10 5 8 24 8 0 10 22 4 5 4 1 4 1 3 6 2 4 144 12%
Hotel Training 1 22 1 14 6 12 9 2 3 13 1 3 3 5 6 5 2 108 9%
ABIT 11 1 7 6 6 2 1 4 2 1 1 2 2 6 1 6 1 60 5%
Entertainment Industry 2 3 1 4 5 0 4 1 2 2 1 2 2 3 1 1 2 36 3%
Trade School 1 2 1 1 2 4 0 1 1 2 1 1 17 1%
Flight School 2 2 0%
Nursing School 1 1 0%
Overseas College 1 1 0%
20 1 2 3 4 5 6 7 8 9 10 11 12 13 14 15 16 17 18 19 Number %
Male 12 44 14 39 24 51 62 3 1 50 17 2 2 41 9 18 13 11 13 426 34%
Female 5 63 16 44 30 74 9 84 60 10 56 9 1 1 13 21 12 10 19 537 43%
20 1 2 3 4 5 6 7 8 9 10 11 12 13 14 15 16 17 18 19 Number %
C(16yrs) 2 34 7 17 17 48 35 4 49 21 9 26 2 16 9 25 4 15 15 355 28%
D(17yrs 2 48 9 17 19 45 27 0 29 36 7 20 4 1 10 8 10 7 2 16 317 25%
E(18yrs) 8 17 11 32 13 19 11 4 6 29 6 4 4 9 4 2 7 1 2 189 15%
F(18yrs +) 4 5 3 16 3 13 2 4 2 23 5 2 1 2 8 93 7%
B(15yrs) 1 3 1 24
2 0 5 2 3 2 4 1 2 2 34 3%
A(14yrs) 0 0 1 1 13 0%
11. What will
be your age at
the time of
CXC exams in
May?
6.
Wh
at
infl
ue
nc
ed
yo
ur
ca
ree
r c
ho
ice
?
Se
lec
t a
ll w
hic
h a
pp
ly.
7. Does your
school offer
career
counseling
services?
8. Does your
school
conduct
career day
forums?
10. What is
your gender?
9. What are
you interested
in doing after
graduating
from
Secondary
School?