Embed Size (px)
Citation preview

Your Training Counts
Spotlight on health and wellbeing
A SPECIAL REPORT FROM THE TRAINEE NATIONAL EXPERIENCE SURVEY 2014

1
ACKNOWLEDGEMENTS
This report was prepared by Simon O’Hare, Research, Monitoring and Evaluation
Manager at the Medical Council of Ireland.
At the Medical Council, a team of people made different contributions to Your Training
Counts and their assistance is gratefully acknowledged: Grainne Behan, Philip Brady,
John Cussen, Lorna Farren, Anne Keane, Simon King, Paul Lyons, Fergal McNally,
Michelle Navan, Davinia O’Donnell, Barbara O’Neill, Ruth Thompson and Rasha Elnimeiry.
Thanks to Ailbhe Enright for her help in finalising the report. Your Training Counts was
overseen by the Education, Training and Professional Development Committee of the
Medical Council, and the advice and support provided by its chair, Prof Colm O’Herlihy,
and its members is acknowledged.
Jenny Bulbulia, PhD candidate at the Dept. of Psychology, Trinity College Dublin, with a
special interest in resilience among caring professionals, helped identify other questions
used to collect trainee views on health, wellbeing and work engagement through Your
Training Counts. Her generosity of each in sharing experience and providing advice is
noted with thanks.
We are immensely grateful to Stephen Joseph, Professor in Psychology, Health and
Social Care at the University of Nottingham, for giving us permission to replicate the
Short Depression-Happiness Scale questionnaire in Your Training Counts.
We are also very thankful to the members of the Medical Council’s Student and Trainee
Consultative Forum, who, through their discussion with the Medical Council about their
experience of medical education and training in Ireland, helped to shape ideas discussed
in this report.
Finally, we are grateful to the 1,636 trainees across Ireland who took part in Your
Training Counts. Each trainee who participated took time to share their experience by
responding to approximately 100 questions.
Without their contribution Your Training Counts would not be a success and we are
extremely grateful to everyone who took part.

2
PRESIDENT & VICE-PRESIDENT’S FOREWORD
Becoming a doctor is an immensely fulfilling career choice. We have the opportunity to help patients and their families through some of the most critical times they may ever face. It is important that we remind ourselves, and particularly doctors in training, the privilege which our profession affords us and the contribution which we can make to people’s lives. However, pursuing a career in medicine is not without personal challenge. These challenges can be felt hardest for those beginning their careers; doctors in training. The renowned physician Sir William Osler noted this well when he said:
“A distressing feature in the life which you are about to enter, a feature which will press hardly upon the finer spirits among you and ruffle their equanimity, is the uncertainty which pertains not alone to our science and art, but to the very hopes and fears that make us men”.1
In 2014, following a period of consultation, the Medical Council launched Your Training Counts, the annual national trainee experience survey, so as to provide some 3,000 trainees with an
opportunity to share their views on the places where they learn as doctors. Our goal was to enable them to put their voice at the heart of discussions regarding postgraduate medical education and training in Ireland. In December 2014, we shared the principle findings or the first wave of data from Your Training Counts survey and since then have begun discussions with our partner organisations involved in medical education and training in Ireland. We are doing this to
try and better understand how we can take forward the agenda which doctors in training, through their participation in Your Training Counts, have set for continuous improvement in the sector in Ireland. Our first inspections of clinical sites – informed by the views trainees provided to us through Your Training Counts – performed under the powers delegated to the Medical Council under the Medical Practitioners Act 2007 will take place this year. Besides focusing on the clinical learning environment, Your Training Counts provides an
opportunity to spotlight other issues which trainees themselves told us were important. We are pleased to present this first spotlight, which is a special report on the health and wellbeing of doctors in training in Ireland.
It is all too easy to confuse this as being a “soft” topic. In our view, it is critical to medical
education and training and to the future of the health system since without good health, doctors in training cannot fulfil their potential for good professional practice and ensure safe, high quality care for patients. In short, this is as much an issue for our health system as it is for our profession. Through describing the health and wellbeing of doctors in training, and drawing links with other aspects of their experience, the Medical Council looks forward to opening discussion with our partner organisations on how we can better support doctors in good professional practice for the benefit of patients.
___________________ ___________________
Prof Freddie Woods Dr Audrey Dillon President Vice-President
1 Osler W. Aequanimitas, with other addresses to medical students, nurses and practitioners of medicine. Philadelphia: The Blakiston Company, 1910.

3
CHIEF EXECUTIVE’S INTRODUCTION
We should never forget that people – patients, their families, and the professionals that care for
them – are at the heart of the healthcare in Ireland.
Over the last few years, work like the Medical Workforce Intelligence reports, the Talking About
Good Professional Practice dialogue with the public and doctors, and now the Your Training Counts
survey, are all beginning to widen and better inform discussion about the patient-doctor
relationship in 21st century Ireland and are placing this discussion in the context of the wider
health system.
I am pleased to continue discussion by introducing this second report based on the views we
collected from doctors in training through Your Training Counts 2014, which shines a spotlight on
their health and wellbeing.
A strong medical workforce – doctors who are physically and mentally fit – is essential for the
sustainability of the health system in Ireland. Doctors need to be supported to recognise that
caring effectively and compassionately for patients and their families also requires them to pay
attention to their own health and wellbeing. There is ample evidence to show that doctors with
good health provide safer and more effective care to patients, are more engaged in their work,
have better attendance, and are less likely to experience burnout and compassion fatigue. In
short, good health and wellbeing contribute to good professional practice.
This spotlight on trainee health and wellbeing, for the first time in Ireland, develops this evidence further and places it in a local context by providing a clear, robust and comprehensive overview of the current status of doctors in training. It is positive that the majority of trainees are in good health: over 8-in-10 doctors in training rated their health as “good”, “very good” or “excellent”.
It is also encouraging to note that so many trainees are highly engaged in their work with patients.
Doctors in training in Ireland approach their role in patient care with dedication, vigour and positive absorption and we need to ensure this strong and positive engagement is sustained throughout their working lives. However, good health is more than physical fitness and freedom from disease. It is notable that almost 1-in-5 trainees rated their quality of life as “poor” or “very poor”, and that for a similar
proportion there appeared to be some evidence to suggest that they may be experiencing challenges with mental health and wellbeing. These findings among Irish trainees are consistent with similar studies on quality of life and mental health and wellbeing among trainees and doctors. Through Your Training Counts, we are able to draw linkages between trainee health and wellbeing and other aspects of their training experience. A negative experience of the work environment
through bullying and undermining stands-out as being strongly and consistently linked with poorer quality of life and mental health; this is unsurprising but the relationship depicted in this report is stark. Other factors like hours worked and type of working and learning environment also showed strong and important relationships with the health and wellbeing of doctors in training. Finally,
lest there be any doubt but that trainee health and wellbeing is a legitimate concern in medical education and training, it is noteworthy that trainees with poorer health also reported more negative views of the clinical learning environment.
Doctors in training provide safe, effective and compassionate care for patients and families through times of great distress. They do so in an increasingly demanding health system context, while at the same time, are trying to build their future professional lives through medical education and training. Internationally, the health and wellbeing challenges faced by doctors in training are well recognised; meaning these findings are not unique to Ireland but cannot, and will not be overlooked. Doctors in training need support to maintain good health and wellbeing in the interest
of patient care through building awareness of these issues skills for appropriate self-care into medical education and training curricula. But we cannot limit our focus to the individual. Issues in
4
the clinical environment, like experiences of bullying and undermining, challenge maintenance of
good health and wellbeing and they need to be confronted. Our health system needs to consider the health and wellbeing of doctors and other caring professionals as a key to the quality agenda. At the Medical Council, we will continue to lead discussion on doctors’ health and wellbeing
because it is critical to good professional practice and to a strong and effective patient-doctor relationship. Through this spotlight, the Medical Council looks forward to continuing to work with trainees, educators, healthcare organisations and policy-makers to build strong systems for doctors’ education, training and practice – which include a concern for doctors health and wellbeing – in the interests of safe, effective and compassionate patient care.
Caroline Spillane
Chief Executive Officer

5
ABOUT THE MEDICAL COUNCIL
Through the regulation of doctors, the Medical Council enhances patient safety in
Ireland. In operation since 1979, it is an independent statutory organisation, charged
with fostering and ensuring good medical practice. It ensures high standards of
education, training and practice among doctors, and acts in the public interest at all
times. The Medical Council is noteworthy among medical regulators worldwide in having
a non-medical majority. It comprises of 13 non-medical members and 12 medical
members, and has a staff of approximately 70.
The Medical Council’s role focuses on four areas:
MAINTAINING THE REGISTER OF DOCTORS
The Medical Council reviews the qualifications and good standing of all doctors and
makes decisions about who can enter the register of medical practitioners. In December
2013, approximately 18,000 doctors were registered, allowing them to practise medicine
in Ireland.
SAFEGUARDING EDUCATION QUALITY FOR DOCTORS
The Medical Council is responsible for setting and monitoring standards for education and
training throughout the professional life of a doctor: undergraduate medical education,
intern and postgraduate training and lifelong learning. It can take action to safeguard
quality where standards are not met.
SETTING STANDARDS FOR DOCTORS’ PRACTICE
The Medical Council is the independent body responsible for setting the standards for
doctors on matters related to professional conduct and ethics. These standards are the
basis to good professional practice and ensure a strong and effective patient-doctor
relationship.
RESPONDING TO CONCERNS ABOUT DOCTORS
Where a patient, their family, employer, team member or any other person has a
concern about a doctors’ practice, the Medical Council can investigate a complaint.
When necessary, it can take appropriate action following its investigation to safeguard
the public and support the doctor in maintaining good practice.
Through its work across these four areas, the Medical Council provides leadership to
doctors in enhancing good professional practice in the interests of patient safety. You
can find out more about the Medical Council at www.medicalcouncil.ie.
Maintaining the register of doctors
Safeguarding education quality for doctors
Setting standards for doctors’ practice
Responding to concerns about doctors
Good professional practice in the interests of patient safety
and high quality care

6
TABLE OF CONTENTS
TRAINEE HEALTH AND WELLBEING AT A GLANCE .............................................. 8
INTRODUCTION.................................................................................................. 9
WHY YOUR TRAINING COUNTS? .................................................................................................. 10 WHY ASK TRAINEES’ ABOUT THEIR HEALTH AND WELLBEING? .................................................. 10 HOW DID WE MEASURE HEALTH AND WELLBEING? .................................................................... 11
PROFILE OF TRAINEE GENERAL HEALTH .......................................................... 13
SELF-RATED GENERAL HEALTH AMONG DOCTORS IN TRAINING IN IRELAND, 2014 ................... 14 VARIATIONS SELF-RATED GENERAL HEALTH AMONG DOCTORS IN TRAINING ............................ 14
PROFILE OF TRAINEE QUALITY OF LIFE ........................................................... 18
SELF-RATED QUALITY OF LIFE AMONG DOCTORS IN TRAINING IN IRELAND, 2014 .................... 19 VARIATIONS IN SELF-RATED QUALITY OF LIFE AMONG DOCTORS IN TRAINING ........................ 19
PROFILE OF TRAINEE MENTAL HEALTH AND WELLBEING ................................. 26
SELF-RATED MENTAL HEALTH AND WELLBEING AMONG DOCTORS IN TRAINING IN IRELAND,
2014 ............................................................................................................................................ 27 VARIATIONS IN MENTAL HEALTH AND WELLBEING AMONG DOCTORS IN TRAINING.................. 27
PROFILE OF TRAINEE WORK ENGAGEMENT ...................................................... 32
SELF-RATED WORK ENGAGEMENT AMONG DOCTORS IN TRAINING IN IRELAND, 2014 ............... 33 VARIATIONS IN WORK ENGAGEMENT AMONG DOCTORS IN TRAINING ....................................... 34
PROFILE OF TRAINEE UTILISATION OF SUPPORT SERVICES ............................ 40
FELT NEED FOR SUPPORT SERVICES AMONG DOCTORS IN TRAINING ......................................... 41 ACCESS OF SUPPORT SERVICES AMONG DOCTORS IN TRAINING WHO FELT A NEED ................. 44 EXPERIENCE OF SUPPORT SERVICES AMONG DOCTORS IN TRAINING ........................................ 45
CONCLUDING COMMENTS ................................................................................. 46

7
LIST OF FIGURES
Figure 1: Trainee views on general health - In general, would you say your health is? ...............................14
Figure 2: Trainee views on general health – variation by reported experience of bullying ..........................15
Figure 3: Trainee views on general health – variation by reported experience of undermining ....................15
Figure 4: Trainee views on general health – variation by reported hours worked in an average week ..........16
Figure 5: Trainee views on general health – variation by gender ...........................................................17
Figure 6: Trainee views on general health – variations in views of clinical learning environment .................17
Figure 7: Trainee views on quality of life - How would you rate your quality of life? ..................................19
Figure 8: Trainee views on quality of life – variation by age ...................................................................20
Figure 9: Trainee views on quality of life – variation by country of qualification ........................................21
Figure 10: Trainee views on quality of life – variation by stage of training .................................................21
Figure 11: Trainee views on quality of life – variation by type of clinical site ..............................................22
Figure 12: Trainee views on quality of life – variation by number of hours worked ......................................23
Figure 13: Trainee views on quality of life – variation by reported experience of bullying... .........................24
Figure 14: Trainee views on quality of life – variation by reported experience of undermining ......................24
Figure 15: Trainee views on quality of life – variation in views of the learning environment .........................25
Figure 16: Trainee views on mental health and wellbeing – Overview of Short Happiness-Depression Scale
scores ..............................................................................................................................27
Figure 17: Trainee views on mental health and wellbeing – variation by type of clinical sit ..........................28
Figure 18: Trainee views on mental health and wellbeing – variation by number of hours worked…………………29
Figure 19: Trainee views on mental health and wellbeing – variation by reported experience of bullying .......30
Figure 20: Trainee views on mental health and wellbeing – variation by reported experience of undermining .30
Figure 21: Trainee views on mental health and wellbeing – variation in views of the learning environment ....31
Figure 22: Trainee views on work engagement – Overview of Utrecht Work Engagement Scale scores ..........33
Figure 23: Work engagement – variation by age ....................................................................................35
Figure 24: Work engagement – variation by stage of training ..................................................................35
Figure 25: Work engagement – variation by country of qualification .........................................................36
Figure 26: Work engagement – variation by trainee reported experience of bullying ...................................37
Figure 27: Work engagement – variation by trainee reported experience of undermining ............................37
Figure 28: Work engagement – variation by hours worked in an average week ..........................................38
Figure 29: Work engagement - variations by views on learning environments…………………………………………………39
Figure 30: Felt need – “Have you ever felt the need to use support services about a wellbeing issue you
experienced while on training?”…………………………………………………………………………………………………………….41
Figure 31: Felt need, by gender – “Have you ever felt the need to use support services about a wellbeing issue
you experienced while on training?” .....................................................................................42
Figure 32: Felt need, by reported experience of bullying – “Have you ever felt the need to use support services
about a wellbeing issue you experienced while on training?” ....................................................42
Figure 33: Felt need, by reported experience of undermining – “Have you ever felt the need to use support
services about a wellbeing issue you experienced while on training?” .......................................43
Figure 34: Accessing support services in response to a felt need – Did you contact support services about your
wellbeing issue? ................................................................................................................44
Figure 35: Accessing support services in response to a felt need, by age group – Did you contact support
services about your wellbeing issue? ....................................................................................44
Figure 36: Experience of support services - How useful were the support services you received at work? .....45

8
TRAINEE HEALTH AND WELLBEING AT A GLANCE
The Medical Council invited trainees to share views on their health and wellbeing through Your Training Counts 2014.
Over 8-in-10 (88%) trainees rated their general health as being at least good; 2-in-10 (23%) rated their general health as ‘excellent’.
Many trainees reported good levels of engagement with their work. However, trainee views on quality of life and mental health and
wellbeing were less positive. 6-in-10 (62%) trainees rated their quality of life as being at least
good, but 2-in-10 rated it as ‘neither good nor poor’ and 2-in-10 (18%) rated it as ‘poor’ or ‘very poor’.
While many trainees reported positive mental health and wellbeing, 2-in-10 reported scores which indicated that they may be in need of
mental health and wellbeing support services.
Some significant trends in trainee reported health and wellbeing were identified.
Trainees who reported experiencing ‘bullying’ and ‘undermining’ also reported poorer health and wellbeing across a number of indices,
including: general health, quality of life, mental health and wellbeing and work engagement.
Trainees who reported working a greater number of hours per week also reported poorer health and wellbeing across a number of indices,
including: general health, quality of life, and mental health and wellbeing.
Trainee reported health and wellbeing indices were also linked with their views of the clinical learning environment. In general, trainees
who reported better health and wellbeing also had more positive views of the clinical learning environment.
In total, 3-in-10 (29%) trainees felt they needed to access some
support services for their health and wellbeing needs. Male trainees (21%) less commonly reported feeling a need for support services than
female trainees (35%). Despite reporting that they felt a need for support, over 8-in-10 (86%)
of trainees did not report accessing support services. Not accessing support services, despite feeling a need, was more common among
younger trainees.

9
INTRODUCTION
Key Points
Your Training Counts, the annual national trainee experience survey, is
a new programme, designed and delivered by the Medical Council,
which aims to inform and support the continuous improvement of the
quality of postgraduate medical training in Ireland.
In 2014, the Medical Council invited trainees to share views on their
health and wellbeing.
There is already a body of international evidence describing the
particular challenges which doctors in training face in maintaining good
health and wellbeing, especially sustaining good mental health and
avoiding burnout.
Besides being an issue for the individual trainee, good mental health
and wellbeing is important for good professional practice, for safe, high
quality and compassionate patient care and for the sustainability of the
health system.
Trainees were invited to share views on their general health, their
quality of life, their mental health and wellbeing, their engagement
with work and their utilisation of support services.

10
Why Your Training Counts?
The Medical Council is responsible for setting and monitoring standards for medical
education and training throughout the professional life of a doctor: undergraduate
medical education, intern and postgraduate training and lifelong learning.
There are just over 18,000 doctors registered to practise medicine with the Medical
Council in Ireland and approximately 3,000 of these are interns or specialist trainees (in
general, this report will refer to both groups of doctors as “trainees”, unless qualified).
Training pathways for doctors are variable: following intern training (which lasts for
twelve months), doctors proceed to basic specialist training (which lasts approximately 2
years) before proceeding to higher specialist training (which lasts approximately 4 to 6
years). Training in General Practice can commence following intern training and lasts for
4 years. These pathways are undergoing reform and some trainees pursue run-through
training.
Your Training Counts, the annual national trainee experience survey, is a new
programme, designed and delivered by the Medical Council, which aims to support the
continuous improvement of the quality of postgraduate medical training in Ireland –
workplace-based training for doctors which takes places across various clinical sites
including hospitals, mental health services and GP practices.
Specifically, the objectives of Your Training Counts are:
To monitor trainee views of the clinical learning environment in Ireland
To monitor trainee views of other aspects of postgraduate medical education and
training including preparedness for transitions, retention and career plans, health and
wellbeing, and trainee perceptions of safety at clinical sites
To inform the role of the Medical Council in safeguarding the quality of medical
education and training by identifying opportunities for strengthening standards and
guidance, and through focusing on its quality assessment role
To inform dialogue and collaboration between all individuals and bodies involved in
medical education and training in Ireland so as to continually improve the experience
and outcomes of trainees in Ireland.
Your Training Counts collected feedback from 1,636 trainees (just over half of all
trainees invited) on more than 100 questions. The Dutch Residency Educational Climate
Test (D-RECT), was used to collect trainee views of the clinical learning environment in
Ireland. Trainee views on inductions and orientation, preparedness for transitions,
bullying and undermining behaviours, trainee safety, and quality of patient care in the
clinical environment were elicited using questions from the General Medical Council’s
National Training Survey and questions developed by the UK Medical Careers Research
Group. The survey ran from April to July 2014. Trainees provided views of their
experience of training at a specific clinical site over the 12 months prior to the survey.
You can find more information about how we did Your Training Counts, including details
on methods and the main findings at http://bit.ly/YourTrainingCounts
Why ask trainees’ about their health and wellbeing?
There is a significant body of evidence describing the challenge faced by medical
students and trainees in maintaining good health and wellbeing, and it especially
highlights issues regarding mental health and burnout.2 Early transitions into the clinical
2 See for example:
Dyrbye L.N., Thomas, M.R., and Shanafelt, T.D. Systematic Review of Depression, Anxiety, and Other Indicators of
Psychological Distress Among U.S. and Canadian Medical Students. Acad Med 2006; 81:354–373.

11
environment for doctors at the initial stages of training can be especially challenging as
they gain new clinical responsibilities, have increased work hours and need to navigate
interpersonal relationships with other healthcare professionals, patients and their
families.3 The reality of the clinical environment can be a “culture shock”.4 It can
present trainees with professionalism dilemmas, which challenge how they think about
being a doctor, and these differences between what they ideally expect and what they
experience in reality can be especially distressing.5
Clearly, a challenge to maintaining good health and wellbeing creates issues for the
individual doctor in training. This should not be overlooked.
However, the case for focusing on trainee health and wellbeing also relates to the wider
context and relevance beyond individual trainees.
There is an emerging body of evidence which links doctors’ health and wellbeing with
patient care and health system outcomes. Doctors who themselves demonstrate
concern for their own health and wellbeing are more likely to counsel their patients
about staying healthy;6 this is important in the context of the increasing burden of
chronic disease and the need to promote population health. Burnout among doctors is
associated with reduced productivity.7 Fatigue and burnout have also been associated
with error in medical care.8,9 The linkages between doctors health and wellbeing and
their capability to provide compassionate care on an ongoing basis are also important.10
In summary, the health and wellbeing of doctors, including doctors in training, is
increasingly recognised as a medical professionalism issue and a health system “quality
indicator” issue.11,12 How did we measure health and wellbeing?
How did we measure health and wellbeing?
Your Training Counts 2014 invited trainees to respond to 11 different questions about
health and wellbeing:
one item on self-rated general health and one item on quality of life;13
six items comprising the Short Depression-Happiness Scale to examine mental health
and wellbeing; 14
nine items on engagement with work using the Utrecht Work Engagement Scale;15
three items to examine utilisation of and experience with support services.
Thomas, N.K. Resident burnout. JAMA 2004 Dec 15;292(23):2880-9. 3 Lamdin R. First Clinical Attachments: Informal Learning and Stressors in the Clinical Environment. In: First so no self-harm:
Understanding and promoting physician stress resilience. Figley C., Huggard P, and Rees C.E. Eds. Oxford: Oxford University Press, 2013. 4 Wear D., Aultman J.M., Varley J.D., Zarconi J. Making fun of patients: medical students’ perceptions and use of derogatory
humour in the clinical settings. Acad Med 2006 81(5): 454-462. 5 Rees C.E and Monreaux L.V. Narrative, emotion and action: analysing ‘most memorable’ professionalism dilemmas. Medical
Education 2013 47(1): 80-96. 6 Frank E. Physician Health and Patient Care. JAMA 2004 291(5):637. 7 Dewa C.S., Loong D., Bonato S., Thanh N.X., and Jacobs P. How does burnout affect physician productivity? A systematic
literature review. BMC Health Services Research 2014, 14: 325. 8 West C.P., Tan A.D., Habermann T.M., Sloan J.A., and Shanafelt T.D. Association of resident fatigue and distress with
perceived errors. JAMA 2004, 302(12): 1294-1300.
9 Fahrenkopf A.M., Sectish T.C., Barger L.K., et al. Rates of medication errors among depressed and burnt out residents:
prospective cohort study. BMJ 2008 336(7642): 358-367.
10 Huggard P, Stamm BH, and Pearlman L.A. Physician Stress: Compassion satisfaction, compassion fatigue and vicarious
traumatization. In: First so no self-harm: Understanding and promoting physician stress resilience. Figley C., Huggard P, and
Rees C.E. Eds. Oxford: Oxford University Press, 2013. 11 Canadian Medical Association, 1998. CMA Policy: Physician Health and Wellbeing. https://www.cma.ca/Assets/assets-
library/document/en/advocacy/policy-research/CMA_Policy_Physician_health_and_well-being_PD98-04-e.pdf 12 Wallace J.E., Lemaire J.B., and Ghali W.A. Physician wellness: a missing quality indicator. Lancet 2009 374:1714-21 13 Self-rated general health and quality of life questions are well established, valid and reliable measures of health status and are used, for example, in the Survey of Lifestyles and Nutrition in Ireland since 2002 .
(see http://www.ucd.ie/issda/data/surveyonlifestyleandattitudestonutritionslan/). 14 Joseph S, Linley PA, Harwood J, Lewis CA, McCollam P. Rapid assessment of well-being: The Short Depression-Happiness
Scale (SDHS). Psychol Psychother. 2004 Dec;77(Pt 4):463-78. 15 Schaufeli W and Bakker A. Utrecht work engagement scale: Preliminary Manual [Version 1, November 2003]. Accessed at
http://www.beanmanaged.com/doc/pdf/arnoldbakker/articles/articles_arnold_bakker_87.pdf

12
Trainees invited to take part in Your Training Counts were provided with comprehensive
information about the survey, its purposes and how their responses would be used by
the Medical Council. On this basis, they could determine whether they wanted to
participate or not. Furthermore, in the course of the survey, trainees could opt not to
share information on health and wellbeing if that was their preference.
In this spotlight, we provide results for each item asked regarding health and wellbeing,
and analyse responses by a range of personal characteristics (e.g. trainees’ age,
gender), contextual factors (e.g. what type of site they were located in) and other items
in Your Training Counts (e.g. experience of bullying) to look for significant variations in
experiences; which may help direct subsequent quality improvement strategies.
To help determine significant variations in trainee experiences, a range of parametric
and non-parametric statistical tests were conducted. When analysing normally
distributed data, parametric tests including independent samples tests (to compare
scores between two groups e.g. males and females), One-way ANOVAs (for comparing
scores between more than two groups e.g. age ranges) and Pearson’s correlations (for
comparing scores with other scale data) were used. Where scale data was not normally
distributed, non-parametric tests including Mann-Whitney U test (for comparing scores
from two different groups), Kruskal-Wallis tests (for comparing scores across 3 or more
groups), and Spearman’s rank order correlations (to check for correlations between
different scales) were used. When scale data was borderline in terms of the normality of
distribution both parametric and non-parametric tests were conducted with the most
conservative result reported. Phi values were used to gauge the strength of association
between nominal variables with two categories, Cramer’s V for associations between
nominal variables with more than two categories, and Gamma for describing the
strength of association between ordinal variables. All tests that reported a p value of <
.05 were considered as statistically significant; conclusions on direction or causative
nature of relationships are not inferred.
A data annex that provides more detail on the charts highlighted in this health and
wellbeing spotlight can be viewed at the following link: http://bit.ly/YourTrainingCounts

13
PROFILE OF TRAINEE GENERAL HEALTH
Key points
Over 8-in-10 (88%) of trainees rated their general health as at least
good; and 2-in-10 (23%) rated their health as ‘excellent’.
Most trainees shared a good experience of general health: rating did
not vary with significance based on age, whether they were a direct
entry or graduate entry medical student, whether they qualified with
their basic medical qualification in Ireland or elsewhere, their stage of
training or the type of site where they were training.
Trainee reported experience of ‘bullying’ and ‘undermining’ was linked
with self-rated general health: compared with trainees who did not
report bullying or undermining, trainees who reported these
experiences also rated their general health more poorly.
Trainee reported ‘hours worked per week’ was also linked with self-
rated general health: trainees who reported a greater number of hours
worked per week also rated their general health more poorly.

14
Self-rated general health among doctors in training in Ireland, 2014
In 2014, 88% of trainees rated their general health as being at least good; 23% rated
their general health as excellent (Figure 1).
Figure 1: Trainee views on general health - In general, would you say your health is?
Variations self-rated general health among doctors in training
There were no statistically significant associations between self-rated general health and
a range of other factors: trainees’ age; the region in which they gained their Basic
Medical Qualification (i.e. Ireland versus elsewhere); if they entered the profession
through direct or graduate entry routes; their stage of training; the type of site in which
they were located; or, how well-prepared they felt for the intern year.
Significant associations were found between health ratings and trainees’ (in order of
strongest associations first): experience of being bullied in post; hours worked in an
average week; experience of being undermined by a consultant or GP; overall views on
learning environments; and, gender. These findings are presented below.
General health and reported experience of bullying and undermining in post
There was a significant, and moderate, association between trainees’ general health
ratings and their reported experience of bullying. Trainees who reported being frequently
bullied in post were significantly more likely to rate their health as “less than good”
(26%) compared to trainees who were never bullied at work (9%) (2 (2, N=1361) =
49.79, p < .001 (see Figure 2).
23%
36%
29%
11%
0%
5%
10%
15%
20%
25%
30%
35%
40%
Excellent Very good Good Fair Poor
Self-rated general health status, 2014

15
There was also a significant, moderate, association between trainees’ general health
ratings and their reported experience of undermining behaviour from a consultant/GP in
post. Trainees who reported being frequently undermined by consultants/GPs were more
likely to have “less than good” health (22%), than trainees who reported that they were
never undermined (9%) (2 (2, N=1378) = 26.13, p < .001 (see Figure 3).
Figure 2: Trainee views on general health – variation by reported experience of bullying
Figure 3: Trainee views on general health – variation by reported experience of
undermining
*Please note: Columns sometimes do not add up to exactly 100% because of a ‘rounding up error’ eg.
figure 2, figure 4, figure 11, figure 12, figure 13, figure 14.
92% 84%
74%
9% 16%
26%
0%
10%
20%
30%
40%
50%
60%
70%
80%
90%
100%
Never bullied Infrequently
bullied
Frequently
bullied
Reported experience of being bullied in post
Health is less than good
Health is good or better
91% 87% 78%
9% 13% 22%
0%
10%
20%
30%
40%
50%
60%
70%
80%
90%
100%
Never
undermined
Infrequently
undermined
Frequently
undermined
Reported experience of undermining behaviour
from a consultant/GP
Health is less than good
Health is good or better
General health
rating
General health
rating

16
General health and reported hours worked in an average week
Self-rated general health and the number of hours trainees’ reported that they worked in
an average week were significantly, and moderately, associated. Trainees who reported
that they worked between 40-59 hours a week were significantly more likely to also rate
their general health as “good or better” (92%) than trainees who reported that they
worked between 60-79 hours a week (84%), or between 80-99 hours a week (68%) (2
(1, N=1432) = 28.08, p < .001; See Figure 4).
Figure 4: Trainee views on general health – variation by reported hours worked in an
average week
General health and gender
There was a statistically significant, but relatively small and weak, association between
trainees’ self-rated general health and gender. For example, female trainees were
significantly less likely to consider their health as “excellent” (21%), compared to male
doctors (26%); however, it’s worth noting that the pattern in gender difference varies
across rating (2 (4, N=1432) = 14.05, p = .007; see Figure 5).
86% 92%
84%
68% 75%
14% 8%
17%
32% 25%
0%
10%
20%
30%
40%
50%
60%
70%
80%
90%
100%
20-39
hours per
week
40-59
hours per
week
60-79
hours per
week
80-99
hours per
week
More than
100 hours
per week
Hours worked on an average week
Health is less than
good
Health is good or
better
General health
rating

17
Figure 5: Trainee views on general health – variation by gender
General health and views of the learning environment (D-RECT scores)
There was a significant, but relatively weak, association between trainees’ self-rated
general health and their views on clinical learning environments (i.e. D-RECT scores).
The general pattern was that better general health ratings were linked with better
perception of the clinical learning environment (F (4,1280) = 23.71, p < .001; see
Figure 6): for example, trainees who reported “excellent” health had a mean D-RECT
score of 181, while trainees who reported “poor” health had a mean D-RECT score of
144.
Figure 6: Trainee views on general health – variations in views of clinical learning
environment
21%
37%
32%
10%
1%
26%
35%
25%
12%
2%
0%
5%
10%
15%
20%
25%
30%
35%
40%
Excellent Very good Good Fair Poor
Self-reported health ratings
Female trainees
Male trainees
General health
rating
181 174 166 156
144
50
70
90
110
130
150
170
190
210
230
250
Excellent Very good Good Fair Poor
D-R
EC
T s
co
res
Self-rated general health

18
PROFILE OF TRAINEE QUALITY OF LIFE
Key points
Views from doctors in training on their quality of life were less positive
than their views on general health: 6-in-10 trainees (62%) rated their
quality of life as being at least good; 2-in-10 (21%) rated it as ‘neither
good nor poor’ and 2-in-10 (18%) rated it as ‘poor’ or ‘very poor’.
There was also greater variation in trainees’ views of their quality of
life than their self-rated health: the type of site in which trainees were
located, their stage of training, their age, and the whether they gained
their Basic Medical Qualification in Ireland or elsewhere were all
significantly associated with quality of life ratings.
Trainees in larger hospitals were significantly more likely to rate their
quality of life as less than good (43%) compared to trainees in GP
practices (22%).
Trainees who reported that they experienced ‘bullying’ or ‘undermining’
also rated their quality of life more poorly than those who did not
report these experiences.
Furthermore, the experience of working a greater number of hours per
week was also associated with a more poorly rated quality of life.
Finally, trainee views on their quality of life were linked with their
views of the clinical learning environment (D-RECT score): trainees
rating their quality of life poorly also had poor views of the clinical
learning environment.

19
Self-rated quality of life among doctors in training in Ireland, 2014
In 2014, 62% of trainees rated their quality of life as being at least good; 18% rated
their quality of life as poor or very poor (Figure 7).
Figure 7: Trainee views on quality of life - How would you rate your quality of life?
Variations in self-rated quality of life among Doctors in training
Trainee-related characteristics were linked with their rating of quality of life: there were
significant, but relatively weak, linkages between quality of life ratings and trainee age,
whether the trainee gained their Basic Medical Qualification in Ireland or overseas and
the stage of training. Whether the trainee was a direct-entry or graduate entry medical
student was not significantly linked with quality of life ratings (2 (4, N=1128) = 9.04, p
= .060).
Aspects of the environment were related to quality of life. The type of site in which
trainees were located was significantly, but relatively weakly, linked with quality of life
ratings.
Importantly, there were significant and moderately strong linkages between quality of
life ratings and (in order of strength of association, with the strongest first) reporting the
experience of being bullied in post, the self-reported number of hours worked in an
average week, and reporting the experience of being undermined by a consultant/GP.
Finally, views of the clinical learning environment were also significantly and moderately
associated with quality of life.
14%
48%
21%
15%
3%
0%
10%
20%
30%
40%
50%
60%
Very good Good Neither good
nor poor
Poor Very poor
Self-rated quality of life

20
Quality of life and trainee-related characteristics
Age was significantly, but weakly, associated with trainee views on their quality of life.
The general pattern is that younger trainees reported a better quality of life, 2 (4, N =
1427) = 16.81, p = .002. For example, trainees in the 20-24 year old category were
more likely to rate their quality of life as good or better (75%), compared to trainees in
the 35-39 year old category (51%).
Figure 8: Trainee views on quality of life – variation by age
Similarly, quality of life ratings were significantly, but weakly, linked with where trainees
gained their Basic Medical Qualification (BMQ). Trainees who graduated from Irish
medical schools were more likely to rate their quality of life as good or better (63%)
compared to trainees who graduated elsewhere (57%), 2 (1, N=1427) = 4.15, p =
.042.
75% 64% 62%
51% 64%
25% 36% 38%
49% 36%
0%
10%
20%
30%
40%
50%
60%
70%
80%
90%
100%
20-24 25-29 30-34 35-39 40 and
overAge group (years)
Quality of life is less than
good
Quality of life is good or
better
Quality of life rating

21
Figure 9: Trainee views on quality of life – variation by country of qualification
Trainees views on quality of life were significantly, albeit weakly, associated with
different stages of training. Trainees on GP training programmes were more likely to rate
their quality of life as good or better (69%) than trainees on BST programmes (56%), 2 (5, N=1425) = 20.18, p = .001.
Figure 10: Trainee views on quality of life – variation by stage of training
63% 57%
37% 43%
0%
10%
20%
30%
40%
50%
60%
70%
80%
90%
100%
Irish Medical School
Graduate
Graduate from outside
Ireland
Region of BMQ graduation
Quality of life is less than
good
Quality of life is good or
better
67% 56%
69%
49% 60% 63%
33% 44%
31%
51% 40% 37%
0%
10%
20%
30%
40%
50%
60%
70%
80%
90%
100%
Intern BST GP Run
through
HST Registrar
Stage of training
Quality of life
is less than
good
Quality of life
is good or
better
Quality of life
rating
Quality of life rating
22
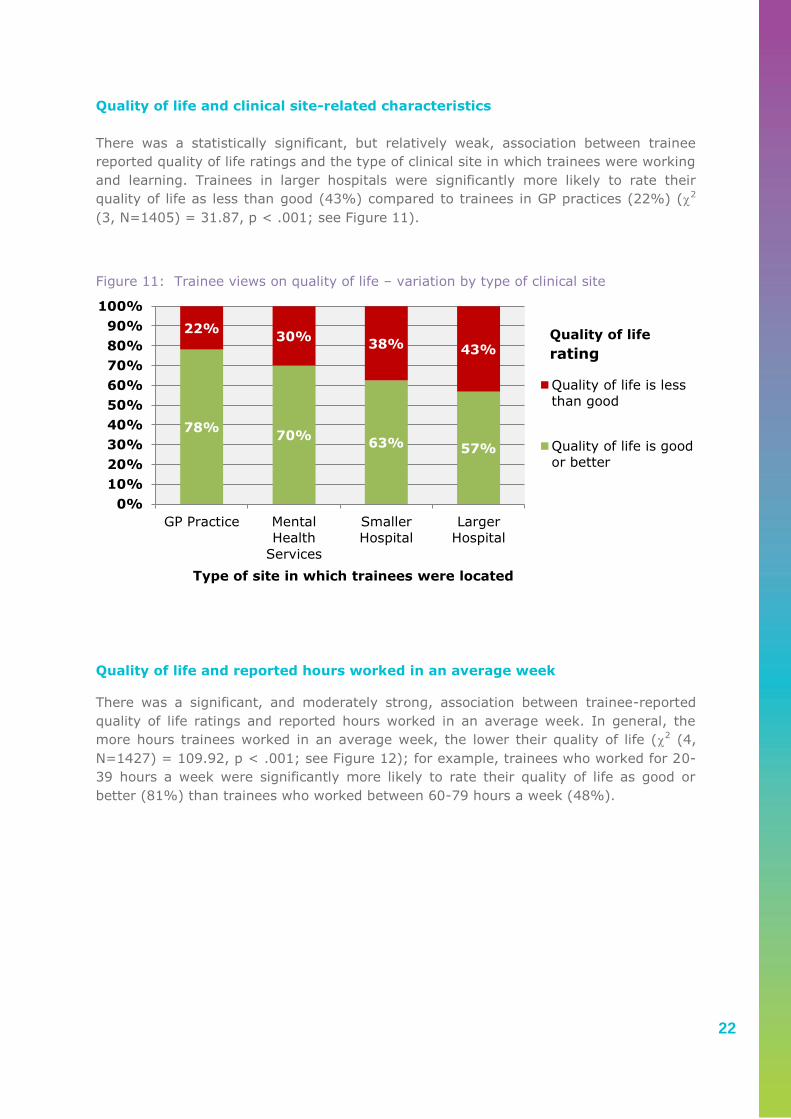
Quality of life and clinical site-related characteristics
There was a statistically significant, but relatively weak, association between trainee
reported quality of life ratings and the type of clinical site in which trainees were working
and learning. Trainees in larger hospitals were significantly more likely to rate their
quality of life as less than good (43%) compared to trainees in GP practices (22%) (2
(3, N=1405) = 31.87, p < .001; see Figure 11).
Figure 11: Trainee views on quality of life – variation by type of clinical site
Quality of life and reported hours worked in an average week
There was a significant, and moderately strong, association between trainee-reported
quality of life ratings and reported hours worked in an average week. In general, the
more hours trainees worked in an average week, the lower their quality of life (2 (4,
N=1427) = 109.92, p < .001; see Figure 12); for example, trainees who worked for 20-
39 hours a week were significantly more likely to rate their quality of life as good or
better (81%) than trainees who worked between 60-79 hours a week (48%).
78% 70%
63% 57%
22% 30%
38% 43%
0%
10%
20%
30%
40%
50%
60%
70%
80%
90%
100%
GP Practice Mental
Health
Services
Smaller
Hospital
Larger
Hospital
Type of site in which trainees were located
Quality of life is less
than good
Quality of life is good
or better
Quality of life
rating

23
Figure 12: Trainee views on quality of life – variation by number of hours worked
Quality of life and reported experience of bullying and undermining in post
There was a moderately strong association between trainee reported quality of life
ratings and trainee reported experience of being bullied in post. Trainees who reported
that they were bullied frequently were significantly more likely to rate their quality of life
as less than good (66%) than trainees who reported that they were never bullied in post
(28%), (2 (2, 1359) = 109.47, p < .001; see Figure 13). There was also a significant,
moderate, association between quality of life ratings and trainee reported experiences of
being undermined by a consultant/GP in post. Trainees that were reported as being
frequently undermined in post were more likely to rate their quality of life as less than
good (58%) than trainees who reported that they were never undermined (31%), (2 (2,
N=1373) = 53.21, p <.001; see Figure 14).
81% 71%
48%
30%
13%
19% 29%
52%
70%
88%
0%
10%
20%
30%
40%
50%
60%
70%
80%
90%
100%
20-39 hours
per week
40-59 hours
per week
60-79 hours
per week
80-99 hours
per week
More than
100 hours
per week
hours worked in an average week
Quality of life is
less than good
Quality of life is
good or better
Quality of life
rating

24
Figure 13: Trainee views on quality of life – variation by reported experience of bullying
Figure 14: Trainee views on quality of life – variation by reported experience of
undermining
72%
53%
35%
28%
47%
66%
0%
10%
20%
30%
40%
50%
60%
70%
80%
90%
100%
Never bullied Infrequently bullied Frequently bullied
Experience of being bullied in post
Quality of life is
less than good
Quality of life is
good or better
Quality of life
rating
70% 60%
42%
31% 40%
58%
0%
10%
20%
30%
40%
50%
60%
70%
80%
90%
100%
Never undermined Infrequently
undermined
Frequently
undermined
Experience of being undermined by a consultant/GP
Quality of life is
less than good
Quality of life is
good or better
Quality of life
rating

25
Quality of life and views of the learning environment (D-RECT scores)
There was a significant, and moderately strong, association between trainee reported
quality of life ratings and their views on learning environments (i.e. total D-RECT
scores). In general, trainees who reported better quality of life rating also reported
better views of the quality of learning environment. For example, trainees who reported
“very good” quality of life had a mean D-RECT score of 189, while trainees who rated
their quality of life as “very poor” had a mean D-RECT score of 149 (F (4,1277) = 48.70,
p < .001; see Figure 15).
Figure 15: Trainee views on quality of life – variation in views of the learning
environment
189
175 169
151 149
50
70
90
110
130
150
170
190
210
230
250
Very good Good Neither good
nor poor
Poor Very poor
D-R
EC
T S
co
res
Quality of life ratings

26
PROFILE OF TRAINEE MENTAL HEALTH AND
WELLBEING
Key points
We invited trainees to rate their mental health and wellbeing using the
Short Depression-Happiness Scale (SDHS), a rapid assessment of
mental health and wellbeing which provides a score on a scale of 0-18:
higher scores indicating better mental health and wellbeing. The
instrument is a valid and reliable measure of mental health and
wellbeing but is not designed to diagnose mental health problems.
However, a score of 9 or less (i.e. midpoint on the scale or lower)
helps distinguish respondents whose mental health and wellbeing may
be causing them some difficulty and for who some support might be
helpful.
Overall, SDHS ratings show that many trainees’ enjoy good mental
wellbeing. The mean SDHS score among trainees was 12.5 (95% CI
12.3 – 12.7).
However, 2-in-10 (21%) trainees reported SDHS scores of 9 or less
indicating that their mental health and wellbeing may be causing them
some difficulty.
Similar mental health and wellbeing was enjoyed by trainees with
different characteristics. There were no significant variations in SDHS
scores based on gender, whether or not the trainee gained their Basic
Medical Qualification in Ireland or overseas, whether they were a direct
entry or graduate entry medical student, their age, or their stage of
training.
However, SDHS scores were linked with trainee reported experience of
bullying and undermining: trainees that reported experience of bullying
and undermining also reported lower SDHS scores.
SDHS scores were also linked with trainee reported hours worked in an
average week: trainees that reported working a greater number of
hours also reported lower SDHS scores.
Finally, SDHS scores were linked with views of the clinical learning
environment. Trainees who reported lower SDHS scores also reported
poorer views of the clinical learning environment.

27
Self-rated mental health and wellbeing among doctors in training in Ireland,
2014
Trainees were invited to provide views on their mental health and wellbeing using the
Short Depression-Happiness Scale (SDHS).16 The scale includes 6 questions scored on a
3-point scale and so provides a score between 0 (poorest mental health and wellbeing
score) to 18 (best possible mental health and wellbeing score). In general, higher SDHS
score indicate better mental health and wellbeing. The SDHS is a rapid assessment of
mental health and wellbeing and, while useful, is not designed to diagnose mental health
difficulties. This is relevant to the interpretation of these findings.
Figure 16 provides an overview of trainee reported SDHS scores. The mean SDHS score
among trainees was 12.5 (95% CI 12.3 – 12.7) (SD = 3.6).
Using the instrument, the mid-point score is 9, and a score of 9 or less may signify a
concern for a possible mental health and wellbeing difficulty and a potential need for
support. Based on this cut-off, 21% of trainees were identified as experiencing a
possible mental health and wellbeing difficulty.
Figure 16: Trainee views on mental health and wellbeing – Overview of Short
Happiness-Depression Scale Scores
Variations in mental health and wellbeing among doctors in training
There were no significant variations in trainee SDHS scores linked with trainees’ gender,
age, region in which trainees gained their Basic Medical Qualification, whether they were
a direct or graduate entry medical student, or their stage of training.
There was a significant association between trainee SDHS scores and type of clinical site
where the trainee worked and learned.
16 Joseph S, Linley PA, Harwood J, Lewis CA, McCollam P. Rapid assessment of well-being: The Short Depression-Happiness Scale (SDHS). Psychol Psychother. 2004 Dec;77(Pt 4):463-78.
0
20
40
60
80
100
120
140
160
0 1 2 3 4 5 6 7 8 9 10 11 12 13 14 15 16 17 18
Nu
mb
er o
f tr
ain
ees
Scores on the Short Depression-Happiness Scale (0-18)

28
Furthermore, there were also significant variations in trainee SDHS scores linked with
trainee reported experience of bullying and undermining and reported number of hours
worked per week.
Finally, trainee SDHS scores were significantly associated with trainee views of the
clinical learning environment (i.e. total D-RECT scores).
Mental health and wellbeing and clinical site-related characteristics
There was a significant difference in mental health and wellbeing reported by trainees
working and learning in different types of clinical sites: trainees in GP practices reported
significantly higher SDHS scores (13.4) than trainees in larger hospitals (12.3)
(F(3,1371) = 5.82, p=.001; see Figure 17).
Figure 17: Trainee views on mental health and wellbeing – variation by type of clinical
site
Mental health and wellbeing and reported hours worked in an average week
There was significant variation in trainee reported SDHS scores depending on the
number of hours which they reported working in an average week. In general, trainees
who reported working more hours in an average week also reported lower mental health
and wellbeing. For example, trainees who reported that they worked between 40-59
hours a week had a mean SDHS score of 13, which was significantly higher than the
SDHS score of 10.9 for trainees who reported that they worked between 80-99 hours a
week (F (4,1392) = 16.12, p < .001; see Figure 18).
13.4 13.2 12.5 12.3
0
2
4
6
8
10
12
14
16
18
GP Practice Mental Health
Services
Smaller Hospital Larger Hospital
Train
ees s
co
res o
n S
DH
S
Type of learning environment in which trainees were located

29
Figure 18: Trainee views on mental health and wellbeing – variation by number of hours
worked
Mental health and wellbeing and reported experience of bullying and
undermining in post
Trainee reported SDHS scores differed significantly with their reported experiences of
bullying in the workplace. The general pattern was that increasing frequency of trainee-
reported bullying experience was linked with decreasing SDHS scores for mental health
and wellbeing (F (2, 1332) = 86.94, p < .001; see Figure 19); for example, trainees who
reported that they were never bullied reported a mean SDHS score of 13.4, which was
significantly higher than SDHS scores reported by trainees who also reported that they
were bullied infrequently (11.7) and was also higher than the scores reported by trainees
who also reported they were frequently bullied (10.1).
Similarly, there was a significant association between trainee reported SDHS scores and
their reported experience of being undermined by a consultant or GP in their post (F (2,
1348) = 78.57, p < .001; see Figure 20); for example, trainees who reported that they
were never undermined also reported significantly higher SDHS scores (13.5) than
trainees who reported that they were infrequently undermined (11.9) and trainees who
reported that they were frequently undermined (10.3).
13.7 13.0 11.7 10.9 10.3
0
2
4
6
8
10
12
14
16
18
20-39 hours
per week
40-59 hours
per week
60-79 hours
per week
80-99 hours
per week
More than 100
hours per week
Train
ees s
co
res o
n t
he S
DH
S
Hours worked on an average week

30
Figure 19: Trainee views on mental health and wellbeing – variation by reported
experience of bullying
Figure 20: Trainee views on mental health and wellbeing – variation by reported
experience of undermining
13.4 11.7
10.1
0
2
4
6
8
10
12
14
16
18
Never bullied Infrequently bullied Frequently bullied
Train
ees s
co
res o
n S
DH
S
Frequency of trainee reported bullying behaviour
13.5 11.9
10.3
0
2
4
6
8
10
12
14
16
18
Never undermined Infrequently
undermined
Frequently underminedTrain
ees s
co
res o
n t
he S
DH
S
Experience of being undermined by a consultant/GP in post

31
Mental health and wellbeing and views of the learning environment (D-RECT
scores)
Finally, there was a significant positive correlation between trainee reported SDHS
scores and their overall views on the clinical learning environment (as measured by the
total D-RECT score) (r (1254) = .354, p < .001): this was a positive relationship and
more positive mental health and wellbeing, measured using the SDHS was linked with
more positive views of the clinical learning environment. Total D-RECT scores were
compared across trainee reported SDHS scores, categorised using the cut-off of 9 (see
above). Trainees reporting SDHS scores ratings that suggested there might be a
concern that they were experiencing some mental health and wellbeing difficulties rated
their learning environments significantly more poorly (total D-RECT score 156) than
trainees reporting better wellbeing ratings (total D-RECT score 175) (t (1254) = 8.74, p
< .001; see Figure 21).
Figure 21: Trainee views on mental health and wellbeing – variation in views of the
learning environment
156 175
50
70
90
110
130
150
170
190
210
230
250
SDHS Score 9 or less SDHS Score 10 or more
D-R
EC
T S
co
res

32
PROFILE OF TRAINEE WORK ENGAGEMENT
Key points
Engagement is a positive, fulfilling, work-related state of mind
characterised by vigour, dedication and absorption; energetic
engagement with work is important for the individual, and in the case
of medicine, is important for patient care. Engagement may be
protective against burnout and provides a strength-based approach to
understanding how trainees manage with work and training. We
invited trainees to share views on their engagement with work using a
9-item version of the Utrecht Work Engagement Scale (UWES), which
is a validated and reliable instrument for measuring engagement with
work that has been used previously with doctors in training.
Many trainees reported views which indicated that they are well
engaged with their work and had high UWES scores.
Other indices of trainee health and wellbeing were linked with
engagement – trainees who reported better health and wellbeing also
tended to report greater engagement with work.
Increasing trainee age and later stage of training were, in general,
linked with greater trainee reported engagement with work. Trainees
who qualified outside Ireland reported greater engagement than
trainees who qualified in Ireland.
Trainee reported experience of bullying and undermining was linked
with work engagement; trainees reporting more frequent experience of
bullying and undermining also reported lower engagement.
There was no strong or significant link between hours worked and work
engagement.
Work engagement and views of the clinical learning environment were
linked; trainees reporting greater work engagement also reported
more positive views of the clinical learning environment.

33
Self-rated work engagement among doctors in training in Ireland, 2014
There is growing focus on the issue of how trainees manage with work and training, and
how they cope with the various stressors which confront them. The Medical Council was
interested in exploring this aspect of trainee experience. Burnout is one concept
relevant to this area. We chose to take a strength-based approach to trainees
management by examining engagement with work, a positive, fulfilling, work-related
state of mind characterised by vigour, dedication and absorption; such energetic
engagement with work may be protective against burnout.17 Understanding engagement
with work offers a positive and constructive way to planning to support doctors in
training. We invited trainees to share views on their engagement with work using a 9-
item version of the Utrecht Work Engagement Scale (UWES), which is a validated and
reliable instrument for measuring engagement with work that has been used previously
with doctors in training.18 Scores on the UWES range between 0-6, with higher ratings
meaning greater work engagement. On this scale, engagement is a spectrum; that is to
say, UWES distinguishes between trainees reporting greater and lesser engagement with
work, but there is no particular “cut-off” that separates trainees into those who can be
said to be “engaged” and those that can be said to be “disengaged”.
Overall, trainee UWES scores suggest that many of trainees are highly engaged in their
work. The mean score for trainees was 4.24 (95% CI 4.1 – 4.30, with a SD of 1.15) and
the median 4.56. Figure 22 provides an overview of trainee reported UWES scores
Figure 22: Trainee views on work engagement – Overview of Utrecht Work Engagement
Scores
17 Prins J.T., Hoekstra-Weebers, J.E., Gazendam-Donofrio S.M. et al. Burnout and engagement among resident doctors in the
Netherlands: a national study. Medical Education 2010 44: 236-247. 18 Schaufeli W and Bakker A. Utrecht work engagement scale: Preliminary Manual [Version 1, November 2003]. Accessed at
http://www.beanmanaged.com/doc/pdf/arnoldbakker/articles/articles_arnold_bakker_87.pdf
0
10
20
30
40
50
60
70
80
90
100
0 1 2 3 4 5 6
Nu
mb
er o
f tr
ain
ees
Scores on the Utrecht Work Engagement Scale

34
Variations in work engagement among doctors in training
Although trainee work engagement is high, there are significant (and moderate)
differences in UWES scores for trainees with different: health ratings; wellbeing ratings;
experiences of bullying and undermining in the workplace; and, views on their learning
environment. There are significant, albeit weak, associations between work engagement
ratings and trainee: age; stage of training; and, the region in which they graduated from
medical school.
There were no significant differences in UWES scores due to hours worked in an average
week, gender, or the type of site in which trainees worked.
Work engagement and other measures of trainee health and wellbeing
In general, trainee reported work engagement was associated with other measures of
health and wellbeing; greater work engagement was reported by trainees who also
reported more positive health and wellbeing.
Trainees that rated their general health as “excellent” reported a mean UWES score of
4.59, compared to a mean UWES score of 2.87 for trainees who rated their general
health as “poor” (F (4, 1329) = 33.01, p < .001).
Similarly, trainees that rated their quality of life as “very good” reported a mean UWES
score of 4.77, which was significantly higher than the mean UWES score for trainees that
rates their quality of life as “poor” of 3.63, (F (4, 1323) = 49.35, p < .001).
Finally, trainees’ ratings about work engagement were significantly correlated (positively
and moderately) with perceptions of their mental health and wellbeing measured with
the SDHS (r(1312) = .493, p < .001).
35
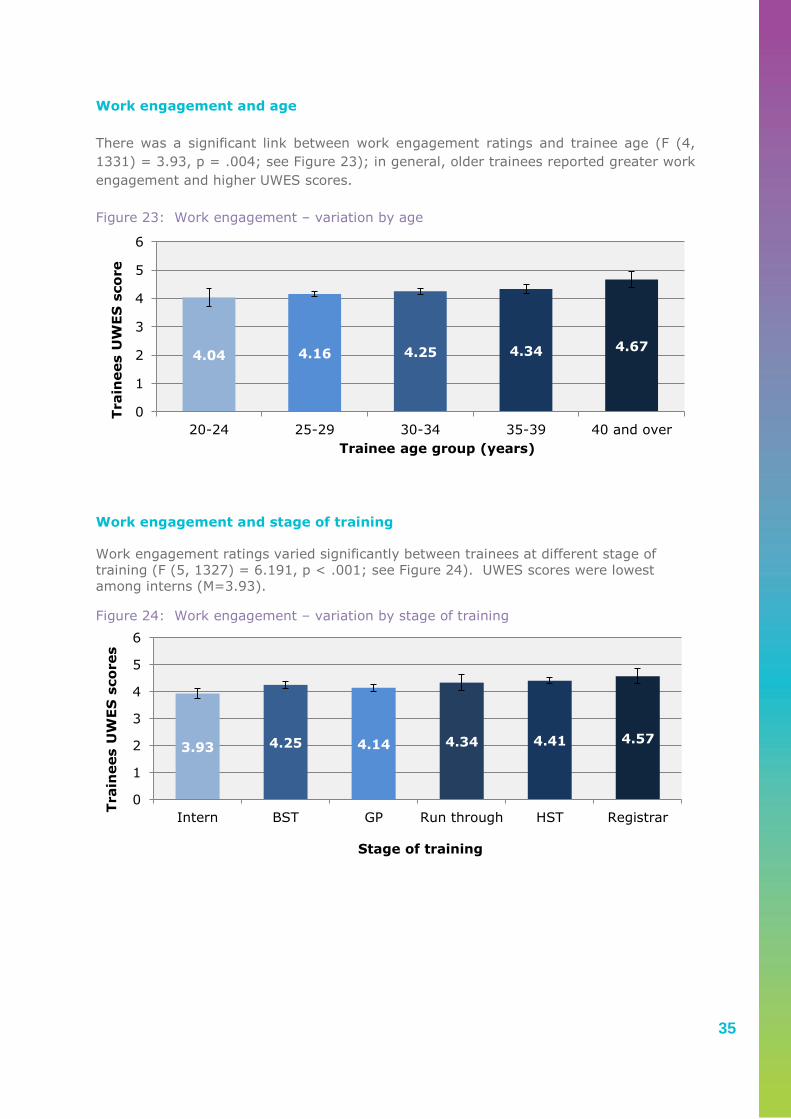
Work engagement and age
There was a significant link between work engagement ratings and trainee age (F (4,
1331) = 3.93, p = .004; see Figure 23); in general, older trainees reported greater work
engagement and higher UWES scores.
Figure 23: Work engagement – variation by age
Work engagement and stage of training
Work engagement ratings varied significantly between trainees at different stage of
training (F (5, 1327) = 6.191, p < .001; see Figure 24). UWES scores were lowest
among interns (M=3.93).
Figure 24: Work engagement – variation by stage of training
4.04 4.16 4.25 4.34 4.67
0
1
2
3
4
5
6
20-24 25-29 30-34 35-39 40 and over
Train
ees U
WE
S s
co
re
Trainee age group (years)
3.93 4.25 4.14 4.34 4.41 4.57
0
1
2
3
4
5
6
Intern BST GP Run through HST Registrar
Train
ees U
WE
S s
co
res
Stage of training

36
Work engagement and country of qualification
There was a significant difference in mean UWES scores between trainees who graduated
from medical schools in different regions. Trainees who graduated in Ireland tended to
report lower work engagement scores than trainees who graduated from other regions.
Trainees who graduated from Irish medical schools had a mean UWES score of 4.18,
compared to a mean UWES score of 4.51 for trainees who graduated outside Ireland
(t(1334) = 4.129, p < .001; see Figure 25).19
Figure 25: Work engagement – variation by country of qualification
Work engagement and reported experience of bullying and undermining in post
Trainee views on work engagement varied significantly depending on their reported
experience of bullying and undermining. The mean UWES score for trainees who were
never bullied in post was 4.43, which was significantly higher than the mean UWES score
for trainees who were infrequently bullied (M=4.10), and higher than those who were
frequently bullied (M=3.64) (F(2, 1278) = 40.39, p < 0.001; see Figure 26). Similarly,
trainees who reported that they were never undermined by a consultant/GP also
reported significantly higher work engagement scores (M = 4.42) than trainees who
reported that they were infrequently undermined (M=4.13) and trainees who reported
that they were frequently undermined (M=3.78) (F (2, 1296) = 26.63, p < .001; See
Figure 27).
19 Although the age profile of trainees who graduated from Irish medical schools and those who graduated elsewhere are
different (with international graduate trainees being older) significant differences in UWES scores were still found when
controlling for age.
4.18 4.51
0
1
2
3
4
5
6
Irish Medical School Graduate Graduate from outside Ireland
Train
ees s
co
res o
n t
he
UW
ES
Region of BMQ qualification

37
Figure 26: Work engagement – variation by trainee reported experience of bullying
Figure 27: Work engagement – variation by trainee reported experience of undermining
4.43 4.10 3.64
0
1
2
3
4
5
6
Never bullied Infrequently bullied Frequently bullied
Train
ees s
co
res o
n t
he U
WE
S
Reported experience of being bullied in post
4.42 4.13 3.78
0
1
2
3
4
5
6
Never undermined Infrequently
undermined
Frequently undermined
Train
ees s
co
res o
n t
he U
WE
S
Reported experience of being undermined by a
consultant/GP in post

38
Work engagement and hours worked
While there was a trend towards decreasing engagement with increasing number of
hours worked, there was no significant difference identified (F(3, 1332) = 2.39, p =
.067; see Figure 28).
Figure 28: Work engagement – variation by hours worked in an average week
4.34 4.30 4.13 4.16
0
1
2
3
4
5
6
20-39 hours 40-59 hours 60-79 hours more than 80
hours
Train
ees s
co
res o
n t
he
UW
ES
Hours worked on average week

39
Work engagement and views of the learning environment (D-RECT scores)
Finally, trainees reported work engagement was significantly correlated (positively and
moderately) with perceptions of the learning environment; trainees with greater work
engagement also tended to have more positive views of the clinical learning environment
(r(1312) = .493, p < .001). To display the link between UWES scores and views on the
learning environment, trainees UWES scores were converted into categories based on
the distribution of scores as described by the scale developers.
Figure 29: Work engagement – variations by perceptions of clinical learning environments
Figure 29 shows that for each different UWES category (between Very low to High),
trainees gave significantly different D-RECT scores. The pattern suggests that the higher
trainee work engagement, the higher the perception of the quality of learning
environments, F (4, 1150) = 80.31, p < .001.
134 155
172 188 200
50
70
90
110
130
150
170
190
210
230
250
Very low Low Average High Very high
To
tal
D-R
EC
T s
co
red
s
UWES ratings
40
PROFILE OF TRAINEE UTILISATION OF SUPPORT
SERVICES
Key points
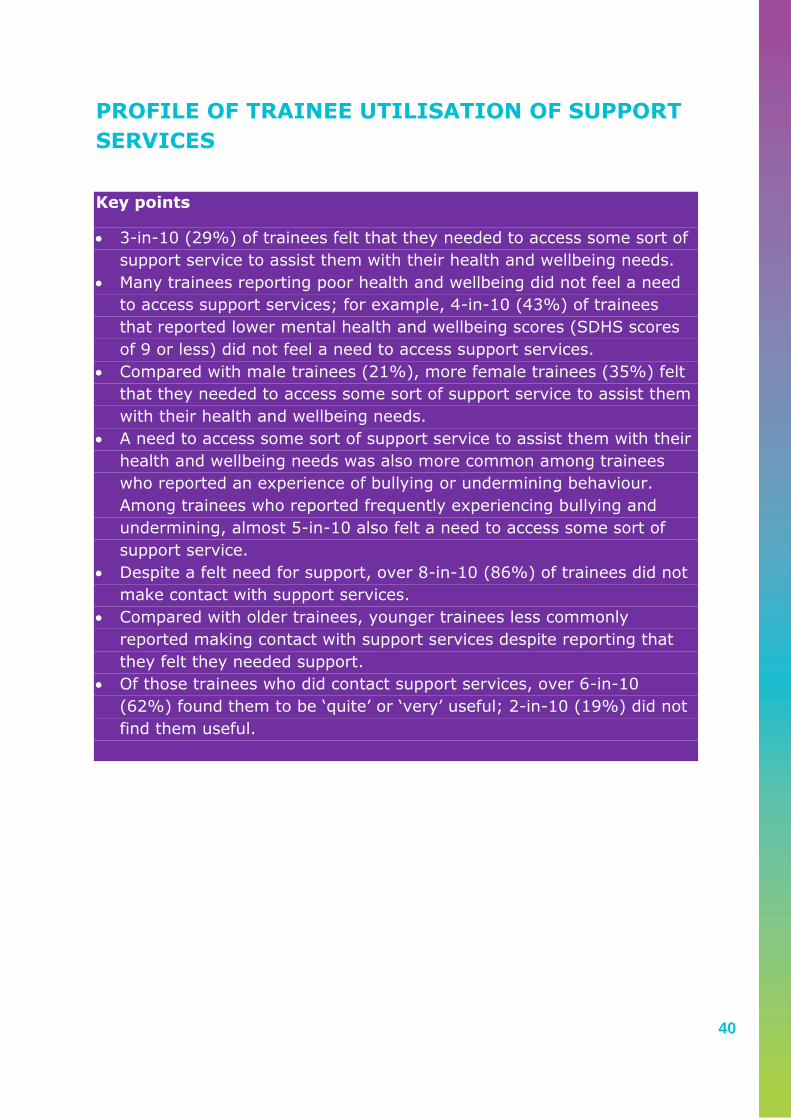
3-in-10 (29%) of trainees felt that they needed to access some sort of
support service to assist them with their health and wellbeing needs.
Many trainees reporting poor health and wellbeing did not feel a need
to access support services; for example, 4-in-10 (43%) of trainees
that reported lower mental health and wellbeing scores (SDHS scores
of 9 or less) did not feel a need to access support services.
Compared with male trainees (21%), more female trainees (35%) felt
that they needed to access some sort of support service to assist them
with their health and wellbeing needs.
A need to access some sort of support service to assist them with their
health and wellbeing needs was also more common among trainees
who reported an experience of bullying or undermining behaviour.
Among trainees who reported frequently experiencing bullying and
undermining, almost 5-in-10 also felt a need to access some sort of
support service.
Despite a felt need for support, over 8-in-10 (86%) of trainees did not
make contact with support services.
Compared with older trainees, younger trainees less commonly
reported making contact with support services despite reporting that
they felt they needed support.
Of those trainees who did contact support services, over 6-in-10
(62%) found them to be ‘quite’ or ‘very’ useful; 2-in-10 (19%) did not
find them useful.

41
Felt need for support services among doctors in training
The results reported in the preceding sections of this spotlight report highlights need
among trainees with respect to their health and wellbeing. Many training organisation
and healthcare organisations offer support services such as access to counselling or
occupational health services. We asked trainees to report their views as to whether or
not they felt a need to access such services; 29% felt this need (see Figure 30).
Figure 30: Felt need – “Have you ever felt the need to use support services about a
wellbeing issue you experienced while on training?”
Trainees’ who felt the need to access support services was examined across trainees
categorised by their measures of self-reported health and wellbeing. While trainees
reporting poorer health and wellbeing tended, in general, to more commonly report a felt
need to access support services, significant numbers with poor health and wellbeing did
not report a feeling of need for support. In total, 35% of trainees reporting poor self-
rated health, 44% reporting a very poor quality of life and 43% reporting poorer mental
health and wellbeing (i.e. SDHS scores of 9 or less) also reported that they did not feel a
need to access support services.
Female trainees more commonly reported that they felt the need to access support in
relation to a wellbeing in comparison to males (35% versus 21%, 2 (1, N=1360) =
29.32, p < .001; see Figure 31).
71%
29%
0%
10%
20%
30%
40%
50%
60%
70%
80%
No - I did not feel the need to access
support services
Yes - I felt the need to access support
services
Felt need for support with a wellbeing issue

42
Figure 31: Felt need, by gender – “Have you ever felt the need to use support services
about a wellbeing issue you experienced while on training?”
Trainee reported experience of bullying and undermining behaviour was also linked with
felt need to access support services: 39% of trainees who reported that they
experienced infrequent bullying in the workplace, and 49% of trainees who reported that
they experienced frequent bullying in the workplace, also reported that they felt they
needed support with a wellbeing issue, compared to 22% of trainees who reported that
they were not bullied (2 (2, N=1302) = 71.48, p < .001; see Figure 32); similarly,
trainees who reported that they were never undermined were also less likely to report
that they felt the need for support services (22%) compared to trainees who were
infrequently undermined (34%) and frequently undermined (46%), (2 (2, N = 1317) =
49.23, p < .001; see Figure 33).
Figure 32: Felt need, by reported experience of bullying – “Have you ever felt the need
to use support services about a wellbeing issue you experienced while on training?”
65% 79%
35% 21%
0%
10%
20%
30%
40%
50%
60%
70%
80%
90%
100%
Female MaleGender
Yes - I felt the need to
access support services
about a wellbeing issue
No - I did not feel the
need to access support
services about a
wellbeing issue
78%
61% 51%
22%
39% 49%
0%
10%
20%
30%
40%
50%
60%
70%
80%
90%
100%
Never bullied Infrequently
bullied
Frequently bullied
Reported expereince of bullying
Yes - I did feel the need
to access support
services
No - I did not feel the
need to access support
services
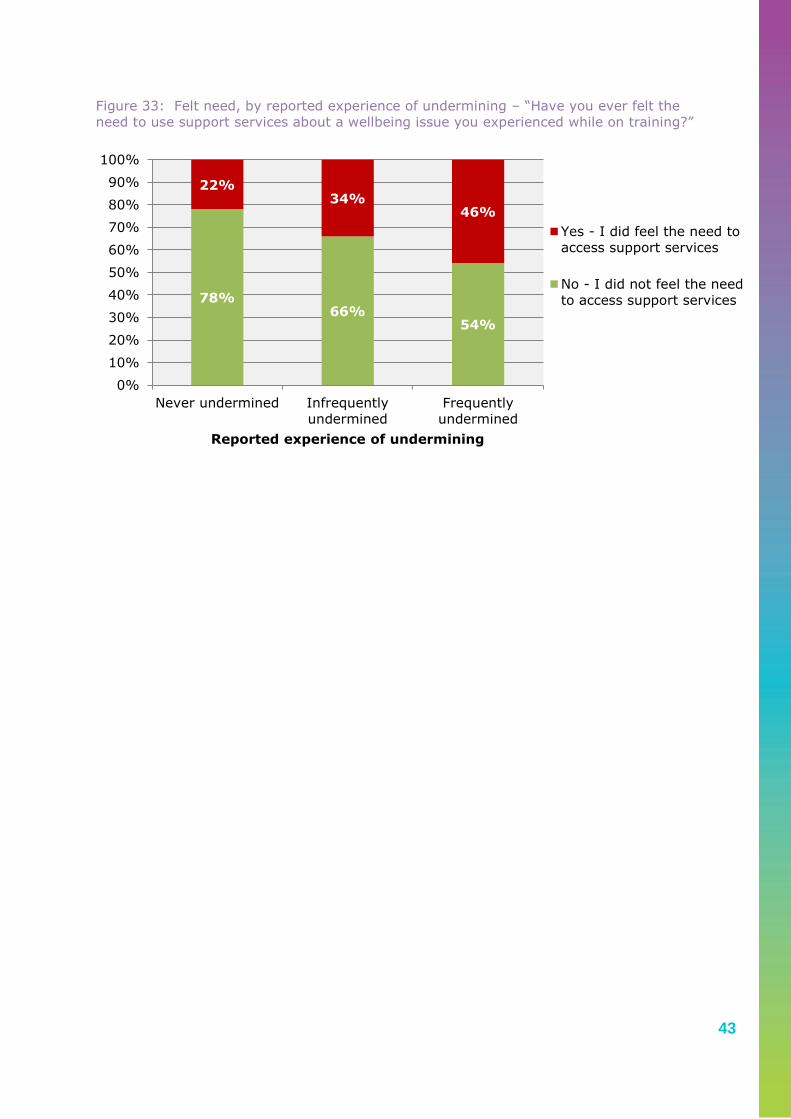
43
Figure 33: Felt need, by reported experience of undermining – “Have you ever felt the
need to use support services about a wellbeing issue you experienced while on training?”
78% 66%
54%
22% 34%
46%
0%
10%
20%
30%
40%
50%
60%
70%
80%
90%
100%
Never undermined Infrequently
undermined
Frequently
undermined
Reported experience of undermining
Yes - I did feel the need to
access support services
No - I did not feel the need
to access support services

44
Access of support services among doctors in training who felt a need support
services
We asked trainees who said they felt they needed support with a wellbeing issue during
training whether or not they accessed a support service: 14% of trainees who felt a need
for support also reported that they accessed support services (see Figure 34).
Figure 34: Accessing support services in response to a felt need – “Did you contact support services about your wellbeing issue?”
Trainee age was linked with whether or not they accessed a support service in response
to a felt need. In general, the older the trainee, the more likely they would seek support
with a wellbeing issue. For example 42% of trainees aged over 40 sought support with a
wellbeing issue, compared to 7% of trainees in the 25-29 age category (2 (4, N=394) =
21.38, p < .001; see Figure 35).
Figure 35: Accessing support services in response to a felt need, by age group – “Did
you contact support services about your wellbeing issue?”
14%
86%
0%
10%
20%
30%
40%
50%
60%
70%
80%
90%
100%
I accessed support services about my
wellbeing issue
I didn't contact support services about
my wellbeing issue
7% 16% 17%
42%
100% 93%
84% 83%
58%
0%
10%
20%
30%
40%
50%
60%
70%
80%
90%
100%
20-24 25-29 30-34 35-39 40 and
overAge Group (years)
I did not contact support
services about my issue
I accessed support
services for my issue

45
Experience of support services among doctors in training
Finally, we asked trainees who utilised support services to report their experience; the
majority of trainees that accessed support services, about a wellbeing issue, reported
the service as quite or very useful (62%, see Figure 36).
Figure 36: Experience of support services – “How useful were the support services you
received at work”?
19% 19%
27%
35%
0%
5%
10%
15%
20%
25%
30%
35%
40%
Not at all useful Only a little bit
useful
Quite useful Very useful

46
CONCLUDING COMMENTS
Key points
This report from the 2014 national trainee experience survey shines a
spotlight on the health and wellbeing of doctors in training in Ireland.
Generally good self-reported health is an important positive finding.
Furthermore, it is a testament to the dedication of trainees that they
generally report good engagement with their work. It is important to
acknowledge and better understand the strengths which many trainees
bring to their experience of working and training.
However, a small but significant minority are clearly struggling to
maintain good quality of life and mental health and wellbeing.
The linkages between indices of trainee health and wellbeing and key
features of the clinical environment point to the importance of focusing
on the settings where trainees work and learn. Hospitals appear to
present particular challenges to maintaining good health and wellbeing.
Unsurprising, but importantly, this report finds a strong, significant and
consistent link between the experience of bullying and undermining
and poorer health and wellbeing among trainees.
Linkages between hours worked and trainee reported health and
wellbeing are evident. Your Training Counts will provide an important
framework to monitor how trainees experience European Working Time
Directive implementation: if and how their experience of the clinical
learning environment changes; if and how their health and wellbeing
changes.
There are shared responsibilities for everyone involved in medical
education and training in responding to what we have heard from
trainees.
There is a role for organisations that design and deliver curricula to
ensure that self-awareness, self-care, and skills to navigate stressors
in the clinical environment are fostered to help trainees maintain good
health and wellbeing are promoted.
But a wider response involving policy-makers and healthcare
organisations is required to ensure that the clinical environments
where trainees work and learn are designed and manage to prevent
unnecessary challenges for trainee health and wellbeing so problems
are prevent.
The Medical Council will continue to raise awareness of doctors’ health
and wellbeing in the interests of good professional practice for safe,
effective and compassionate patient care.

47
A spotlight on trainee health and wellbeing
This report, for the first time, provides a comprehensive overview of the health and
wellbeing of doctors in training in Ireland. There is continuing discussion on issues
related to the medical workforce and medical education and training. Through placing a
spotlight on trainee health and wellbeing, the Medical Council wants to ensure that this
critical aspect of trainee experience is considered in decisions that affect trainees.
Besides being an issue for individual trainees, good health and wellbeing among doctors
needs to be prioritised as a factor in how we foster good professional practice through
medical education and training, in how we ensure safe, effective and compassionate care
for patients, and in how we design strong and sustainable health system into the future.
Trainees with good general health and positive engagement with patient care
It is positive to note the high levels of general health reported by trainees. Other
studies of doctors’ health and wellbeing have shown that they enjoy good physical health
– despite well-recognised challenges with maintaining good quality of life and good
mental health and wellbeing.20
This spotlight examined work engagement among trainees in Ireland.
It is immensely positive to find that so many doctors in training approach their role in
patient care and in training with high levels of dedication, energy, and positive
absorption. Their strength is to be commended and supported. In the context of an
increasingly challenging clinical environment for doctors, this finding stands out as a
tribute to the dedication of trainees. This strong engagement is an important finding
since, if sustained, it may protect against burnout, a phenomenon which is bad for
doctors, bad for patients and bad for the health system. While the causes of failures in
the quality and safety of healthcare are complex and manifold, when caring professionals
are engaged in their work, patient care is better and failures may be avoided. The
strengths of individual doctors in training need to be better understood – as well as how
engagement is shaped by environment – so as to identify how all trainees can be
supported to sustain positive engagement throughout their professional lives.
Challenges with quality of life and mental health and wellbeing
This spotlight highlights specific challenges experienced by a significant proportion of
trainees in maintaining a good quality of life and good mental health and wellbeing.
While the findings presented in this spotlight regarding trainees in Ireland are stark, they
are consistent with published studies examining quality of life, mental health and
wellbeing and burnout among doctors in training.21 For example, a recent study of US
trainees found that 14.8% reported their quality of life to be poor; high levels of burnout
were also reported.22 Similar experiences have been reported among Trainees in
Europe.23 We rightly expect doctors not just to provide effective care, but to relate to
patients and their families with compassion. Compassion fatigue is an increasingly
20 Frank E, Biola H, Burnett CA. Mortality rates and causes among US physicians. Am J Prev Med. 2000;19:155-159. 21 Dyrbye L.N., Thomas, M.R., and Shanafelt, T.D. Systematic Review of Depression, Anxiety, and Other Indicators of Psychological Distress Among U.S. and Canadian Medical Students. Acad Med 2006; 81:354–373. 22 West C.P., Shanafelt T.D., and Kolars J.C. Quality of life, burnout, educational debt, and medical knowledge among internal medicine residents. JAMA. 2011 306(9):952-60. 23 Prins J.T., Hoekstra-Weebers J.E., Gazendam-Donofrio S.M. et al. Burnout and engagement among resident doctors in the Netherlands: a national study. Med Educ 2010 44(3):236-47.

48
recognised phenomenon among caring professionals, related to their professional quality
of life, which describe a gradual erosion of capacity to care with consideration, empathy
and kindness. Maintaining quality of life and good mental health and wellbeing among
trainees is a critical agenda since trainees experiencing significant challenges in these
areas may develop compassion fatigue. For this reason, trainee quality of life and
mental health and wellbeing have implications for medical professionalism and for the
safety and quality of patient care.
Addressing the environment which shapes trainee health and wellbeing
While this report concerns the individual experience of trainees, supporting good health
and wellbeing must begin with a focus on the clinical environment where the trainee
works and learns.
This spotlight demonstrates clear, consistent and strong linkages between trainee health
and wellbeing and stressors in the clinical environment.
Trainees in hospitals tended to report poorer quality of life and mental health. What can
hospitals learn from the strengths of other settings, like general practice and mental
health services, where trainees report better quality of life?
It is significant to note that trainee reported experience of bullying and undermining was
associated with poor health and wellbeing across a number of indices in this spotlight;
importantly, more frequent experience of bullying and undermining was associated with
poorer health and wellbeing. The phenomena of bullying and undermining in medical
education and training are well described in Your Training Counts, and are consistent
with published evidence.24 Meaningful progress in addressing these phenomena is
possible and could affect significant improvement in trainee health and wellbeing.
Reforming working hours for trainees – a complex issue
The average working hours per week reported by trainees was associated with most
health and wellbeing indices in this spotlight; general health, quality of life and mental
health and wellbeing all decreased increasing hours worked per week.
Regulation of working hours for doctors, especially doctors in training, is a complex issue
and is much debated nationally and internationally. Across Europe, the European
Working Time Directive aims to protect the health and safety of workers through
controlling work hours, and in the US the Accreditation Council for Graduate Medical
Education, which oversees the quality of postgraduate training has instituted mandatory
work hour restrictions.
What do these interventions mean for doctors in training and for patients?
Reducing working hours appears, as might be expected, to improve trainee’s quality of
life.25 A recent overview of published studies examining the impact of reduced working
hours on medical education and training found mixed results;26 a recent evaluation of
24 Fnais N, Soobiah C, Chen M.H., et al. Harassment and discrimination in medical training: a systematic review and meta-analysis. Acad Med. 2014 89(5):817-27. 25 Fletcher K.E., Underwood W, Davis S.Q. et al. Effect of work hour reduction on residents’ lives: a systematic review. JAMA 2005 294:1088-1100. 26 Moonesinghe S.R., Lowery J, Shahi et al. Impact of reduction in working hours for doctors in training on postgraduate medical education and patient outcomes: systematic review. BMJ 2011 342:d1580.

49
working hours reform for US trainees found that it had no effect on examination
scores.27 Nevertheless, many leaders in medical education and training, and even some
trainees themselves, remain concerned about the educational impact of these
reforms.28,29,30 Through its effect on trainee fatigue, there is understandable concern
that longer working hours may reduce the quality of patient care and may increase
medical error.31 While patient safety is a commonly cited reason for control of trainee
working hours, studies examining the effect of trainee working hour reform on
healthcare outcomes, quality of care and patient safety have not demonstrated
improvements.22,23,32
Reform of trainee working hours is a contentious and complex area. Benefits for
patients and for trainees will be maximised – and adverse effects minimised – if
implementation is carefully planned and managed through collaboration between
stakeholders. The quality of educational experience for trainees must be maintained
and, where possible, enhanced as working time reduces.
Your Training Counts will monitor trainee reported working hours, their views of the
clinical learning environment, and their health and wellbeing. As European Working
Time Directive implementation progresses in Ireland, it will provide a critical framework
for monitoring and evaluating impacts across a range of important indicators and to
reflect the trainee perspective.
Health and perception of the clinical learning environment
It is noteworthy that, across a range of metrics examined in this spotlight, better trainee
health and wellbeing was linked with more positive views of the clinical learning
environment. This link is complex, and it cannot be inferred that the good health causes
a positive view of the clinical learning environment, or vice versa. However, it
underscores the legitimacy of spotlighting trainee health and wellbeing in the context of
monitoring the quality of medical education and training.
Preparing the individual trainee, as a whole person, for the clinical environment
While efforts to support good health and wellbeing must focus on the clinical
environment where the trainee works and learns, the skills and attitudes of individual
trainees should not be overlooked.
Transitioning to the clinical environment introduces the doctor in training to a set of new
and challenging situations. By its nature, a learning environment will test a trainee and
will facilitate progress towards increasing proficiency as a doctor. This spotlight finds
some, but not consistent, evidence that younger trainees at earlier stages of training
27 Rajaram R, Chung J.W., Jones A.T. et al. Association of the 2011 ACGME resident duty hour reform with general surgery patient outcomes and with resident examination performance. JAMA 2014; 312(22): 2374-2384. 28 Shea J.A.,Willett L.L., Borman K.R., et al. Anticipated consequences of the 2011 duty hours standards: views of internal medicine and surgery program directors. Acad Med. 2012;87(7): 895-903. Drolet B.C., Sangisetty S, Tracy T.F., Cioffi W.G. Surgical residents’ perceptions of 2011 Accreditation Council for Graduate Medical Education duty hour regulations. JAMA Surg. 2013 148(5): 427-433. 29 Antiel R.M., Thompson S.M., Reed D.A., et al. ACGME duty-hour recommendations—a national survey of residency program
directors. N Engl J Med. 2010; 363(8):e12. 30 Drolet B.C., Sangisetty S, Tracy T.F., Cioffi W.G. Surgical residents’ perceptions of 2011 Accreditation Council for Graduate
Medical Education duty hour regulations. JAMA Surg. 2013 148(5): 427-433. 31 Kohn L.T., Corrigan J.M., and Donaldson M.S. To err is human: building a safer health system. Washington DC: National
Academy Press; 2000. 32 Ahmed N, Devitt K.S., Keshet I et al. A systematic review of the effects of resident duty hour restrictions in surgery: impact
on resident wellness, training, and patient outcomes. Ann Surg. 2014 259(6):1041-53.

50
may experience greater challenges with maintaining good health and wellbeing as they
transition into the clinical environment.
While it is necessary to focus on addressing remediable stressors in the clinical
environment, the individual trainee must also be adequately prepared for all aspects of
their clinical learning experience.
Education and training bodies need to plan to support the trainee as a whole person if
they are to be enabled to fulfil their future potential as doctors providing safe, effective
and compassionate care.
It is important that self-awareness and self-care are fostered through curricula at
undergraduate, internship and postgraduate levels to ensure that trainees have the
knowledge, skills and attitudes to effectively identify and negotiate stressors in the
clinical environment and to maintain good health and wellbeing. This focus meets the
needs of the health system since it contributes to a sustainable medical workforce and to
safe, compassionate and high quality patient care.
Raising awareness and building a culture for good health and wellbeing among
doctors
A striking finding in this spotlight is the mismatch between trainee need for support with
health and wellbeing, their felt need, and their access of services. Inattention to self-
care is well described among doctors and trainees.33 But it is particularly concerning to
note that reproduction of a culture of poor self-care is strong among doctors at the
earliest stages of training, especially considering the set of challenges that these doctors
face in transitioning into the clinical environment, which have been well described in
Your Training Counts.
Through providing evidence and promoting dialogue, the Medical Council is interested in
raising awareness to build a culture for good health and wellbeing among doctors.12
Balancing prevention and response – sharing responsibility
As a professional regulator, the Medical Council plays a role in responding to concerns
about doctor’s practice.
While it is important that there is an effective response to problems downstream, this
report highlights opportunities to prevent problems upstream through ensuring the
quality of doctors education and training is safeguarded and, in particular, through
supporting trainees to maintain good health and wellbeing.
These opportunities are best realised through sharing responsibilities.
The Medical Council is raising awareness through this report of trainee health and
wellbeing in the interests of good professional practice for the benefit of patients.
Organisations involved in doctors education and training must continue to ensure that
trainees understand the importance of maintaining good health and wellbeing, are
supported to develop necessary skills and attitudes, and are able to access appropriate
support services when needs arise. Policy-makers and healthcare organisations must
ensure that the clinical environments where trainees work and learn enable them to
33 Uallachain G.N. Attitudes towards self-health care: a survey of GP trainees. Ir Med J 2008 100: 489-91.

51
maintain good health and wellbeing in the interests of safe, effective and compassionate
patient care.

52
NOTES

53
NOTES

54
NOTES

55
A SPECIAL REPORT FROM THE TRAINEE NATIONAL EXPERIENCE SURVEY 2014
Medical Council, Kingram House, Kingram Place, Dublin 2.
T: +353 1 4983100
F: +353 1 4983102
www.medicalcouncil.ie