Embed Size (px)
Citation preview

YOUR GUIDE TO THE JAMAICAN CPI

Preface
f f
This pamphlet was born out o the Bank’s recognition o some commonly held misconceptions by the public about
the source of data on inflation, and general issues relating to compilation and use of the CPI. Beyond that, it is
envisioned that “Your Guide to the Jamaican Consumer Price Index” will serve as a useful tool for students
and practitioners interested in a simple and illustrative discussion on the CPI.
The pamphlet briefly touches on all the pertinent issues relating to the current method of calculating the Jamaican
index, before discussing some of the more practical applications of the information. It is supported by appendix
material and data that could be useful for research and other purposes.
Bank of Jamaica wishes to express its thanks to the Statistical Institute of Jamaica for its support in the preparation
of this, the XX in our series of pamphlets. All the errors and omissions however, are our own.

TABLE OF CONTENTS
WHAT IS THE CONSUMER PRICE INDEX?........................................................................................ 4
RELEVANCE OF THE CPI ....................................................................................................................... 4
SOME MISCONCEPTIONS ABOUT THE CPI ...................................................................................... 5
THE GROUPS THAT MAKE UP THE CPI ............................................................................................. 6
RELATIVE IMPORTANCE OF COMMODITIES IN THE CPI (WEIGHTS).................................... 7
CONSTRUCTION OF THE CPI................................................................................................................ 8 COLLECTING PRICES .................................................................................................................................... 8 CALCULATING THE INDICES .......................................................................................................................... 9 CALCULATING PERCENTAGE CHANGES ....................................................................................................... 10
SOME POPULAR USES OF THE CPI ................................................................................................... 11
CHANGES IN THE CPI SINCE 1988...................................................................................................... 12
APPENDIX ................................................................................................................................................. 14
GLOSSARY OF TERMS.................................................................................................................. 21

What is the Consumer Price Index?
The Consumer Price Index (CPI) is a
measure of the rate of price change for
goods and services bought by Jamaican
consumers. It is the most widely used indicator
of inflation in Jamaica.
The Jamaican CPI began during the Second
World War, when the rapid changes in the cost
of living highlighted the need to develop a
mechanism that would measure aggregate price
changes.
conducte
the Stat
This stu
represen
four with
the CPI
detail to
The Jam
published
the follow
simultan
Metropol
in Jama
region c
Portmore and Spanish Town, while the Other
Towns and Rural Areas regions cover the major
shopping centres around Jamaica (see tables
1A, 1B & 1C in the appendix). In addition,
specialised indices are published every year for
consumers whose annual expenditure exceeded
J$24,000.00 in 1984.
Relevance of the CPI
The CPI is relevant to all those who earn and
spend money. When prices rise, the
purchasing power of money drops, in that
exp
co
The Jamaican CPI is defined more precisely as an indicator of the change in consumer prices
erienced by Jamaicans. It is obtained by comparing, through time, the cost of a fixed basket of
commodities purchased by Jamaican consumers in a particular year. Since the basket contains
mmodities of unchanging or equivalent quantity and quality, the index reflects only pure price
movements.
The CPI was launched with a study
d by the Department of Statistics, now
istical Institute of Jamaica (STATIN).
dy was based on a budget that
ted monthly expenditures of a family of
in a certain income range. Since then
has grown in comprehensiveness and
keep pace with increases in its use.
aican CPI for a given month is usually
by the end of the third full week of
ing month. Detailed CPIs are published
eously for all of Jamaica, the Kingston
itan Area (KMA), “Other Major Towns”
ica, and the “Rural Areas”. The KMA
overs Kingston, Urban St. Andrew,
people are able to buy less with the same
amount of money. When prices fall, the
purchasing power of money increases, or people
are able to buy more with the same amount of
money.
For this reason, the following is a list of some of
the uses to which the CPI is put:
• Public and private sector wage settlements
are typically adjusted to take account of
changes in the CPI. Some contracts are
normally linked to the CPI to protect the
parties involved from losing purchasing
power over the contract period. Also, given
the protracted nature of some legal cases,

lawyers will ask for an adjustment in
settlements to take account of changes in
the CPI. There are of course cases where
some people cannot do this. The chief
example of these types of people would be
pensioners and workers.
• Interest rate changes may be linked to
movements in the CPI. An upward
movement in the CPI causes depositors to
demand more interest on their deposits
from banks and other financial institutions.
Banks in turn will try to pass on this
increased cost to borrowers by increasing
loan rates.
• Decisions to spend money for either
personal consumption or investment
depends on how the consumer thinks prices
of goods and services are likely to move.
The larger the changes in the CPI, the less
likely one will be to save money and the
more likely to consume.
Some misconceptions about the CPI
Misconception 1: “The CPI is wrong because what it says is different
from what I experience when I go to the supermarket”
Some people question the CPI numbers because
their personal experience does not seem to
match what is being reported. It is important to
remember that the CPI measures the average
price change of a selected set of goods and
service that is purchased by the representative
Jamaican, in a certain income range. It cannot
and should not be expected to reflect the price
change experience of every household or
person.
The current CPI basket contains many items,
from which any one person will more than likely
buy only a small set. In some cases, some
people may buy commodities that are not in the
CPI at all! Also, no two persons will buy exactly
the same set of items.
Now, for a particular month, the prices of some
of the items in the CPI may go up, while the
prices of others may go down. It is therefore
very likely that the overall price change for the
set of items that are bought by an individual will
be different from the overall movement in the
CPI. As well, the overall price change of the set
of items that are bought by an individual will be
different from the overall price change
experienced by other consumers.
Misconception 2
“The CPI numbers come from the Bank of Jamaica”
The Bank of Jamaica (BOJ) does not produce
the CPI. The principal authority on collecting and
reporting on the CPI is the Statistical Institute of
Jamaica (STATIN). However, using the CPI data
produced by STATIN, the BOJ does estimate
and report a measure of inflation called Core
Inflation.
One of the main functions of the Central Bank is
to prevent excessive changes in the CPI, or high
inflation. In discharging its duty, the Bank
naturally analyses data on the CPI on a monthly
basis. For this reason, the BOJ is in a position to
inform the public about the CPI through its
various methods of publication, and to provide
analyses on inflation.
Misconception 3
“Jamaica only produces one measure of inflation”.
The CPI is often perceived as the only measure
of the rate of price changes. This is a common
misconception. STATIN publishes an alternative
measure of prices called the Gross Domestic
Product (GDP) Deflator. This deflator,
unfortunately, is only available annually, and its
movement reflects average price changes of all
goods and services produced in Jamaica, and
which are recognised in the system of
national accounts (SNA).
Other measures of price changes also exist. The
Consumer Affairs Commission (CAC) presently
publishes a monthly bulletin on selected
commodities sold in supermarkets, pharmacies,
and service stations. The information is however
not summarised into a single index as done with
the deflator and the CPI.
In addition, the Ministry of Agriculture publishes
periodic reports on price movements. The
Petroleum Corporation of Jamaica also informs
the public of changes in the price of petroleum
products as the need arises.
Misconception 4
“The CPI and its sub-indices are actual prices of
goods and services”
Although people sometimes misinterpret the CPI
figures as actual prices, this is wrong. It is also
equally wrong to compare the indices for two
commodities or groups of commodities and
conclude that one is more expensive than the
other. The CPI only shows the rate at which
prices change between two periods. For
example, two Jamaican price indices for
December 1998 were as follows: Food & Drink;
1226.6, and Miscellaneous Expenses; 1592.8.
From these numbers, we cannot conclude that
the prices of Miscellaneous Expenses items were
higher than the prices of Food and Drink items
in December 1999. The indices only show that
Miscellaneous Expenses rose by 1,492.8 percent
since 1988, while Food and Drink rose by
1,116.6 percent. What we can conclude is that,
on average, the prices of Miscellaneous
Expenses items rose faster than the prices of
Food & Drink items over the period.
The Groups that make up the CPI
The goods and services included in the CPI are
those considered legal retail consumer items
that have standard weights or measures.
Nothing is omitted on the basis of moral
judgement. For example, some people may
regard alcohol or cigarettes as socially
undesireable. However, these products are
included in the CPI because they represent a
significant proportion of the expenditure of
Jamaican households.
The goods and services are organised in the CPI
according to a classification system. Every
product is uniquely identified, and is grouped
with other items or commodities because they
either have a common end-use, or because they
are considered substitutes for each other. These
families of products are joined together in a
hierarchical manner. The lowest level of the
hierarchy is called an item, followed by a
commodity (which is made up of items). The
next level in the hierarchy is the sub-group,
(which is made up of commodities), followed by
the group (or sub-index, consisting of sub-
groups) and finally All Items.
Under this classification system in Jamaica,
there are 288 items, 231 commodities, 20 sub-
groups and 8 groups.
As an example of how items are arranged in the
classification system, an item such as Grace
tinned mackerel belongs to the commodity
class “Fish (canned)”, which in turn comes
under the larger sub-group, “Meat Poultry &
Fish”. When “Meat Poultry & Fish” is combined
with “Meals Away from Home”, “Dairy Products
Oils & Fat”, “Baked Products, Cereals &
Breakfast Drink”, “Starchy Foods”, “Vegetables
& Fruits”, and “Other Foods & Beverages”, they
form the group “Food & Drink”. By this method
of organisation, the CPI groups are constructed
as shown in box 2.
It is important to recognise that the Healthcare
& Personal Expenses and Transportation groups
have no subgroups.
Relative Importance of Commodities in
the CPI (Weights)
The CPI uses the relative importance of items,
or weights, in determining the strength of an
overall price change for a month. The weight of
an item is the percentage share of expenditure
on the item in the base year, compared with the
specified consumers’ total expenditure. These
percentage shares are calculated from surveys
Major Grou1. Food & Drink 2. Fuels & Other Household Supp3. Housing 4. Household Furnishing & Furnit5. Healthcare & Personal Expense6. Personal Clothing Footwear & 7. Transportation 8. Miscellaneous Expenses
* For a more detailed view of the c3, Appendix.
Box 2 ps: Jamaican CPI*
lies
ure s
Other Accessories
omponents of the Jamaican CPI, see table

Figure 11988 Weights by Major Groups, expressed as Percentages
Jamaican CPI
Personal Clothing, Footwear & Other
Accessories5%
Healthcare & Personal Expenses
7%
Household Furnishing & Furniture
3%
Housing & Other Housing Expenses
8%
Fuels & Other Household Suplies
7%
Food & Drink56%
Miscellaneous Expenses8%
Transportation6%
of household spending. The last survey was
carried out in 1984, and identified that
approximately 85 percent of Jamaican
households had a total expenditure of
J$24,000.00 per year or less. Based on the
findings of this survey, the revised CPI became
operational in January 1988.
Weights determine the impact that a particular
price change will have on the consumer’s
budget. For example, yellow yam has a weight
of 1.33 in the CPI, while steel for house repairs
has a weight of 0.03. This means that yellow
yam is about 44 times more important than steel
to the selected Jamaican consumer It should be
clear that if the price of yellow yam doubled, the
average consumer’s budget would increase by
1.33 per cent, while if the price of steel for
house repairs doubled, the average consumer’s
budget would increase by 0.03 per cent.
The eight groups of the CPI along with their
respective weights appear in figure 1. It is clear
to see that the group “Food & Drink” commands
the highest weight among all the groups,
accounting for 56 percent of total expenditure in
1984.
Construction of the CPI
Collecting Prices Prices are collected for most of the 288 items in
the CPI on a monthly basis. Collection takes
place during the first full week of every month
from a fixed set of retail outlets throughout the
three regions (table 1A – C, appendix). Before

prices enter the CPI calculations, they are
examined for accuracy and validity, and then
averaged for each item in the three regions.
Since the CPI is designed to measure price
changes experienced by Jamaican consumers,
the prices used in the Consumer Price Index are
those that any consumer would have to pay on
the day of the survey. This means that if an
item is on sale, the sale price is collected. The
index that results from this price collection
activity is used as the price level for that month.
STATIN also recognises that since prices of
items such as telephone services and bus fares
are usually published, they can be re-priced
when an announcement occurs. Generally, the
more prices change, the more often they are
collected. In cases where goods appear on the
market seasonally, prices are collected in the
season when they are available, and are held
constant at the last price collected until when
they become available again.
A special problem that can arise is where an
item becomes permanently unavailable on the
market (also referred to as being in non-supply).
There are several methods of dealing with this,
but the general idea is to remove the item from
the CPI, and recalculate the share of
expenditure represented by the remaining items.
STATIN usually carries out careful investigation
over a period, no less than six months, to
ensure that the item is truly unavailable on the
market before removing it from the basket.
Calculating the Indices
The calculation of the monthly All-Jamaica index
starts with the measurement of price indices for
a particular commodity. Price indices for the
commodities are then combined following the
hierarchy, with the appropriate weight being
applied along the way. For example, the indices
for fresh (or frozen) beef, canned beef, fresh (or
frozen) fish, and other meat products are
combined to form an index for “Meat Poultry &
Fish”. Similarly, the various items that make up
“Dairy Products Oils & Fats” are combined to
obtain that index. These sub-group indices are
then further combined to arrive at the group:
“Food & Drink”.
The first step in this process is to form a price
relative for each commodity. If the current
month is December, for example, and the item
is a pack of cigarettes, the price relative for the
pack of cigarettes is the ratio of December’s
average price for cigarettes in a region, to the
average price in the base month (assume this to
be January of the same year). If the average
price of cigarettes for January & December were
$90.00 and $100.00 respectively, the price
relative would be:
1.11$90.00$100.00
=
This ratio indicates that an 11.0 per cent
increase in the average price of a pack of
cigarettes occurred between the first week of
January and the first week of December.

The second step is to form an index of
commodities at the sub-group level for a
particular region. Imagine that the
“Miscellaneous Expenses” sub-group contains
only cigarettes and schoolbooks, that the
weights for the two commodities within that
sub-group are 0.7 and 0.3 respectively, and that
the price relative for schoolbooks in December
was 1.52 (calculated in the same way we
calculated the price relative for cigarettes). The
December index for “Miscellaneous Expenses”
would be found by multiplying each price
relative by its respective weight, adding the two
and using the sum of the weights as a divisor:
23.17.03.03.052.17.011.1
=+
×+×
The sub-group indices are further combined to
obtain a group index, which in turn are used to
obtain an “All Item” index for a particular region.
To arrive at an index for the country as a whole,
“cross weights” are applied at the sub-group
level, after which the three weighted-indices are
added.
Calculating Percentage Changes
To illustrate the most frequent calculations done
with price indices, we shall use data from Table
2 in the appendix. Table 2 has three sections. In
the first section the indices for all Jamaica
between 1988 and 1999 are given by month.
These monthly indices are also averaged over
the twelve calendar months to arrive at an
annual average index. The three most
frequently calculated percentage changes are as
follows:
• Monthly: Between a given month and the
preceding month.
• Annual Point to Point: Between a given
month and the same month of the previous
year; and
• Annual Average: Between the annual
average index of a given year and that of the
previous year.
The second and third sections of table 2 in the
appendix show these percentage changes. They
are calculated from the indices in the first
section.
To illustrate the first measure (monthly), the
percentage change between November 1999
and December 1999 is calculated as follows:
0.48%100%1259.9
1259.9)(1265.9=×
−
The result of this month-over-month calculation
tells us that from November 1999 to December
1999, prices increased by an average of 0.48
per cent in Jamaica.
Many people consider the alternative formula (a
simple derivation from the first) more
convenient:

.48%0100%11259.91265.9
=×
−
In all the cases that follow, we will employ this
second formula.
To illustrate the second measure (annual point
to point), the percentage change between
December 1998 and December 1999 is
calculated as follows:
%8.6100%11185.51265.9
=×
−
The result of this year-over-year calculation tells
us that for the twelve-month period, prices
increased by an average of 6.8 per cent in
Jamaica.
To illustrate the third measure (annual average),
the percentage change between the annual
average index at December 1998 and the annual
average index at December 1999 is calculated
as follows:
6.0%100%11147.61215.9
=×
−
The result of this calculation tells us that the
average level of prices in Jamaica for all of 1999
was higher than that for 1998 by 6.0 per cent.
It is possible to calculate percentage changes
over any two periods. To do this, always
remember to divide the more recent index by
the older index, subtract 1, and then multiply by
100. A typical use of these calculations is to
determine the inflation rate between the start of
the fiscal (April) or calendar year (January), and
the current month. For the purpose of economic
planning, the Bank of Jamaica targets inflation
on a fiscal year basis (April – March).
Some Popular Uses of the CPI
Escalation Factor
As noted earlier, given that legal cases are
sometimes protracted in nature, the Consumer
Price Index can be used to adjust settlements to
take account of changes in the purchasing
power of money. In this case, the CPI is used as
an escalation factor. This escalation factor is
necessary because when prices rise, a given
sum of money buys fewer goods and services. If
someone was owed $100.00 in January 1990
and had to wait on an award from the court
system for 5 years before the money was
received, the purchasing power of the $100.00
in 1995 would be less than its purchasing power
in 1990.
Based on table 2A, how much would the creditor
have to get back to maintain the purchasing
power of $100.00 in 1990? Now the CPI for
January 1990 was 129.6, while the CPI for
January 1995 was 701.1. Based on these
indices, the $100.00 would be adjusted in the
following manner to ensure that the creditor is
protected from inflation:

97.540$00.100$6.1291.701
=×
This means that the creditor would have to
receive $540.97 in January 1995, to ensure that
he could afford the same quantity of goods that
the $100.00 could have bought in January 1990.
Deflating a number
In many cases, people are interested in
ascertaining how the purchasing power of their
income is changing over time. When employees
are given increases in their pay packages, they
cannot be certain if they are doing better or
worse than they had been doing in the past
without adjusting their earnings for inflation. For
example, a worker might have been earning at a
rate of $5,000.00 per month in January 1988,
and $40,000.00 per month in January 1998.
Despite the large difference between these two
numbers, they cannot be compared directly
because a dollar in 1998 will buy a different
quantity of goods and services compared with a
dollar in 1988. To compare dollar values over
time, we must convert the worker’s earnings in
1998 to constant dollar values (i.e. what current
earnings would have been worth in some base
period if the appropriate correction is made for
inflation since the base period). This means that
the current dollar values are all re-expressed in
terms of the value of the dollar at a specific
earlier point in time.
Given that the CPI in January 1988 was 100,
and the CPI in January 1998 was 1185.5, we
convert the worker’s 1998 salary to a
comparable salary in 1988 by performing the
following calculation:
15.374,3$000,40$5.1185
0.100=×
This means that $40,000.00 in 1998 could
purchase the equivalent of $3,374.15 in 1988.
This is of course much less than the $5,000.00
in 1988, indicating that the worker’s purchasing
power in 1998 had fallen relative to his
purchasing power in 1988. The type of
calculation performed in this example is typically
referred to as “deflating” a number. In general,
to deflate a number, divide the index in the past
by the current index and multiply the current
numerical value by that ratio. The $3,374.15
would loosely be referred to as being expressed
in January 1988 prices.
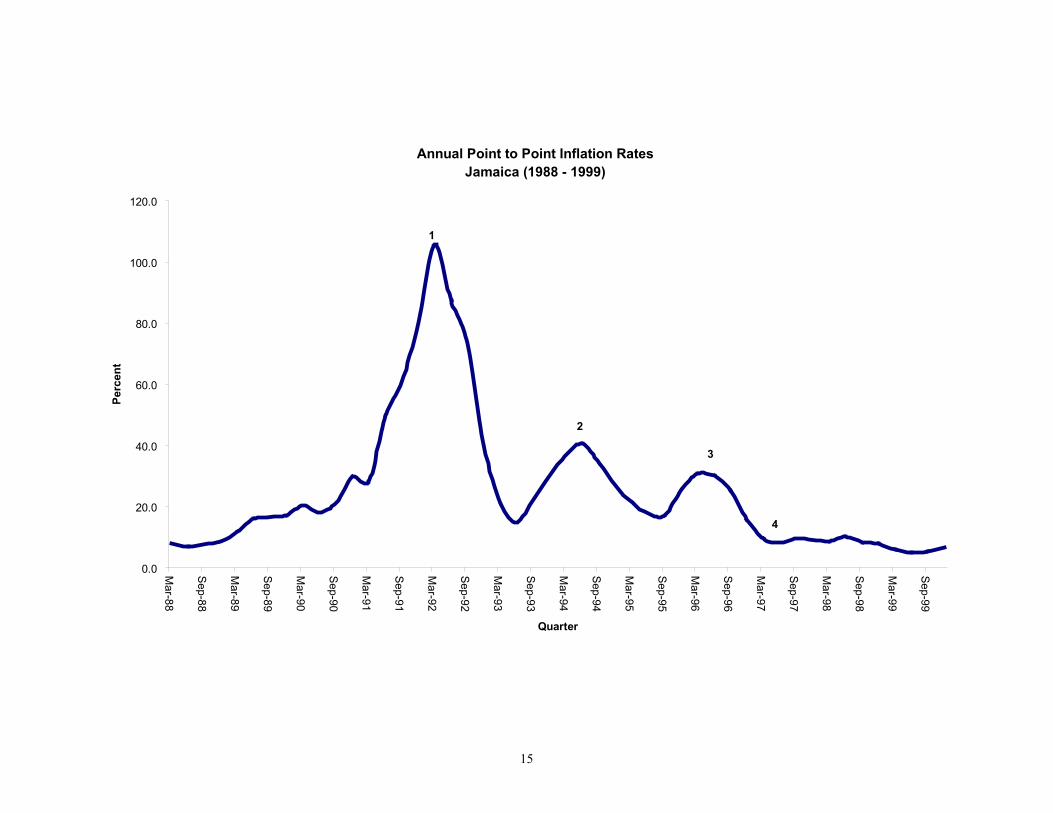
Changes in the CPI Since 1988
The history of changes in the CPI in Jamaica
since 1988 is depicted by figure 2 (appendix).
We have chosen to show the annual point-to-
point inflation rate for four months of each year:
March, June, September and December. The
most obvious feature of the graph is the high
rate of inflation recorded in March 1992 (point
1).
This high level of inflation reflected significant
changes in the exchange rate, which moved
from US$1.00 = J$7.90 at the end of September
1990 to US$1.00=J$27.38 by end March 1992.

The exchange rate affects inflation because the
price of every commodity that is imported into
the country is converted from foreign to local
prices using this rate.
The figure also shows that inflation in 1994 and
1996, again in response to significant changes in
the exchange rate (points 2 & 3), was relatively
high.
Of some significance, inflation has been
relatively low since December 1996 (point 4). In
fact, the annual point-to-point rate of 6.8
percent at December 1999 was the lowest rate
recorded in the period since March 1988.
The low inflation out-turn since 1996
demonstrates the Bank of Jamaica’s success at
containing the main factors that affect inflation,
namely the money supply and excessive
changes in the exchange rate. The Bank has the
objective of reducing inflation to the level of
Jamaica’s main trading partners, and
maintaining changes in the CPI at this level.

APPENDIX
Annual Point to Point Inflation RatesJamaica (1988 - 1999)
0.0
20.0
40.0
60.0
80.0
100.0
120.0
Mar-88
Sep-88
Mar-89
Sep-89
Mar-90
Sep-90
Mar-91
Sep-91
Mar-92
Sep-92
Mar-93
Sep-93
Mar-94
Sep-94
Mar-95
Sep-95
Mar-96
Sep-96
Mar-97
Sep-97
Mar-98
Sep-98
Mar-99
Sep-99
Quarter
Perc
ent
1
2
3
4
15

Your Guide to the Jamaican CPI
Table 1A
Kingston Metropolitan Area
Kingston Portmore
Spanish Town Urban St. Andrew
Table 1B Other Towns
Annotto Bay Frankfield Morant Bay Black River Grange Hill Ocho Rios Brown’s Town Highgate Old Harbour Buff Bay Linstead Port Antonio Chapelton Lionel Town Port Maria Christiana Lucea Porus Claremont Mandeville Santa Cruz Clark’s Town May Pen Savanna-La-Mar Falmouth Montego Bay St. Ann’s Bay
Table 1C
Rural Areas Aenon Town Darliston Lambs River Riversdale & Hampshire Albert Town Delroy Lluidasvale Sheffield Alley Devon Lumsden Skibo Baileysvale Duckenfield Lyssons Southfield Balcarres Golden Grove Malvern Spauldings Bamboo Granville Moneague Springfield Belmont Green Island Gordon Town Springhill Benbow Gutters Mt. Pleasant St. Margaret’s Bay Bog Walk Guys Hill Negril Summerfield Bowden Hope Bay Newroads & Warsop Troy Cambridge Hopewell Oracabessa Wakefield Cold Spring Kellits Pedro Cross Yallahs Cornwall Mountains Kensington Pondside York Town Cross Keys Port Morant
Source: STATIN
16

Your Guide to the Jamaican CPI
Table 2A
Jamaican Consumer Price Index (1988=100)
Jan Feb Mar Apr May Jun Jul Aug Sep Oct Nov Dec Annual Average
1988 100.0 100.0 100.2 100.6 100.7 101.4 102.8 104.0 104.1 107.1 108.6 109.2 103.2 1989 111.3 111.4 112.0 113.0 116.2 117.7 118.8 119.7 121.5 122.3 124.3 128.0 118.0 1990 129.6 131.2 134.8 137.0 137.7 139.0 141.9 146.1 147.4 154.5 161.8 166.1 143.9 1991 168.3 170.6 172.9 180.9 188.8 208.1 219.2 228.3 236.8 257.5 278.9 299.3 217.5 1992 315.3 339.6 355.7 376.1 387.0 389.9 399.7 403.6 410.2 412.2 417.3 419.6 385.5 1993 423.2 425.2 430.7 435.5 442.8 447.8 466.0 481.9 502.3 514.6 531.2 546.0 470.6 1994 558.9 578.0 590.4 601.6 616.1 629.8 650.5 666.4 673.5 682.5 687.3 692.3 635.6 1995 701.1 709.2 715.8 723.5 733.7 740.9 753.5 766.4 789.2 810.3 832.8 869.2 762.1 1996 892.1 921.6 936.4 948.8 960.0 963.6 970.4 978.4 989.4 994.7 999.0 1006.9 963.4 1997 1012.8 1022.0 1025.5 1032.1 1039.5 1043.4 1055.0 1069.3 1084.5 1094.0 1100.2 1099.2 1056.4 1998 1106.8 1107.5 1115.9 1119.8 1129.0 1149.2 1162.4 1174.5 1175.8 1172.1 1173.2 1185.5 1147.6 1999 1189.9 1176.8 1182.5 1179.9 1190.6 1205.9 1220.4 1234.3 1237.6 1247.5 1259.9 1265.9 1215.9
17

Your Guide to the Jamaican CPI
Table 2B Jamaican Consumer Price Index
Monthly % Change Jan Feb Mar Apr May Jun Jul Aug Sep Oct Nov Dec
1988 -0.60 0.00 0.20 0.40 0.10 0.70 1.38 1.17 0.10 2.88 1.40 0.55 1989 1.92 0.09 0.54 0.89 2.83 1.29 0.93 0.76 1.50 0.66 1.64 2.98 1990 1.25 1.23 2.74 1.63 0.51 0.94 2.09 2.96 0.89 4.82 4.72 2.66 1991 1.32 1.37 1.35 4.63 4.37 10.22 5.33 4.15 3.72 8.74 8.31 7.31 1992 5.35 7.71 4.74 5.74 2.90 0.75 2.51 0.98 1.64 0.49 1.24 0.55 1993 0.86 0.47 1.29 1.11 1.68 1.13 4.06 3.41 4.23 2.45 3.23 2.79 1994 2.36 3.42 2.15 1.90 2.41 2.22 3.29 2.44 1.07 1.34 0.70 0.73 1995 1.27 1.16 0.93 1.08 1.41 0.98 1.70 1.71 2.97 2.67 2.78 4.37 1996 2.63 3.31 1.61 1.32 1.18 0.38 0.70 0.83 1.12 0.54 0.43 0.79 1997 0.59 0.91 0.34 0.64 0.72 0.38 1.11 1.36 1.42 0.88 0.57 -0.09 1998 0.69 0.06 0.76 0.35 0.82 1.79 1.15 1.04 0.11 -0.31 0.09 1.05 1999 0.37 -1.10 0.48 -0.22 0.91 1.29 1.20 1.14 0.27 0.80 0.99 0.48
18

Your Guide to the Jamaican CPI
Table 2C Jamaican Consumer Price Index Annual Point to Point & Annual
Average Percentage Change
Jan Feb Mar Apr May Jun Jul Aug Sep Oct Nov Dec Annual Average
1988 8.5 8.2 7.8 8.0 7.2 7.0 7.5 8.2 7.6 9.8 10.4 8.5 N/A 1989 11.3 11.4 11.8 12.3 15.4 16.1 15.6 15.1 16.7 14.2 14.5 17.2 14.3 1990 16.4 17.8 20.4 21.2 18.5 18.1 19.4 22.1 21.3 26.3 30.2 29.8 22.0 1991 29.9 30.0 28.3 32.0 37.1 49.7 54.5 56.3 60.7 66.7 72.4 80.2 51.1 1992 87.3 99.1 105.7 107.9 105.0 87.4 82.3 76.8 73.2 60.1 49.6 40.2 77.3 1993 34.2 25.2 21.1 15.8 14.4 14.8 16.6 19.4 22.5 24.8 27.3 30.1 22.1 1994 32.1 35.9 37.1 38.1 39.1 40.6 39.6 38.3 34.1 32.6 29.4 26.8 35.1 1995 25.4 22.7 21.2 20.3 19.1 17.6 15.8 15.0 17.2 18.7 21.2 25.6 19.9 1996 27.2 29.9 30.8 31.1 30.8 30.1 28.8 27.7 25.4 22.8 20.0 15.8 26.4 1997 13.5 10.9 9.5 8.8 8.3 8.3 8.7 9.3 9.6 10.0 10.1 9.2 9.7 1998 9.3 8.4 8.8 8.5 8.6 10.1 10.2 9.8 8.4 7.1 6.6 7.9 8.6 1999 7.5 6.3 6.0 5.4 5.5 4.9 5.0 5.1 5.3 6.4 7.4 6.8 6.0
19

Your Guide to the Jamaican CPI
Table 3
Component Weights of the Jamaican CPI (%)
KMA Other Towns Rural All Jamaica FOOD & DRINK 50.53 53.55 59.88 55.63 - Meals Away From Home 17.3 16.0 10.3 7.4 - Meat Poultry & Fish 28.8 30.2 28.7 16.1 - Dairy Products Oils & Fats 12.2 12.1 11.8 6.7 - Baked Products Cereals & Breakfast Drink 15.0 14.7 16.1 8.6 - Starchy Foods 5.9 7.6 12.0 5.3 - Vegetables & Fruits 11.9 10.7 11.9 6.5 - Other Food & Beverages 8.9 8.9 9.2 5.0 FUELS & OTHER HOUSEHOLD SUPPLIES 7.44 7.51 7.24 7.35 - Household Supplies 64.84 61.88 67.34 4.82 - Fuels 35.16 38.12 32.66 2.53 HOUSING & OTHER HOUSING EXPENSES 11.4 8.89 5.05 7.86 - Rental 33.84 19.98 19.03 2.09 - Other Housing Expenses 66.16 80.02 80.97 5.77 HOUSEHOLD FURNISHINGS & FURNITURE 2.19 3.57 3.04 2.83 - Furniture 32.56 23.62 27.63 0.68 - Furnishings 67.44 76.38 72.37 2.15 HEALTHCARE & PERSONAL EXPENSES 9.53 6.31 5.4 6.97 PERSONAL CLOTHING FOOTWEAR & ACC. 4.42 5.11 5.5 5.07 - Clothing Materials 11.97 10.8 10.34 0.55 - Readymade Clothing & Accessories 48.21 50.91 50.88 2.42 - Footwear 31.74 31.23 31.04 1.59 - Making & Repairs 8.08 7.06 7.74 0.51 TRANSPORTATION 6.55 6.7 6.27 6.44 MISCELLANEOUS EXPENSES 7.94 8.36 7.62 7.85 ALL GROUPS 100.0 100.0 100.0 100.0
20

Your Guide to the Jamaican CPI
Glossary of Terms
Core Inflation - Also called Underlying Inflation. It is that part of overall inflation that can be attributed to changes in the money supply. Central Banks typically try to control core inflation because there are some parts of inflation that are outside of their control. One example of this is the effect of changes in oil prices. Cross Weights - Cross weights represent the share of total consumption accounted for by a particular region. Gross Domestic Product (GDP) - This is the total value of all goods and services produced within a country over a particular time period. This measure of production is usually estimated over a year or three months. Implicit GDP Deflator - Calculated by dividing current price GDP by constant price GDP. The difference between current and constant price GDP rests in the set of prices that are used to value production. For current price GDP, production is valued by prices that prevail in the period in question (the current period). For constant prices GDP, production is valued by prices that prevail in some past period (called the base year). Inflation - A tendency for the cost of living to increase. Item/Commodity - A commodity is a good or service that performs a particular task (e.g. condensed milk), while an item is particular brand (e.g. Nestle or Betty). Purchasing Power - The ability of money to buy goods and services.
21

Your Guide to the Jamaican CPI
Price Relative - This is the ratio of two prices, in two different time periods, for a particular commodity. The price in the denominator of the price relative is the price that existed in the base year, while the price in the numerator is the price for the current period. System of National Accounts (SNA) - An internationally accepted set of rules that guides the preparation of data on GDP and other measures of total income. Weights - Weights in the CPI are the proportion of total consumption of goods and services that an individual commodity or item represent. Weights can be determined for the sub-groups, and groups.
22