Embed Size (px)
Citation preview
Your Guide toRetirement SavingsA Penny Saved 401(k) Plan
Enrollment GuideOffered by:
Every Penny Counts1801 Market Street Suite 1000Philadelphia, PA 19103
Phone: (555) 5555555Email: [email protected]
Powered by:
SAMPLE

©PCS 2020 2
This page left intentionally blank.
SAMPLE
©PCS 2020 3
Congratulations!Every Penny Counts 2 is pleased to welcome you to the A PennySaved 401(k) Plan. The Plan is designed to help you save and investfor retirement. It's one way to thank you for contributing to oursuccess.
This guide walks you through the enrollment process and the benefits of our Plan in particular. Startingyour retirement planning today, offers more choices for your life tomorrow. There is no time like thepresent to get started!
Your Next Steps:
1. Review this Enrollment Guide.
2. Enroll in our Plan by logging into our Plan's website,www.pcs401k.com/login/.
We want to help!
For more information about our Plan's investment options, please contact our Plan's advisor, Jon Advisorof Every Penny Counts at (555) 5555555 or [email protected]. If you have questions about your accountor our Plan's website, please contact a service representative at (888) 6215491. We are available 24hours a day, 7 days a week, to assist you with your needs.
We hope that you will take full advantage of this important benefit.
About PCS, The Plan's Recordkeeper
Consistently recognized as one of the fastest growing independent record keepers in the country, PCSRetirement, LLC (PCS) was founded by tax and ERISA attorneys to provide sophisticated retirementprograms for the corporate, professional and governmental markets. PCS is a conflictfree independentretirement plan platform, offering a vast menu of investments free from proprietary funds and conflicts ofinterest. PCS has consistently made the Inc. 5000 list of fastest growing privately held companies. PCSwas awarded a “AAA” rating from Roland|Criss for Superior Quality Management System and StrongestFiduciary Support Safety! PCS is also certified by CEFEX (The Centre for Fiduciary Excellence) asadhering to the American Society of Pension Professionals & Actuaries' (ASPPA) standard of practice forrecordkeepers.
©PCS 2020
SAMPLE
©PCS 2020 4
Table of Contents
Getting started is easy! Page 5Enrolling is as easy as 1, 2, 3
Retirement plan basics Page 8Why you need to start saving todayTop retirement plan mistakes and how to avoid them
Retirement needs Page 12How much do I still need to save?
Risk profile: Choosing the right path Page 13How should I invest my retirement savings?What are my investment options?
Important notices Page 17Qualified Default Investment Alternative Notice
Forms Page 19Investment Election WorksheetContribution Election WorksheetBeneficiary Designation Worksheet
Plan investments Page 24Information about each investment option
SAMPLE
©PCS 2020 5
Getting started is easy!
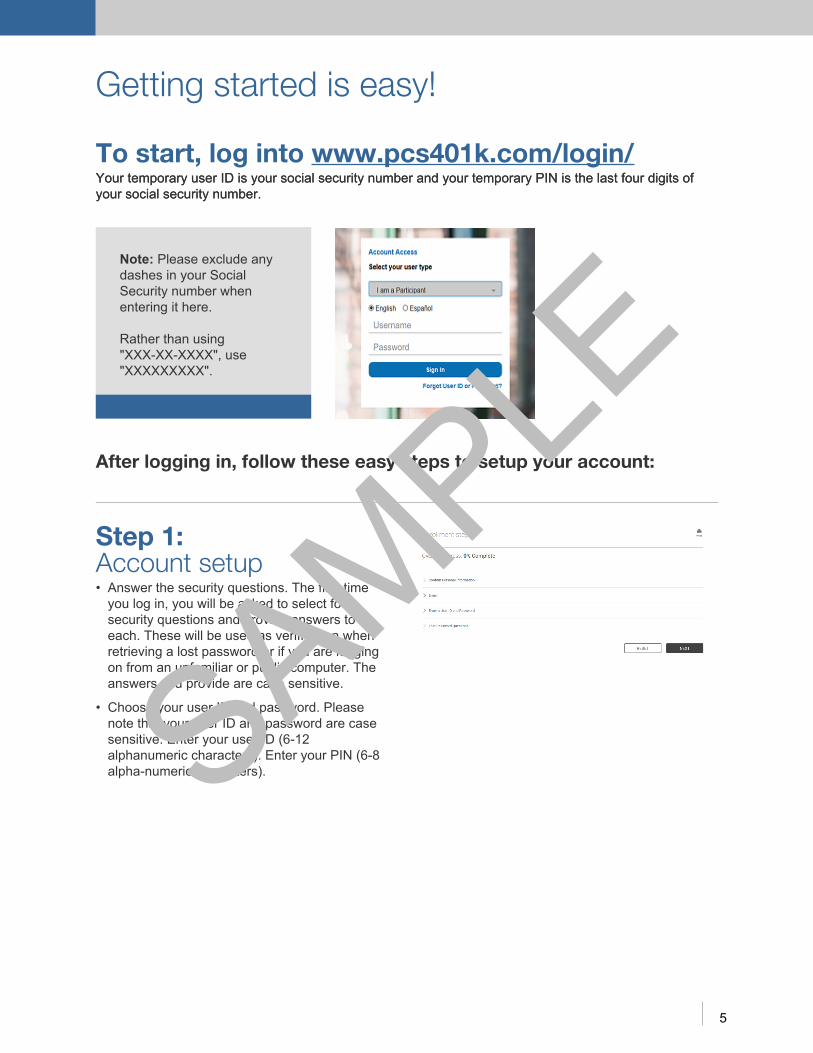
To start, log into www.pcs401k.com/login/Your temporary user ID is your social security number and your temporary PIN is the last four digits ofyour social security number.Your temporary user ID is your social security number and your temporary PIN is the last four digits ofyour social security number.
Note: Please exclude anydashes in your SocialSecurity number whenentering it here.
Rather than using"XXXXXXXXX", use"XXXXXXXXX".
After logging in, follow these easy steps to setup your account:
Step 1:Account setup• Answer the security questions. The first timeyou log in, you will be asked to select foursecurity questions and provide answers toeach. These will be used as verification whenretrieving a lost password or if you are loggingon from an unfamiliar or public computer. Theanswers you provide are case sensitive.
• Choose your user ID and password. Pleasenote that your user ID and password are casesensitive. Enter your user ID (612alphanumeric characters). Enter your PIN (68alphanumeric characters).SAMPLE
©PCS 2020 6
Getting Started is Easy!
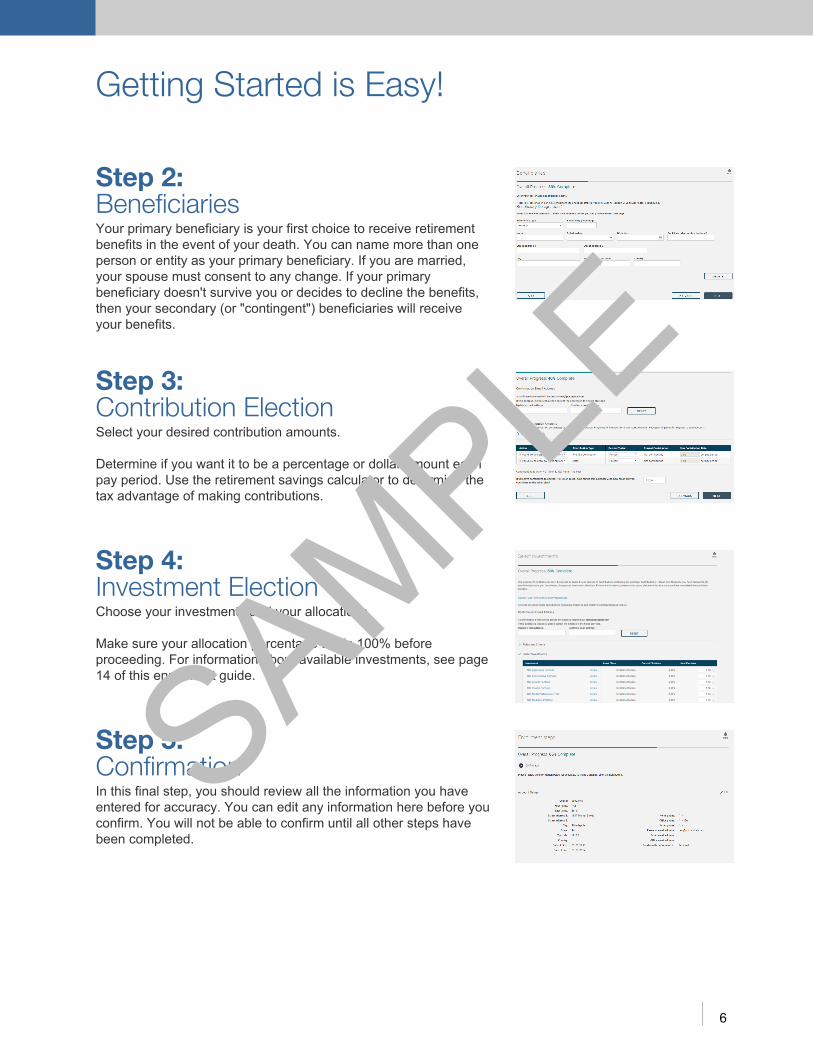
Step 2:BeneficiariesYour primary beneficiary is your first choice to receive retirementbenefits in the event of your death. You can name more than oneperson or entity as your primary beneficiary. If you are married,your spouse must consent to any change. If your primarybeneficiary doesn't survive you or decides to decline the benefits,then your secondary (or "contingent") beneficiaries will receiveyour benefits.
Step 3:Contribution ElectionSelect your desired contribution amounts.
Determine if you want it to be a percentage or dollar amount eachpay period. Use the retirement savings calculator to determine thetax advantage of making contributions.
Step 4:Investment ElectionChoose your investments and your allocations.
Make sure your allocation percentage totals 100% beforeproceeding. For information about available investments, see page14 of this enrollment guide.
Step 5:ConfirmationIn this final step, you should review all the information you haveentered for accuracy. You can edit any information here before youconfirm. You will not be able to confirm until all other steps havebeen completed.
SAMPLE

©PCS 2020 7
Getting Started is Easy!We give you the tools and support youneed to be ready for retirement.
Need help determining if you're on track for retirement?Find out with our RetireOnTime™ retirement readiness tool!
RetireOnTime™ provides participants with a quick snapshot of their retirement projections and how they stack up against their retirement goal. This powerful tool also allows them to customize income goals and post-retirement investments to determine if they’re on track to achieve their ideal retirement income.
Want to consolidate retirement accounts?Try our Rollover Wizard!Our Rollover Wizard makes consolidation easy! After logging on towww.pcs401k.com/login/, simply click "Rollover Contributions", foundunder the Account Transactions tab, to get started!
Wealth Studio is a modern, and mobileoptimized financialwellness offering that helps plan participants rock theirfinances! It is easily integrated into the overall participantretirement plan website, provides detailed metrics, addressesdifferent learning styles and preferred communication methods,and allows participants flexibility in their experience by the waythey engage and interact.
I'm enrolled in the Plan.Now what?Now that you're enrolled,learn the benefits of contributing.
Being enrolled into the plan is just the first step toward being readyfor retirement. The following pages will show you the benefits ofregularly contributing to your plan, including tax savings andcompound growth.
SAMPLE
©PCS 2020 8
Retirement Plan BasicsParticipating in the Plan offers you the potential to pay less in taxes.
• Your contributions may lower your taxable income, and mayeven put you in a lower tax bracket.
• Assets in your account can grow tax deferred.
• If your plan allows for Roth contributions and you elect thisoption, you won't get an up front taxdeduction but youraccount (both contributions and earnings) can grow taxfreeand withdrawals taken during retirement are not subject toincome tax once you are 591/2 and you have held theaccount for five years or more.
Contributions to yourretirement plan canreduce your taxableincome, and maylower your currentfederal income taxes.
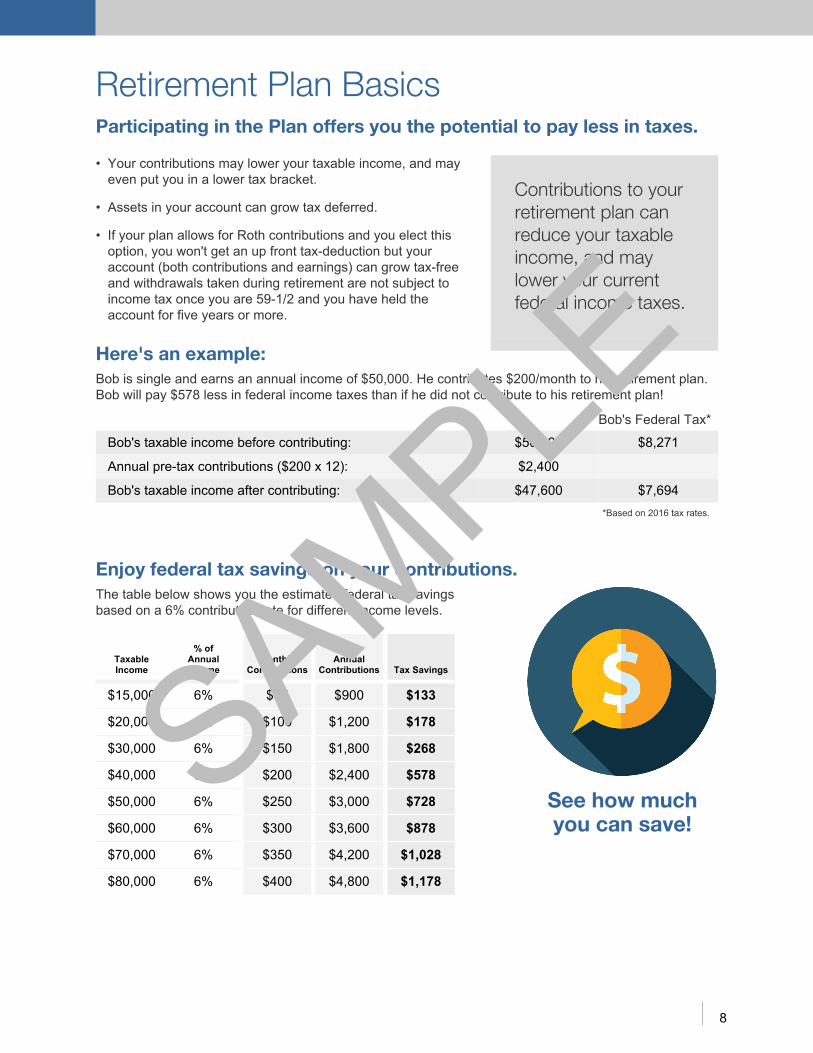
Here's an example:Bob is single and earns an annual income of $50,000. He contributes $200/month to his retirement plan.Bob will pay $578 less in federal income taxes than if he did not contribute to his retirement plan!
Bob's Federal Tax*
Bob's taxable income before contributing: $50,000 $8,271
Annual pretax contributions ($200 x 12): $2,400
Bob's taxable income after contributing: $47,600 $7,694*Based on 2016 tax rates.
Enjoy federal tax savings on your contributions.The table below shows you the estimated federal tax savingsbased on a 6% contribution rate for different income levels.
See how muchyou can save!
TaxableIncome
% ofAnnualIncome
MonthlyContributions
AnnualContributions Tax Savings
$15,000 6% $75 $900 $133
$20,000 6% $100 $1,200 $178
$30,000 6% $150 $1,800 $268
$40,000 6% $200 $2,400 $578
$50,000 6% $250 $3,000 $728
$60,000 6% $300 $3,600 $878
$70,000 6% $350 $4,200 $1,028
$80,000 6% $400 $4,800 $1,178
SAMPLE
©PCS 2020 9
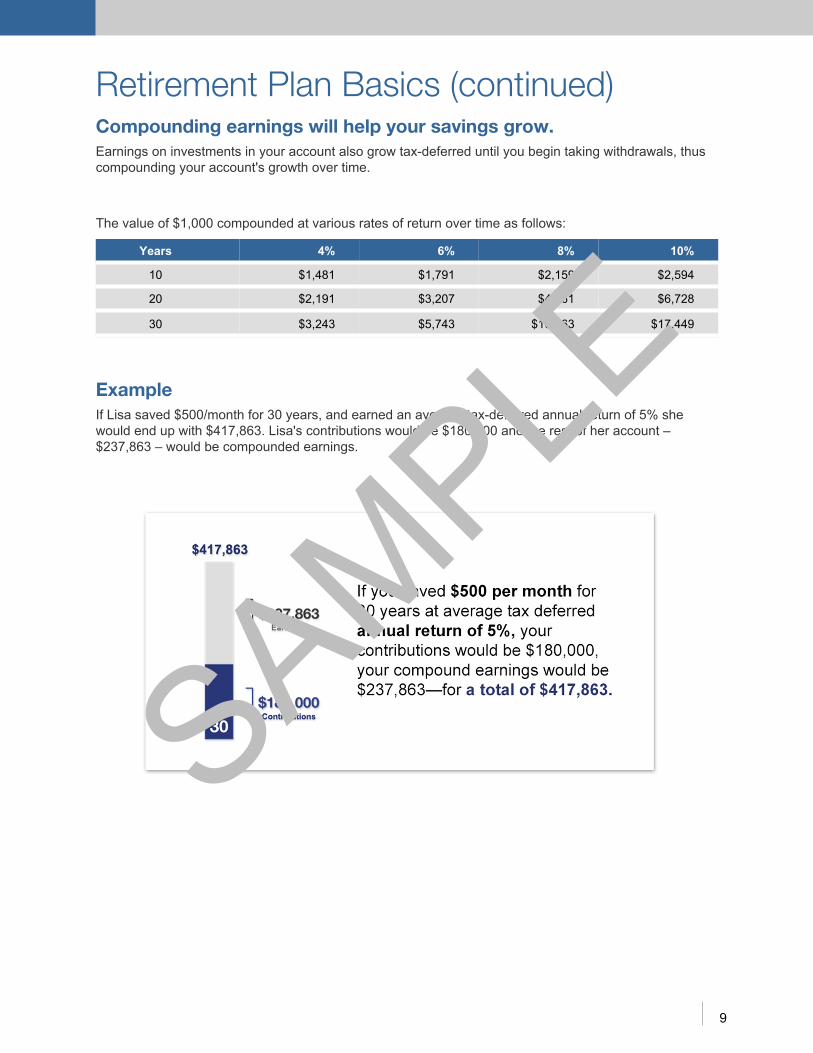
Retirement Plan Basics (continued)Compounding earnings will help your savings grow.Earnings on investments in your account also grow taxdeferred until you begin taking withdrawals, thuscompounding your account's growth over time.
The value of $1,000 compounded at various rates of return over time as follows:
Years 4% 6% 8% 10%
10 $1,481 $1,791 $2,159 $2,594
20 $2,191 $3,207 $4,661 $6,728
30 $3,243 $5,743 $10,063 $17,449
ExampleIf Lisa saved $500/month for 30 years, and earned an average taxdeferred annual return of 5% shewould end up with $417,863. Lisa's contributions would be $180,000 and the rest of her account –$237,863 – would be compounded earnings.
SAMPLE

©PCS 2020 10
Retirement Plan Basics (continued)Why you need to start saving today.
Everyone dreams of a retirement free fromfinancial worries. In spite of what you may hear,a financially secure retirement is possible, butproper planning and preparation are essential.
It's a fact the earlier you begin saving, the better off you'll be when you retire. One thing is for sure,retirement plans don't work unless you take advantage of them. So start saving today!
Try to divert as much of your earnings into savings as you can. If you don't have a budget, createone. If you do have a budget, revise it to reflect your new commitment to saving, as well as anyrecent changes in your spending. Chip away at wasteful habits such as expensive dinners or unusedgym memberships.
More great reasons to join the plan:
Cut your taxes.Remember that your retirement plan contributions aretaxdeferred, which means you don't pay taxes on themoney in your account until you take it out –– usually,when you're retired and possibly in a lower tax bracket.
Invest automatically.Your contributions are deducted right from yourpaycheck and go directly into your account before taxesare withheld –– so you may barely miss the money.
Get more bang for your buck.If you contribute the same amount of money regularly,you're using an investment strategy called "dollar costaveraging."
This method averages out the price you pay for theinvestments in your account, so you're buying morewhen the price is lower and less when the price is higher–– giving you better buying power. Compound earningswill help your savings grow.
Portability.Your savings continue to grow taxdeferred when youretire or leave the Plan.
Sophisticated investment support.When you join the plan, you gain access to the supportof the plan’s financial advisor who can help you to learnabout the investments that are available to you.
SAMPLE

©PCS 2020 11
Retirement Plan Basics (continued)Why you need to start saving today.
1 Not ParticipatingDid you know that 21% of those eligible don't contribute to their retirement plan.1 Are you one of them?
OUR SUGGESTION. Get started with small contributions. Worried that you can't afford it? You might besurprised about how little it takes since contributions are made on a pretax basis. Participating may haveless of an impact on your take home pay than putting money into a traditional savings account.
2 No Planned Savings GoalWithout a plan, you run the risk of not having enough to support your desired lifestyle when you retire, oryou may even outlive your retirement assets. To have the retirement of your dreams, take time tounderstand your retirement goals and develop a plan to achieve them.
OUR SUGGESTION. Create a plan. Even if you already contribute to the retirement plan, you might notbe contributing enough to achieve your goals. We can help! Log onto the Plan's website and and click onRetireOnTime™ under Learning Center to evaluate different scenarios to help you achieve yourretirement goals.
3 Poor DiversificationEver heard of asset allocation? That simply means looking at your age, risk tolerance and goals todetermine the mixture of stocks, bonds and cash for your portfolio. Asset allocation can help you diminishinvestment risk, but keep in mind that you may need to rebalance your portfolio periodically in response tochanging needs and investment performance. Keep in mind, asset allocation doesn't assure a profit anddoesn't protect against loss.
OUR SUGGESTION. Fortunately, the Plan offers 6 model portfolios designed to offer onestepdiversification across multiple asset classes. Each model portfolio is constructed using a mix of fundsconsistent with the investment philosophy of Every Penny Counts. If you are a doityourselfer you canensure that your portfolio stays diversified by signing up for automatic rebalancing.
4 Chasing PerformanceSome investors make the mistake of chasing investments in the latest "hot" sector. This is a race they'rebound to lose. If you're thinking of joining the chase, remember that research shows that asset allocationdetermines more than 90% of the longterm return of a portfolio.2
OUR SUGGESTION. Once again, consider a model portfolio carefully constructed using a mix of fundsconsistent with the investment philosophy of Every Penny Counts. Keep looking at the long term. Yourbest defense against market ups and downs is to follow an asset allocation strategy. Review your portfolioat least once a year to make sure it matches your investment objectives and to determine if you need tomake adjustments.
5 Cashing in Before RetirementMany people cash out their retirement plan when they change jobs. It's not worth it. This can cause themoney to lose its taxdeferred status and subject it to income taxes and a possible early withdrawalpenalty — all of which means having less money for retirement.
OUR SUGGESTION.One option among many to consider is rolling your other retirement accounts intothis plan.By combining your accounts you have the ability to view all account activity in one place, receiveonly one statement, preserve the taxdeferred status of the investments and potentially more easilymanage and diversify your assets.
1 Source: PSCA's Annual Survey of Profit Sharing and 401(k) Plans, 2014.2 Source: Brinson, Hood, and Beebower (1986); Brinson, Singer, and Beebower (1991).
SAMPLE
©PCS 2020 12
Retirement NeedsHow much do I still need to save?
Determine how much money you will need tocontribute to reach your retirement savings goal.It's important to make realistic estimates about what kind of expenses you will have in retirement. Manyexperts believe financial security in retirement requires you replacing 60%80% of your current annualincome, adjusted for inflation.
One way to begin estimating your retirement costs is to take a close look at your current expenses invarious categories, and then estimate how they will change. For example, your mortgage might be paidoff by then, but keep in mind that your health care costs are likely to rise.
"If I can save more, should I?" If you were to speak to a financial advisor, "As much as you can" is thestandard answer. Many financial planners recommend that you save 10% to 15% of your income forretirement, starting in your 20's. But that's just a general guideline.
How much you will need at retirement depends on you:• At what age do you intend to retire?• What type of lifestyle do you intend to live? (Will your spending really go down?)• Are you married or single?• Will you have dependents? (For example, helping with your grandchildren's education?)
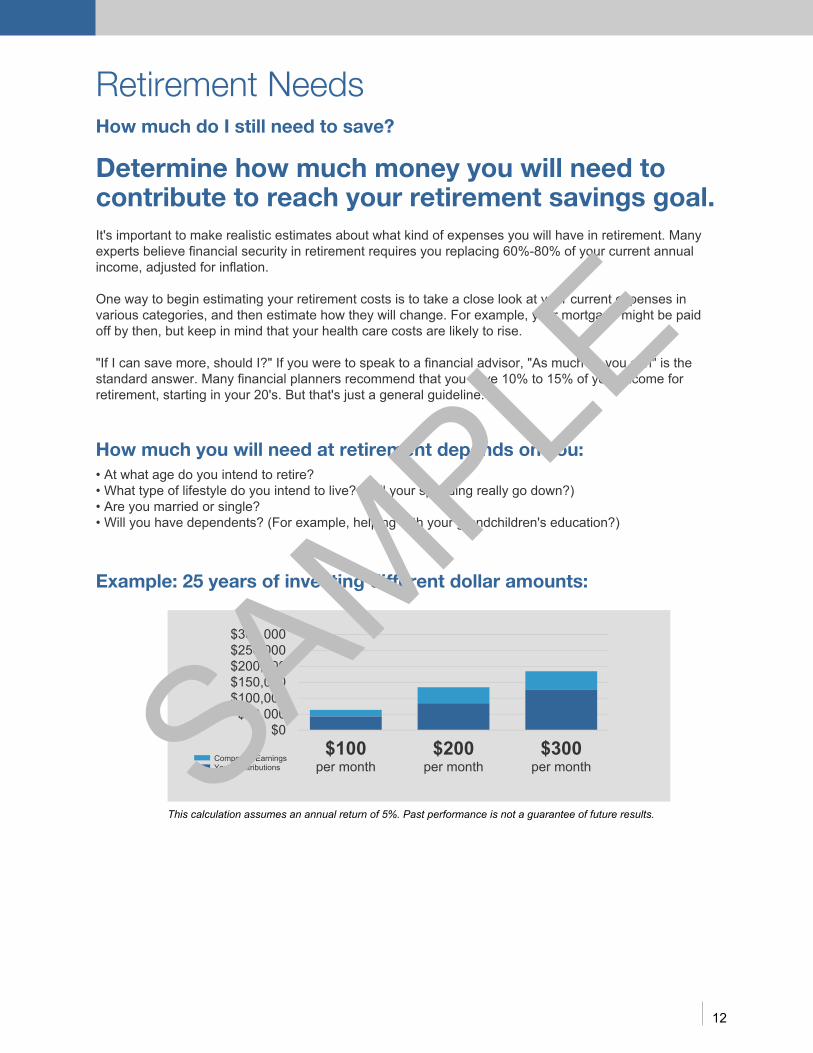
Example: 25 years of investing different dollar amounts:
$300,000$250,000$200,000$150,000$100,000$50,000
$0$100
per month$200
per month$300
per monthCompound EarningsYour Contributions
This calculation assumes an annual return of 5%. Past performance is not a guarantee of future results.SAMPLE
©PCS 2020 13
Risk Profile: Choosing the Right PathHow should I invest my retirement savings?The Plan has a number of investment options from which you can choose to invest your retirementsavings. These include model portfolios and individual mutual funds. Detailed information is contained inthis guide. Review it very carefully and consult the Plan's financial advisor if you have any questionsbefore you invest.
Choosing the right asset allocation is imperative when building your investment strategy. Focusing onasset allocation means determining how you will divide your portfolio among different asset classes:
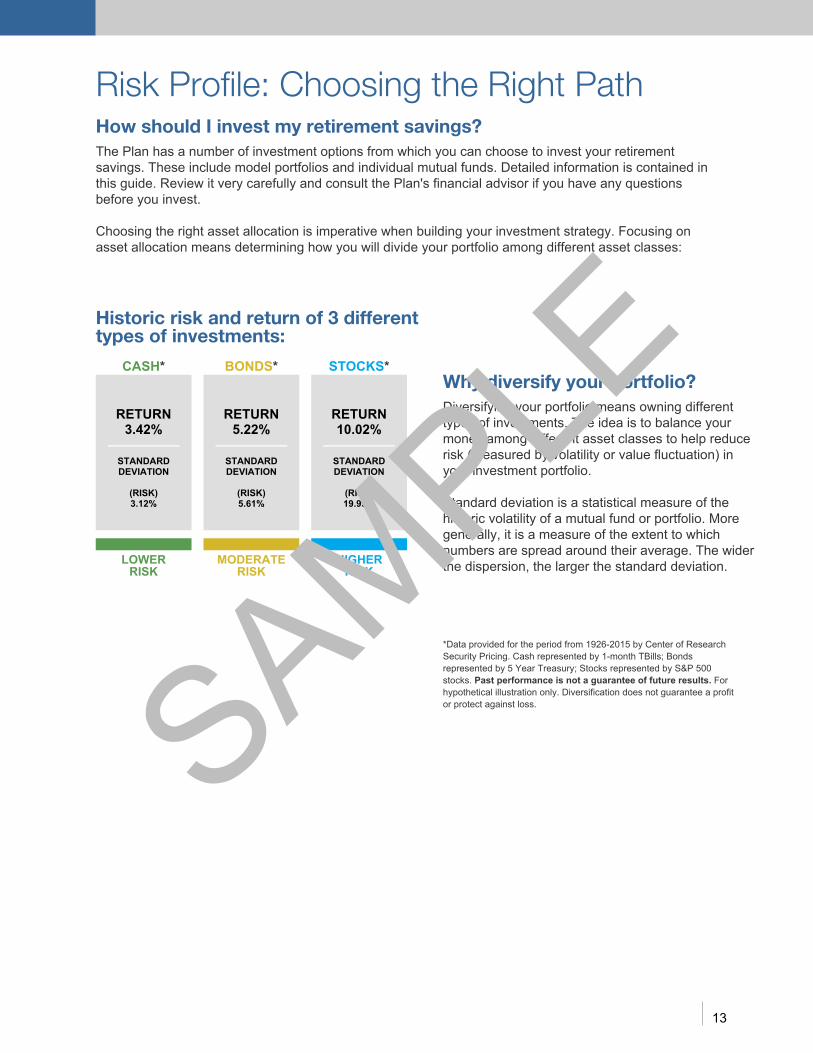
Historic risk and return of 3 differenttypes of investments:
CASH* BONDS* STOCKS*
RETURN3.42%
RETURN5.22%
RETURN10.02%
STANDARDDEVIATION
(RISK)3.12%
STANDARDDEVIATION
(RISK)5.61%
STANDARDDEVIATION
(RISK)19.99%
LOWERRISK
MODERATERISK
HIGHERRISK
Why diversify your portfolio?Diversifying your portfolio means owning differenttypes of investments. The idea is to balance yourmoney among different asset classes to help reducerisk (measured by volatility or value fluctuation) inyour investment portfolio.
Standard deviation is a statistical measure of thehistoric volatility of a mutual fund or portfolio. Moregenerally, it is a measure of the extent to whichnumbers are spread around their average. The widerthe dispersion, the larger the standard deviation.
*Data provided for the period from 19262015 by Center of ResearchSecurity Pricing. Cash represented by 1month TBills; Bondsrepresented by 5 Year Treasury; Stocks represented by S&P 500stocks. Past performance is not a guarantee of future results. Forhypothetical illustration only. Diversification does not guarantee a profitor protect against loss.SAMPLE
©PCS 2020 14
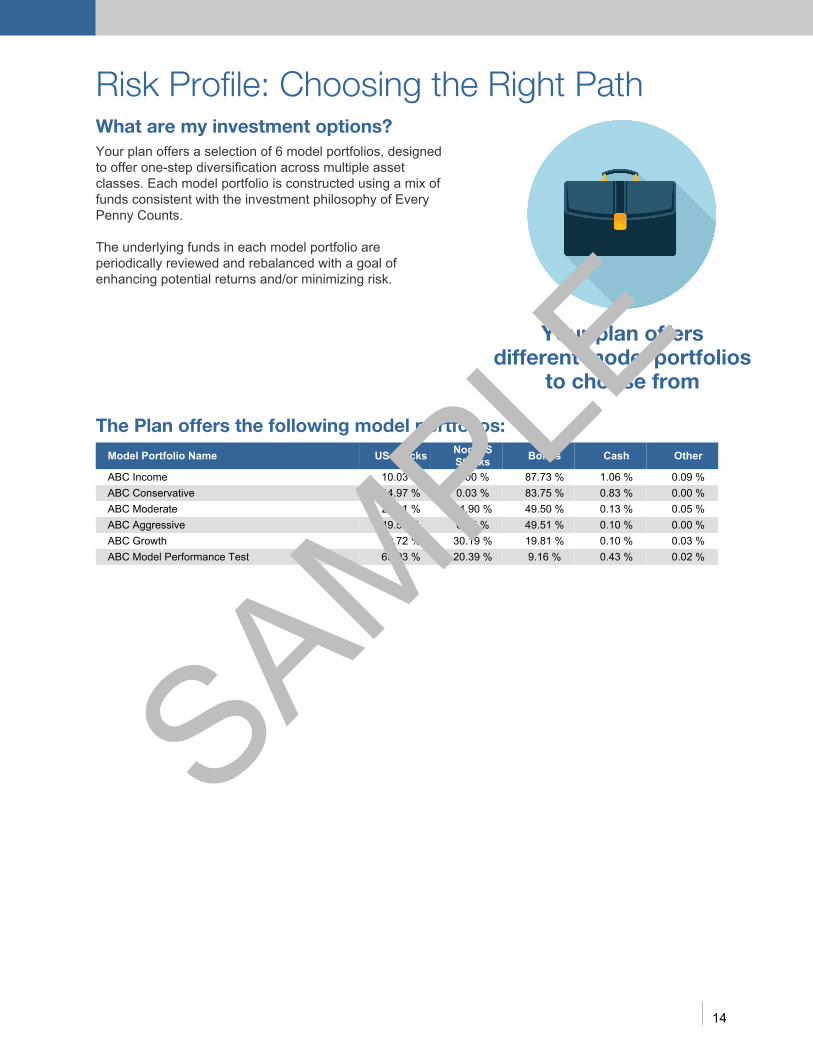
Risk Profile: Choosing the Right PathWhat are my investment options?Your plan offers a selection of 6 model portfolios, designedto offer onestep diversification across multiple assetclasses. Each model portfolio is constructed using a mix offunds consistent with the investment philosophy of EveryPenny Counts.
The underlying funds in each model portfolio areperiodically reviewed and rebalanced with a goal ofenhancing potential returns and/or minimizing risk.
Your plan offersdifferent model portfolios
to choose from
The Plan offers the following model portfolios:
Model Portfolio Name US Stocks NonUSStocks Bonds Cash Other
ABC Income 10.03 % 0.00 % 87.73 % 1.06 % 0.09 %ABC Conservative 14.97 % 0.03 % 83.75 % 0.83 % 0.00 %ABC Moderate 25.01 % 24.90 % 49.50 % 0.13 % 0.05 %ABC Aggressive 49.54 % 0.45 % 49.51 % 0.10 % 0.00 %ABC Growth 49.72 % 30.19 % 19.81 % 0.10 % 0.03 %ABC Model Performance Test 69.93 % 20.39 % 9.16 % 0.43 % 0.02 %
SAMPLE
©PCS 2020 15
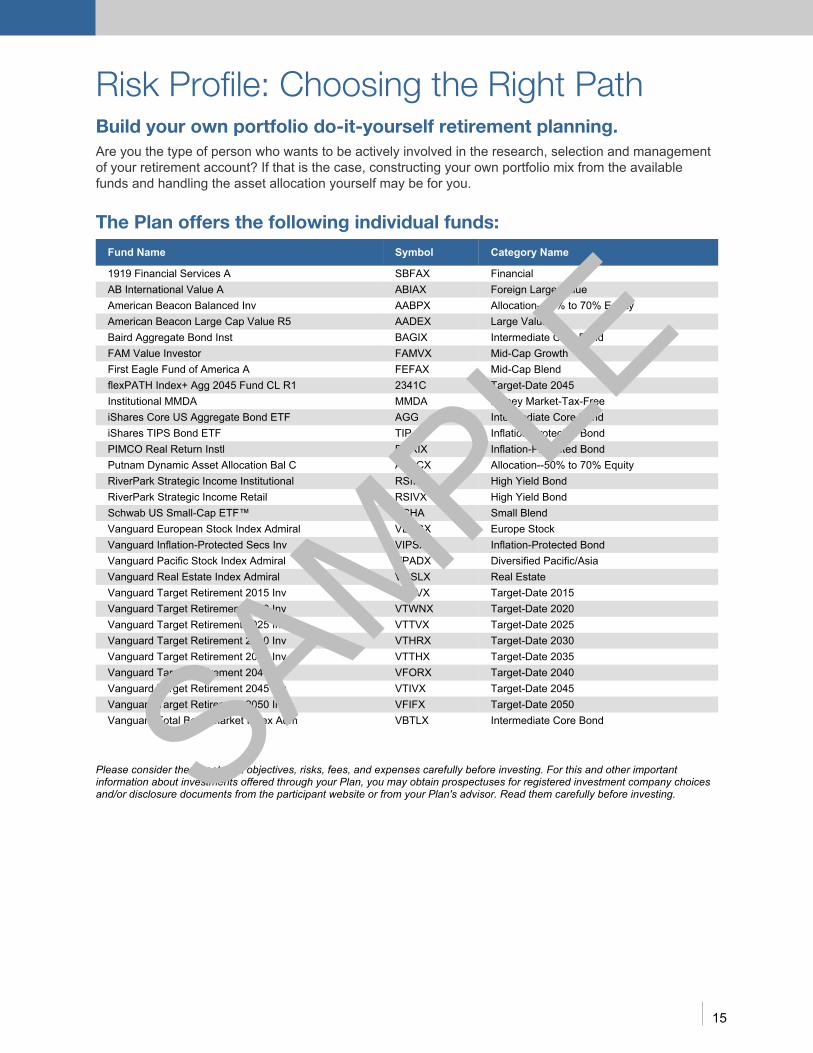
Risk Profile: Choosing the Right PathBuild your own portfolio do-it-yourself retirement planning.Are you the type of person who wants to be actively involved in the research, selection and managementof your retirement account? If that is the case, constructing your own portfolio mix from the availablefunds and handling the asset allocation yourself may be for you.
The Plan offers the following individual funds:
Fund Name Symbol Category Name
1919 Financial Services A SBFAX FinancialAB International Value A ABIAX Foreign Large ValueAmerican Beacon Balanced Inv AABPX Allocation50% to 70% EquityAmerican Beacon Large Cap Value R5 AADEX Large ValueBaird Aggregate Bond Inst BAGIX Intermediate Core BondFAM Value Investor FAMVX MidCap GrowthFirst Eagle Fund of America A FEFAX MidCap BlendflexPATH Index+ Agg 2045 Fund CL R1 2341C TargetDate 2045Institutional MMDA MMDA Money MarketTaxFreeiShares Core US Aggregate Bond ETF AGG Intermediate Core BondiShares TIPS Bond ETF TIP InflationProtected BondPIMCO Real Return Instl PRRIX InflationProtected BondPutnam Dynamic Asset Allocation Bal C AABCX Allocation50% to 70% EquityRiverPark Strategic Income Institutional RSIIX High Yield BondRiverPark Strategic Income Retail RSIVX High Yield BondSchwab US SmallCap ETF™ SCHA Small BlendVanguard European Stock Index Admiral VEUSX Europe StockVanguard InflationProtected Secs Inv VIPSX InflationProtected BondVanguard Pacific Stock Index Admiral VPADX Diversified Pacific/AsiaVanguard Real Estate Index Admiral VGSLX Real EstateVanguard Target Retirement 2015 Inv VTXVX TargetDate 2015Vanguard Target Retirement 2020 Inv VTWNX TargetDate 2020Vanguard Target Retirement 2025 Inv VTTVX TargetDate 2025Vanguard Target Retirement 2030 Inv VTHRX TargetDate 2030Vanguard Target Retirement 2035 Inv VTTHX TargetDate 2035Vanguard Target Retirement 2040 Inv VFORX TargetDate 2040Vanguard Target Retirement 2045 Inv VTIVX TargetDate 2045Vanguard Target Retirement 2050 Inv VFIFX TargetDate 2050Vanguard Total Bond Market Index Adm VBTLX Intermediate Core Bond
Please consider the investment objectives, risks, fees, and expenses carefully before investing. For this and other importantinformation about investments offered through your Plan, you may obtain prospectuses for registered investment company choicesand/or disclosure documents from the participant website or from your Plan's advisor. Read them carefully before investing.SAMPLE
©PCS 2020 16
Risk Profile: Choosing the Right PathWhat if I don't choose an investment option?If you do not choose a specific investment, your savings will be invested in the Plan's default investmentfund.
Remember - Your investments should:1. Reflect the level of risk you can tolerate.2. Fit with your investment time frame.3. Have investment objectives that match your own.
For information on each investment's objectives and goals, please refer to theinvestment's fact sheet and prospectus.
Starting to save for retirement is easy, and possibly the best thing youcan do for your financial future.
SAMPLE

©PCS 2020 17
Important Notices
Please review the following information and retain it for your future reference.
SAMPLE
A Penny Saved 401(k) Plan ("Plan")
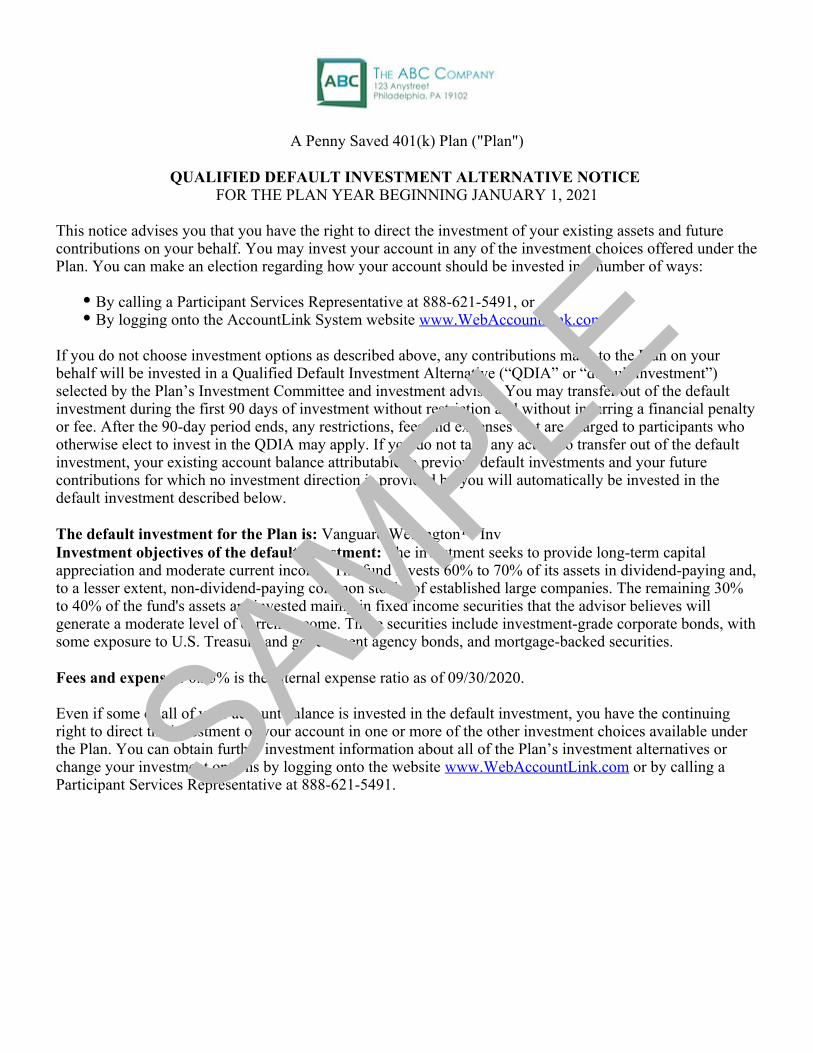
QUALIFIED DEFAULT INVESTMENT ALTERNATIVE NOTICEFOR THE PLAN YEAR BEGINNING JANUARY 1, 2021
This notice advises you that you have the right to direct the investment of your existing assets and futurecontributions on your behalf. You may invest your account in any of the investment choices offered under thePlan. You can make an election regarding how your account should be invested in a number of ways:
By calling a Participant Services Representative at , or 888-621-5491By logging onto the AccountLink System website . www.WebAccountLink.com
If you do not choose investment options as described above, any contributions made to the Plan on yourbehalf will be invested in a Qualified Default Investment Alternative (“QDIA” or “default investment”)selected by the Plan’s Investment Committee and investment advisor. You may transfer out of the defaultinvestment during the first 90 days of investment without restriction and without incurring a financial penaltyor fee. After the 90-day period ends, any restrictions, fees and expenses that are charged to participants whootherwise elect to invest in the QDIA may apply. If you do not take any action to transfer out of the defaultinvestment, your existing account balance attributable to previous default investments and your futurecontributions for which no investment direction is provided by you will automatically be invested in thedefault investment described below.
Vanguard Wellington™ InvThe default investment for the Plan is: The investment seeks to provide long-term capitalInvestment objectives of the default investment:
appreciation and moderate current income. The fund invests 60% to 70% of its assets in dividend-paying and,to a lesser extent, non-dividend-paying common stocks of established large companies. The remaining 30%to 40% of the fund's assets are invested mainly in fixed income securities that the advisor believes willgenerate a moderate level of current income. These securities include investment-grade corporate bonds, withsome exposure to U.S. Treasury and government agency bonds, and mortgage-backed securities.
0.25% is the internal expense ratio as of 09/30/2020.Fees and expenses:
Even if some or all of your account balance is invested in the default investment, you have the continuingright to direct the investment of your account in one or more of the other investment choices available underthe Plan. You can obtain further investment information about all of the Plan’s investment alternatives orchange your investment options by logging onto the website or by calling a www.WebAccountLink.comParticipant Services Representative at . 888-621-5491SAMPLE

©PCS 2020 19
Forms
The following forms and worksheets are for your convenience.
Please feel free to contact Participant Services at (888) 6215491 if you need assistance.
SAMPLE
A Penny Saved 401(k) Plan
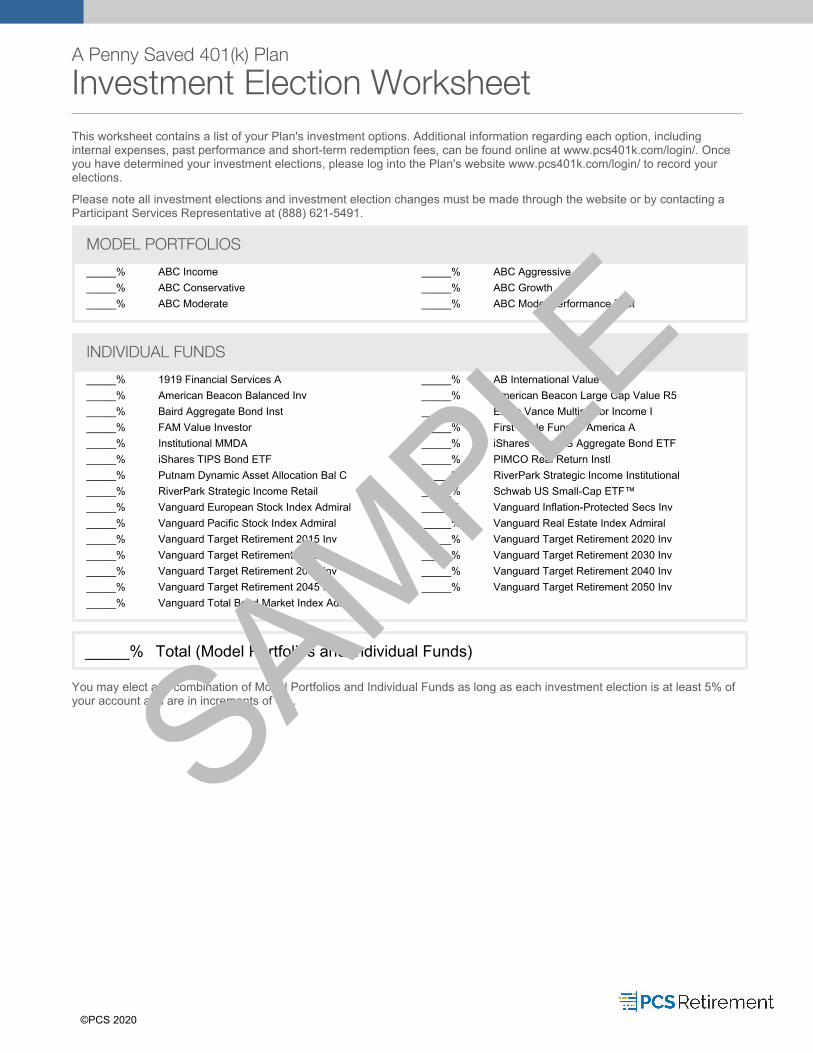
Investment Election Worksheet
This worksheet contains a list of your Plan's investment options. Additional information regarding each option, includinginternal expenses, past performance and shortterm redemption fees, can be found online at www.pcs401k.com/login/. Onceyou have determined your investment elections, please log into the Plan's website www.pcs401k.com/login/ to record yourelections.
Please note all investment elections and investment election changes must be made through the website or by contacting aParticipant Services Representative at (888) 6215491.
MODEL PORTFOLIOS
_____% ABC Income _____% ABC Aggressive_____% ABC Conservative _____% ABC Growth_____% ABC Moderate _____% ABC Model Performance Test
INDIVIDUAL FUNDS
_____% 1919 Financial Services A _____% AB International Value A_____% American Beacon Balanced Inv _____% American Beacon Large Cap Value R5_____% Baird Aggregate Bond Inst _____% Eaton Vance Multisector Income I_____% FAM Value Investor _____% First Eagle Fund of America A_____% Institutional MMDA _____% iShares Core US Aggregate Bond ETF_____% iShares TIPS Bond ETF _____% PIMCO Real Return Instl_____% Putnam Dynamic Asset Allocation Bal C _____% RiverPark Strategic Income Institutional_____% RiverPark Strategic Income Retail _____% Schwab US SmallCap ETF™_____% Vanguard European Stock Index Admiral _____% Vanguard InflationProtected Secs Inv_____% Vanguard Pacific Stock Index Admiral _____% Vanguard Real Estate Index Admiral_____% Vanguard Target Retirement 2015 Inv _____% Vanguard Target Retirement 2020 Inv_____% Vanguard Target Retirement 2025 Inv _____% Vanguard Target Retirement 2030 Inv_____% Vanguard Target Retirement 2035 Inv _____% Vanguard Target Retirement 2040 Inv_____% Vanguard Target Retirement 2045 Inv _____% Vanguard Target Retirement 2050 Inv_____% Vanguard Total Bond Market Index Adm
_____% Total (Model Portfolios and Individual Funds)
You may elect any combination of Model Portfolios and Individual Funds as long as each investment election is at least 5% ofyour account and are in increments of 1%.
©PCS 2020
SAMPLE
Contribution Election Worksheet
Change of Contribution Election Amount
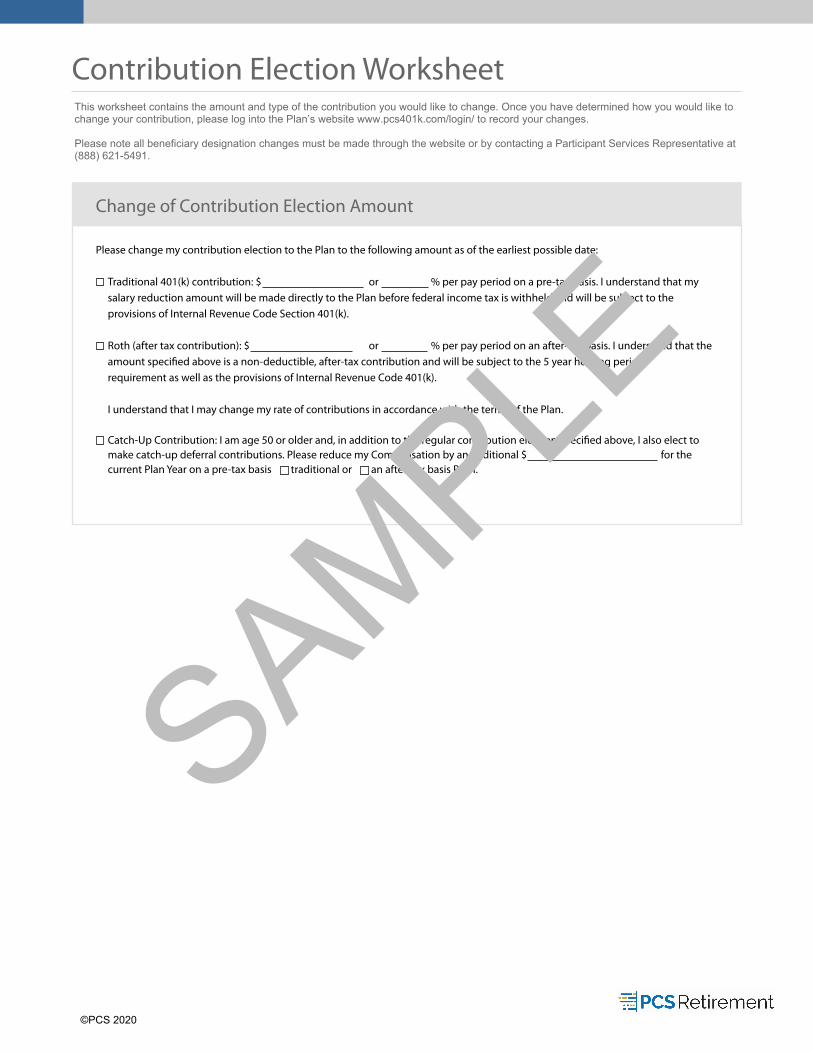
This worksheet contains the amount and type of the contribution you would like to change. Once you have determined how you would like to change your contribution, please log into the Plan’s website www.webaccountlink.com to record your changes.
Please note all contribution election changes must be made through the website or by contacting a PCS Participant Services Rep-resenative at (888) 621-5491.
Please change my contribution election to the Plan to the following amount as of the earliest possible date:
Traditional 401(k) contribution: $ or % per pay period on a pre-tax basis. I understand that my salary reduction amount will be made directly to the Plan before federal income tax is withheld and will be subject to the provisions of Internal Revenue Code Section 401(k).
Roth (after tax contribution): $ or % per pay period on an after-tax basis. I understand that theamount specified above is a non-deductible, after-tax contribution and will be subject to the 5 year holding periodrequirement as well as the provisions of Internal Revenue Code 401(k).
I understand that I may change my rate of contributions in accordance with the terms of the Plan.
Catch-Up Contribution: I am age 50 or older and, in addition to the regular contribution election specified above, I also elect to make catch-up deferral contributions. Please reduce my Compensation by an additional $ for the current Plan Year on a pre-tax basis traditional or an after-tax basis Roth.
This worksheet contains the amount and type of the contribution you would like to change. Once you have determined how you would like tochange your contribution, please log into the Plan’s website www.pcs401k.com/login/ to record your changes.
Please note all beneficiary designation changes must be made through the website or by contacting a Participant Services Representative at(888) 6215491.
©PCS 2020
SAMPLE
Beneficiary Designation Worksheet
Primary Beneficiary(ies)
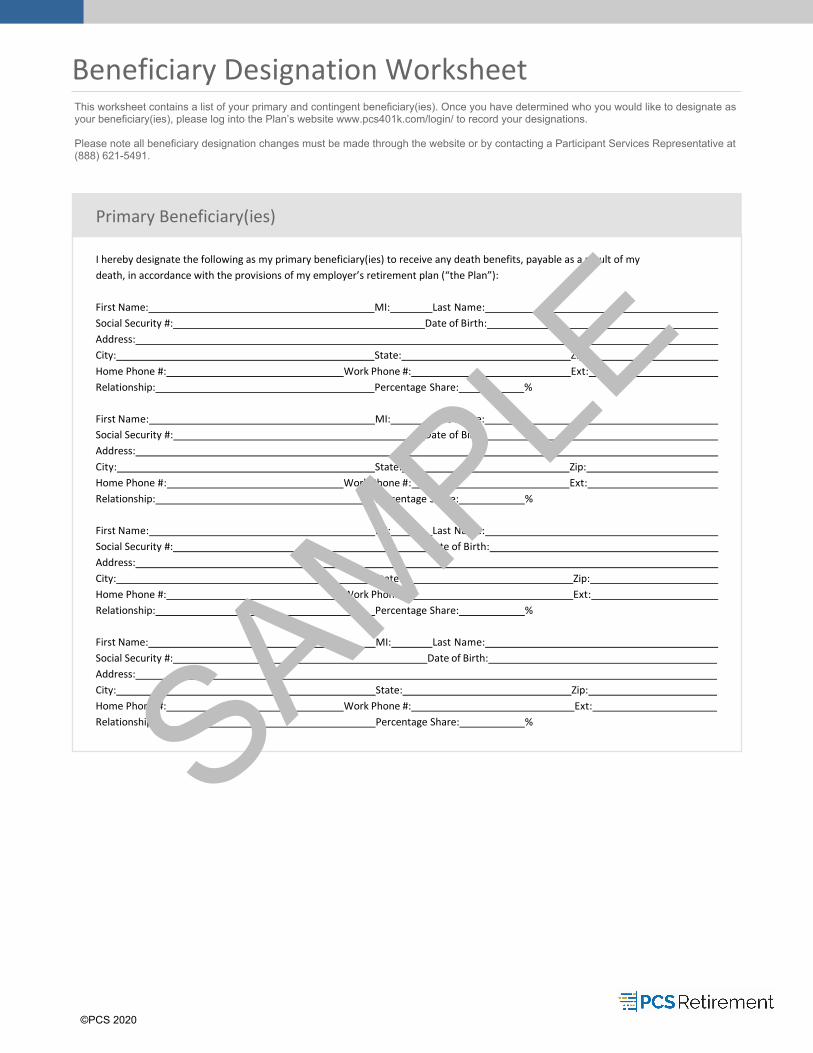
I hereby designate the following as my primary beneficiary(ies) to receive any death benefits, payable as a result of my
death, in accordance with the provisions of my employer’s retirement plan (“the Plan”):
First Name: MI: Last Name:
Social Security #: Date of Birth:
Address:
City: State: Zip:
Home Phone #: Work Phone #: Ext:
Relationship: Percentage Share: %
First Name: MI: Last Name:
Social Security #: Date of Birth:
Address:
City: State: Zip:
Home Phone #: Work Phone #: Ext:
Relationship: Percentage Share: %
First Name: MI: Last Name:
Social Security #: Date of Birth:
Address:
City: State: Zip:
Home Phone #: Work Phone #: Ext:
Relationship: Percentage Share: %
First Name: MI: Last Name:
Social Security #: Date of Birth:
Address:
City: State: Zip:
Home Phone #: Work Phone #: Ext:
Relationship: Percentage Share: %
This worksheet contains a list of your primary and contingent beneficiary(ies). Once you have determined who you would like to designate asyour beneficiary(ies), please log into the Plan’s website www.pcs401k.com/login/ to record your designations.
Please note all beneficiary designation changes must be made through the website or by contacting a Participant Services Representative at(888) 6215491.
©PCS 2020
SAMPLE
Contingent Beneficiary(ies)
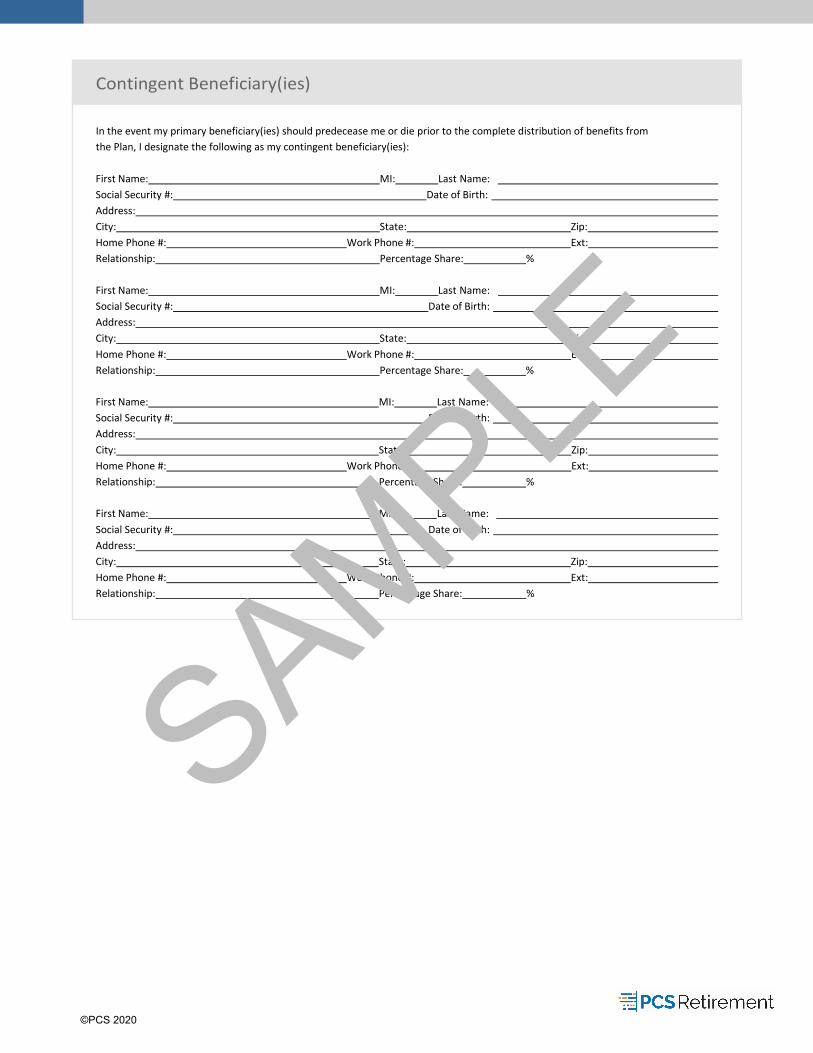
In the event my primary beneficiary(ies) should predecease me or die prior to the complete distribution of benefits from
the Plan, I designate the following as my contingent beneficiary(ies):
First Name: MI: Last Name:
Social Security #: Date of Birth:
Address:
City: State: Zip:
Home Phone #: Work Phone #: Ext:
Relationship: Percentage Share: %
First Name: MI: Last Name:
Social Security #: Date of Birth:
Address:
City: State: Zip:
Home Phone #: Work Phone #: Ext:
Relationship: Percentage Share: %
First Name: MI: Last Name:
Social Security #: Date of Birth:
Address:
City: State: Zip:
Home Phone #: Work Phone #: Ext:
Relationship: Percentage Share: %
First Name: MI: Last Name:
Social Security #: Date of Birth:
Address:
City: State: Zip:
Home Phone #: Work Phone #: Ext:
Relationship: Percentage Share: %
©PCS 2020
SAMPLE

©PCS 2020 24
Plan Investments: Model Portfolios
What can I invest in?The following pages contain information about the model portfolios within your Plan. These portfolios arecomprised of multiple funds and generally offer broader diversification than picking a single fund. Pleaseread the information about all of the investment options available to you within the plan before you invest.
Questions about the model portfolios?Contact the Plan's financial advisor, Every Penny Counts at (555) 5555555 or [email protected].
SAMPLE

ABC Income As of 03/31/2020
Model DescriptionTESTis is a Sample Description.
Total Return as of 03/31/2020 Portfolio Benchmark3 Month Return 7.66% N/A1 Year Return 0.08% N/A3 Year Return 3.1% N/A5 Year Return 11.74% N/A10 Year Return N/A N/ASince Inception (04/01/2011) 7.05% N/A
Fees and Expenses*Gross Expense Ratio 0.09%Annual Expense per $1,000 Invested $0.93Net Expense Ratio 0.09%Annual Expense per $1,000 Invested $0.93Underlying Fund Turnover 63.7%12b1 Expense NoneSales Charge NoneDeferred Sales Charge NoneRedemption Fees None
Asset Allocation*
US StocksNonUS StocksBondsCashOther
10.0%0.0%87.7%1.1%0.1%
Investment by Region*Americas 100.0%Greater Europe 0.0%Greater Asia 0.0%
US Stock Asset Classes*Lg 2.9% 24.9% 4.7%
Mid 9.5% 35.7% 0.8%
Sm 6.2% 13.1% 2.2%
Value Blend Growth
Portfolio Holdings*Vanguard Total Bond Market Index Adm 70.00%Vanguard HighYield Corporate Inv 20.00%Vanguard Real Estate Index Admiral 10.00%
Fees and ExpensesThe cumulative effect of investment fees and expenses can substantially reduce your retirement savings. However, fees and expenses are only two of many factors to consider when deciding what investment is appropriate for you. For additional informationconcerning the longterm effect of fees and expenses, visit the US DOL web site at http://www.dol.gov/ebsa/publications/401k_employee.html.
Inception Date: 04/01/2011. The representative benchmark consists of 90% Vanguard S&P 500 ETF (0.04%) and 10% Vanguard Growth Index Admiral (0.05%).
*Data is the most recently available provided to Morningstar as of 03/31/2021.
Periods longer than one year are Annualized.
Model returns shown are based on actual trading data from the PCS recordkeeping platform. Return is calculated using the model's daily gain or loss value adjusted to remove the effects of external cash flows. Periods longer than 12 months are expressed asAnnualized Returns equivalent to the compound rate of return which, over a certain period of time, would produce a total return over that same period. Returns for less than 12 months are not annualized. Performance results displayed relate only to accountsheld and traded on the recordkeeper's platform. Performance results may differ if the analysis were to include any advisor's accounts invested in the model but not maintained on the recordkeeper's platform.
Performance returns should be viewed in the context of the broad market and general economic conditions prevailing during the periods covered by the performance information. Performance does not reflect the deduction of service provider fees, such asinvestment advisor(s), recordkeeper, TPA, and custodian, which would reduce a client's return by the amount of these fees. For example, if such fees totaled 1% per annum, they would reduce a 10% per annum model portfolio return to 9% per annum. Giventhe effects of compounding of these fees, the difference between the performance of the actual client account with fees versus the grossoffee performance shown here would continue to increase over longer periods of time, resulting in actual clientperformance that is lower, on a compounded basis, than model performance shown here. For complete information on your Plan's fees, please view your Plan's Annual Participant Disclosure available in your Plan's Enrollment booklet, a copy of which can befound on the PCS Participant website under the Learning Center. The performance reflected herein assumes that all dividends or distributions paid on the securities held in the model portfolios were retained and reinvested, rather than distributed, during theperiod covered. The analysis in this report may be based, in part, on adjusted historical returns for periods prior to one or more the model's underlying funds' actual inception. For mutual funds, these calculated returns reflect the historical performance of theoldest share class of the fund, adjusted to reflect the fees and expenses of this share class. All investments involve the risk of potential investment losses as well as the potential for investment gains. Comparisons to index benchmarks have limitations becausebenchmarks have volatility and other material characteristics that may differ from the Model. Also, performance results for benchmarks do not reflect payment of investment management/incentive fees and other fund expenses. Performance results do not reflectinvestment results of any individual client. For reasons including variances in Model account holdings, variances in the investment management fee incurred, market fluctuation, the date on which a participant invests in a Model, and any contributions orwithdrawals, the performance of a specific participant's account may vary from the results shown. Performance data quoted represents past performance. Past performance does not guarantee future results. Investment return and the principal value of aninvestment will fluctuate. An Investor's shares, when redeemed, may be worth more or less than their original cost. Current performance may be lower or higher than the performance data quoted. To obtain performance data current to the most recentmonthend, please log into your account at www.pcs401k.com/login/.
Model investments may change at any time without prior notice and therefore may differ from those shown above.
Model Underlying Investment Performance: Vanguard Real Estate Index Admiral, 1 Year: 36.54, 5 Year: 6.13, 10 Year: 8.91, Since Inception: 10.13 (11/12/2001); Vanguard Total Bond Market Index Adm, 1 Year: 0.54, 5 Year: 3.07, 10 Year: 3.39, SinceInception: 4.13 (11/12/2001); Vanguard HighYield Corporate Inv, 1 Year: 17.64, 5 Year: 6.57, 10 Year: 6.01, Since Inception: 8.20 (12/27/1978)
This information is intended for distribution to retirement plans only. The information contained herein: (1) is proprietary to The Advisor Lab, LLC ("The Lab") and PCS Retirement, LLC ("PCS"); (2) may not be copied or distributed; and (3) is not warranted to beaccurate, complete or timely. The Lab and PCS are not responsible for any damages or losses arising from any use of this information. Investment data and Morningstar Proprietary Index data source: ©2021 Morningstar. All Rights Reserved. Index source:Lipper, a Thomson Reuters Company. Copyright 2021 © Thomson Reuters. All rights reserved.
SAMPLE
ABC Conservative As of 03/31/2020
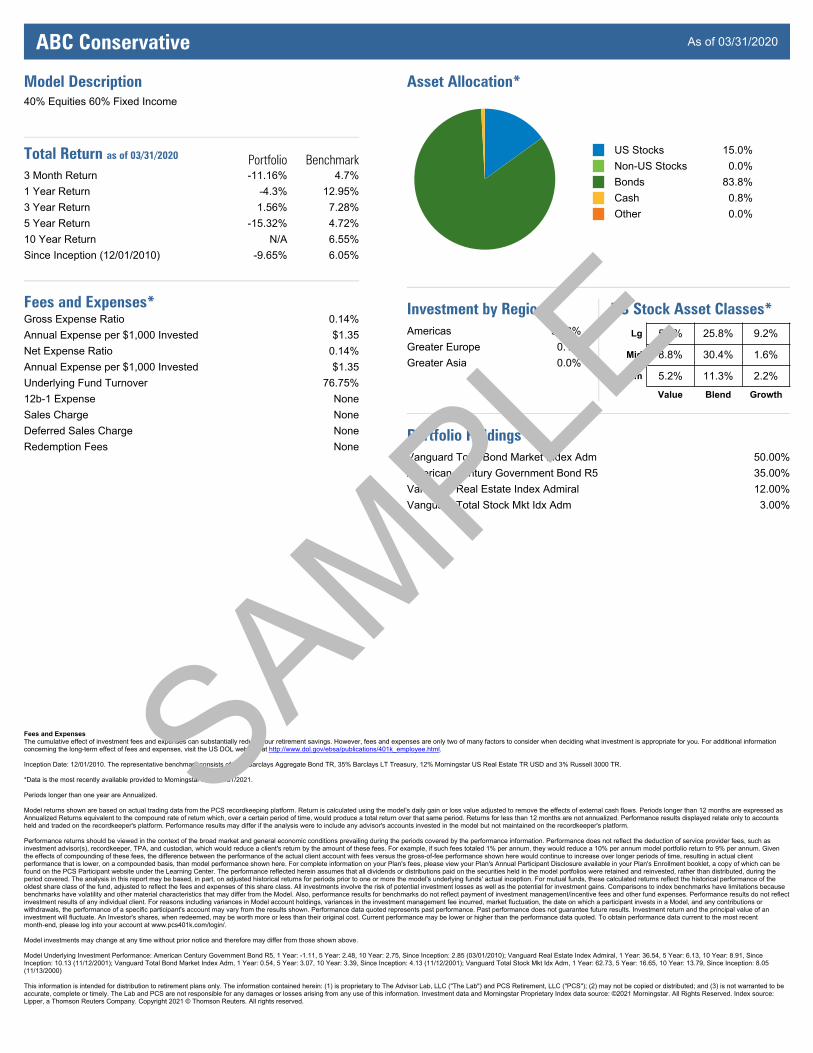
Model Description40% Equities 60% Fixed Income
Total Return as of 03/31/2020 Portfolio Benchmark3 Month Return 11.16% 4.7%1 Year Return 4.3% 12.95%3 Year Return 1.56% 7.28%5 Year Return 15.32% 4.72%10 Year Return N/A 6.55%Since Inception (12/01/2010) 9.65% 6.05%
Fees and Expenses*Gross Expense Ratio 0.14%Annual Expense per $1,000 Invested $1.35Net Expense Ratio 0.14%Annual Expense per $1,000 Invested $1.35Underlying Fund Turnover 76.75%12b1 Expense NoneSales Charge NoneDeferred Sales Charge NoneRedemption Fees None
Asset Allocation*
US StocksNonUS StocksBondsCashOther
15.0%0.0%83.8%0.8%0.0%
Investment by Region*Americas 99.8%Greater Europe 0.1%Greater Asia 0.0%
US Stock Asset Classes*Lg 5.5% 25.8% 9.2%
Mid 8.8% 30.4% 1.6%
Sm 5.2% 11.3% 2.2%
Value Blend Growth
Portfolio Holdings*Vanguard Total Bond Market Index Adm 50.00%American Century Government Bond R5 35.00%Vanguard Real Estate Index Admiral 12.00%Vanguard Total Stock Mkt Idx Adm 3.00%
Fees and ExpensesThe cumulative effect of investment fees and expenses can substantially reduce your retirement savings. However, fees and expenses are only two of many factors to consider when deciding what investment is appropriate for you. For additional informationconcerning the longterm effect of fees and expenses, visit the US DOL web site at http://www.dol.gov/ebsa/publications/401k_employee.html.
Inception Date: 12/01/2010. The representative benchmark consists of 50% Barclays Aggregate Bond TR, 35% Barclays LT Treasury, 12% Morningstar US Real Estate TR USD and 3% Russell 3000 TR.
*Data is the most recently available provided to Morningstar as of 03/31/2021.
Periods longer than one year are Annualized.
Model returns shown are based on actual trading data from the PCS recordkeeping platform. Return is calculated using the model's daily gain or loss value adjusted to remove the effects of external cash flows. Periods longer than 12 months are expressed asAnnualized Returns equivalent to the compound rate of return which, over a certain period of time, would produce a total return over that same period. Returns for less than 12 months are not annualized. Performance results displayed relate only to accountsheld and traded on the recordkeeper's platform. Performance results may differ if the analysis were to include any advisor's accounts invested in the model but not maintained on the recordkeeper's platform.
Performance returns should be viewed in the context of the broad market and general economic conditions prevailing during the periods covered by the performance information. Performance does not reflect the deduction of service provider fees, such asinvestment advisor(s), recordkeeper, TPA, and custodian, which would reduce a client's return by the amount of these fees. For example, if such fees totaled 1% per annum, they would reduce a 10% per annum model portfolio return to 9% per annum. Giventhe effects of compounding of these fees, the difference between the performance of the actual client account with fees versus the grossoffee performance shown here would continue to increase over longer periods of time, resulting in actual clientperformance that is lower, on a compounded basis, than model performance shown here. For complete information on your Plan's fees, please view your Plan's Annual Participant Disclosure available in your Plan's Enrollment booklet, a copy of which can befound on the PCS Participant website under the Learning Center. The performance reflected herein assumes that all dividends or distributions paid on the securities held in the model portfolios were retained and reinvested, rather than distributed, during theperiod covered. The analysis in this report may be based, in part, on adjusted historical returns for periods prior to one or more the model's underlying funds' actual inception. For mutual funds, these calculated returns reflect the historical performance of theoldest share class of the fund, adjusted to reflect the fees and expenses of this share class. All investments involve the risk of potential investment losses as well as the potential for investment gains. Comparisons to index benchmarks have limitations becausebenchmarks have volatility and other material characteristics that may differ from the Model. Also, performance results for benchmarks do not reflect payment of investment management/incentive fees and other fund expenses. Performance results do not reflectinvestment results of any individual client. For reasons including variances in Model account holdings, variances in the investment management fee incurred, market fluctuation, the date on which a participant invests in a Model, and any contributions orwithdrawals, the performance of a specific participant's account may vary from the results shown. Performance data quoted represents past performance. Past performance does not guarantee future results. Investment return and the principal value of aninvestment will fluctuate. An Investor's shares, when redeemed, may be worth more or less than their original cost. Current performance may be lower or higher than the performance data quoted. To obtain performance data current to the most recentmonthend, please log into your account at www.pcs401k.com/login/.
Model investments may change at any time without prior notice and therefore may differ from those shown above.
Model Underlying Investment Performance: American Century Government Bond R5, 1 Year: 1.11, 5 Year: 2.48, 10 Year: 2.75, Since Inception: 2.85 (03/01/2010); Vanguard Real Estate Index Admiral, 1 Year: 36.54, 5 Year: 6.13, 10 Year: 8.91, SinceInception: 10.13 (11/12/2001); Vanguard Total Bond Market Index Adm, 1 Year: 0.54, 5 Year: 3.07, 10 Year: 3.39, Since Inception: 4.13 (11/12/2001); Vanguard Total Stock Mkt Idx Adm, 1 Year: 62.73, 5 Year: 16.65, 10 Year: 13.79, Since Inception: 8.05(11/13/2000)
This information is intended for distribution to retirement plans only. The information contained herein: (1) is proprietary to The Advisor Lab, LLC ("The Lab") and PCS Retirement, LLC ("PCS"); (2) may not be copied or distributed; and (3) is not warranted to beaccurate, complete or timely. The Lab and PCS are not responsible for any damages or losses arising from any use of this information. Investment data and Morningstar Proprietary Index data source: ©2021 Morningstar. All Rights Reserved. Index source:Lipper, a Thomson Reuters Company. Copyright 2021 © Thomson Reuters. All rights reserved.
SAMPLE
ABC Moderate As of 03/31/2020
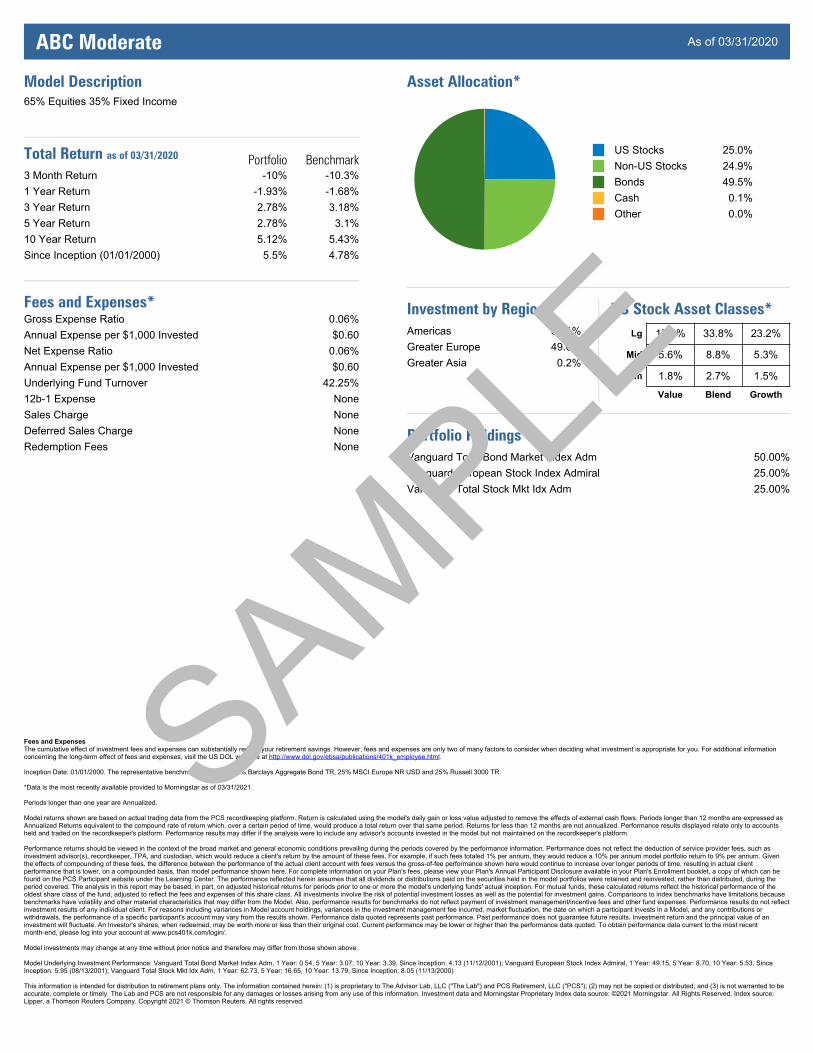
Model Description65% Equities 35% Fixed Income
Total Return as of 03/31/2020 Portfolio Benchmark3 Month Return 10% 10.3%1 Year Return 1.93% 1.68%3 Year Return 2.78% 3.18%5 Year Return 2.78% 3.1%10 Year Return 5.12% 5.43%Since Inception (01/01/2000) 5.5% 4.78%
Fees and Expenses*Gross Expense Ratio 0.06%Annual Expense per $1,000 Invested $0.60Net Expense Ratio 0.06%Annual Expense per $1,000 Invested $0.60Underlying Fund Turnover 42.25%12b1 Expense NoneSales Charge NoneDeferred Sales Charge NoneRedemption Fees None
Asset Allocation*
US StocksNonUS StocksBondsCashOther
25.0%24.9%49.5%0.1%0.0%
Investment by Region*Americas 50.1%Greater Europe 49.6%Greater Asia 0.2%
US Stock Asset Classes*Lg 17.4% 33.8% 23.2%
Mid 5.6% 8.8% 5.3%
Sm 1.8% 2.7% 1.5%
Value Blend Growth
Portfolio Holdings*Vanguard Total Bond Market Index Adm 50.00%Vanguard European Stock Index Admiral 25.00%Vanguard Total Stock Mkt Idx Adm 25.00%
Fees and ExpensesThe cumulative effect of investment fees and expenses can substantially reduce your retirement savings. However, fees and expenses are only two of many factors to consider when deciding what investment is appropriate for you. For additional informationconcerning the longterm effect of fees and expenses, visit the US DOL web site at http://www.dol.gov/ebsa/publications/401k_employee.html.
Inception Date: 01/01/2000. The representative benchmark consists of 50% Barclays Aggregate Bond TR, 25% MSCI Europe NR USD and 25% Russell 3000 TR.
*Data is the most recently available provided to Morningstar as of 03/31/2021.
Periods longer than one year are Annualized.
Model returns shown are based on actual trading data from the PCS recordkeeping platform. Return is calculated using the model's daily gain or loss value adjusted to remove the effects of external cash flows. Periods longer than 12 months are expressed asAnnualized Returns equivalent to the compound rate of return which, over a certain period of time, would produce a total return over that same period. Returns for less than 12 months are not annualized. Performance results displayed relate only to accountsheld and traded on the recordkeeper's platform. Performance results may differ if the analysis were to include any advisor's accounts invested in the model but not maintained on the recordkeeper's platform.
Performance returns should be viewed in the context of the broad market and general economic conditions prevailing during the periods covered by the performance information. Performance does not reflect the deduction of service provider fees, such asinvestment advisor(s), recordkeeper, TPA, and custodian, which would reduce a client's return by the amount of these fees. For example, if such fees totaled 1% per annum, they would reduce a 10% per annum model portfolio return to 9% per annum. Giventhe effects of compounding of these fees, the difference between the performance of the actual client account with fees versus the grossoffee performance shown here would continue to increase over longer periods of time, resulting in actual clientperformance that is lower, on a compounded basis, than model performance shown here. For complete information on your Plan's fees, please view your Plan's Annual Participant Disclosure available in your Plan's Enrollment booklet, a copy of which can befound on the PCS Participant website under the Learning Center. The performance reflected herein assumes that all dividends or distributions paid on the securities held in the model portfolios were retained and reinvested, rather than distributed, during theperiod covered. The analysis in this report may be based, in part, on adjusted historical returns for periods prior to one or more the model's underlying funds' actual inception. For mutual funds, these calculated returns reflect the historical performance of theoldest share class of the fund, adjusted to reflect the fees and expenses of this share class. All investments involve the risk of potential investment losses as well as the potential for investment gains. Comparisons to index benchmarks have limitations becausebenchmarks have volatility and other material characteristics that may differ from the Model. Also, performance results for benchmarks do not reflect payment of investment management/incentive fees and other fund expenses. Performance results do not reflectinvestment results of any individual client. For reasons including variances in Model account holdings, variances in the investment management fee incurred, market fluctuation, the date on which a participant invests in a Model, and any contributions orwithdrawals, the performance of a specific participant's account may vary from the results shown. Performance data quoted represents past performance. Past performance does not guarantee future results. Investment return and the principal value of aninvestment will fluctuate. An Investor's shares, when redeemed, may be worth more or less than their original cost. Current performance may be lower or higher than the performance data quoted. To obtain performance data current to the most recentmonthend, please log into your account at www.pcs401k.com/login/.
Model investments may change at any time without prior notice and therefore may differ from those shown above.
Model Underlying Investment Performance: Vanguard Total Bond Market Index Adm, 1 Year: 0.54, 5 Year: 3.07, 10 Year: 3.39, Since Inception: 4.13 (11/12/2001); Vanguard European Stock Index Admiral, 1 Year: 49.15, 5 Year: 8.70, 10 Year: 5.53, SinceInception: 5.95 (08/13/2001); Vanguard Total Stock Mkt Idx Adm, 1 Year: 62.73, 5 Year: 16.65, 10 Year: 13.79, Since Inception: 8.05 (11/13/2000)
This information is intended for distribution to retirement plans only. The information contained herein: (1) is proprietary to The Advisor Lab, LLC ("The Lab") and PCS Retirement, LLC ("PCS"); (2) may not be copied or distributed; and (3) is not warranted to beaccurate, complete or timely. The Lab and PCS are not responsible for any damages or losses arising from any use of this information. Investment data and Morningstar Proprietary Index data source: ©2021 Morningstar. All Rights Reserved. Index source:Lipper, a Thomson Reuters Company. Copyright 2021 © Thomson Reuters. All rights reserved.
SAMPLE
ABC Aggressive As of 03/31/2020
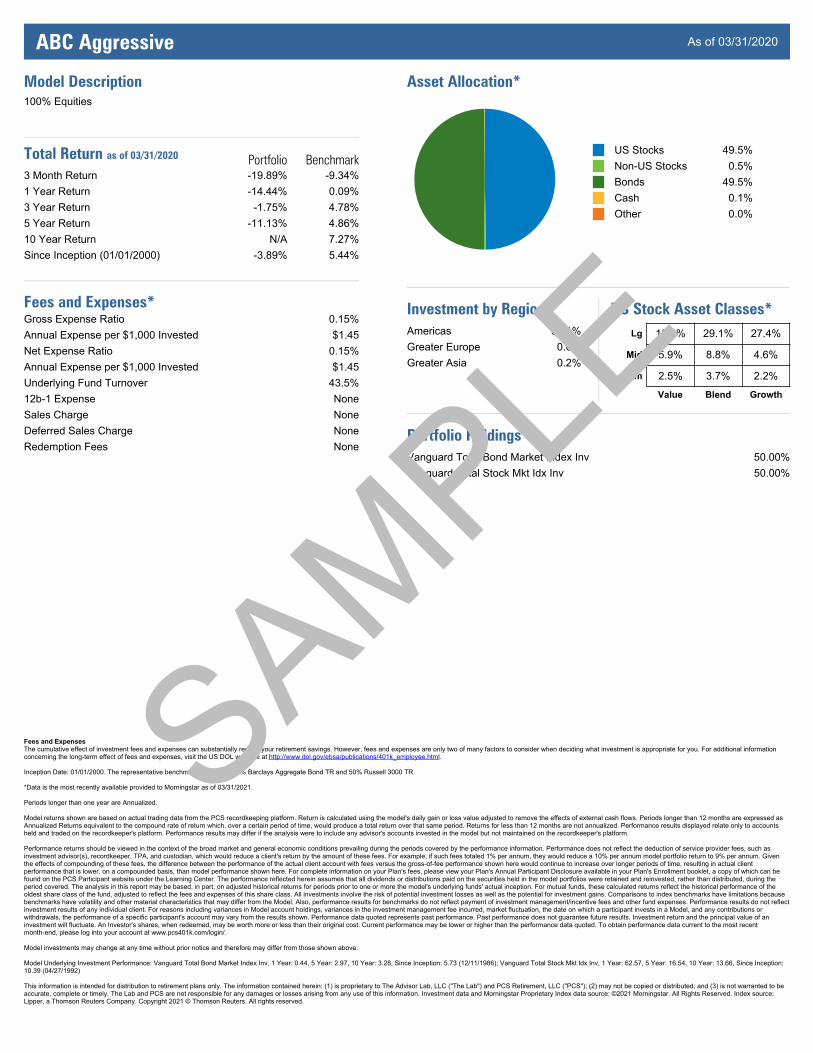
Model Description100% Equities
Total Return as of 03/31/2020 Portfolio Benchmark3 Month Return 19.89% 9.34%1 Year Return 14.44% 0.09%3 Year Return 1.75% 4.78%5 Year Return 11.13% 4.86%10 Year Return N/A 7.27%Since Inception (01/01/2000) 3.89% 5.44%
Fees and Expenses*Gross Expense Ratio 0.15%Annual Expense per $1,000 Invested $1.45Net Expense Ratio 0.15%Annual Expense per $1,000 Invested $1.45Underlying Fund Turnover 43.5%12b1 Expense NoneSales Charge NoneDeferred Sales Charge NoneRedemption Fees None
Asset Allocation*
US StocksNonUS StocksBondsCashOther
49.5%0.5%49.5%0.1%0.0%
Investment by Region*Americas 99.1%Greater Europe 0.6%Greater Asia 0.2%
US Stock Asset Classes*Lg 15.8% 29.1% 27.4%
Mid 5.9% 8.8% 4.6%
Sm 2.5% 3.7% 2.2%
Value Blend Growth
Portfolio Holdings*Vanguard Total Bond Market Index Inv 50.00%Vanguard Total Stock Mkt Idx Inv 50.00%
Fees and ExpensesThe cumulative effect of investment fees and expenses can substantially reduce your retirement savings. However, fees and expenses are only two of many factors to consider when deciding what investment is appropriate for you. For additional informationconcerning the longterm effect of fees and expenses, visit the US DOL web site at http://www.dol.gov/ebsa/publications/401k_employee.html.
Inception Date: 01/01/2000. The representative benchmark consists of 50% Barclays Aggregate Bond TR and 50% Russell 3000 TR.
*Data is the most recently available provided to Morningstar as of 03/31/2021.
Periods longer than one year are Annualized.
Model returns shown are based on actual trading data from the PCS recordkeeping platform. Return is calculated using the model's daily gain or loss value adjusted to remove the effects of external cash flows. Periods longer than 12 months are expressed asAnnualized Returns equivalent to the compound rate of return which, over a certain period of time, would produce a total return over that same period. Returns for less than 12 months are not annualized. Performance results displayed relate only to accountsheld and traded on the recordkeeper's platform. Performance results may differ if the analysis were to include any advisor's accounts invested in the model but not maintained on the recordkeeper's platform.
Performance returns should be viewed in the context of the broad market and general economic conditions prevailing during the periods covered by the performance information. Performance does not reflect the deduction of service provider fees, such asinvestment advisor(s), recordkeeper, TPA, and custodian, which would reduce a client's return by the amount of these fees. For example, if such fees totaled 1% per annum, they would reduce a 10% per annum model portfolio return to 9% per annum. Giventhe effects of compounding of these fees, the difference between the performance of the actual client account with fees versus the grossoffee performance shown here would continue to increase over longer periods of time, resulting in actual clientperformance that is lower, on a compounded basis, than model performance shown here. For complete information on your Plan's fees, please view your Plan's Annual Participant Disclosure available in your Plan's Enrollment booklet, a copy of which can befound on the PCS Participant website under the Learning Center. The performance reflected herein assumes that all dividends or distributions paid on the securities held in the model portfolios were retained and reinvested, rather than distributed, during theperiod covered. The analysis in this report may be based, in part, on adjusted historical returns for periods prior to one or more the model's underlying funds' actual inception. For mutual funds, these calculated returns reflect the historical performance of theoldest share class of the fund, adjusted to reflect the fees and expenses of this share class. All investments involve the risk of potential investment losses as well as the potential for investment gains. Comparisons to index benchmarks have limitations becausebenchmarks have volatility and other material characteristics that may differ from the Model. Also, performance results for benchmarks do not reflect payment of investment management/incentive fees and other fund expenses. Performance results do not reflectinvestment results of any individual client. For reasons including variances in Model account holdings, variances in the investment management fee incurred, market fluctuation, the date on which a participant invests in a Model, and any contributions orwithdrawals, the performance of a specific participant's account may vary from the results shown. Performance data quoted represents past performance. Past performance does not guarantee future results. Investment return and the principal value of aninvestment will fluctuate. An Investor's shares, when redeemed, may be worth more or less than their original cost. Current performance may be lower or higher than the performance data quoted. To obtain performance data current to the most recentmonthend, please log into your account at www.pcs401k.com/login/.
Model investments may change at any time without prior notice and therefore may differ from those shown above.
Model Underlying Investment Performance: Vanguard Total Bond Market Index Inv, 1 Year: 0.44, 5 Year: 2.97, 10 Year: 3.28, Since Inception: 5.73 (12/11/1986); Vanguard Total Stock Mkt Idx Inv, 1 Year: 62.57, 5 Year: 16.54, 10 Year: 13.66, Since Inception:10.39 (04/27/1992)
This information is intended for distribution to retirement plans only. The information contained herein: (1) is proprietary to The Advisor Lab, LLC ("The Lab") and PCS Retirement, LLC ("PCS"); (2) may not be copied or distributed; and (3) is not warranted to beaccurate, complete or timely. The Lab and PCS are not responsible for any damages or losses arising from any use of this information. Investment data and Morningstar Proprietary Index data source: ©2021 Morningstar. All Rights Reserved. Index source:Lipper, a Thomson Reuters Company. Copyright 2021 © Thomson Reuters. All rights reserved.
SAMPLE
ABC Growth As of 03/31/2020
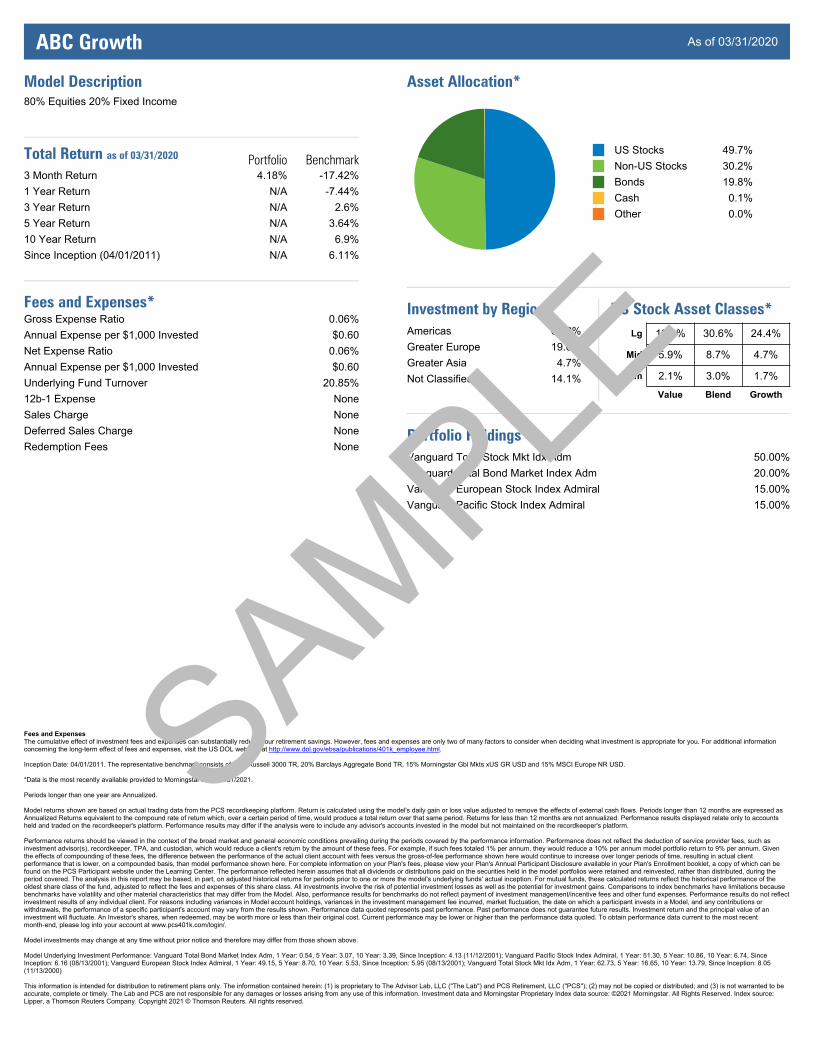
Model Description80% Equities 20% Fixed Income
Total Return as of 03/31/2020 Portfolio Benchmark3 Month Return 4.18% 17.42%1 Year Return N/A 7.44%3 Year Return N/A 2.6%5 Year Return N/A 3.64%10 Year Return N/A 6.9%Since Inception (04/01/2011) N/A 6.11%
Fees and Expenses*Gross Expense Ratio 0.06%Annual Expense per $1,000 Invested $0.60Net Expense Ratio 0.06%Annual Expense per $1,000 Invested $0.60Underlying Fund Turnover 20.85%12b1 Expense NoneSales Charge NoneDeferred Sales Charge NoneRedemption Fees None
Asset Allocation*
US StocksNonUS StocksBondsCashOther
49.7%30.2%19.8%0.1%0.0%
Investment by Region*Americas 62.2%Greater Europe 19.0%Greater Asia 4.7%Not Classified 14.1%
US Stock Asset Classes*Lg 19.0% 30.6% 24.4%
Mid 5.9% 8.7% 4.7%
Sm 2.1% 3.0% 1.7%
Value Blend Growth
Portfolio Holdings*Vanguard Total Stock Mkt Idx Adm 50.00%Vanguard Total Bond Market Index Adm 20.00%Vanguard European Stock Index Admiral 15.00%Vanguard Pacific Stock Index Admiral 15.00%
Fees and ExpensesThe cumulative effect of investment fees and expenses can substantially reduce your retirement savings. However, fees and expenses are only two of many factors to consider when deciding what investment is appropriate for you. For additional informationconcerning the longterm effect of fees and expenses, visit the US DOL web site at http://www.dol.gov/ebsa/publications/401k_employee.html.
Inception Date: 04/01/2011. The representative benchmark consists of 50% Russell 3000 TR, 20% Barclays Aggregate Bond TR, 15% Morningstar Gbl Mkts xUS GR USD and 15% MSCI Europe NR USD.
*Data is the most recently available provided to Morningstar as of 03/31/2021.
Periods longer than one year are Annualized.
Model returns shown are based on actual trading data from the PCS recordkeeping platform. Return is calculated using the model's daily gain or loss value adjusted to remove the effects of external cash flows. Periods longer than 12 months are expressed asAnnualized Returns equivalent to the compound rate of return which, over a certain period of time, would produce a total return over that same period. Returns for less than 12 months are not annualized. Performance results displayed relate only to accountsheld and traded on the recordkeeper's platform. Performance results may differ if the analysis were to include any advisor's accounts invested in the model but not maintained on the recordkeeper's platform.
Performance returns should be viewed in the context of the broad market and general economic conditions prevailing during the periods covered by the performance information. Performance does not reflect the deduction of service provider fees, such asinvestment advisor(s), recordkeeper, TPA, and custodian, which would reduce a client's return by the amount of these fees. For example, if such fees totaled 1% per annum, they would reduce a 10% per annum model portfolio return to 9% per annum. Giventhe effects of compounding of these fees, the difference between the performance of the actual client account with fees versus the grossoffee performance shown here would continue to increase over longer periods of time, resulting in actual clientperformance that is lower, on a compounded basis, than model performance shown here. For complete information on your Plan's fees, please view your Plan's Annual Participant Disclosure available in your Plan's Enrollment booklet, a copy of which can befound on the PCS Participant website under the Learning Center. The performance reflected herein assumes that all dividends or distributions paid on the securities held in the model portfolios were retained and reinvested, rather than distributed, during theperiod covered. The analysis in this report may be based, in part, on adjusted historical returns for periods prior to one or more the model's underlying funds' actual inception. For mutual funds, these calculated returns reflect the historical performance of theoldest share class of the fund, adjusted to reflect the fees and expenses of this share class. All investments involve the risk of potential investment losses as well as the potential for investment gains. Comparisons to index benchmarks have limitations becausebenchmarks have volatility and other material characteristics that may differ from the Model. Also, performance results for benchmarks do not reflect payment of investment management/incentive fees and other fund expenses. Performance results do not reflectinvestment results of any individual client. For reasons including variances in Model account holdings, variances in the investment management fee incurred, market fluctuation, the date on which a participant invests in a Model, and any contributions orwithdrawals, the performance of a specific participant's account may vary from the results shown. Performance data quoted represents past performance. Past performance does not guarantee future results. Investment return and the principal value of aninvestment will fluctuate. An Investor's shares, when redeemed, may be worth more or less than their original cost. Current performance may be lower or higher than the performance data quoted. To obtain performance data current to the most recentmonthend, please log into your account at www.pcs401k.com/login/.
Model investments may change at any time without prior notice and therefore may differ from those shown above.
Model Underlying Investment Performance: Vanguard Total Bond Market Index Adm, 1 Year: 0.54, 5 Year: 3.07, 10 Year: 3.39, Since Inception: 4.13 (11/12/2001); Vanguard Pacific Stock Index Admiral, 1 Year: 51.30, 5 Year: 10.86, 10 Year: 6.74, SinceInception: 6.16 (08/13/2001); Vanguard European Stock Index Admiral, 1 Year: 49.15, 5 Year: 8.70, 10 Year: 5.53, Since Inception: 5.95 (08/13/2001); Vanguard Total Stock Mkt Idx Adm, 1 Year: 62.73, 5 Year: 16.65, 10 Year: 13.79, Since Inception: 8.05(11/13/2000)
This information is intended for distribution to retirement plans only. The information contained herein: (1) is proprietary to The Advisor Lab, LLC ("The Lab") and PCS Retirement, LLC ("PCS"); (2) may not be copied or distributed; and (3) is not warranted to beaccurate, complete or timely. The Lab and PCS are not responsible for any damages or losses arising from any use of this information. Investment data and Morningstar Proprietary Index data source: ©2021 Morningstar. All Rights Reserved. Index source:Lipper, a Thomson Reuters Company. Copyright 2021 © Thomson Reuters. All rights reserved.
SAMPLE
ABC Model Performance Test As of 03/31/2020
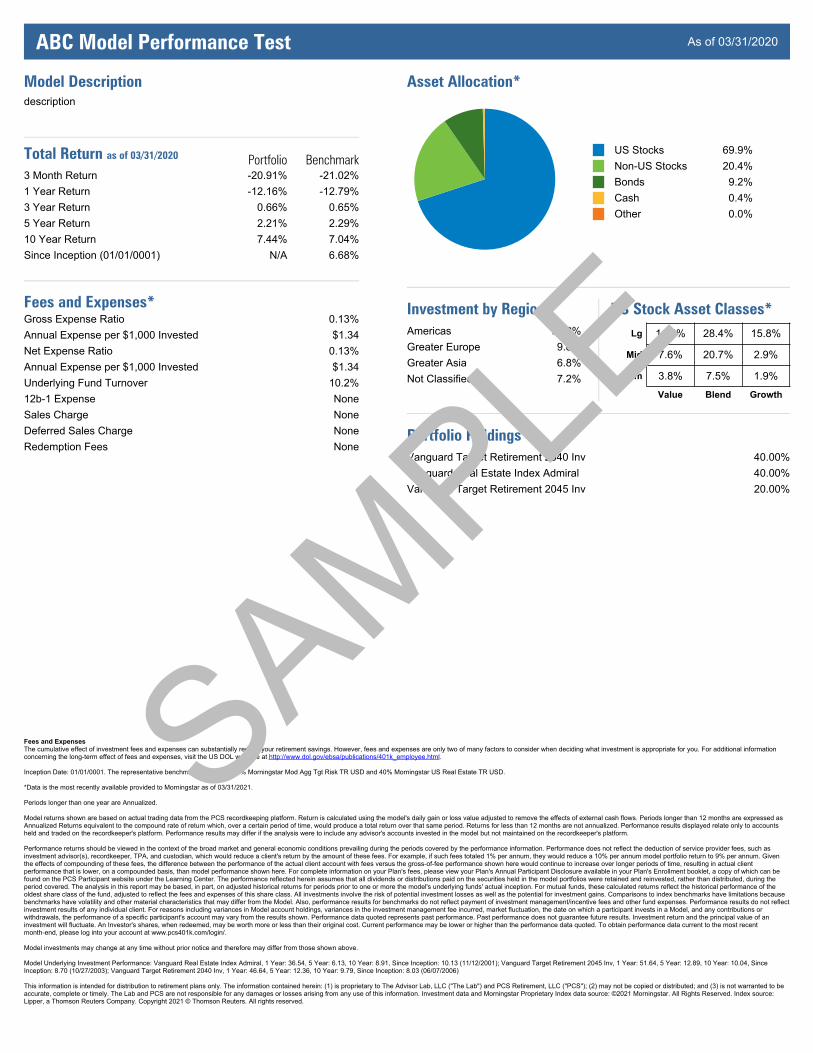
Model Descriptiondescription
Total Return as of 03/31/2020 Portfolio Benchmark3 Month Return 20.91% 21.02%1 Year Return 12.16% 12.79%3 Year Return 0.66% 0.65%5 Year Return 2.21% 2.29%10 Year Return 7.44% 7.04%Since Inception (01/01/0001) N/A 6.68%
Fees and Expenses*Gross Expense Ratio 0.13%Annual Expense per $1,000 Invested $1.34Net Expense Ratio 0.13%Annual Expense per $1,000 Invested $1.34Underlying Fund Turnover 10.2%12b1 Expense NoneSales Charge NoneDeferred Sales Charge NoneRedemption Fees None
Asset Allocation*
US StocksNonUS StocksBondsCashOther
69.9%20.4%9.2%0.4%0.0%
Investment by Region*Americas 76.2%Greater Europe 9.8%Greater Asia 6.8%Not Classified 7.2%
US Stock Asset Classes*Lg 11.6% 28.4% 15.8%
Mid 7.6% 20.7% 2.9%
Sm 3.8% 7.5% 1.9%
Value Blend Growth
Portfolio Holdings*Vanguard Target Retirement 2040 Inv 40.00%Vanguard Real Estate Index Admiral 40.00%Vanguard Target Retirement 2045 Inv 20.00%
Fees and ExpensesThe cumulative effect of investment fees and expenses can substantially reduce your retirement savings. However, fees and expenses are only two of many factors to consider when deciding what investment is appropriate for you. For additional informationconcerning the longterm effect of fees and expenses, visit the US DOL web site at http://www.dol.gov/ebsa/publications/401k_employee.html.
Inception Date: 01/01/0001. The representative benchmark consists of 60% Morningstar Mod Agg Tgt Risk TR USD and 40% Morningstar US Real Estate TR USD.
*Data is the most recently available provided to Morningstar as of 03/31/2021.
Periods longer than one year are Annualized.
Model returns shown are based on actual trading data from the PCS recordkeeping platform. Return is calculated using the model's daily gain or loss value adjusted to remove the effects of external cash flows. Periods longer than 12 months are expressed asAnnualized Returns equivalent to the compound rate of return which, over a certain period of time, would produce a total return over that same period. Returns for less than 12 months are not annualized. Performance results displayed relate only to accountsheld and traded on the recordkeeper's platform. Performance results may differ if the analysis were to include any advisor's accounts invested in the model but not maintained on the recordkeeper's platform.
Performance returns should be viewed in the context of the broad market and general economic conditions prevailing during the periods covered by the performance information. Performance does not reflect the deduction of service provider fees, such asinvestment advisor(s), recordkeeper, TPA, and custodian, which would reduce a client's return by the amount of these fees. For example, if such fees totaled 1% per annum, they would reduce a 10% per annum model portfolio return to 9% per annum. Giventhe effects of compounding of these fees, the difference between the performance of the actual client account with fees versus the grossoffee performance shown here would continue to increase over longer periods of time, resulting in actual clientperformance that is lower, on a compounded basis, than model performance shown here. For complete information on your Plan's fees, please view your Plan's Annual Participant Disclosure available in your Plan's Enrollment booklet, a copy of which can befound on the PCS Participant website under the Learning Center. The performance reflected herein assumes that all dividends or distributions paid on the securities held in the model portfolios were retained and reinvested, rather than distributed, during theperiod covered. The analysis in this report may be based, in part, on adjusted historical returns for periods prior to one or more the model's underlying funds' actual inception. For mutual funds, these calculated returns reflect the historical performance of theoldest share class of the fund, adjusted to reflect the fees and expenses of this share class. All investments involve the risk of potential investment losses as well as the potential for investment gains. Comparisons to index benchmarks have limitations becausebenchmarks have volatility and other material characteristics that may differ from the Model. Also, performance results for benchmarks do not reflect payment of investment management/incentive fees and other fund expenses. Performance results do not reflectinvestment results of any individual client. For reasons including variances in Model account holdings, variances in the investment management fee incurred, market fluctuation, the date on which a participant invests in a Model, and any contributions orwithdrawals, the performance of a specific participant's account may vary from the results shown. Performance data quoted represents past performance. Past performance does not guarantee future results. Investment return and the principal value of aninvestment will fluctuate. An Investor's shares, when redeemed, may be worth more or less than their original cost. Current performance may be lower or higher than the performance data quoted. To obtain performance data current to the most recentmonthend, please log into your account at www.pcs401k.com/login/.
Model investments may change at any time without prior notice and therefore may differ from those shown above.
Model Underlying Investment Performance: Vanguard Real Estate Index Admiral, 1 Year: 36.54, 5 Year: 6.13, 10 Year: 8.91, Since Inception: 10.13 (11/12/2001); Vanguard Target Retirement 2045 Inv, 1 Year: 51.64, 5 Year: 12.89, 10 Year: 10.04, SinceInception: 8.70 (10/27/2003); Vanguard Target Retirement 2040 Inv, 1 Year: 46.64, 5 Year: 12.36, 10 Year: 9.79, Since Inception: 8.03 (06/07/2006)
This information is intended for distribution to retirement plans only. The information contained herein: (1) is proprietary to The Advisor Lab, LLC ("The Lab") and PCS Retirement, LLC ("PCS"); (2) may not be copied or distributed; and (3) is not warranted to beaccurate, complete or timely. The Lab and PCS are not responsible for any damages or losses arising from any use of this information. Investment data and Morningstar Proprietary Index data source: ©2021 Morningstar. All Rights Reserved. Index source:Lipper, a Thomson Reuters Company. Copyright 2021 © Thomson Reuters. All rights reserved.
SAMPLE

Plan Investments: Investment Funds
What can I invest in?The following pages contain information about the individual funds within your Plan. Before investing,consider the investment's objectives, risks, charges and expenses. These funds each have different riskand return characteristics. Please read the information about all of the investment options available to youwithin the plan before you invest.
Questions about the individual funds?Contact the Plan's financial advisor, Jon Advisor of Every Penny Counts at (555) 5555555 [email protected]
SAMPLE
Putnam Dynamic Asset Allocation Bal C Total Return data as of 03/31/2021
Fund OverviewObjectiveCategoryBenchmark IndexTotal AssetsTurnover Ratio
SymbolTypeInception DateFamilyManagerTenureWebsite
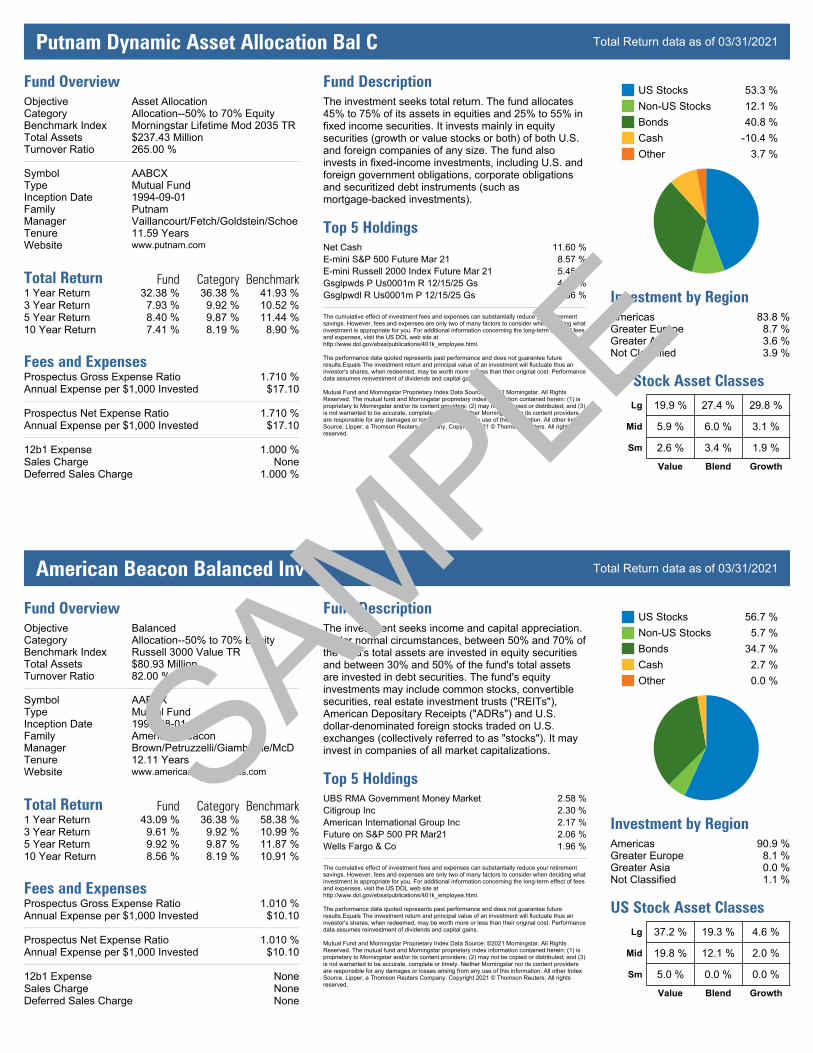
Asset AllocationAllocation50% to 70% EquityMorningstar Lifetime Mod 2035 TR$237.43 Million265.00 %
AABCXMutual Fund19940901PutnamVaillancourt/Fetch/Goldstein/Schoe11.59 Yearswww.putnam.com
Total Return Fund Category Benchmark1 Year Return 32.38 % 36.38 % 41.93 %3 Year Return 7.93 % 9.92 % 10.52 %5 Year Return 8.40 % 9.87 % 11.44 %10 Year Return 7.41 % 8.19 % 8.90 %
Fees and ExpensesProspectus Gross Expense Ratio 1.710 %Annual Expense per $1,000 Invested $17.10
Prospectus Net Expense Ratio 1.710 %Annual Expense per $1,000 Invested $17.10
12b1 Expense 1.000 %Sales Charge NoneDeferred Sales Charge 1.000 %
Fund DescriptionThe investment seeks total return. The fund allocates45% to 75% of its assets in equities and 25% to 55% infixed income securities. It invests mainly in equitysecurities (growth or value stocks or both) of both U.S.and foreign companies of any size. The fund alsoinvests in fixedincome investments, including U.S. andforeign government obligations, corporate obligationsand securitized debt instruments (such asmortgagebacked investments).
Top 5 HoldingsNet Cash 11.60 %Emini S&P 500 Future Mar 21 8.57 %Emini Russell 2000 Index Future Mar 21 5.45 %Gsglpwds P Us0001m R 12/15/25 Gs 4.42 %Gsglpwdl R Us0001m P 12/15/25 Gs 4.36 %
The cumulative effect of investment fees and expenses can substantially reduce your retirementsavings. However, fees and expenses are only two of many factors to consider when deciding whatinvestment is appropriate for you. For additional information concerning the longterm effect of feesand expenses, visit the US DOL web site athttp://www.dol.gov/ebsa/publications/401k_employee.html.
The performance data quoted represents past performance and does not guarantee futureresults.Equals The investment return and principal value of an investment will fluctuate thus aninvestor's shares, when redeemed, may be worth more or less than their original cost. Performancedata assumes reinvestment of dividends and capital gains.
Mutual Fund and Morningstar Proprietary Index Data Source: ©2021 Morningstar. All RightsReserved. The mutual fund and Morningstar proprietary index information contained herein: (1) isproprietary to Morningstar and/or its content providers; (2) may not be copied or distributed; and (3)is not warranted to be accurate, complete or timely. Neither Morningstar nor its content providersare responsible for any damages or losses arising from any use of this information. All other IndexSource, Lipper, a Thomson Reuters Company. Copyright 2021 © Thomson Reuters. All rightsreserved.
US StocksNonUS StocksBondsCashOther
53.3 %12.1 %40.8 %10.4 %3.7 %
Investment by RegionAmericas 83.8 %Greater Europe 8.7 %Greater Asia 3.6 %Not Classified 3.9 %
US Stock Asset ClassesLg 19.9 % 27.4 % 29.8 %
Mid 5.9 % 6.0 % 3.1 %
Sm 2.6 % 3.4 % 1.9 %
Value Blend Growth
American Beacon Balanced Inv Total Return data as of 03/31/2021
Fund OverviewObjectiveCategoryBenchmark IndexTotal AssetsTurnover Ratio
SymbolTypeInception DateFamilyManagerTenureWebsite
BalancedAllocation50% to 70% EquityRussell 3000 Value TR$80.93 Million82.00 %
AABPXMutual Fund19940801American BeaconBrown/Petruzzelli/Giambrone/McD12.11 Yearswww.americanbeaconfunds.com
Total Return Fund Category Benchmark1 Year Return 43.09 % 36.38 % 58.38 %3 Year Return 9.61 % 9.92 % 10.99 %5 Year Return 9.92 % 9.87 % 11.87 %10 Year Return 8.56 % 8.19 % 10.91 %
Fees and ExpensesProspectus Gross Expense Ratio 1.010 %Annual Expense per $1,000 Invested $10.10
Prospectus Net Expense Ratio 1.010 %Annual Expense per $1,000 Invested $10.10
12b1 Expense NoneSales Charge NoneDeferred Sales Charge None
Fund DescriptionThe investment seeks income and capital appreciation.Under normal circumstances, between 50% and 70% ofthe fund's total assets are invested in equity securitiesand between 30% and 50% of the fund's total assetsare invested in debt securities. The fund's equityinvestments may include common stocks, convertiblesecurities, real estate investment trusts ("REITs"),American Depositary Receipts ("ADRs") and U.S.dollardenominated foreign stocks traded on U.S.exchanges (collectively referred to as "stocks"). It mayinvest in companies of all market capitalizations.
Top 5 HoldingsUBS RMA Government Money Market 2.58 %Citigroup Inc 2.30 %American International Group Inc 2.17 %Future on S&P 500 PR Mar21 2.06 %Wells Fargo & Co 1.96 %
The cumulative effect of investment fees and expenses can substantially reduce your retirementsavings. However, fees and expenses are only two of many factors to consider when deciding whatinvestment is appropriate for you. For additional information concerning the longterm effect of feesand expenses, visit the US DOL web site athttp://www.dol.gov/ebsa/publications/401k_employee.html.
The performance data quoted represents past performance and does not guarantee futureresults.Equals The investment return and principal value of an investment will fluctuate thus aninvestor's shares, when redeemed, may be worth more or less than their original cost. Performancedata assumes reinvestment of dividends and capital gains.
Mutual Fund and Morningstar Proprietary Index Data Source: ©2021 Morningstar. All RightsReserved. The mutual fund and Morningstar proprietary index information contained herein: (1) isproprietary to Morningstar and/or its content providers; (2) may not be copied or distributed; and (3)is not warranted to be accurate, complete or timely. Neither Morningstar nor its content providersare responsible for any damages or losses arising from any use of this information. All other IndexSource, Lipper, a Thomson Reuters Company. Copyright 2021 © Thomson Reuters. All rightsreserved.
US StocksNonUS StocksBondsCashOther
56.7 %5.7 %34.7 %2.7 %0.0 %
Investment by RegionAmericas 90.9 %Greater Europe 8.1 %Greater Asia 0.0 %Not Classified 1.1 %
US Stock Asset ClassesLg 37.2 % 19.3 % 4.6 %
Mid 19.8 % 12.1 % 2.0 %
Sm 5.0 % 0.0 % 0.0 %
Value Blend Growth
SAMPLE
Vanguard Pacific Stock Index Admiral Total Return data as of 03/31/2021
Fund OverviewObjectiveCategoryBenchmark IndexTotal AssetsTurnover Ratio
SymbolTypeInception DateFamilyManagerTenureWebsite
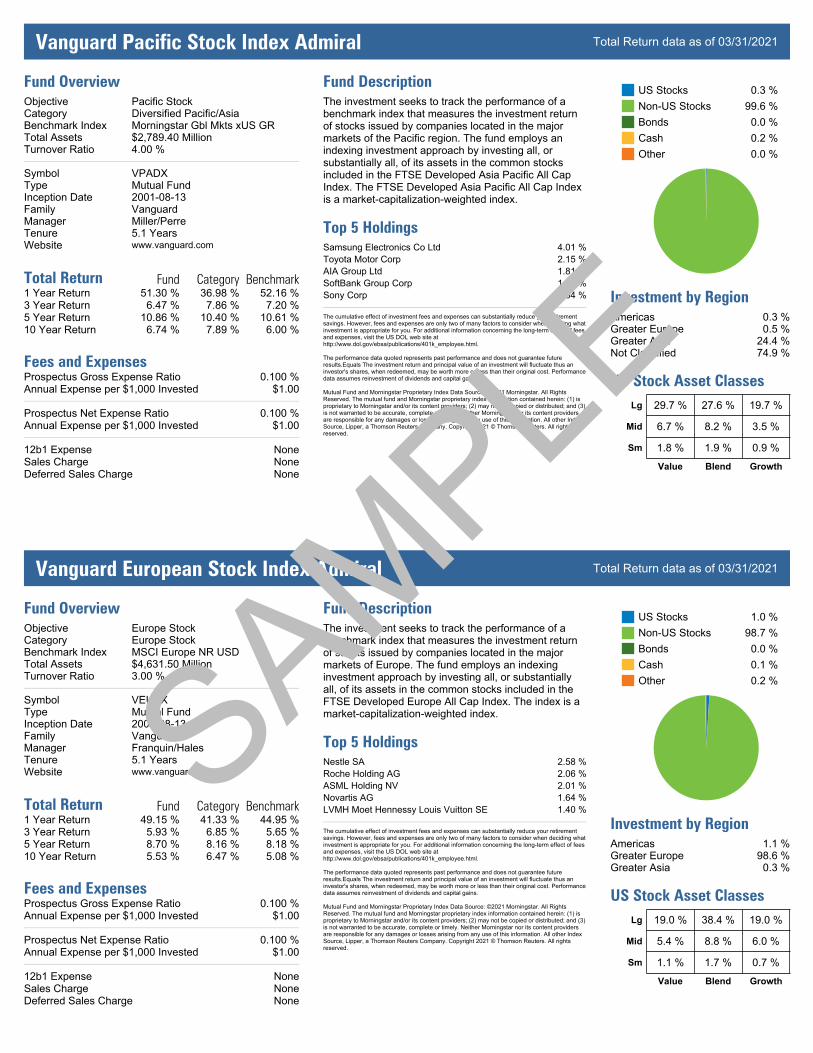
Pacific StockDiversified Pacific/AsiaMorningstar Gbl Mkts xUS GR$2,789.40 Million4.00 %
VPADXMutual Fund20010813VanguardMiller/Perre5.1 Yearswww.vanguard.com
Total Return Fund Category Benchmark1 Year Return 51.30 % 36.98 % 52.16 %3 Year Return 6.47 % 7.86 % 7.20 %5 Year Return 10.86 % 10.40 % 10.61 %10 Year Return 6.74 % 7.89 % 6.00 %
Fees and ExpensesProspectus Gross Expense Ratio 0.100 %Annual Expense per $1,000 Invested $1.00
Prospectus Net Expense Ratio 0.100 %Annual Expense per $1,000 Invested $1.00
12b1 Expense NoneSales Charge NoneDeferred Sales Charge None
Fund DescriptionThe investment seeks to track the performance of abenchmark index that measures the investment returnof stocks issued by companies located in the majormarkets of the Pacific region. The fund employs anindexing investment approach by investing all, orsubstantially all, of its assets in the common stocksincluded in the FTSE Developed Asia Pacific All CapIndex. The FTSE Developed Asia Pacific All Cap Indexis a marketcapitalizationweighted index.
Top 5 HoldingsSamsung Electronics Co Ltd 4.01 %Toyota Motor Corp 2.15 %AIA Group Ltd 1.81 %SoftBank Group Corp 1.61 %Sony Corp 1.54 %
The cumulative effect of investment fees and expenses can substantially reduce your retirementsavings. However, fees and expenses are only two of many factors to consider when deciding whatinvestment is appropriate for you. For additional information concerning the longterm effect of feesand expenses, visit the US DOL web site athttp://www.dol.gov/ebsa/publications/401k_employee.html.
The performance data quoted represents past performance and does not guarantee futureresults.Equals The investment return and principal value of an investment will fluctuate thus aninvestor's shares, when redeemed, may be worth more or less than their original cost. Performancedata assumes reinvestment of dividends and capital gains.
Mutual Fund and Morningstar Proprietary Index Data Source: ©2021 Morningstar. All RightsReserved. The mutual fund and Morningstar proprietary index information contained herein: (1) isproprietary to Morningstar and/or its content providers; (2) may not be copied or distributed; and (3)is not warranted to be accurate, complete or timely. Neither Morningstar nor its content providersare responsible for any damages or losses arising from any use of this information. All other IndexSource, Lipper, a Thomson Reuters Company. Copyright 2021 © Thomson Reuters. All rightsreserved.
US StocksNonUS StocksBondsCashOther
0.3 %99.6 %0.0 %0.2 %0.0 %
Investment by RegionAmericas 0.3 %Greater Europe 0.5 %Greater Asia 24.4 %Not Classified 74.9 %
US Stock Asset ClassesLg 29.7 % 27.6 % 19.7 %
Mid 6.7 % 8.2 % 3.5 %
Sm 1.8 % 1.9 % 0.9 %
Value Blend Growth
Vanguard European Stock Index Admiral Total Return data as of 03/31/2021
Fund OverviewObjectiveCategoryBenchmark IndexTotal AssetsTurnover Ratio
SymbolTypeInception DateFamilyManagerTenureWebsite
Europe StockEurope StockMSCI Europe NR USD$4,631.50 Million3.00 %
VEUSXMutual Fund20010813VanguardFranquin/Hales5.1 Yearswww.vanguard.com
Total Return Fund Category Benchmark1 Year Return 49.15 % 41.33 % 44.95 %3 Year Return 5.93 % 6.85 % 5.65 %5 Year Return 8.70 % 8.16 % 8.18 %10 Year Return 5.53 % 6.47 % 5.08 %
Fees and ExpensesProspectus Gross Expense Ratio 0.100 %Annual Expense per $1,000 Invested $1.00
Prospectus Net Expense Ratio 0.100 %Annual Expense per $1,000 Invested $1.00
12b1 Expense NoneSales Charge NoneDeferred Sales Charge None
Fund DescriptionThe investment seeks to track the performance of abenchmark index that measures the investment returnof stocks issued by companies located in the majormarkets of Europe. The fund employs an indexinginvestment approach by investing all, or substantiallyall, of its assets in the common stocks included in theFTSE Developed Europe All Cap Index. The index is amarketcapitalizationweighted index.
Top 5 HoldingsNestle SA 2.58 %Roche Holding AG 2.06 %ASML Holding NV 2.01 %Novartis AG 1.64 %LVMH Moet Hennessy Louis Vuitton SE 1.40 %
The cumulative effect of investment fees and expenses can substantially reduce your retirementsavings. However, fees and expenses are only two of many factors to consider when deciding whatinvestment is appropriate for you. For additional information concerning the longterm effect of feesand expenses, visit the US DOL web site athttp://www.dol.gov/ebsa/publications/401k_employee.html.
The performance data quoted represents past performance and does not guarantee futureresults.Equals The investment return and principal value of an investment will fluctuate thus aninvestor's shares, when redeemed, may be worth more or less than their original cost. Performancedata assumes reinvestment of dividends and capital gains.
Mutual Fund and Morningstar Proprietary Index Data Source: ©2021 Morningstar. All RightsReserved. The mutual fund and Morningstar proprietary index information contained herein: (1) isproprietary to Morningstar and/or its content providers; (2) may not be copied or distributed; and (3)is not warranted to be accurate, complete or timely. Neither Morningstar nor its content providersare responsible for any damages or losses arising from any use of this information. All other IndexSource, Lipper, a Thomson Reuters Company. Copyright 2021 © Thomson Reuters. All rightsreserved.
US StocksNonUS StocksBondsCashOther
1.0 %98.7 %0.0 %0.1 %0.2 %
Investment by RegionAmericas 1.1 %Greater Europe 98.6 %Greater Asia 0.3 %
US Stock Asset ClassesLg 19.0 % 38.4 % 19.0 %
Mid 5.4 % 8.8 % 6.0 %
Sm 1.1 % 1.7 % 0.7 %
Value Blend Growth
SAMPLE
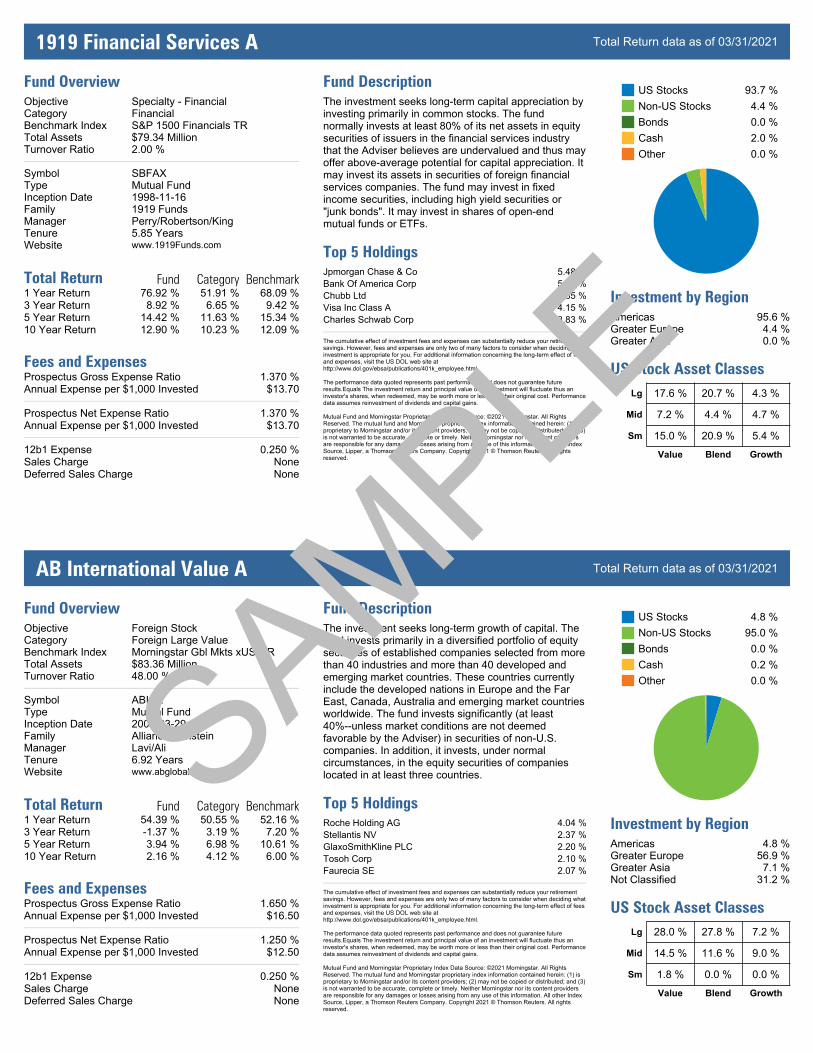
1919 Financial Services A Total Return data as of 03/31/2021
Fund OverviewObjectiveCategoryBenchmark IndexTotal AssetsTurnover Ratio
SymbolTypeInception DateFamilyManagerTenureWebsite
Specialty FinancialFinancialS&P 1500 Financials TR$79.34 Million2.00 %
SBFAXMutual Fund199811161919 FundsPerry/Robertson/King5.85 Yearswww.1919Funds.com
Total Return Fund Category Benchmark1 Year Return 76.92 % 51.91 % 68.09 %3 Year Return 8.92 % 6.65 % 9.42 %5 Year Return 14.42 % 11.63 % 15.34 %10 Year Return 12.90 % 10.23 % 12.09 %
Fees and ExpensesProspectus Gross Expense Ratio 1.370 %Annual Expense per $1,000 Invested $13.70
Prospectus Net Expense Ratio 1.370 %Annual Expense per $1,000 Invested $13.70
12b1 Expense 0.250 %Sales Charge NoneDeferred Sales Charge None
Fund DescriptionThe investment seeks longterm capital appreciation byinvesting primarily in common stocks. The fundnormally invests at least 80% of its net assets in equitysecurities of issuers in the financial services industrythat the Adviser believes are undervalued and thus mayoffer aboveaverage potential for capital appreciation. Itmay invest its assets in securities of foreign financialservices companies. The fund may invest in fixedincome securities, including high yield securities or"junk bonds". It may invest in shares of openendmutual funds or ETFs.
Top 5 HoldingsJpmorgan Chase & Co 5.48 %Bank Of America Corp 5.11 %Chubb Ltd 4.35 %Visa Inc Class A 4.15 %Charles Schwab Corp 3.83 %
The cumulative effect of investment fees and expenses can substantially reduce your retirementsavings. However, fees and expenses are only two of many factors to consider when deciding whatinvestment is appropriate for you. For additional information concerning the longterm effect of feesand expenses, visit the US DOL web site athttp://www.dol.gov/ebsa/publications/401k_employee.html.
The performance data quoted represents past performance and does not guarantee futureresults.Equals The investment return and principal value of an investment will fluctuate thus aninvestor's shares, when redeemed, may be worth more or less than their original cost. Performancedata assumes reinvestment of dividends and capital gains.
Mutual Fund and Morningstar Proprietary Index Data Source: ©2021 Morningstar. All RightsReserved. The mutual fund and Morningstar proprietary index information contained herein: (1) isproprietary to Morningstar and/or its content providers; (2) may not be copied or distributed; and (3)is not warranted to be accurate, complete or timely. Neither Morningstar nor its content providersare responsible for any damages or losses arising from any use of this information. All other IndexSource, Lipper, a Thomson Reuters Company. Copyright 2021 © Thomson Reuters. All rightsreserved.
US StocksNonUS StocksBondsCashOther
93.7 %4.4 %0.0 %2.0 %0.0 %
Investment by RegionAmericas 95.6 %Greater Europe 4.4 %Greater Asia 0.0 %
US Stock Asset ClassesLg 17.6 % 20.7 % 4.3 %
Mid 7.2 % 4.4 % 4.7 %
Sm 15.0 % 20.9 % 5.4 %
Value Blend Growth
AB International Value A Total Return data as of 03/31/2021
Fund OverviewObjectiveCategoryBenchmark IndexTotal AssetsTurnover Ratio
SymbolTypeInception DateFamilyManagerTenureWebsite
Foreign StockForeign Large ValueMorningstar Gbl Mkts xUS GR$83.36 Million48.00 %
ABIAXMutual Fund20010329AllianceBernsteinLavi/Ali6.92 Yearswww.abglobal.com
Total Return Fund Category Benchmark1 Year Return 54.39 % 50.55 % 52.16 %3 Year Return 1.37 % 3.19 % 7.20 %5 Year Return 3.94 % 6.98 % 10.61 %10 Year Return 2.16 % 4.12 % 6.00 %
Fees and ExpensesProspectus Gross Expense Ratio 1.650 %Annual Expense per $1,000 Invested $16.50
Prospectus Net Expense Ratio 1.250 %Annual Expense per $1,000 Invested $12.50
12b1 Expense 0.250 %Sales Charge NoneDeferred Sales Charge None
Fund DescriptionThe investment seeks longterm growth of capital. Thefund invests primarily in a diversified portfolio of equitysecurities of established companies selected from morethan 40 industries and more than 40 developed andemerging market countries. These countries currentlyinclude the developed nations in Europe and the FarEast, Canada, Australia and emerging market countriesworldwide. The fund invests significantly (at least40%unless market conditions are not deemedfavorable by the Adviser) in securities of nonU.S.companies. In addition, it invests, under normalcircumstances, in the equity securities of companieslocated in at least three countries.
Top 5 HoldingsRoche Holding AG 4.04 %Stellantis NV 2.37 %GlaxoSmithKline PLC 2.20 %Tosoh Corp 2.10 %Faurecia SE 2.07 %
The cumulative effect of investment fees and expenses can substantially reduce your retirementsavings. However, fees and expenses are only two of many factors to consider when deciding whatinvestment is appropriate for you. For additional information concerning the longterm effect of feesand expenses, visit the US DOL web site athttp://www.dol.gov/ebsa/publications/401k_employee.html.
The performance data quoted represents past performance and does not guarantee futureresults.Equals The investment return and principal value of an investment will fluctuate thus aninvestor's shares, when redeemed, may be worth more or less than their original cost. Performancedata assumes reinvestment of dividends and capital gains.
Mutual Fund and Morningstar Proprietary Index Data Source: ©2021 Morningstar. All RightsReserved. The mutual fund and Morningstar proprietary index information contained herein: (1) isproprietary to Morningstar and/or its content providers; (2) may not be copied or distributed; and (3)is not warranted to be accurate, complete or timely. Neither Morningstar nor its content providersare responsible for any damages or losses arising from any use of this information. All other IndexSource, Lipper, a Thomson Reuters Company. Copyright 2021 © Thomson Reuters. All rightsreserved.
US StocksNonUS StocksBondsCashOther
4.8 %95.0 %0.0 %0.2 %0.0 %
Investment by RegionAmericas 4.8 %Greater Europe 56.9 %Greater Asia 7.1 %Not Classified 31.2 %
US Stock Asset ClassesLg 28.0 % 27.8 % 7.2 %
Mid 14.5 % 11.6 % 9.0 %
Sm 1.8 % 0.0 % 0.0 %
Value Blend Growth
SAMPLE
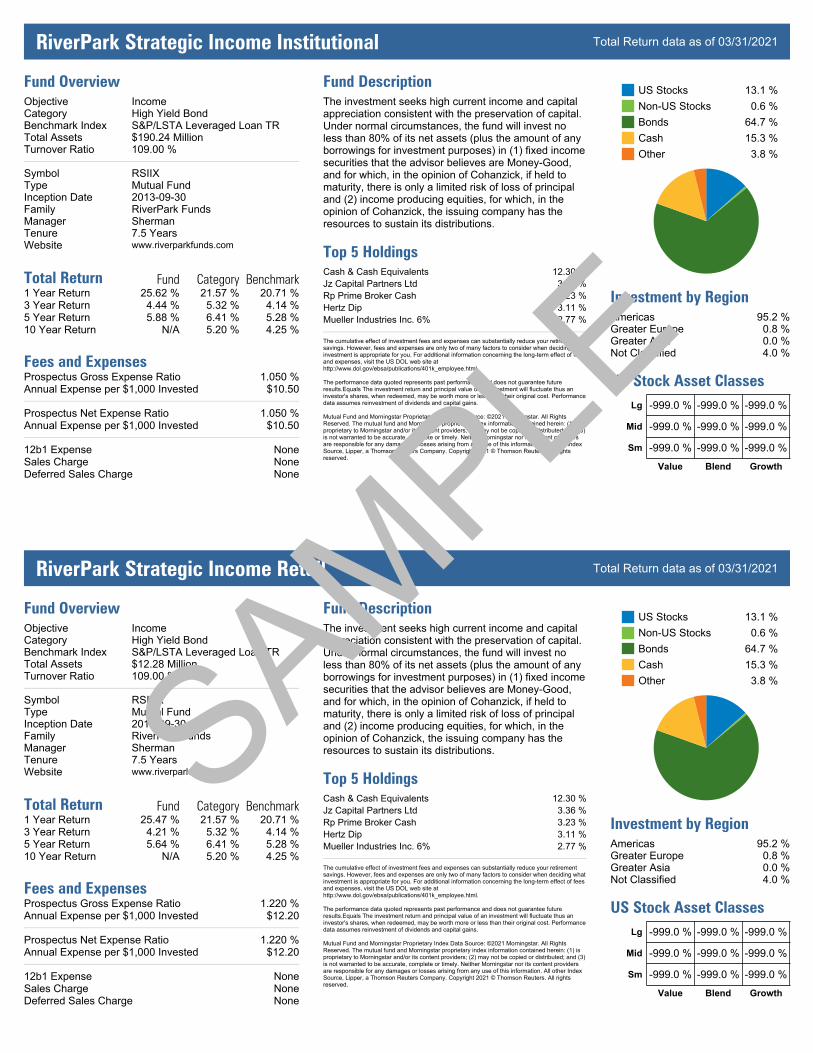
RiverPark Strategic Income Institutional Total Return data as of 03/31/2021
Fund OverviewObjectiveCategoryBenchmark IndexTotal AssetsTurnover Ratio
SymbolTypeInception DateFamilyManagerTenureWebsite
IncomeHigh Yield BondS&P/LSTA Leveraged Loan TR$190.24 Million109.00 %
RSIIXMutual Fund20130930RiverPark FundsSherman7.5 Yearswww.riverparkfunds.com
Total Return Fund Category Benchmark1 Year Return 25.62 % 21.57 % 20.71 %3 Year Return 4.44 % 5.32 % 4.14 %5 Year Return 5.88 % 6.41 % 5.28 %10 Year Return N/A 5.20 % 4.25 %
Fees and ExpensesProspectus Gross Expense Ratio 1.050 %Annual Expense per $1,000 Invested $10.50
Prospectus Net Expense Ratio 1.050 %Annual Expense per $1,000 Invested $10.50
12b1 Expense NoneSales Charge NoneDeferred Sales Charge None
Fund DescriptionThe investment seeks high current income and capitalappreciation consistent with the preservation of capital.Under normal circumstances, the fund will invest noless than 80% of its net assets (plus the amount of anyborrowings for investment purposes) in (1) fixed incomesecurities that the advisor believes are MoneyGood,and for which, in the opinion of Cohanzick, if held tomaturity, there is only a limited risk of loss of principaland (2) income producing equities, for which, in theopinion of Cohanzick, the issuing company has theresources to sustain its distributions.
Top 5 HoldingsCash & Cash Equivalents 12.30 %Jz Capital Partners Ltd 3.36 %Rp Prime Broker Cash 3.23 %Hertz Dip 3.11 %Mueller Industries Inc. 6% 2.77 %
The cumulative effect of investment fees and expenses can substantially reduce your retirementsavings. However, fees and expenses are only two of many factors to consider when deciding whatinvestment is appropriate for you. For additional information concerning the longterm effect of feesand expenses, visit the US DOL web site athttp://www.dol.gov/ebsa/publications/401k_employee.html.
The performance data quoted represents past performance and does not guarantee futureresults.Equals The investment return and principal value of an investment will fluctuate thus aninvestor's shares, when redeemed, may be worth more or less than their original cost. Performancedata assumes reinvestment of dividends and capital gains.
Mutual Fund and Morningstar Proprietary Index Data Source: ©2021 Morningstar. All RightsReserved. The mutual fund and Morningstar proprietary index information contained herein: (1) isproprietary to Morningstar and/or its content providers; (2) may not be copied or distributed; and (3)is not warranted to be accurate, complete or timely. Neither Morningstar nor its content providersare responsible for any damages or losses arising from any use of this information. All other IndexSource, Lipper, a Thomson Reuters Company. Copyright 2021 © Thomson Reuters. All rightsreserved.
US StocksNonUS StocksBondsCashOther
13.1 %0.6 %64.7 %15.3 %3.8 %
Investment by RegionAmericas 95.2 %Greater Europe 0.8 %Greater Asia 0.0 %Not Classified 4.0 %
US Stock Asset ClassesLg 999.0 % 999.0 % 999.0 %
Mid 999.0 % 999.0 % 999.0 %
Sm 999.0 % 999.0 % 999.0 %
Value Blend Growth
RiverPark Strategic Income Retail Total Return data as of 03/31/2021
Fund OverviewObjectiveCategoryBenchmark IndexTotal AssetsTurnover Ratio
SymbolTypeInception DateFamilyManagerTenureWebsite
IncomeHigh Yield BondS&P/LSTA Leveraged Loan TR$12.28 Million109.00 %
RSIVXMutual Fund20130930RiverPark FundsSherman7.5 Yearswww.riverparkfunds.com
Total Return Fund Category Benchmark1 Year Return 25.47 % 21.57 % 20.71 %3 Year Return 4.21 % 5.32 % 4.14 %5 Year Return 5.64 % 6.41 % 5.28 %10 Year Return N/A 5.20 % 4.25 %
Fees and ExpensesProspectus Gross Expense Ratio 1.220 %Annual Expense per $1,000 Invested $12.20
Prospectus Net Expense Ratio 1.220 %Annual Expense per $1,000 Invested $12.20
12b1 Expense NoneSales Charge NoneDeferred Sales Charge None
Fund DescriptionThe investment seeks high current income and capitalappreciation consistent with the preservation of capital.Under normal circumstances, the fund will invest noless than 80% of its net assets (plus the amount of anyborrowings for investment purposes) in (1) fixed incomesecurities that the advisor believes are MoneyGood,and for which, in the opinion of Cohanzick, if held tomaturity, there is only a limited risk of loss of principaland (2) income producing equities, for which, in theopinion of Cohanzick, the issuing company has theresources to sustain its distributions.
Top 5 HoldingsCash & Cash Equivalents 12.30 %Jz Capital Partners Ltd 3.36 %Rp Prime Broker Cash 3.23 %Hertz Dip 3.11 %Mueller Industries Inc. 6% 2.77 %
The cumulative effect of investment fees and expenses can substantially reduce your retirementsavings. However, fees and expenses are only two of many factors to consider when deciding whatinvestment is appropriate for you. For additional information concerning the longterm effect of feesand expenses, visit the US DOL web site athttp://www.dol.gov/ebsa/publications/401k_employee.html.
The performance data quoted represents past performance and does not guarantee futureresults.Equals The investment return and principal value of an investment will fluctuate thus aninvestor's shares, when redeemed, may be worth more or less than their original cost. Performancedata assumes reinvestment of dividends and capital gains.
Mutual Fund and Morningstar Proprietary Index Data Source: ©2021 Morningstar. All RightsReserved. The mutual fund and Morningstar proprietary index information contained herein: (1) isproprietary to Morningstar and/or its content providers; (2) may not be copied or distributed; and (3)is not warranted to be accurate, complete or timely. Neither Morningstar nor its content providersare responsible for any damages or losses arising from any use of this information. All other IndexSource, Lipper, a Thomson Reuters Company. Copyright 2021 © Thomson Reuters. All rightsreserved.
US StocksNonUS StocksBondsCashOther
13.1 %0.6 %64.7 %15.3 %3.8 %
Investment by RegionAmericas 95.2 %Greater Europe 0.8 %Greater Asia 0.0 %Not Classified 4.0 %
US Stock Asset ClassesLg 999.0 % 999.0 % 999.0 %
Mid 999.0 % 999.0 % 999.0 %
Sm 999.0 % 999.0 % 999.0 %
Value Blend Growth
SAMPLE
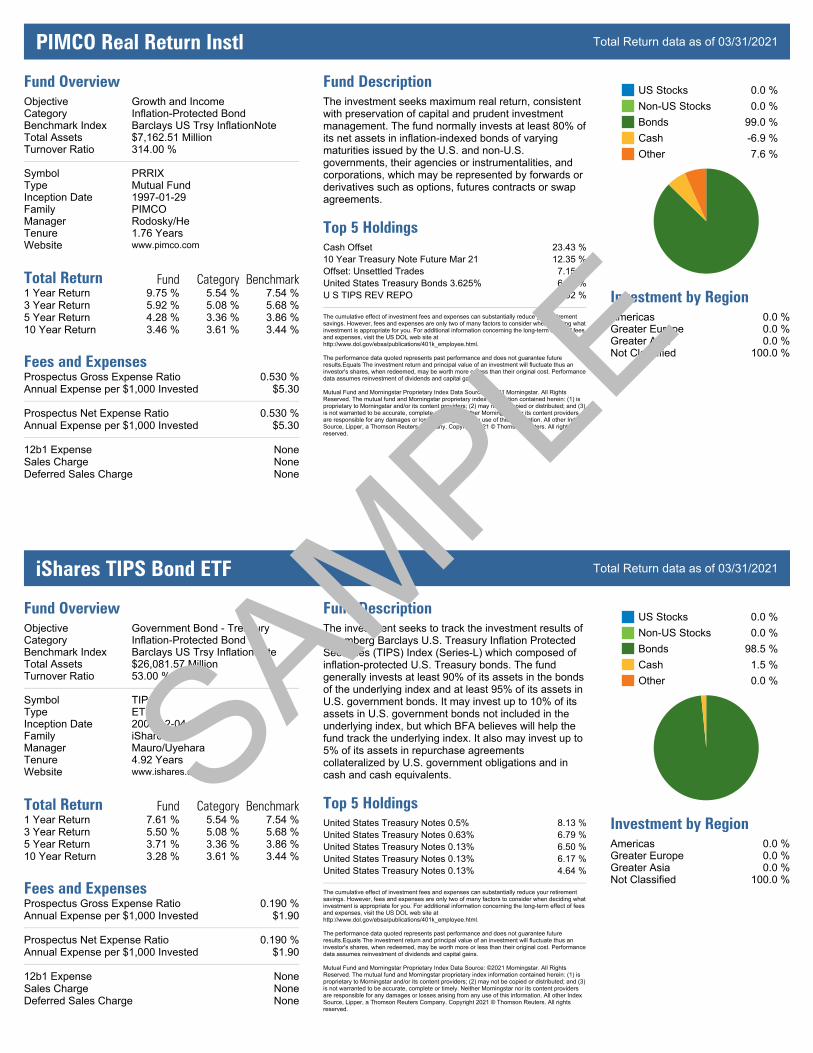
PIMCO Real Return Instl Total Return data as of 03/31/2021
Fund OverviewObjectiveCategoryBenchmark IndexTotal AssetsTurnover Ratio
SymbolTypeInception DateFamilyManagerTenureWebsite
Growth and IncomeInflationProtected BondBarclays US Trsy InflationNote$7,162.51 Million314.00 %
PRRIXMutual Fund19970129PIMCORodosky/He1.76 Yearswww.pimco.com
Total Return Fund Category Benchmark1 Year Return 9.75 % 5.54 % 7.54 %3 Year Return 5.92 % 5.08 % 5.68 %5 Year Return 4.28 % 3.36 % 3.86 %10 Year Return 3.46 % 3.61 % 3.44 %
Fees and ExpensesProspectus Gross Expense Ratio 0.530 %Annual Expense per $1,000 Invested $5.30
Prospectus Net Expense Ratio 0.530 %Annual Expense per $1,000 Invested $5.30
12b1 Expense NoneSales Charge NoneDeferred Sales Charge None
Fund DescriptionThe investment seeks maximum real return, consistentwith preservation of capital and prudent investmentmanagement. The fund normally invests at least 80% ofits net assets in inflationindexed bonds of varyingmaturities issued by the U.S. and nonU.S.governments, their agencies or instrumentalities, andcorporations, which may be represented by forwards orderivatives such as options, futures contracts or swapagreements.
Top 5 HoldingsCash Offset 23.43 %10 Year Treasury Note Future Mar 21 12.35 %Offset: Unsettled Trades 7.15 %United States Treasury Bonds 3.625% 6.94 %U S TIPS REV REPO 6.92 %
The cumulative effect of investment fees and expenses can substantially reduce your retirementsavings. However, fees and expenses are only two of many factors to consider when deciding whatinvestment is appropriate for you. For additional information concerning the longterm effect of feesand expenses, visit the US DOL web site athttp://www.dol.gov/ebsa/publications/401k_employee.html.
The performance data quoted represents past performance and does not guarantee futureresults.Equals The investment return and principal value of an investment will fluctuate thus aninvestor's shares, when redeemed, may be worth more or less than their original cost. Performancedata assumes reinvestment of dividends and capital gains.
Mutual Fund and Morningstar Proprietary Index Data Source: ©2021 Morningstar. All RightsReserved. The mutual fund and Morningstar proprietary index information contained herein: (1) isproprietary to Morningstar and/or its content providers; (2) may not be copied or distributed; and (3)is not warranted to be accurate, complete or timely. Neither Morningstar nor its content providersare responsible for any damages or losses arising from any use of this information. All other IndexSource, Lipper, a Thomson Reuters Company. Copyright 2021 © Thomson Reuters. All rightsreserved.
US StocksNonUS StocksBondsCashOther
0.0 %0.0 %99.0 %6.9 %7.6 %
Investment by RegionAmericas 0.0 %Greater Europe 0.0 %Greater Asia 0.0 %Not Classified 100.0 %
iShares TIPS Bond ETF Total Return data as of 03/31/2021
Fund OverviewObjectiveCategoryBenchmark IndexTotal AssetsTurnover Ratio
SymbolTypeInception DateFamilyManagerTenureWebsite
Government Bond TreasuryInflationProtected BondBarclays US Trsy InflationNote$26,081.57 Million53.00 %
TIPETF20031204iSharesMauro/Uyehara4.92 Yearswww.ishares.com
Total Return Fund Category Benchmark1 Year Return 7.61 % 5.54 % 7.54 %3 Year Return 5.50 % 5.08 % 5.68 %5 Year Return 3.71 % 3.36 % 3.86 %10 Year Return 3.28 % 3.61 % 3.44 %
Fees and ExpensesProspectus Gross Expense Ratio 0.190 %Annual Expense per $1,000 Invested $1.90
Prospectus Net Expense Ratio 0.190 %Annual Expense per $1,000 Invested $1.90
12b1 Expense NoneSales Charge NoneDeferred Sales Charge None
Fund DescriptionThe investment seeks to track the investment results ofBloomberg Barclays U.S. Treasury Inflation ProtectedSecurities (TIPS) Index (SeriesL) which composed ofinflationprotected U.S. Treasury bonds. The fundgenerally invests at least 90% of its assets in the bondsof the underlying index and at least 95% of its assets inU.S. government bonds. It may invest up to 10% of itsassets in U.S. government bonds not included in theunderlying index, but which BFA believes will help thefund track the underlying index. It also may invest up to5% of its assets in repurchase agreementscollateralized by U.S. government obligations and incash and cash equivalents.
Top 5 HoldingsUnited States Treasury Notes 0.5% 8.13 %United States Treasury Notes 0.63% 6.79 %United States Treasury Notes 0.13% 6.50 %United States Treasury Notes 0.13% 6.17 %United States Treasury Notes 0.13% 4.64 %
The cumulative effect of investment fees and expenses can substantially reduce your retirementsavings. However, fees and expenses are only two of many factors to consider when deciding whatinvestment is appropriate for you. For additional information concerning the longterm effect of feesand expenses, visit the US DOL web site athttp://www.dol.gov/ebsa/publications/401k_employee.html.
The performance data quoted represents past performance and does not guarantee futureresults.Equals The investment return and principal value of an investment will fluctuate thus aninvestor's shares, when redeemed, may be worth more or less than their original cost. Performancedata assumes reinvestment of dividends and capital gains.
Mutual Fund and Morningstar Proprietary Index Data Source: ©2021 Morningstar. All RightsReserved. The mutual fund and Morningstar proprietary index information contained herein: (1) isproprietary to Morningstar and/or its content providers; (2) may not be copied or distributed; and (3)is not warranted to be accurate, complete or timely. Neither Morningstar nor its content providersare responsible for any damages or losses arising from any use of this information. All other IndexSource, Lipper, a Thomson Reuters Company. Copyright 2021 © Thomson Reuters. All rightsreserved.
US StocksNonUS StocksBondsCashOther
0.0 %0.0 %98.5 %1.5 %0.0 %
Investment by RegionAmericas 0.0 %Greater Europe 0.0 %Greater Asia 0.0 %Not Classified 100.0 %
SAMPLE
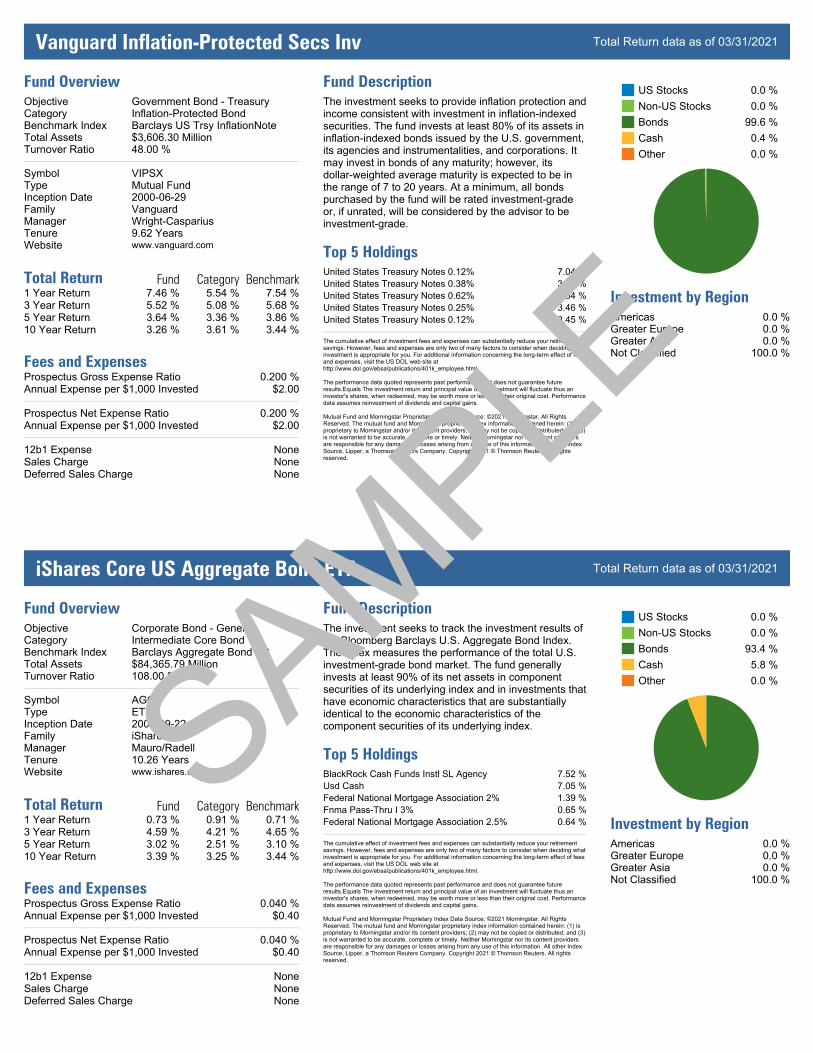
Vanguard Inflation-Protected Secs Inv Total Return data as of 03/31/2021
Fund OverviewObjectiveCategoryBenchmark IndexTotal AssetsTurnover Ratio
SymbolTypeInception DateFamilyManagerTenureWebsite
Government Bond TreasuryInflationProtected BondBarclays US Trsy InflationNote$3,606.30 Million48.00 %
VIPSXMutual Fund20000629VanguardWrightCasparius9.62 Yearswww.vanguard.com
Total Return Fund Category Benchmark1 Year Return 7.46 % 5.54 % 7.54 %3 Year Return 5.52 % 5.08 % 5.68 %5 Year Return 3.64 % 3.36 % 3.86 %10 Year Return 3.26 % 3.61 % 3.44 %
Fees and ExpensesProspectus Gross Expense Ratio 0.200 %Annual Expense per $1,000 Invested $2.00
Prospectus Net Expense Ratio 0.200 %Annual Expense per $1,000 Invested $2.00
12b1 Expense NoneSales Charge NoneDeferred Sales Charge None
Fund DescriptionThe investment seeks to provide inflation protection andincome consistent with investment in inflationindexedsecurities. The fund invests at least 80% of its assets ininflationindexed bonds issued by the U.S. government,its agencies and instrumentalities, and corporations. Itmay invest in bonds of any maturity; however, itsdollarweighted average maturity is expected to be inthe range of 7 to 20 years. At a minimum, all bondspurchased by the fund will be rated investmentgradeor, if unrated, will be considered by the advisor to beinvestmentgrade.
Top 5 HoldingsUnited States Treasury Notes 0.12% 7.04 %United States Treasury Notes 0.38% 3.61 %United States Treasury Notes 0.62% 3.54 %United States Treasury Notes 0.25% 3.46 %United States Treasury Notes 0.12% 3.45 %
The cumulative effect of investment fees and expenses can substantially reduce your retirementsavings. However, fees and expenses are only two of many factors to consider when deciding whatinvestment is appropriate for you. For additional information concerning the longterm effect of feesand expenses, visit the US DOL web site athttp://www.dol.gov/ebsa/publications/401k_employee.html.
The performance data quoted represents past performance and does not guarantee futureresults.Equals The investment return and principal value of an investment will fluctuate thus aninvestor's shares, when redeemed, may be worth more or less than their original cost. Performancedata assumes reinvestment of dividends and capital gains.
Mutual Fund and Morningstar Proprietary Index Data Source: ©2021 Morningstar. All RightsReserved. The mutual fund and Morningstar proprietary index information contained herein: (1) isproprietary to Morningstar and/or its content providers; (2) may not be copied or distributed; and (3)is not warranted to be accurate, complete or timely. Neither Morningstar nor its content providersare responsible for any damages or losses arising from any use of this information. All other IndexSource, Lipper, a Thomson Reuters Company. Copyright 2021 © Thomson Reuters. All rightsreserved.
US StocksNonUS StocksBondsCashOther
0.0 %0.0 %99.6 %0.4 %0.0 %
Investment by RegionAmericas 0.0 %Greater Europe 0.0 %Greater Asia 0.0 %Not Classified 100.0 %
iShares Core US Aggregate Bond ETF Total Return data as of 03/31/2021
Fund OverviewObjectiveCategoryBenchmark IndexTotal AssetsTurnover Ratio
SymbolTypeInception DateFamilyManagerTenureWebsite
Corporate Bond GeneralIntermediate Core BondBarclays Aggregate Bond TR$84,365.79 Million108.00 %
AGGETF20030922iSharesMauro/Radell10.26 Yearswww.ishares.com
Total Return Fund Category Benchmark1 Year Return 0.73 % 0.91 % 0.71 %3 Year Return 4.59 % 4.21 % 4.65 %5 Year Return 3.02 % 2.51 % 3.10 %10 Year Return 3.39 % 3.25 % 3.44 %
Fees and ExpensesProspectus Gross Expense Ratio 0.040 %Annual Expense per $1,000 Invested $0.40
Prospectus Net Expense Ratio 0.040 %Annual Expense per $1,000 Invested $0.40
12b1 Expense NoneSales Charge NoneDeferred Sales Charge None
Fund DescriptionThe investment seeks to track the investment results ofthe Bloomberg Barclays U.S. Aggregate Bond Index.The index measures the performance of the total U.S.investmentgrade bond market. The fund generallyinvests at least 90% of its net assets in componentsecurities of its underlying index and in investments thathave economic characteristics that are substantiallyidentical to the economic characteristics of thecomponent securities of its underlying index.
Top 5 HoldingsBlackRock Cash Funds Instl SL Agency 7.52 %Usd Cash 7.05 %Federal National Mortgage Association 2% 1.39 %Fnma PassThru I 3% 0.65 %Federal National Mortgage Association 2.5% 0.64 %
The cumulative effect of investment fees and expenses can substantially reduce your retirementsavings. However, fees and expenses are only two of many factors to consider when deciding whatinvestment is appropriate for you. For additional information concerning the longterm effect of feesand expenses, visit the US DOL web site athttp://www.dol.gov/ebsa/publications/401k_employee.html.
The performance data quoted represents past performance and does not guarantee futureresults.Equals The investment return and principal value of an investment will fluctuate thus aninvestor's shares, when redeemed, may be worth more or less than their original cost. Performancedata assumes reinvestment of dividends and capital gains.
Mutual Fund and Morningstar Proprietary Index Data Source: ©2021 Morningstar. All RightsReserved. The mutual fund and Morningstar proprietary index information contained herein: (1) isproprietary to Morningstar and/or its content providers; (2) may not be copied or distributed; and (3)is not warranted to be accurate, complete or timely. Neither Morningstar nor its content providersare responsible for any damages or losses arising from any use of this information. All other IndexSource, Lipper, a Thomson Reuters Company. Copyright 2021 © Thomson Reuters. All rightsreserved.
US StocksNonUS StocksBondsCashOther
0.0 %0.0 %93.4 %5.8 %0.0 %
Investment by RegionAmericas 0.0 %Greater Europe 0.0 %Greater Asia 0.0 %Not Classified 100.0 %
SAMPLE
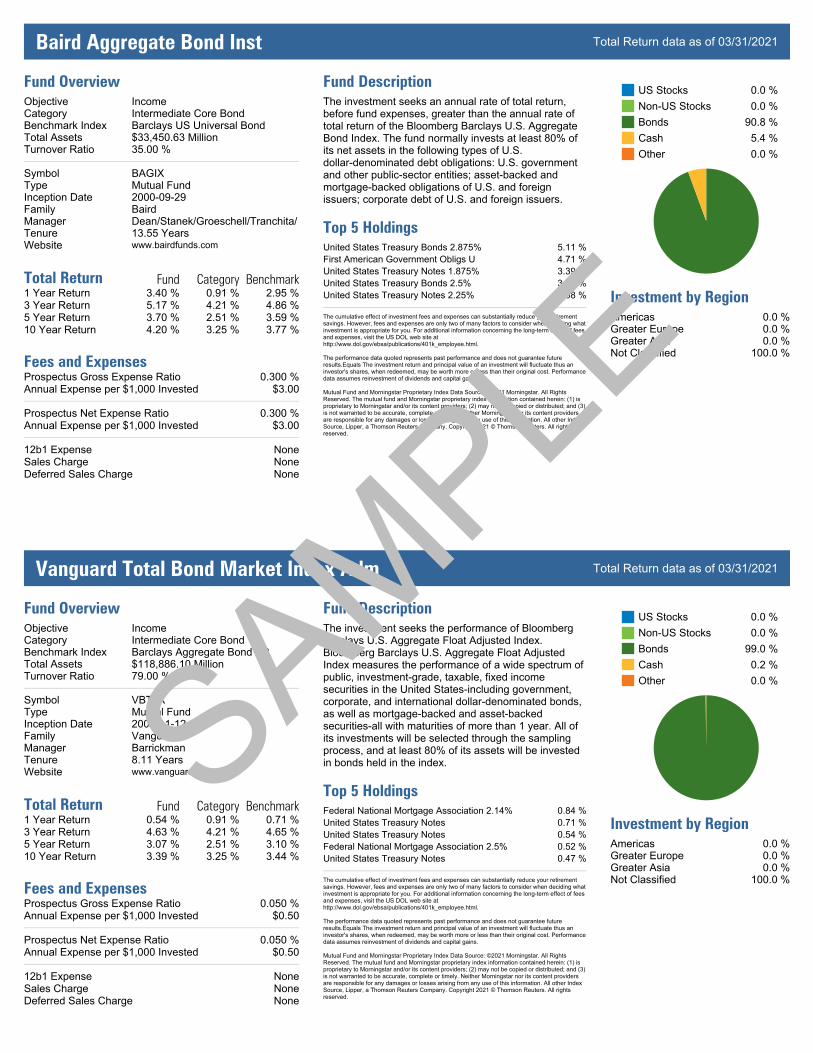
Baird Aggregate Bond Inst Total Return data as of 03/31/2021
Fund OverviewObjectiveCategoryBenchmark IndexTotal AssetsTurnover Ratio
SymbolTypeInception DateFamilyManagerTenureWebsite
IncomeIntermediate Core BondBarclays US Universal Bond$33,450.63 Million35.00 %
BAGIXMutual Fund20000929BairdDean/Stanek/Groeschell/Tranchita/13.55 Yearswww.bairdfunds.com
Total Return Fund Category Benchmark1 Year Return 3.40 % 0.91 % 2.95 %3 Year Return 5.17 % 4.21 % 4.86 %5 Year Return 3.70 % 2.51 % 3.59 %10 Year Return 4.20 % 3.25 % 3.77 %
Fees and ExpensesProspectus Gross Expense Ratio 0.300 %Annual Expense per $1,000 Invested $3.00
Prospectus Net Expense Ratio 0.300 %Annual Expense per $1,000 Invested $3.00
12b1 Expense NoneSales Charge NoneDeferred Sales Charge None
Fund DescriptionThe investment seeks an annual rate of total return,before fund expenses, greater than the annual rate oftotal return of the Bloomberg Barclays U.S. AggregateBond Index. The fund normally invests at least 80% ofits net assets in the following types of U.S.dollardenominated debt obligations: U.S. governmentand other publicsector entities; assetbacked andmortgagebacked obligations of U.S. and foreignissuers; corporate debt of U.S. and foreign issuers.
Top 5 HoldingsUnited States Treasury Bonds 2.875% 5.11 %First American Government Obligs U 4.71 %United States Treasury Notes 1.875% 3.39 %United States Treasury Bonds 2.5% 3.26 %United States Treasury Notes 2.25% 2.08 %
The cumulative effect of investment fees and expenses can substantially reduce your retirementsavings. However, fees and expenses are only two of many factors to consider when deciding whatinvestment is appropriate for you. For additional information concerning the longterm effect of feesand expenses, visit the US DOL web site athttp://www.dol.gov/ebsa/publications/401k_employee.html.
The performance data quoted represents past performance and does not guarantee futureresults.Equals The investment return and principal value of an investment will fluctuate thus aninvestor's shares, when redeemed, may be worth more or less than their original cost. Performancedata assumes reinvestment of dividends and capital gains.
Mutual Fund and Morningstar Proprietary Index Data Source: ©2021 Morningstar. All RightsReserved. The mutual fund and Morningstar proprietary index information contained herein: (1) isproprietary to Morningstar and/or its content providers; (2) may not be copied or distributed; and (3)is not warranted to be accurate, complete or timely. Neither Morningstar nor its content providersare responsible for any damages or losses arising from any use of this information. All other IndexSource, Lipper, a Thomson Reuters Company. Copyright 2021 © Thomson Reuters. All rightsreserved.
US StocksNonUS StocksBondsCashOther
0.0 %0.0 %90.8 %5.4 %0.0 %
Investment by RegionAmericas 0.0 %Greater Europe 0.0 %Greater Asia 0.0 %Not Classified 100.0 %
Vanguard Total Bond Market Index Adm Total Return data as of 03/31/2021
Fund OverviewObjectiveCategoryBenchmark IndexTotal AssetsTurnover Ratio
SymbolTypeInception DateFamilyManagerTenureWebsite
IncomeIntermediate Core BondBarclays Aggregate Bond TR$118,886.10 Million79.00 %
VBTLXMutual Fund20011112VanguardBarrickman8.11 Yearswww.vanguard.com
Total Return Fund Category Benchmark1 Year Return 0.54 % 0.91 % 0.71 %3 Year Return 4.63 % 4.21 % 4.65 %5 Year Return 3.07 % 2.51 % 3.10 %10 Year Return 3.39 % 3.25 % 3.44 %
Fees and ExpensesProspectus Gross Expense Ratio 0.050 %Annual Expense per $1,000 Invested $0.50
Prospectus Net Expense Ratio 0.050 %Annual Expense per $1,000 Invested $0.50
12b1 Expense NoneSales Charge NoneDeferred Sales Charge None
Fund DescriptionThe investment seeks the performance of BloombergBarclays U.S. Aggregate Float Adjusted Index.Bloomberg Barclays U.S. Aggregate Float AdjustedIndex measures the performance of a wide spectrum ofpublic, investmentgrade, taxable, fixed incomesecurities in the United Statesincluding government,corporate, and international dollardenominated bonds,as well as mortgagebacked and assetbackedsecuritiesall with maturities of more than 1 year. All ofits investments will be selected through the samplingprocess, and at least 80% of its assets will be investedin bonds held in the index.
Top 5 HoldingsFederal National Mortgage Association 2.14% 0.84 %United States Treasury Notes 0.71 %United States Treasury Notes 0.54 %Federal National Mortgage Association 2.5% 0.52 %United States Treasury Notes 0.47 %
The cumulative effect of investment fees and expenses can substantially reduce your retirementsavings. However, fees and expenses are only two of many factors to consider when deciding whatinvestment is appropriate for you. For additional information concerning the longterm effect of feesand expenses, visit the US DOL web site athttp://www.dol.gov/ebsa/publications/401k_employee.html.
The performance data quoted represents past performance and does not guarantee futureresults.Equals The investment return and principal value of an investment will fluctuate thus aninvestor's shares, when redeemed, may be worth more or less than their original cost. Performancedata assumes reinvestment of dividends and capital gains.
Mutual Fund and Morningstar Proprietary Index Data Source: ©2021 Morningstar. All RightsReserved. The mutual fund and Morningstar proprietary index information contained herein: (1) isproprietary to Morningstar and/or its content providers; (2) may not be copied or distributed; and (3)is not warranted to be accurate, complete or timely. Neither Morningstar nor its content providersare responsible for any damages or losses arising from any use of this information. All other IndexSource, Lipper, a Thomson Reuters Company. Copyright 2021 © Thomson Reuters. All rightsreserved.
US StocksNonUS StocksBondsCashOther
0.0 %0.0 %99.0 %0.2 %0.0 %
Investment by RegionAmericas 0.0 %Greater Europe 0.0 %Greater Asia 0.0 %Not Classified 100.0 %
SAMPLE
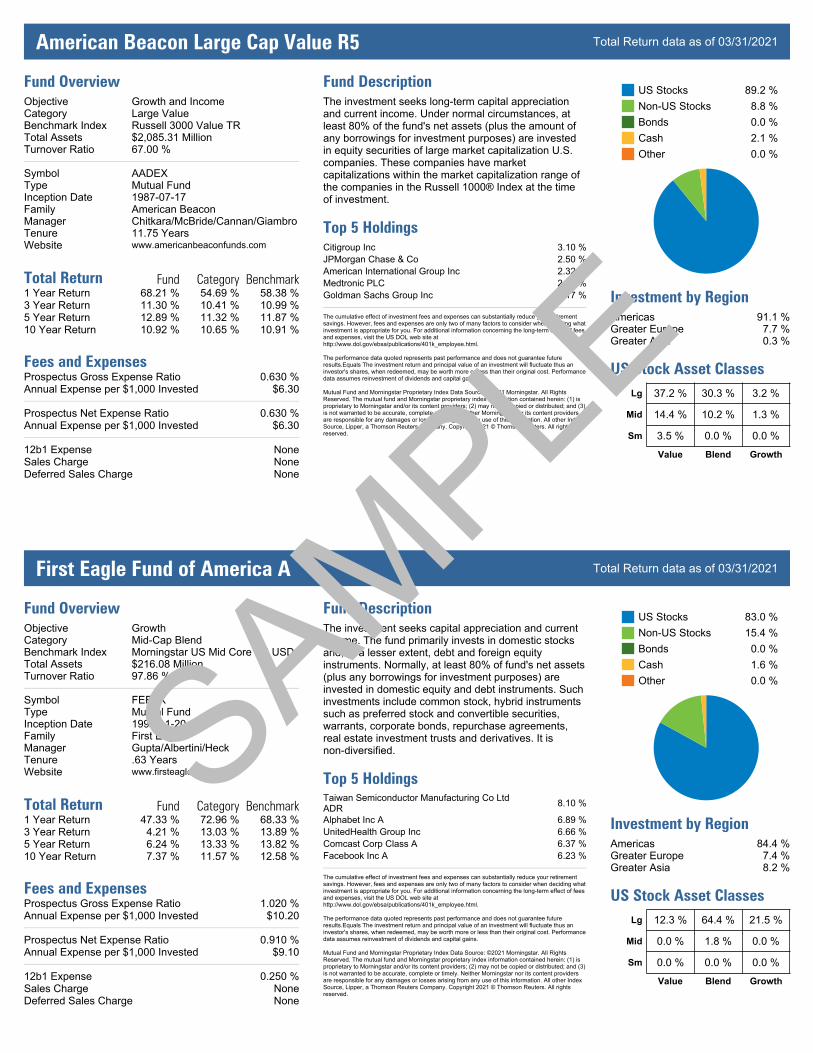
American Beacon Large Cap Value R5 Total Return data as of 03/31/2021
Fund OverviewObjectiveCategoryBenchmark IndexTotal AssetsTurnover Ratio
SymbolTypeInception DateFamilyManagerTenureWebsite
Growth and IncomeLarge ValueRussell 3000 Value TR$2,085.31 Million67.00 %
AADEXMutual Fund19870717American BeaconChitkara/McBride/Cannan/Giambro11.75 Yearswww.americanbeaconfunds.com
Total Return Fund Category Benchmark1 Year Return 68.21 % 54.69 % 58.38 %3 Year Return 11.30 % 10.41 % 10.99 %5 Year Return 12.89 % 11.32 % 11.87 %10 Year Return 10.92 % 10.65 % 10.91 %
Fees and ExpensesProspectus Gross Expense Ratio 0.630 %Annual Expense per $1,000 Invested $6.30
Prospectus Net Expense Ratio 0.630 %Annual Expense per $1,000 Invested $6.30
12b1 Expense NoneSales Charge NoneDeferred Sales Charge None
Fund DescriptionThe investment seeks longterm capital appreciationand current income. Under normal circumstances, atleast 80% of the fund's net assets (plus the amount ofany borrowings for investment purposes) are investedin equity securities of large market capitalization U.S.companies. These companies have marketcapitalizations within the market capitalization range ofthe companies in the Russell 1000® Index at the timeof investment.
Top 5 HoldingsCitigroup Inc 3.10 %JPMorgan Chase & Co 2.50 %American International Group Inc 2.32 %Medtronic PLC 2.19 %Goldman Sachs Group Inc 2.17 %
The cumulative effect of investment fees and expenses can substantially reduce your retirementsavings. However, fees and expenses are only two of many factors to consider when deciding whatinvestment is appropriate for you. For additional information concerning the longterm effect of feesand expenses, visit the US DOL web site athttp://www.dol.gov/ebsa/publications/401k_employee.html.
The performance data quoted represents past performance and does not guarantee futureresults.Equals The investment return and principal value of an investment will fluctuate thus aninvestor's shares, when redeemed, may be worth more or less than their original cost. Performancedata assumes reinvestment of dividends and capital gains.
Mutual Fund and Morningstar Proprietary Index Data Source: ©2021 Morningstar. All RightsReserved. The mutual fund and Morningstar proprietary index information contained herein: (1) isproprietary to Morningstar and/or its content providers; (2) may not be copied or distributed; and (3)is not warranted to be accurate, complete or timely. Neither Morningstar nor its content providersare responsible for any damages or losses arising from any use of this information. All other IndexSource, Lipper, a Thomson Reuters Company. Copyright 2021 © Thomson Reuters. All rightsreserved.
US StocksNonUS StocksBondsCashOther
89.2 %8.8 %0.0 %2.1 %0.0 %
Investment by RegionAmericas 91.1 %Greater Europe 7.7 %Greater Asia 0.3 %
US Stock Asset ClassesLg 37.2 % 30.3 % 3.2 %
Mid 14.4 % 10.2 % 1.3 %
Sm 3.5 % 0.0 % 0.0 %
Value Blend Growth
First Eagle Fund of America A Total Return data as of 03/31/2021
Fund OverviewObjectiveCategoryBenchmark IndexTotal AssetsTurnover Ratio
SymbolTypeInception DateFamilyManagerTenureWebsite
GrowthMidCap BlendMorningstar US Mid Core TR USD$216.08 Million97.86 %
FEFAXMutual Fund19981120First EagleGupta/Albertini/Heck.63 Yearswww.firsteaglefunds.com
Total Return Fund Category Benchmark1 Year Return 47.33 % 72.96 % 68.33 %3 Year Return 4.21 % 13.03 % 13.89 %5 Year Return 6.24 % 13.33 % 13.82 %10 Year Return 7.37 % 11.57 % 12.58 %
Fees and ExpensesProspectus Gross Expense Ratio 1.020 %Annual Expense per $1,000 Invested $10.20
Prospectus Net Expense Ratio 0.910 %Annual Expense per $1,000 Invested $9.10
12b1 Expense 0.250 %Sales Charge NoneDeferred Sales Charge None
Fund DescriptionThe investment seeks capital appreciation and currentincome. The fund primarily invests in domestic stocksand, to a lesser extent, debt and foreign equityinstruments. Normally, at least 80% of fund's net assets(plus any borrowings for investment purposes) areinvested in domestic equity and debt instruments. Suchinvestments include common stock, hybrid instrumentssuch as preferred stock and convertible securities,warrants, corporate bonds, repurchase agreements,real estate investment trusts and derivatives. It isnondiversified.
Top 5 HoldingsTaiwan Semiconductor Manufacturing Co LtdADR 8.10 %
Alphabet Inc A 6.89 %UnitedHealth Group Inc 6.66 %Comcast Corp Class A 6.37 %Facebook Inc A 6.23 %
The cumulative effect of investment fees and expenses can substantially reduce your retirementsavings. However, fees and expenses are only two of many factors to consider when deciding whatinvestment is appropriate for you. For additional information concerning the longterm effect of feesand expenses, visit the US DOL web site athttp://www.dol.gov/ebsa/publications/401k_employee.html.
The performance data quoted represents past performance and does not guarantee futureresults.Equals The investment return and principal value of an investment will fluctuate thus aninvestor's shares, when redeemed, may be worth more or less than their original cost. Performancedata assumes reinvestment of dividends and capital gains.
Mutual Fund and Morningstar Proprietary Index Data Source: ©2021 Morningstar. All RightsReserved. The mutual fund and Morningstar proprietary index information contained herein: (1) isproprietary to Morningstar and/or its content providers; (2) may not be copied or distributed; and (3)is not warranted to be accurate, complete or timely. Neither Morningstar nor its content providersare responsible for any damages or losses arising from any use of this information. All other IndexSource, Lipper, a Thomson Reuters Company. Copyright 2021 © Thomson Reuters. All rightsreserved.
US StocksNonUS StocksBondsCashOther
83.0 %15.4 %0.0 %1.6 %0.0 %
Investment by RegionAmericas 84.4 %Greater Europe 7.4 %Greater Asia 8.2 %
US Stock Asset ClassesLg 12.3 % 64.4 % 21.5 %
Mid 0.0 % 1.8 % 0.0 %
Sm 0.0 % 0.0 % 0.0 %
Value Blend Growth
SAMPLE
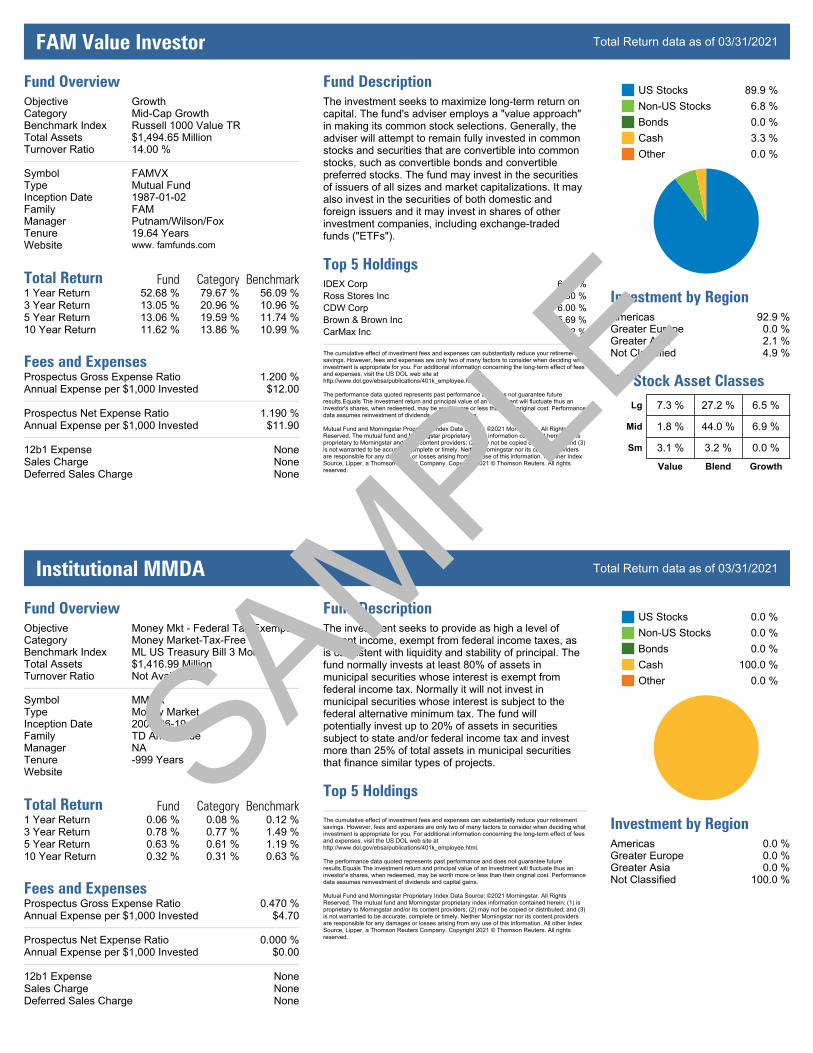
FAM Value Investor Total Return data as of 03/31/2021
Fund OverviewObjectiveCategoryBenchmark IndexTotal AssetsTurnover Ratio
SymbolTypeInception DateFamilyManagerTenureWebsite
GrowthMidCap GrowthRussell 1000 Value TR$1,494.65 Million14.00 %
FAMVXMutual Fund19870102FAMPutnam/Wilson/Fox19.64 Yearswww. famfunds.com
Total Return Fund Category Benchmark1 Year Return 52.68 % 79.67 % 56.09 %3 Year Return 13.05 % 20.96 % 10.96 %5 Year Return 13.06 % 19.59 % 11.74 %10 Year Return 11.62 % 13.86 % 10.99 %
Fees and ExpensesProspectus Gross Expense Ratio 1.200 %Annual Expense per $1,000 Invested $12.00
Prospectus Net Expense Ratio 1.190 %Annual Expense per $1,000 Invested $11.90
12b1 Expense NoneSales Charge NoneDeferred Sales Charge None
Fund DescriptionThe investment seeks to maximize longterm return oncapital. The fund's adviser employs a "value approach"in making its common stock selections. Generally, theadviser will attempt to remain fully invested in commonstocks and securities that are convertible into commonstocks, such as convertible bonds and convertiblepreferred stocks. The fund may invest in the securitiesof issuers of all sizes and market capitalizations. It mayalso invest in the securities of both domestic andforeign issuers and it may invest in shares of otherinvestment companies, including exchangetradedfunds ("ETFs").
Top 5 HoldingsIDEX Corp 6.47 %Ross Stores Inc 6.30 %CDW Corp 6.00 %Brown & Brown Inc 5.69 %CarMax Inc 4.82 %
The cumulative effect of investment fees and expenses can substantially reduce your retirementsavings. However, fees and expenses are only two of many factors to consider when deciding whatinvestment is appropriate for you. For additional information concerning the longterm effect of feesand expenses, visit the US DOL web site athttp://www.dol.gov/ebsa/publications/401k_employee.html.
The performance data quoted represents past performance and does not guarantee futureresults.Equals The investment return and principal value of an investment will fluctuate thus aninvestor's shares, when redeemed, may be worth more or less than their original cost. Performancedata assumes reinvestment of dividends and capital gains.
Mutual Fund and Morningstar Proprietary Index Data Source: ©2021 Morningstar. All RightsReserved. The mutual fund and Morningstar proprietary index information contained herein: (1) isproprietary to Morningstar and/or its content providers; (2) may not be copied or distributed; and (3)is not warranted to be accurate, complete or timely. Neither Morningstar nor its content providersare responsible for any damages or losses arising from any use of this information. All other IndexSource, Lipper, a Thomson Reuters Company. Copyright 2021 © Thomson Reuters. All rightsreserved.
US StocksNonUS StocksBondsCashOther
89.9 %6.8 %0.0 %3.3 %0.0 %
Investment by RegionAmericas 92.9 %Greater Europe 0.0 %Greater Asia 2.1 %Not Classified 4.9 %
US Stock Asset ClassesLg 7.3 % 27.2 % 6.5 %
Mid 1.8 % 44.0 % 6.9 %
Sm 3.1 % 3.2 % 0.0 %
Value Blend Growth
Institutional MMDA Total Return data as of 03/31/2021
Fund OverviewObjectiveCategoryBenchmark IndexTotal AssetsTurnover Ratio
SymbolTypeInception DateFamilyManagerTenureWebsite
Money Mkt Federal Tax ExemptMoney MarketTaxFreeML US Treasury Bill 3 Mon$1,416.99 MillionNot Available
MMDAMoney Market20010619TD AmeritradeNA999 Years
Total Return Fund Category Benchmark1 Year Return 0.06 % 0.08 % 0.12 %3 Year Return 0.78 % 0.77 % 1.49 %5 Year Return 0.63 % 0.61 % 1.19 %10 Year Return 0.32 % 0.31 % 0.63 %
Fees and ExpensesProspectus Gross Expense Ratio 0.470 %Annual Expense per $1,000 Invested $4.70
Prospectus Net Expense Ratio 0.000 %Annual Expense per $1,000 Invested $0.00
12b1 Expense NoneSales Charge NoneDeferred Sales Charge None
Fund DescriptionThe investment seeks to provide as high a level ofcurrent income, exempt from federal income taxes, asis consistent with liquidity and stability of principal. Thefund normally invests at least 80% of assets inmunicipal securities whose interest is exempt fromfederal income tax. Normally it will not invest inmunicipal securities whose interest is subject to thefederal alternative minimum tax. The fund willpotentially invest up to 20% of assets in securitiessubject to state and/or federal income tax and investmore than 25% of total assets in municipal securitiesthat finance similar types of projects.
Top 5 Holdings
The cumulative effect of investment fees and expenses can substantially reduce your retirementsavings. However, fees and expenses are only two of many factors to consider when deciding whatinvestment is appropriate for you. For additional information concerning the longterm effect of feesand expenses, visit the US DOL web site athttp://www.dol.gov/ebsa/publications/401k_employee.html.
The performance data quoted represents past performance and does not guarantee futureresults.Equals The investment return and principal value of an investment will fluctuate thus aninvestor's shares, when redeemed, may be worth more or less than their original cost. Performancedata assumes reinvestment of dividends and capital gains.
Mutual Fund and Morningstar Proprietary Index Data Source: ©2021 Morningstar. All RightsReserved. The mutual fund and Morningstar proprietary index information contained herein: (1) isproprietary to Morningstar and/or its content providers; (2) may not be copied or distributed; and (3)is not warranted to be accurate, complete or timely. Neither Morningstar nor its content providersare responsible for any damages or losses arising from any use of this information. All other IndexSource, Lipper, a Thomson Reuters Company. Copyright 2021 © Thomson Reuters. All rightsreserved.
US StocksNonUS StocksBondsCashOther
0.0 %0.0 %0.0 %
100.0 %0.0 %
Investment by RegionAmericas 0.0 %Greater Europe 0.0 %Greater Asia 0.0 %Not Classified 100.0 %
SAMPLE
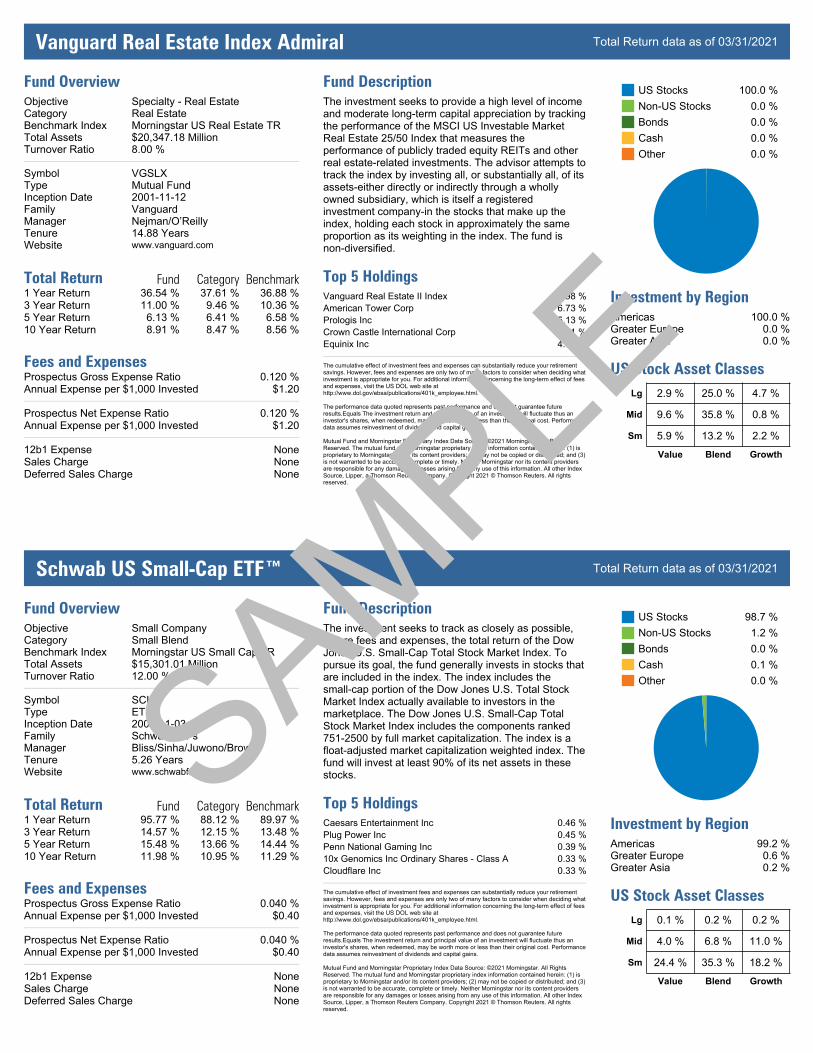
Vanguard Real Estate Index Admiral Total Return data as of 03/31/2021
Fund OverviewObjectiveCategoryBenchmark IndexTotal AssetsTurnover Ratio
SymbolTypeInception DateFamilyManagerTenureWebsite
Specialty Real EstateReal EstateMorningstar US Real Estate TR$20,347.18 Million8.00 %
VGSLXMutual Fund20011112VanguardNejman/O’Reilly14.88 Yearswww.vanguard.com
Total Return Fund Category Benchmark1 Year Return 36.54 % 37.61 % 36.88 %3 Year Return 11.00 % 9.46 % 10.36 %5 Year Return 6.13 % 6.41 % 6.58 %10 Year Return 8.91 % 8.47 % 8.56 %
Fees and ExpensesProspectus Gross Expense Ratio 0.120 %Annual Expense per $1,000 Invested $1.20
Prospectus Net Expense Ratio 0.120 %Annual Expense per $1,000 Invested $1.20
12b1 Expense NoneSales Charge NoneDeferred Sales Charge None
Fund DescriptionThe investment seeks to provide a high level of incomeand moderate longterm capital appreciation by trackingthe performance of the MSCI US Investable MarketReal Estate 25/50 Index that measures theperformance of publicly traded equity REITs and otherreal estaterelated investments. The advisor attempts totrack the index by investing all, or substantially all, of itsassetseither directly or indirectly through a whollyowned subsidiary, which is itself a registeredinvestment companyin the stocks that make up theindex, holding each stock in approximately the sameproportion as its weighting in the index. The fund isnondiversified.
Top 5 HoldingsVanguard Real Estate II Index 11.98 %American Tower Corp 6.73 %Prologis Inc 5.13 %Crown Castle International Corp 4.71 %Equinix Inc 4.05 %
The cumulative effect of investment fees and expenses can substantially reduce your retirementsavings. However, fees and expenses are only two of many factors to consider when deciding whatinvestment is appropriate for you. For additional information concerning the longterm effect of feesand expenses, visit the US DOL web site athttp://www.dol.gov/ebsa/publications/401k_employee.html.
The performance data quoted represents past performance and does not guarantee futureresults.Equals The investment return and principal value of an investment will fluctuate thus aninvestor's shares, when redeemed, may be worth more or less than their original cost. Performancedata assumes reinvestment of dividends and capital gains.
Mutual Fund and Morningstar Proprietary Index Data Source: ©2021 Morningstar. All RightsReserved. The mutual fund and Morningstar proprietary index information contained herein: (1) isproprietary to Morningstar and/or its content providers; (2) may not be copied or distributed; and (3)is not warranted to be accurate, complete or timely. Neither Morningstar nor its content providersare responsible for any damages or losses arising from any use of this information. All other IndexSource, Lipper, a Thomson Reuters Company. Copyright 2021 © Thomson Reuters. All rightsreserved.
US StocksNonUS StocksBondsCashOther
100.0 %0.0 %0.0 %0.0 %0.0 %
Investment by RegionAmericas 100.0 %Greater Europe 0.0 %Greater Asia 0.0 %
US Stock Asset ClassesLg 2.9 % 25.0 % 4.7 %
Mid 9.6 % 35.8 % 0.8 %
Sm 5.9 % 13.2 % 2.2 %
Value Blend Growth
Schwab US Small-Cap ETF™ Total Return data as of 03/31/2021
Fund OverviewObjectiveCategoryBenchmark IndexTotal AssetsTurnover Ratio
SymbolTypeInception DateFamilyManagerTenureWebsite
Small CompanySmall BlendMorningstar US Small Cap TR$15,301.01 Million12.00 %
SCHAETF20091103Schwab ETFsBliss/Sinha/Juwono/Brown5.26 Yearswww.schwabfunds.com
Total Return Fund Category Benchmark1 Year Return 95.77 % 88.12 % 89.97 %3 Year Return 14.57 % 12.15 % 13.48 %5 Year Return 15.48 % 13.66 % 14.44 %10 Year Return 11.98 % 10.95 % 11.29 %
Fees and ExpensesProspectus Gross Expense Ratio 0.040 %Annual Expense per $1,000 Invested $0.40
Prospectus Net Expense Ratio 0.040 %Annual Expense per $1,000 Invested $0.40
12b1 Expense NoneSales Charge NoneDeferred Sales Charge None
Fund DescriptionThe investment seeks to track as closely as possible,before fees and expenses, the total return of the DowJones U.S. SmallCap Total Stock Market Index. Topursue its goal, the fund generally invests in stocks thatare included in the index. The index includes thesmallcap portion of the Dow Jones U.S. Total StockMarket Index actually available to investors in themarketplace. The Dow Jones U.S. SmallCap TotalStock Market Index includes the components ranked7512500 by full market capitalization. The index is afloatadjusted market capitalization weighted index. Thefund will invest at least 90% of its net assets in thesestocks.
Top 5 HoldingsCaesars Entertainment Inc 0.46 %Plug Power Inc 0.45 %Penn National Gaming Inc 0.39 %10x Genomics Inc Ordinary Shares Class A 0.33 %Cloudflare Inc 0.33 %
The cumulative effect of investment fees and expenses can substantially reduce your retirementsavings. However, fees and expenses are only two of many factors to consider when deciding whatinvestment is appropriate for you. For additional information concerning the longterm effect of feesand expenses, visit the US DOL web site athttp://www.dol.gov/ebsa/publications/401k_employee.html.
The performance data quoted represents past performance and does not guarantee futureresults.Equals The investment return and principal value of an investment will fluctuate thus aninvestor's shares, when redeemed, may be worth more or less than their original cost. Performancedata assumes reinvestment of dividends and capital gains.
Mutual Fund and Morningstar Proprietary Index Data Source: ©2021 Morningstar. All RightsReserved. The mutual fund and Morningstar proprietary index information contained herein: (1) isproprietary to Morningstar and/or its content providers; (2) may not be copied or distributed; and (3)is not warranted to be accurate, complete or timely. Neither Morningstar nor its content providersare responsible for any damages or losses arising from any use of this information. All other IndexSource, Lipper, a Thomson Reuters Company. Copyright 2021 © Thomson Reuters. All rightsreserved.
US StocksNonUS StocksBondsCashOther
98.7 %1.2 %0.0 %0.1 %0.0 %
Investment by RegionAmericas 99.2 %Greater Europe 0.6 %Greater Asia 0.2 %
US Stock Asset ClassesLg 0.1 % 0.2 % 0.2 %
Mid 4.0 % 6.8 % 11.0 %
Sm 24.4 % 35.3 % 18.2 %
Value Blend Growth
SAMPLE
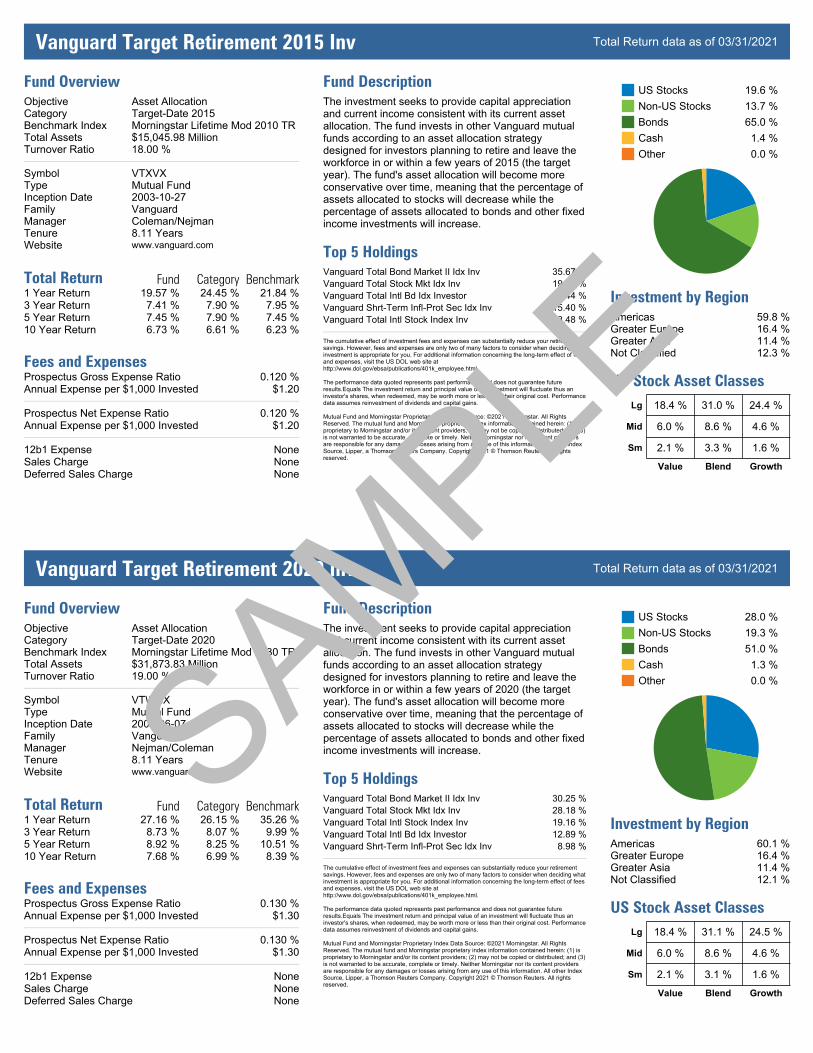
Vanguard Target Retirement 2015 Inv Total Return data as of 03/31/2021
Fund OverviewObjectiveCategoryBenchmark IndexTotal AssetsTurnover Ratio
SymbolTypeInception DateFamilyManagerTenureWebsite
Asset AllocationTargetDate 2015Morningstar Lifetime Mod 2010 TR$15,045.98 Million18.00 %
VTXVXMutual Fund20031027VanguardColeman/Nejman8.11 Yearswww.vanguard.com
Total Return Fund Category Benchmark1 Year Return 19.57 % 24.45 % 21.84 %3 Year Return 7.41 % 7.90 % 7.95 %5 Year Return 7.45 % 7.90 % 7.45 %10 Year Return 6.73 % 6.61 % 6.23 %
Fees and ExpensesProspectus Gross Expense Ratio 0.120 %Annual Expense per $1,000 Invested $1.20
Prospectus Net Expense Ratio 0.120 %Annual Expense per $1,000 Invested $1.20
12b1 Expense NoneSales Charge NoneDeferred Sales Charge None
Fund DescriptionThe investment seeks to provide capital appreciationand current income consistent with its current assetallocation. The fund invests in other Vanguard mutualfunds according to an asset allocation strategydesigned for investors planning to retire and leave theworkforce in or within a few years of 2015 (the targetyear). The fund's asset allocation will become moreconservative over time, meaning that the percentage ofassets allocated to stocks will decrease while thepercentage of assets allocated to bonds and other fixedincome investments will increase.
Top 5 HoldingsVanguard Total Bond Market II Idx Inv 35.67 %Vanguard Total Stock Mkt Idx Inv 19.72 %Vanguard Total Intl Bd Idx Investor 15.44 %Vanguard ShrtTerm InflProt Sec Idx Inv 15.40 %Vanguard Total Intl Stock Index Inv 13.48 %
The cumulative effect of investment fees and expenses can substantially reduce your retirementsavings. However, fees and expenses are only two of many factors to consider when deciding whatinvestment is appropriate for you. For additional information concerning the longterm effect of feesand expenses, visit the US DOL web site athttp://www.dol.gov/ebsa/publications/401k_employee.html.
The performance data quoted represents past performance and does not guarantee futureresults.Equals The investment return and principal value of an investment will fluctuate thus aninvestor's shares, when redeemed, may be worth more or less than their original cost. Performancedata assumes reinvestment of dividends and capital gains.
Mutual Fund and Morningstar Proprietary Index Data Source: ©2021 Morningstar. All RightsReserved. The mutual fund and Morningstar proprietary index information contained herein: (1) isproprietary to Morningstar and/or its content providers; (2) may not be copied or distributed; and (3)is not warranted to be accurate, complete or timely. Neither Morningstar nor its content providersare responsible for any damages or losses arising from any use of this information. All other IndexSource, Lipper, a Thomson Reuters Company. Copyright 2021 © Thomson Reuters. All rightsreserved.
US StocksNonUS StocksBondsCashOther
19.6 %13.7 %65.0 %1.4 %0.0 %
Investment by RegionAmericas 59.8 %Greater Europe 16.4 %Greater Asia 11.4 %Not Classified 12.3 %
US Stock Asset ClassesLg 18.4 % 31.0 % 24.4 %
Mid 6.0 % 8.6 % 4.6 %
Sm 2.1 % 3.3 % 1.6 %
Value Blend Growth
Vanguard Target Retirement 2020 Inv Total Return data as of 03/31/2021
Fund OverviewObjectiveCategoryBenchmark IndexTotal AssetsTurnover Ratio
SymbolTypeInception DateFamilyManagerTenureWebsite
Asset AllocationTargetDate 2020Morningstar Lifetime Mod 2030 TR$31,873.83 Million19.00 %
VTWNXMutual Fund20060607VanguardNejman/Coleman8.11 Yearswww.vanguard.com
Total Return Fund Category Benchmark1 Year Return 27.16 % 26.15 % 35.26 %3 Year Return 8.73 % 8.07 % 9.99 %5 Year Return 8.92 % 8.25 % 10.51 %10 Year Return 7.68 % 6.99 % 8.39 %
Fees and ExpensesProspectus Gross Expense Ratio 0.130 %Annual Expense per $1,000 Invested $1.30
Prospectus Net Expense Ratio 0.130 %Annual Expense per $1,000 Invested $1.30
12b1 Expense NoneSales Charge NoneDeferred Sales Charge None
Fund DescriptionThe investment seeks to provide capital appreciationand current income consistent with its current assetallocation. The fund invests in other Vanguard mutualfunds according to an asset allocation strategydesigned for investors planning to retire and leave theworkforce in or within a few years of 2020 (the targetyear). The fund's asset allocation will become moreconservative over time, meaning that the percentage ofassets allocated to stocks will decrease while thepercentage of assets allocated to bonds and other fixedincome investments will increase.
Top 5 HoldingsVanguard Total Bond Market II Idx Inv 30.25 %Vanguard Total Stock Mkt Idx Inv 28.18 %Vanguard Total Intl Stock Index Inv 19.16 %Vanguard Total Intl Bd Idx Investor 12.89 %Vanguard ShrtTerm InflProt Sec Idx Inv 8.98 %
The cumulative effect of investment fees and expenses can substantially reduce your retirementsavings. However, fees and expenses are only two of many factors to consider when deciding whatinvestment is appropriate for you. For additional information concerning the longterm effect of feesand expenses, visit the US DOL web site athttp://www.dol.gov/ebsa/publications/401k_employee.html.
The performance data quoted represents past performance and does not guarantee futureresults.Equals The investment return and principal value of an investment will fluctuate thus aninvestor's shares, when redeemed, may be worth more or less than their original cost. Performancedata assumes reinvestment of dividends and capital gains.
Mutual Fund and Morningstar Proprietary Index Data Source: ©2021 Morningstar. All RightsReserved. The mutual fund and Morningstar proprietary index information contained herein: (1) isproprietary to Morningstar and/or its content providers; (2) may not be copied or distributed; and (3)is not warranted to be accurate, complete or timely. Neither Morningstar nor its content providersare responsible for any damages or losses arising from any use of this information. All other IndexSource, Lipper, a Thomson Reuters Company. Copyright 2021 © Thomson Reuters. All rightsreserved.
US StocksNonUS StocksBondsCashOther
28.0 %19.3 %51.0 %1.3 %0.0 %
Investment by RegionAmericas 60.1 %Greater Europe 16.4 %Greater Asia 11.4 %Not Classified 12.1 %
US Stock Asset ClassesLg 18.4 % 31.1 % 24.5 %
Mid 6.0 % 8.6 % 4.6 %
Sm 2.1 % 3.1 % 1.6 %
Value Blend Growth
SAMPLE
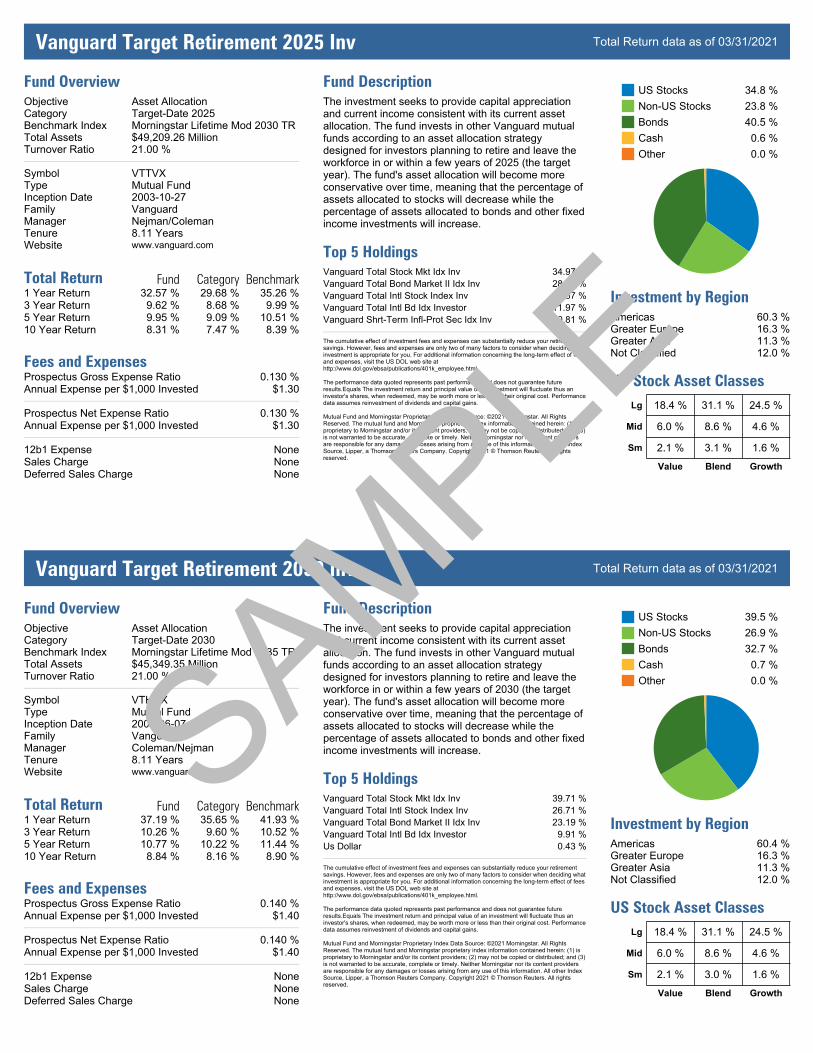
Vanguard Target Retirement 2025 Inv Total Return data as of 03/31/2021
Fund OverviewObjectiveCategoryBenchmark IndexTotal AssetsTurnover Ratio
SymbolTypeInception DateFamilyManagerTenureWebsite
Asset AllocationTargetDate 2025Morningstar Lifetime Mod 2030 TR$49,209.26 Million21.00 %
VTTVXMutual Fund20031027VanguardNejman/Coleman8.11 Yearswww.vanguard.com
Total Return Fund Category Benchmark1 Year Return 32.57 % 29.68 % 35.26 %3 Year Return 9.62 % 8.68 % 9.99 %5 Year Return 9.95 % 9.09 % 10.51 %10 Year Return 8.31 % 7.47 % 8.39 %
Fees and ExpensesProspectus Gross Expense Ratio 0.130 %Annual Expense per $1,000 Invested $1.30
Prospectus Net Expense Ratio 0.130 %Annual Expense per $1,000 Invested $1.30
12b1 Expense NoneSales Charge NoneDeferred Sales Charge None
Fund DescriptionThe investment seeks to provide capital appreciationand current income consistent with its current assetallocation. The fund invests in other Vanguard mutualfunds according to an asset allocation strategydesigned for investors planning to retire and leave theworkforce in or within a few years of 2025 (the targetyear). The fund's asset allocation will become moreconservative over time, meaning that the percentage ofassets allocated to stocks will decrease while thepercentage of assets allocated to bonds and other fixedincome investments will increase.
Top 5 HoldingsVanguard Total Stock Mkt Idx Inv 34.97 %Vanguard Total Bond Market II Idx Inv 28.29 %Vanguard Total Intl Stock Index Inv 23.57 %Vanguard Total Intl Bd Idx Investor 11.97 %Vanguard ShrtTerm InflProt Sec Idx Inv 0.81 %
The cumulative effect of investment fees and expenses can substantially reduce your retirementsavings. However, fees and expenses are only two of many factors to consider when deciding whatinvestment is appropriate for you. For additional information concerning the longterm effect of feesand expenses, visit the US DOL web site athttp://www.dol.gov/ebsa/publications/401k_employee.html.
The performance data quoted represents past performance and does not guarantee futureresults.Equals The investment return and principal value of an investment will fluctuate thus aninvestor's shares, when redeemed, may be worth more or less than their original cost. Performancedata assumes reinvestment of dividends and capital gains.
Mutual Fund and Morningstar Proprietary Index Data Source: ©2021 Morningstar. All RightsReserved. The mutual fund and Morningstar proprietary index information contained herein: (1) isproprietary to Morningstar and/or its content providers; (2) may not be copied or distributed; and (3)is not warranted to be accurate, complete or timely. Neither Morningstar nor its content providersare responsible for any damages or losses arising from any use of this information. All other IndexSource, Lipper, a Thomson Reuters Company. Copyright 2021 © Thomson Reuters. All rightsreserved.
US StocksNonUS StocksBondsCashOther
34.8 %23.8 %40.5 %0.6 %0.0 %
Investment by RegionAmericas 60.3 %Greater Europe 16.3 %Greater Asia 11.3 %Not Classified 12.0 %
US Stock Asset ClassesLg 18.4 % 31.1 % 24.5 %
Mid 6.0 % 8.6 % 4.6 %
Sm 2.1 % 3.1 % 1.6 %
Value Blend Growth
Vanguard Target Retirement 2030 Inv Total Return data as of 03/31/2021
Fund OverviewObjectiveCategoryBenchmark IndexTotal AssetsTurnover Ratio
SymbolTypeInception DateFamilyManagerTenureWebsite
Asset AllocationTargetDate 2030Morningstar Lifetime Mod 2035 TR$45,349.35 Million21.00 %
VTHRXMutual Fund20060607VanguardColeman/Nejman8.11 Yearswww.vanguard.com
Total Return Fund Category Benchmark1 Year Return 37.19 % 35.65 % 41.93 %3 Year Return 10.26 % 9.60 % 10.52 %5 Year Return 10.77 % 10.22 % 11.44 %10 Year Return 8.84 % 8.16 % 8.90 %
Fees and ExpensesProspectus Gross Expense Ratio 0.140 %Annual Expense per $1,000 Invested $1.40
Prospectus Net Expense Ratio 0.140 %Annual Expense per $1,000 Invested $1.40
12b1 Expense NoneSales Charge NoneDeferred Sales Charge None
Fund DescriptionThe investment seeks to provide capital appreciationand current income consistent with its current assetallocation. The fund invests in other Vanguard mutualfunds according to an asset allocation strategydesigned for investors planning to retire and leave theworkforce in or within a few years of 2030 (the targetyear). The fund's asset allocation will become moreconservative over time, meaning that the percentage ofassets allocated to stocks will decrease while thepercentage of assets allocated to bonds and other fixedincome investments will increase.
Top 5 HoldingsVanguard Total Stock Mkt Idx Inv 39.71 %Vanguard Total Intl Stock Index Inv 26.71 %Vanguard Total Bond Market II Idx Inv 23.19 %Vanguard Total Intl Bd Idx Investor 9.91 %Us Dollar 0.43 %
The cumulative effect of investment fees and expenses can substantially reduce your retirementsavings. However, fees and expenses are only two of many factors to consider when deciding whatinvestment is appropriate for you. For additional information concerning the longterm effect of feesand expenses, visit the US DOL web site athttp://www.dol.gov/ebsa/publications/401k_employee.html.
The performance data quoted represents past performance and does not guarantee futureresults.Equals The investment return and principal value of an investment will fluctuate thus aninvestor's shares, when redeemed, may be worth more or less than their original cost. Performancedata assumes reinvestment of dividends and capital gains.
Mutual Fund and Morningstar Proprietary Index Data Source: ©2021 Morningstar. All RightsReserved. The mutual fund and Morningstar proprietary index information contained herein: (1) isproprietary to Morningstar and/or its content providers; (2) may not be copied or distributed; and (3)is not warranted to be accurate, complete or timely. Neither Morningstar nor its content providersare responsible for any damages or losses arising from any use of this information. All other IndexSource, Lipper, a Thomson Reuters Company. Copyright 2021 © Thomson Reuters. All rightsreserved.
US StocksNonUS StocksBondsCashOther
39.5 %26.9 %32.7 %0.7 %0.0 %
Investment by RegionAmericas 60.4 %Greater Europe 16.3 %Greater Asia 11.3 %Not Classified 12.0 %
US Stock Asset ClassesLg 18.4 % 31.1 % 24.5 %
Mid 6.0 % 8.6 % 4.6 %
Sm 2.1 % 3.0 % 1.6 %
Value Blend Growth
SAMPLE
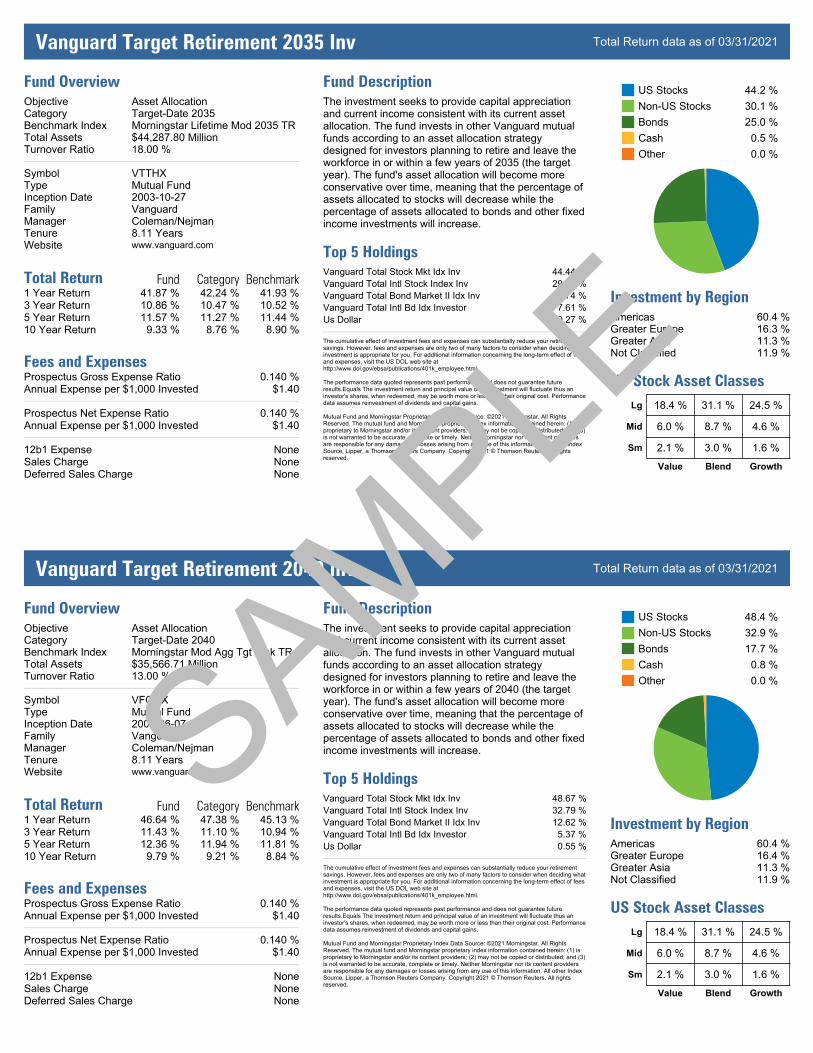
Vanguard Target Retirement 2035 Inv Total Return data as of 03/31/2021
Fund OverviewObjectiveCategoryBenchmark IndexTotal AssetsTurnover Ratio
SymbolTypeInception DateFamilyManagerTenureWebsite
Asset AllocationTargetDate 2035Morningstar Lifetime Mod 2035 TR$44,287.80 Million18.00 %
VTTHXMutual Fund20031027VanguardColeman/Nejman8.11 Yearswww.vanguard.com
Total Return Fund Category Benchmark1 Year Return 41.87 % 42.24 % 41.93 %3 Year Return 10.86 % 10.47 % 10.52 %5 Year Return 11.57 % 11.27 % 11.44 %10 Year Return 9.33 % 8.76 % 8.90 %
Fees and ExpensesProspectus Gross Expense Ratio 0.140 %Annual Expense per $1,000 Invested $1.40
Prospectus Net Expense Ratio 0.140 %Annual Expense per $1,000 Invested $1.40
12b1 Expense NoneSales Charge NoneDeferred Sales Charge None
Fund DescriptionThe investment seeks to provide capital appreciationand current income consistent with its current assetallocation. The fund invests in other Vanguard mutualfunds according to an asset allocation strategydesigned for investors planning to retire and leave theworkforce in or within a few years of 2035 (the targetyear). The fund's asset allocation will become moreconservative over time, meaning that the percentage ofassets allocated to stocks will decrease while thepercentage of assets allocated to bonds and other fixedincome investments will increase.
Top 5 HoldingsVanguard Total Stock Mkt Idx Inv 44.44 %Vanguard Total Intl Stock Index Inv 29.89 %Vanguard Total Bond Market II Idx Inv 17.74 %Vanguard Total Intl Bd Idx Investor 7.61 %Us Dollar 0.27 %
The cumulative effect of investment fees and expenses can substantially reduce your retirementsavings. However, fees and expenses are only two of many factors to consider when deciding whatinvestment is appropriate for you. For additional information concerning the longterm effect of feesand expenses, visit the US DOL web site athttp://www.dol.gov/ebsa/publications/401k_employee.html.
The performance data quoted represents past performance and does not guarantee futureresults.Equals The investment return and principal value of an investment will fluctuate thus aninvestor's shares, when redeemed, may be worth more or less than their original cost. Performancedata assumes reinvestment of dividends and capital gains.
Mutual Fund and Morningstar Proprietary Index Data Source: ©2021 Morningstar. All RightsReserved. The mutual fund and Morningstar proprietary index information contained herein: (1) isproprietary to Morningstar and/or its content providers; (2) may not be copied or distributed; and (3)is not warranted to be accurate, complete or timely. Neither Morningstar nor its content providersare responsible for any damages or losses arising from any use of this information. All other IndexSource, Lipper, a Thomson Reuters Company. Copyright 2021 © Thomson Reuters. All rightsreserved.
US StocksNonUS StocksBondsCashOther
44.2 %30.1 %25.0 %0.5 %0.0 %
Investment by RegionAmericas 60.4 %Greater Europe 16.3 %Greater Asia 11.3 %Not Classified 11.9 %
US Stock Asset ClassesLg 18.4 % 31.1 % 24.5 %
Mid 6.0 % 8.7 % 4.6 %
Sm 2.1 % 3.0 % 1.6 %
Value Blend Growth
Vanguard Target Retirement 2040 Inv Total Return data as of 03/31/2021
Fund OverviewObjectiveCategoryBenchmark IndexTotal AssetsTurnover Ratio
SymbolTypeInception DateFamilyManagerTenureWebsite
Asset AllocationTargetDate 2040Morningstar Mod Agg Tgt Risk TR$35,566.71 Million13.00 %
VFORXMutual Fund20060607VanguardColeman/Nejman8.11 Yearswww.vanguard.com
Total Return Fund Category Benchmark1 Year Return 46.64 % 47.38 % 45.13 %3 Year Return 11.43 % 11.10 % 10.94 %5 Year Return 12.36 % 11.94 % 11.81 %10 Year Return 9.79 % 9.21 % 8.84 %
Fees and ExpensesProspectus Gross Expense Ratio 0.140 %Annual Expense per $1,000 Invested $1.40
Prospectus Net Expense Ratio 0.140 %Annual Expense per $1,000 Invested $1.40
12b1 Expense NoneSales Charge NoneDeferred Sales Charge None
Fund DescriptionThe investment seeks to provide capital appreciationand current income consistent with its current assetallocation. The fund invests in other Vanguard mutualfunds according to an asset allocation strategydesigned for investors planning to retire and leave theworkforce in or within a few years of 2040 (the targetyear). The fund's asset allocation will become moreconservative over time, meaning that the percentage ofassets allocated to stocks will decrease while thepercentage of assets allocated to bonds and other fixedincome investments will increase.
Top 5 HoldingsVanguard Total Stock Mkt Idx Inv 48.67 %Vanguard Total Intl Stock Index Inv 32.79 %Vanguard Total Bond Market II Idx Inv 12.62 %Vanguard Total Intl Bd Idx Investor 5.37 %Us Dollar 0.55 %
The cumulative effect of investment fees and expenses can substantially reduce your retirementsavings. However, fees and expenses are only two of many factors to consider when deciding whatinvestment is appropriate for you. For additional information concerning the longterm effect of feesand expenses, visit the US DOL web site athttp://www.dol.gov/ebsa/publications/401k_employee.html.
The performance data quoted represents past performance and does not guarantee futureresults.Equals The investment return and principal value of an investment will fluctuate thus aninvestor's shares, when redeemed, may be worth more or less than their original cost. Performancedata assumes reinvestment of dividends and capital gains.
Mutual Fund and Morningstar Proprietary Index Data Source: ©2021 Morningstar. All RightsReserved. The mutual fund and Morningstar proprietary index information contained herein: (1) isproprietary to Morningstar and/or its content providers; (2) may not be copied or distributed; and (3)is not warranted to be accurate, complete or timely. Neither Morningstar nor its content providersare responsible for any damages or losses arising from any use of this information. All other IndexSource, Lipper, a Thomson Reuters Company. Copyright 2021 © Thomson Reuters. All rightsreserved.
US StocksNonUS StocksBondsCashOther
48.4 %32.9 %17.7 %0.8 %0.0 %
Investment by RegionAmericas 60.4 %Greater Europe 16.4 %Greater Asia 11.3 %Not Classified 11.9 %
US Stock Asset ClassesLg 18.4 % 31.1 % 24.5 %
Mid 6.0 % 8.7 % 4.6 %
Sm 2.1 % 3.0 % 1.6 %
Value Blend Growth
SAMPLE
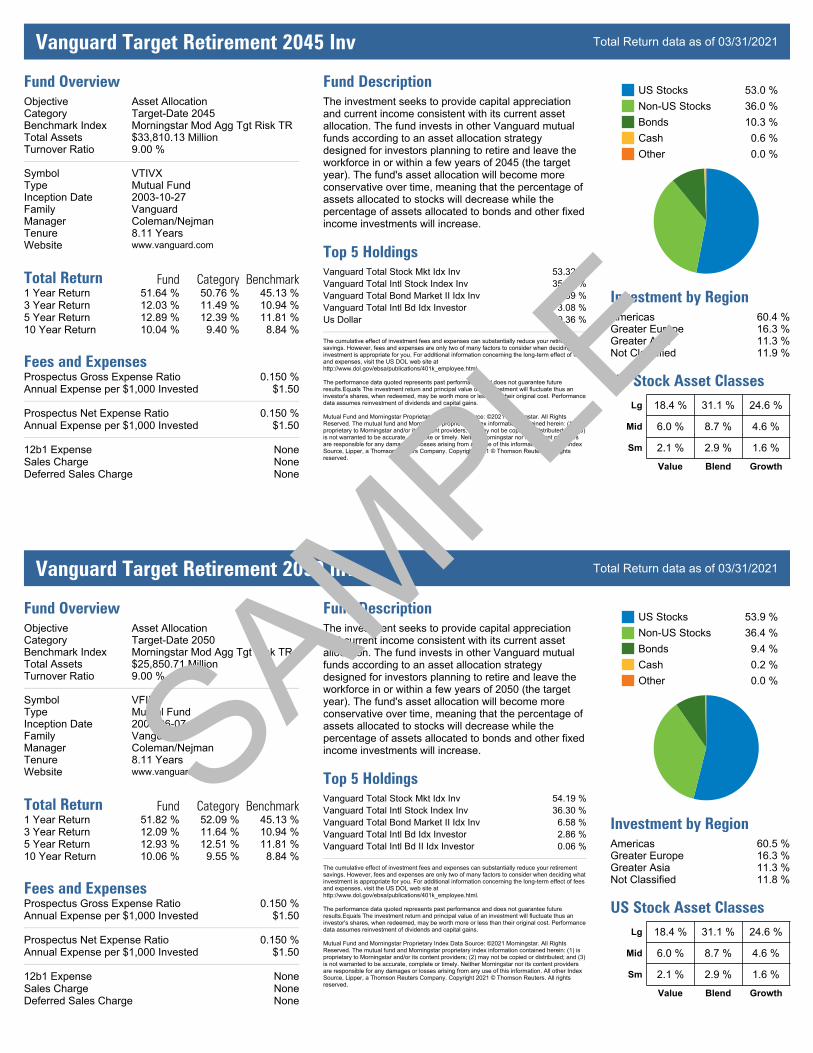
Vanguard Target Retirement 2045 Inv Total Return data as of 03/31/2021
Fund OverviewObjectiveCategoryBenchmark IndexTotal AssetsTurnover Ratio
SymbolTypeInception DateFamilyManagerTenureWebsite
Asset AllocationTargetDate 2045Morningstar Mod Agg Tgt Risk TR$33,810.13 Million9.00 %
VTIVXMutual Fund20031027VanguardColeman/Nejman8.11 Yearswww.vanguard.com
Total Return Fund Category Benchmark1 Year Return 51.64 % 50.76 % 45.13 %3 Year Return 12.03 % 11.49 % 10.94 %5 Year Return 12.89 % 12.39 % 11.81 %10 Year Return 10.04 % 9.40 % 8.84 %
Fees and ExpensesProspectus Gross Expense Ratio 0.150 %Annual Expense per $1,000 Invested $1.50
Prospectus Net Expense Ratio 0.150 %Annual Expense per $1,000 Invested $1.50
12b1 Expense NoneSales Charge NoneDeferred Sales Charge None
Fund DescriptionThe investment seeks to provide capital appreciationand current income consistent with its current assetallocation. The fund invests in other Vanguard mutualfunds according to an asset allocation strategydesigned for investors planning to retire and leave theworkforce in or within a few years of 2045 (the targetyear). The fund's asset allocation will become moreconservative over time, meaning that the percentage ofassets allocated to stocks will decrease while thepercentage of assets allocated to bonds and other fixedincome investments will increase.
Top 5 HoldingsVanguard Total Stock Mkt Idx Inv 53.32 %Vanguard Total Intl Stock Index Inv 35.86 %Vanguard Total Bond Market II Idx Inv 7.39 %Vanguard Total Intl Bd Idx Investor 3.08 %Us Dollar 0.36 %
The cumulative effect of investment fees and expenses can substantially reduce your retirementsavings. However, fees and expenses are only two of many factors to consider when deciding whatinvestment is appropriate for you. For additional information concerning the longterm effect of feesand expenses, visit the US DOL web site athttp://www.dol.gov/ebsa/publications/401k_employee.html.
The performance data quoted represents past performance and does not guarantee futureresults.Equals The investment return and principal value of an investment will fluctuate thus aninvestor's shares, when redeemed, may be worth more or less than their original cost. Performancedata assumes reinvestment of dividends and capital gains.
Mutual Fund and Morningstar Proprietary Index Data Source: ©2021 Morningstar. All RightsReserved. The mutual fund and Morningstar proprietary index information contained herein: (1) isproprietary to Morningstar and/or its content providers; (2) may not be copied or distributed; and (3)is not warranted to be accurate, complete or timely. Neither Morningstar nor its content providersare responsible for any damages or losses arising from any use of this information. All other IndexSource, Lipper, a Thomson Reuters Company. Copyright 2021 © Thomson Reuters. All rightsreserved.
US StocksNonUS StocksBondsCashOther
53.0 %36.0 %10.3 %0.6 %0.0 %
Investment by RegionAmericas 60.4 %Greater Europe 16.3 %Greater Asia 11.3 %Not Classified 11.9 %
US Stock Asset ClassesLg 18.4 % 31.1 % 24.6 %
Mid 6.0 % 8.7 % 4.6 %
Sm 2.1 % 2.9 % 1.6 %
Value Blend Growth
Vanguard Target Retirement 2050 Inv Total Return data as of 03/31/2021
Fund OverviewObjectiveCategoryBenchmark IndexTotal AssetsTurnover Ratio
SymbolTypeInception DateFamilyManagerTenureWebsite
Asset AllocationTargetDate 2050Morningstar Mod Agg Tgt Risk TR$25,850.71 Million9.00 %
VFIFXMutual Fund20060607VanguardColeman/Nejman8.11 Yearswww.vanguard.com
Total Return Fund Category Benchmark1 Year Return 51.82 % 52.09 % 45.13 %3 Year Return 12.09 % 11.64 % 10.94 %5 Year Return 12.93 % 12.51 % 11.81 %10 Year Return 10.06 % 9.55 % 8.84 %
Fees and ExpensesProspectus Gross Expense Ratio 0.150 %Annual Expense per $1,000 Invested $1.50
Prospectus Net Expense Ratio 0.150 %Annual Expense per $1,000 Invested $1.50
12b1 Expense NoneSales Charge NoneDeferred Sales Charge None
Fund DescriptionThe investment seeks to provide capital appreciationand current income consistent with its current assetallocation. The fund invests in other Vanguard mutualfunds according to an asset allocation strategydesigned for investors planning to retire and leave theworkforce in or within a few years of 2050 (the targetyear). The fund's asset allocation will become moreconservative over time, meaning that the percentage ofassets allocated to stocks will decrease while thepercentage of assets allocated to bonds and other fixedincome investments will increase.
Top 5 HoldingsVanguard Total Stock Mkt Idx Inv 54.19 %Vanguard Total Intl Stock Index Inv 36.30 %Vanguard Total Bond Market II Idx Inv 6.58 %Vanguard Total Intl Bd Idx Investor 2.86 %Vanguard Total Intl Bd II Idx Investor 0.06 %
The cumulative effect of investment fees and expenses can substantially reduce your retirementsavings. However, fees and expenses are only two of many factors to consider when deciding whatinvestment is appropriate for you. For additional information concerning the longterm effect of feesand expenses, visit the US DOL web site athttp://www.dol.gov/ebsa/publications/401k_employee.html.
The performance data quoted represents past performance and does not guarantee futureresults.Equals The investment return and principal value of an investment will fluctuate thus aninvestor's shares, when redeemed, may be worth more or less than their original cost. Performancedata assumes reinvestment of dividends and capital gains.
Mutual Fund and Morningstar Proprietary Index Data Source: ©2021 Morningstar. All RightsReserved. The mutual fund and Morningstar proprietary index information contained herein: (1) isproprietary to Morningstar and/or its content providers; (2) may not be copied or distributed; and (3)is not warranted to be accurate, complete or timely. Neither Morningstar nor its content providersare responsible for any damages or losses arising from any use of this information. All other IndexSource, Lipper, a Thomson Reuters Company. Copyright 2021 © Thomson Reuters. All rightsreserved.
US StocksNonUS StocksBondsCashOther
53.9 %36.4 %9.4 %0.2 %0.0 %
Investment by RegionAmericas 60.5 %Greater Europe 16.3 %Greater Asia 11.3 %Not Classified 11.8 %
US Stock Asset ClassesLg 18.4 % 31.1 % 24.6 %
Mid 6.0 % 8.7 % 4.6 %
Sm 2.1 % 2.9 % 1.6 %
Value Blend Growth
SAMPLE