Embed Size (px)
Citation preview
For A Larger Print Version, Call 617-242-5323.
Public Meetings
Where To Go For Further Informationwww.mwra.comwww.mass.gov/depwww.mass.gov/dphwww.mass.gov/dcr/watersupplywww.cdc.govwww.mwra.com/testinglabs.htmlwww.mwra.com/sourcewater.htmlwww.mwra.com/conservation.html
617-242-5323617-292-5500617-624-6000617-626-1250800-232-4636617-242-5323617-242-5323617-242-SAVE
Massachusetts Water Resources Authority (MWRA)Massachusetts Dept. of Environmental ProtectionMassachusetts Dept. of Public Health (DPH)Department of Conservation and RecreationUS Centers for Disease Control & Prevention (CDC)List of State Certified Water Quality Testing LabsSource Water Assessment and Protection ReportsInformation on Water Conservation
MWRA Board of DirectorsMWRA Advisory BoardWater Supply Citizens Advisory Committee
www.mwra.com/boardofdirectors.htmlwww.mwraadvisoryboard.comwww.mwra.com/wscac.html
617-788-1117617-788-2050413-213-0454
This report is required under the Federal Safe Drinking Water Act. MWRA PWS ID# 6000000
PRESORTEDSTANDARD
U.S. POSTAGE PAIDN. READING, MAPERMIT NO. 211
ECRWSSResidential Customer
Massachusetts Water Resources Authority and the Arlington Department of Public Works
Massachusetts Water Resources Authority and the Belmont Department of Public Works
Massachusetts Water Resources Authority and the Boston Water and Sewer Commission
Massachusetts Water Resources Authority and the Brookline Department of Public Works – Water and Sewer Division
Massachusetts Water Resources Authority and the Chelsea Department of Public Works
Massachusetts Water Resources Authority and the Everett Water Department
Massachusetts Water Resources Authority and the Framingham Department of Public Works
Massachusetts Water Resources Authority and the Lexington Water and Sewer Division
Massachusetts Water Resources Authority and the Lynnfield Water District
Massachusetts Water Resources Authority and the Malden Department of Engineering, Planning, and Waterworks
Massachusetts Water Resources Authority and the Marblehead Water and Sewer Commission
Massachusetts Water Resources Authority and the Medford Department of Public Works
Massachusetts Water Resources Authority and the Melrose Department of Public Works
Massachusetts Water Resources Authority and the Milton Department of Public Works
Massachusetts Water Resources Authority and the Nahant Water Department
Massachusetts Water Resources Authority and the Newton Department of Public Works, Utilities Division
Massachusetts Water Resources Authority and the Northborough Department of Public Works
Massachusetts Water Resources Authority and the Norwood Department of Public Works
Massachusetts Water Resources Authority and the Quincy Department of Public Works
Massachusetts Water Resources Authority and the Reading Department of Public Works
Massachusetts Water Resources Authority and the Revere Department of Public Works
Massachusetts Water Resources Authority and the Saugus Public Works Department
Massachusetts Water Resources Authority and the Somerville Water Department
Massachusetts Water Resources Authority and the Southborough Department of Public Works
Massachusetts Water Resources Authority and the Stoneham Public Works Department
Massachusetts Water Resources Authority and the Swampscott Department of Public Works
Massachusetts Water Resources Authority and the Waltham Engineering Department, Water and Sewer Division
Massachusetts Water Resources Authorityand the Watertown Department of Public Works
Massachusetts Water Resources Authority and the Weston Department of Public Works
Massachusetts Water Resources Authority and the Winthrop Department of Public Works
PARTIAL
Massachusetts Water Resources Authority and the Bedford Department of Public Works
Massachusetts Water Resources Authority and the Canton Department of Public Works
Massachusetts Water Resources Authority and the Marlborough Department of Public Works
Massachusetts Water Resources Authority and the Needham Department of Public Works, Water Division
Massachusetts Water Resources Authority and the Peabody Department of Public Works
Massachusetts Water Resources Authority and the Wakefield Department of Public Works
Massachusetts Water Resources Authority and the Wilmington Water and Sewer Department
Massachusetts Water Resources Authorityand the Winchester Department of Public Works
Massachusetts Water Resources Authority and the Woburn Department of Public Works
CVA
Massachusetts Water Resources Authority and the Chicopee Water Dept., South Hadley F.D. #1, and Wilbraham Water Division
Your Drinking Water
Dear Customer, I am pleased to share with you the annual results of our water quality testing. Each year, MWRA takes hundreds of thousands of tests to ensure your water is safe and of the highest quality. In 2018, we again met every federal and state drinking water standard. Lead in drinking water is an important issue and we continue to make progress on reducing the risk by treating the water to make it less corrosive, and working with our member communities to identify and remove lead service lines. More information can be found on pages 4 and 5 of this report. Your water system is well protected – from the source reservoirs to the treatment plants to the storage tanks – and real-time water quality monitoring allows us to check the water every step of the way. We also have emergency plans for all of our facilities so we can quickly respond to any issue any time of day or night. Our emergency planning also includes redundancy for every part of the water system. We are currently working on two large pipeline projects to the north and south that will allow us to re-route the water in the event of a break so that your service will not be interrupted. Also, we have begun the initial design phase for two new water tunnels that will allow us to make repairs to the existing system. You will be hearing more about this in the coming years as the project gets underway. I hope you will take a few moments to read through this important report and learn more about your water system. We have great confidence in the water we deliver to your home and we want you to share that confidence. Please contact us if you have any questions about this report or any of MWRA’s programs. Sincerely,
Frederick A. LaskeyExecutive Director
Cover photo: Old Stone Church, Wachusett Reservoir
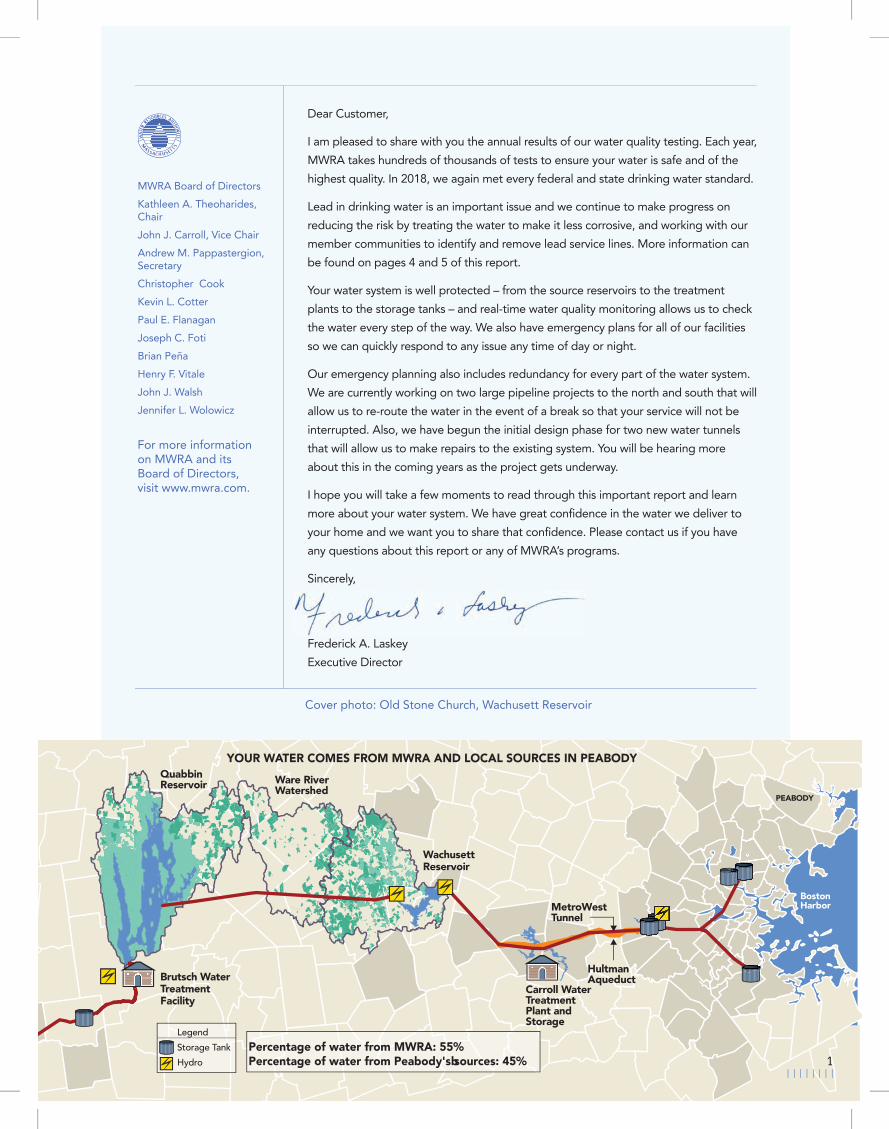
QuabbinReservoir Ware River
Watershed
Brutsch WaterTreatmentFacility
WachusettReservoir
MetroWestTunnel
Hultman Aqueduct
Carroll WaterTreatmentPlant andStorage
BostonHarbor
LegendStorage TankHydro 1
MWRA Board of DirectorsKathleen A. Theoharides,Chair John J. Carroll, Vice ChairAndrew M. Pappastergion, SecretaryChristopher CookKevin L. CotterPaul E. FlanaganJoseph C. FotiBrian PeñaHenry F. VitaleJohn J. WalshJennifer L. Wolowicz
For more information on MWRA and its Board of Directors, visit www.mwra.com.
YOUR WATER COMES FROM MWRA AND LOCAL SOURCES IN PEABODY
Percentage of water from MWRA: 55%Percentage of water from Peabody's bsources: 45%
PEABODY
Test Results After Treatment
2
KEY: MCL=Maximum Contaminant Level. The highest level of a contaminant allowed in water. MCLs are set as close to the MCLGs as feasible using the best available technology. MCLG=Maximum Contaminant Level Goal. The level of contaminant in drinking water below which there is no known or expected risk to health. MCLGs allow for a margin of safety. MRDL=Maximum Residual Disinfectant Level. The highest level of a disinfectant allowed in drinking water. There is convincing evidence that addition of a disinfectant is necessary for control of microbial contaminants. MRDLG=Maximum Residual Disinfectant Level Goal. The level of a drinking water disinfectant below which there is no known or expected health risk. MRDLGs do not reflect the benefits of the use of disinfectants to control microbial contamination. ppm=parts per million ppb=parts per billion ns=no standard ND=non detect ^=As required by DEP, the maximum result is reported for nitrate and nitrite, not the average. pCi/L=Picocuries/Liter *Result from 2014
Compound Units
(MCLG)IdealGoal
(MCL) HighestLevel
Allowed
(We Found)Detected
Level-Average How It Gets In The WaterRange Of
Detections Violation
BariumMono-ChloramineFluorideNitrate^Nitrite^Total TrihalomethanesHaloacetic Acids-5Total ColiformCombined Radium*
ppmppmppmppmppmppbppb%
pCi/L
24-MRDL
410180605%5
0.012.080.700.090.00616.416.7
1.4% (Sept)1.76
0.01-0.0110-3.8
0.31-0.780.05-0.09ND-0.0067.13-21.03.5-22.3ND-1.4%ND-1.76
24-MRDLG
4101nsns00
NoNoNoNoNoNoNoNoNo
Common mineral in natureWater disinfectantAdditive for dental healthAtmospheric depositionByproduct of water disinfectionByproduct of water disinfectionByproduct of water disinfectionNaturally present in environmentErosion of natural mineral deposits
MWRA Takes Customer ConcernsSeriously Every call is investi-gated to ensure that there are no problems with the water supply. Most complaints are related to discolored water, which is usually related to local construction or hydrant use. If you have a question or concern, please call your local water department or MWRA at 617-242-5323.
Why Your Water Tastes Great – High Quality Source Water
Your water comes from the Quabbin Reservoir, about 65 miles west of Boston, and the Wachusett Reservoir, about 35 miles west of Boston. Water from the Ware River can also add to the supply at times. These pristine reservoirs supply wholesale water to local water departments in 51 communi-ties. The two reservoirs combined supplied about 200 million gallons a day of high-quality water to consumers in 2018. Your water also comes from local water supplies. Please see page 7 for more information.
The Quabbin and Wachusett watersheds are naturally protected with over 85% of the water-sheds covered in forest and wetlands. To ensure safety, the streams and reservoirs are tested often and patrolled daily by the Department of Conservation and Recreation (DCR).
Rain and snow falling on the watersheds - protected land around the reservoirs - turn into streams that flow to the reservoirs. This water comes in contact with soil, rock, plants and other material as it follows its natural path to the reservoirs. While this process helps to clean the water, it can also dissolve and carry very small amounts of material, including radioactive material, into the reservoir. Minerals from soil and rock do not typically cause problems in the water. But water can also transport contaminants from human and animal activity. These can include bacteria and pathogens - some of which can cause illness. The test data in this report show that these contaminants are not a problem in your reservoirs' watersheds.
The Department of Environmental Protection (DEP) has prepared a Source Water Assessment Program report for the Quabbin and Wachusett Reservoirs. The DEP report commends DCR and MWRA on the existing source water protection
plans and states that our “watershed protection programs are very successful and greatly reduce the actual risk of contamination.” MWRA follows the report recommendations to maintain the pristine watershed areas. Your water also comes from local suplies that have a separate report.
Testing Your Water – Every Step Of The Way Test results show few contaminants are found in
the reservoir water. The few that are found are in very small amounts that are well below EPA's standards.
Turbidity (or cloudiness of the water) is one measure of overall water quality. All water must be below 5 NTU (Nephelometric Turbidity Units) and water can only be above 1 NTU if it does not interfere with effective disinfection. Typical levels at the Wachusett Reservoir are 0.34 NTU. In 2018, turbidity was always below EPA’s 5 NTU standard. It was also below the stricter Massachusetts standard of 1 NTU 99.99% of the time, with the highest level 2.9 NTU.
MWRA also tests reservoir water for pathogens such as fecal coliform, bacteria and the parasites Cryptosporidum and Giardia that can enter the water from animal or human waste. All test results were well within state and federal testing and treatment standards. For more information, please visit www.mwra.com/ucmr/2018.html.
Test Results – After TreatmentEPA and state regulations require many water
quality tests after treatment to check the water you are drinking. MWRA conducts hundreds of thousands of tests per year on over 120 contami-nants (a complete list is available on www.mwra.com). Details about 2018 test results are in the table below. The bottom line is the water quality is excellent. For results on your local water sources, please see page 7.
Why Your Water Tastes Great – Water Treatment
The MWRA has invested in state-of-the-art treatment to make sure your water is clean, fresh, and tastes great. Part of the reason that the water tastes so good is MWRA’s advanced treatment at the John J. Carroll Water Treatment Plant in Marlborough. Since 2005, your water has been treated with ozone - produced by pure oxygen. Ozone ensures strong protection against microbes and viruses, improves water clarity and makes the water taste better. In 2014, we also started using ultraviolet (UV) disinfection, further improving the quality of water. UV light is essentially a more potent form of the natural disinfection from sunlight and ensures that any pathogens poten-tially in our reservoirs are rendered harmless.
In addition, fluoride is added to promote dental health and the water chemistry is adjusted to reduce corrosion of home plumbing. Last, we add mono-chloramine, a mild and long-lasting disinfectant combining chlorine and ammonia to protect the water as it travels through miles of pipelines to your home. Your local water may have different treatment. Please see page 7.
Emergency Preparedness To confidently deliver the high-quality water you
expect, MWRA must be prepared for all situations. MWRA and DCR staff are out in the watersheds
every day walking the land, monitoring activities and protecting the source. Whether managing wildlife, rerouting road runoff away from the reservoir or regulating development activity, DCR’s biologists, engineers and planners are at work keeping the source water pristine.
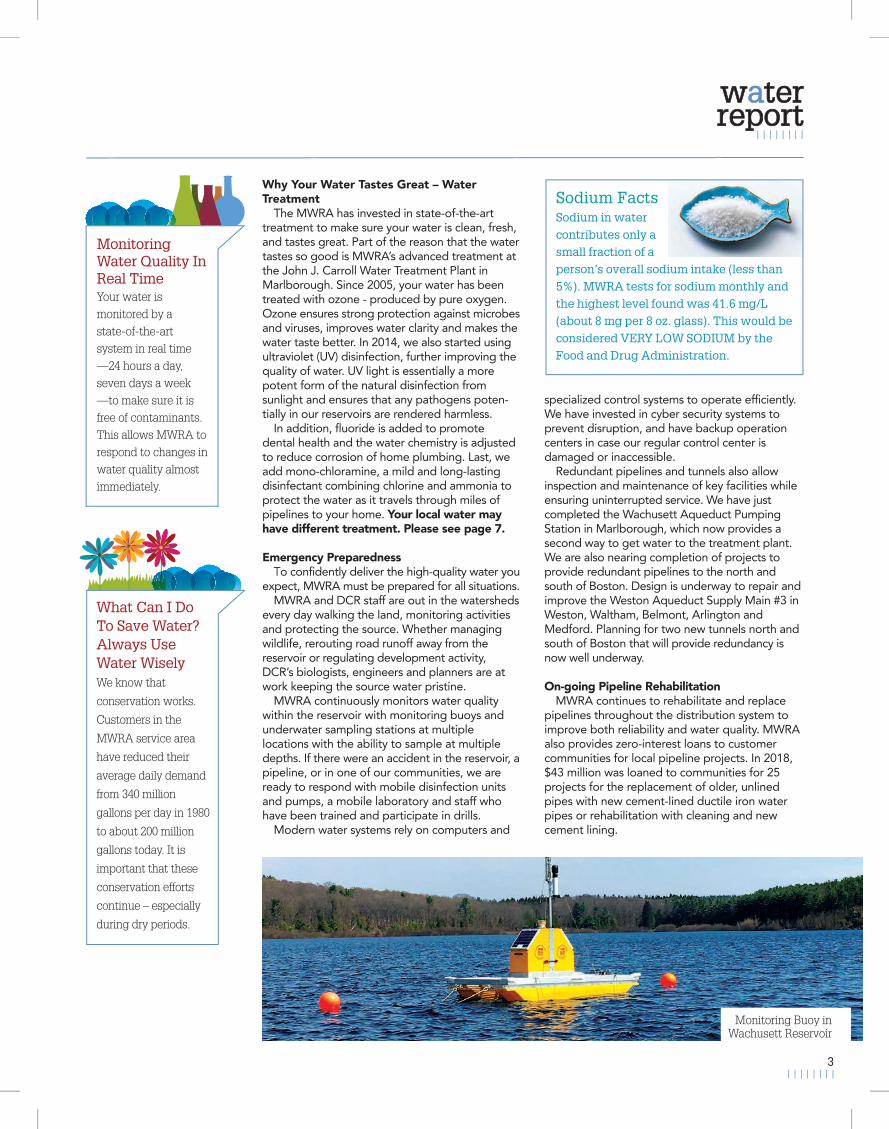
MWRA continuously monitors water quality within the reservoir with monitoring buoys and underwater sampling stations at multiple locations with the ability to sample at multiple depths. If there were an accident in the reservoir, a pipeline, or in one of our communities, we are ready to respond with mobile disinfection units and pumps, a mobile laboratory and staff who have been trained and participate in drills.
Modern water systems rely on computers and
specialized control systems to operate efficiently. We have invested in cyber security systems to prevent disruption, and have backup operation centers in case our regular control center is damaged or inaccessible.
Redundant pipelines and tunnels also allow inspection and maintenance of key facilities while ensuring uninterrupted service. We have just completed the Wachusett Aqueduct Pumping Station in Marlborough, which now provides a second way to get water to the treatment plant. We are also nearing completion of projects to provide redundant pipelines to the north and south of Boston. Design is underway to repair and improve the Weston Aqueduct Supply Main #3 in Weston, Waltham, Belmont, Arlington and Medford. Planning for two new tunnels north and south of Boston that will provide redundancy is now well underway.
On-going Pipeline RehabilitationMWRA continues to rehabilitate and replace
pipelines throughout the distribution system to improve both reliability and water quality. MWRA also provides zero-interest loans to customer communities for local pipeline projects. In 2018, $43 million was loaned to communities for 25 projects for the replacement of older, unlined pipes with new cement-lined ductile iron water pipes or rehabilitation with cleaning and new cement lining.
Monitoring Water Quality In Real Time Your water is monitored by a state-of-the-art system in real time —24 hours a day, seven days a week —to make sure it is free of contaminants. This allows MWRA to respond to changes in water quality almost immediately.
Sodium FactsSodium in water contributes only a small fraction of a person’s overall sodium intake (less than 5%). MWRA tests for sodium monthly and the highest level found was 41.6 mg/L (about 8 mg per 8 oz. glass). This would be considered VERY LOW SODIUM by the Food and Drug Administration.
3
What Can I Do To Save Water?Always Use Water WiselyWe know that
conservation works.
Customers in the
MWRA service area
have reduced their
average daily demand
from 340 million
gallons per day in 1980
to about 200 million
gallons today. It is
important that these
conservation efforts
continue – especially
during dry periods.
Monitoring Buoy inWachusett Reservoir
Why Your Water Tastes Great – High Quality Source Water
Your water comes from the Quabbin Reservoir, about 65 miles west of Boston, and the Wachusett Reservoir, about 35 miles west of Boston. Water from the Ware River can also add to the supply at times. These pristine reservoirs supply wholesale water to local water departments in 51 communi-ties. The two reservoirs combined supplied about 200 million gallons a day of high-quality water to consumers in 2018. Your water also comes from local water supplies. Please see page 7 for more information.
The Quabbin and Wachusett watersheds are naturally protected with over 85% of the water-sheds covered in forest and wetlands. To ensure safety, the streams and reservoirs are tested often and patrolled daily by the Department of Conservation and Recreation (DCR).
Rain and snow falling on the watersheds - protected land around the reservoirs - turn into streams that flow to the reservoirs. This water comes in contact with soil, rock, plants and other material as it follows its natural path to the reservoirs. While this process helps to clean the water, it can also dissolve and carry very small amounts of material, including radioactive material, into the reservoir. Minerals from soil and rock do not typically cause problems in the water. But water can also transport contaminants from human and animal activity. These can include bacteria and pathogens - some of which can cause illness. The test data in this report show that these contaminants are not a problem in your reservoirs' watersheds.
The Department of Environmental Protection (DEP) has prepared a Source Water Assessment Program report for the Quabbin and Wachusett Reservoirs. The DEP report commends DCR and MWRA on the existing source water protection
plans and states that our “watershed protection programs are very successful and greatly reduce the actual risk of contamination.” MWRA follows the report recommendations to maintain the pristine watershed areas. Your water also comes from local suplies that have a separate report.
Testing Your Water – Every Step Of The Way Test results show few contaminants are found in
the reservoir water. The few that are found are in very small amounts that are well below EPA's standards.
Turbidity (or cloudiness of the water) is one measure of overall water quality. All water must be below 5 NTU (Nephelometric Turbidity Units) and water can only be above 1 NTU if it does not interfere with effective disinfection. Typical levels at the Wachusett Reservoir are 0.34 NTU. In 2018, turbidity was always below EPA’s 5 NTU standard. It was also below the stricter Massachusetts standard of 1 NTU 99.99% of the time, with the highest level 2.9 NTU.
MWRA also tests reservoir water for pathogens such as fecal coliform, bacteria and the parasites Cryptosporidum and Giardia that can enter the water from animal or human waste. All test results were well within state and federal testing and treatment standards. For more information, please visit www.mwra.com/ucmr/2018.html.
Test Results – After TreatmentEPA and state regulations require many water
quality tests after treatment to check the water you are drinking. MWRA conducts hundreds of thousands of tests per year on over 120 contami-nants (a complete list is available on www.mwra.com). Details about 2018 test results are in the table below. The bottom line is the water quality is excellent. For results on your local water sources, please see page 7.
Why Your Water Tastes Great – Water Treatment
The MWRA has invested in state-of-the-art treatment to make sure your water is clean, fresh, and tastes great. Part of the reason that the water tastes so good is MWRA’s advanced treatment at the John J. Carroll Water Treatment Plant in Marlborough. Since 2005, your water has been treated with ozone - produced by pure oxygen. Ozone ensures strong protection against microbes and viruses, improves water clarity and makes the water taste better. In 2014, we also started using ultraviolet (UV) disinfection, further improving the quality of water. UV light is essentially a more potent form of the natural disinfection from sunlight and ensures that any pathogens poten-tially in our reservoirs are rendered harmless.
In addition, fluoride is added to promote dental health and the water chemistry is adjusted to reduce corrosion of home plumbing. Last, we add mono-chloramine, a mild and long-lasting disinfectant combining chlorine and ammonia to protect the water as it travels through miles of pipelines to your home. Your local water may have different treatment. Please see page 7.
Emergency Preparedness To confidently deliver the high-quality water you
expect, MWRA must be prepared for all situations. MWRA and DCR staff are out in the watersheds
every day walking the land, monitoring activities and protecting the source. Whether managing wildlife, rerouting road runoff away from the reservoir or regulating development activity, DCR’s biologists, engineers and planners are at work keeping the source water pristine.
MWRA continuously monitors water quality within the reservoir with monitoring buoys and underwater sampling stations at multiple locations with the ability to sample at multiple depths. If there were an accident in the reservoir, a pipeline, or in one of our communities, we are ready to respond with mobile disinfection units and pumps, a mobile laboratory and staff who have been trained and participate in drills.
Modern water systems rely on computers and
specialized control systems to operate efficiently. We have invested in cyber security systems to prevent disruption, and have backup operation centers in case our regular control center is damaged or inaccessible.
Redundant pipelines and tunnels also allow inspection and maintenance of key facilities while ensuring uninterrupted service. We have just completed the Wachusett Aqueduct Pumping Station in Marlborough, which now provides a second way to get water to the treatment plant. We are also nearing completion of projects to provide redundant pipelines to the north and south of Boston. Design is underway to repair and improve the Weston Aqueduct Supply Main #3 in Weston, Waltham, Belmont, Arlington and Medford. Planning for two new tunnels north and south of Boston that will provide redundancy is now well underway.
On-going Pipeline RehabilitationMWRA continues to rehabilitate and replace
pipelines throughout the distribution system to improve both reliability and water quality. MWRA also provides zero-interest loans to customer communities for local pipeline projects. In 2018, $43 million was loaned to communities for 25 projects for the replacement of older, unlined pipes with new cement-lined ductile iron water pipes or rehabilitation with cleaning and new cement lining.
Test Results After Treatment
2
KEY: MCL=Maximum Contaminant Level. The highest level of a contaminant allowed in water. MCLs are set as close to the MCLGs as feasible using the best available technology. MCLG=Maximum Contaminant Level Goal. The level of contaminant in drinking water below which there is no known or expected risk to health. MCLGs allow for a margin of safety. MRDL=Maximum Residual Disinfectant Level. The highest level of a disinfectant allowed in drinking water. There is convincing evidence that addition of a disinfectant is necessary for control of microbial contaminants. MRDLG=Maximum Residual Disinfectant Level Goal. The level of a drinking water disinfectant below which there is no known or expected health risk. MRDLGs do not reflect the benefits of the use of disinfectants to control microbial contamination. ppm=parts per million ppb=parts per billion ns=no standard ND=non detect ^=As required by DEP, the maximum result is reported for nitrate and nitrite, not the average. pCi/L=Picocuries/Liter *Result from 2014
Compound Units
(MCLG)IdealGoal
(MCL) HighestLevel
Allowed
(We Found)Detected
Level-Average How It Gets In The WaterRange Of
Detections Violation
BariumMono-ChloramineFluorideNitrate^Nitrite^Total TrihalomethanesHaloacetic Acids-5Total ColiformCombined Radium*
ppmppmppmppmppmppbppb%
pCi/L
24-MRDL
410180605%5
0.012.080.700.090.00616.416.7
1.4% (Sept)1.76
0.01-0.0110-3.8
0.31-0.780.05-0.09ND-0.0067.13-21.03.5-22.3ND-1.4%ND-1.76
24-MRDLG
4101nsns00
NoNoNoNoNoNoNoNoNo
Common mineral in natureWater disinfectantAdditive for dental healthAtmospheric depositionByproduct of water disinfectionByproduct of water disinfectionByproduct of water disinfectionNaturally present in environmentErosion of natural mineral deposits
MWRA Takes Customer ConcernsSeriously Every call is investi-gated to ensure that there are no problems with the water supply. Most complaints are related to discolored water, which is usually related to local construction or hydrant use. If you have a question or concern, please call your local water department or MWRA at 617-242-5323.
Why Your Water Tastes Great – High Quality Source Water
Your water comes from the Quabbin Reservoir, about 65 miles west of Boston, and the Wachusett Reservoir, about 35 miles west of Boston. Water from the Ware River can also add to the supply at times. These pristine reservoirs supply wholesale water to local water departments in 51 communi-ties. The two reservoirs combined supplied about 200 million gallons a day of high-quality water to consumers in 2018. Your water also comes from local water supplies. Please see page 7 for more information.
The Quabbin and Wachusett watersheds are naturally protected with over 85% of the water-sheds covered in forest and wetlands. To ensure safety, the streams and reservoirs are tested often and patrolled daily by the Department of Conservation and Recreation (DCR).
Rain and snow falling on the watersheds - protected land around the reservoirs - turn into streams that flow to the reservoirs. This water comes in contact with soil, rock, plants and other material as it follows its natural path to the reservoirs. While this process helps to clean the water, it can also dissolve and carry very small amounts of material, including radioactive material, into the reservoir. Minerals from soil and rock do not typically cause problems in the water. But water can also transport contaminants from human and animal activity. These can include bacteria and pathogens - some of which can cause illness. The test data in this report show that these contaminants are not a problem in your reservoirs' watersheds.
The Department of Environmental Protection (DEP) has prepared a Source Water Assessment Program report for the Quabbin and Wachusett Reservoirs. The DEP report commends DCR and MWRA on the existing source water protection
plans and states that our “watershed protection programs are very successful and greatly reduce the actual risk of contamination.” MWRA follows the report recommendations to maintain the pristine watershed areas. Your water also comes from local suplies that have a separate report.
Testing Your Water – Every Step Of The Way Test results show few contaminants are found in
the reservoir water. The few that are found are in very small amounts that are well below EPA's standards.
Turbidity (or cloudiness of the water) is one measure of overall water quality. All water must be below 5 NTU (Nephelometric Turbidity Units) and water can only be above 1 NTU if it does not interfere with effective disinfection. Typical levels at the Wachusett Reservoir are 0.34 NTU. In 2018, turbidity was always below EPA’s 5 NTU standard. It was also below the stricter Massachusetts standard of 1 NTU 99.99% of the time, with the highest level 2.9 NTU.
MWRA also tests reservoir water for pathogens such as fecal coliform, bacteria and the parasites Cryptosporidum and Giardia that can enter the water from animal or human waste. All test results were well within state and federal testing and treatment standards. For more information, please visit www.mwra.com/ucmr/2018.html.
Test Results – After TreatmentEPA and state regulations require many water
quality tests after treatment to check the water you are drinking. MWRA conducts hundreds of thousands of tests per year on over 120 contami-nants (a complete list is available on www.mwra.com). Details about 2018 test results are in the table below. The bottom line is the water quality is excellent. For results on your local water sources, please see page 7.
Why Your Water Tastes Great – Water Treatment
The MWRA has invested in state-of-the-art treatment to make sure your water is clean, fresh, and tastes great. Part of the reason that the water tastes so good is MWRA’s advanced treatment at the John J. Carroll Water Treatment Plant in Marlborough. Since 2005, your water has been treated with ozone - produced by pure oxygen. Ozone ensures strong protection against microbes and viruses, improves water clarity and makes the water taste better. In 2014, we also started using ultraviolet (UV) disinfection, further improving the quality of water. UV light is essentially a more potent form of the natural disinfection from sunlight and ensures that any pathogens poten-tially in our reservoirs are rendered harmless.
In addition, fluoride is added to promote dental health and the water chemistry is adjusted to reduce corrosion of home plumbing. Last, we add mono-chloramine, a mild and long-lasting disinfectant combining chlorine and ammonia to protect the water as it travels through miles of pipelines to your home. Your local water may have different treatment. Please see page 7.
Emergency Preparedness To confidently deliver the high-quality water you
expect, MWRA must be prepared for all situations. MWRA and DCR staff are out in the watersheds
every day walking the land, monitoring activities and protecting the source. Whether managing wildlife, rerouting road runoff away from the reservoir or regulating development activity, DCR’s biologists, engineers and planners are at work keeping the source water pristine.
MWRA continuously monitors water quality within the reservoir with monitoring buoys and underwater sampling stations at multiple locations with the ability to sample at multiple depths. If there were an accident in the reservoir, a pipeline, or in one of our communities, we are ready to respond with mobile disinfection units and pumps, a mobile laboratory and staff who have been trained and participate in drills.
Modern water systems rely on computers and
specialized control systems to operate efficiently. We have invested in cyber security systems to prevent disruption, and have backup operation centers in case our regular control center is damaged or inaccessible.
Redundant pipelines and tunnels also allow inspection and maintenance of key facilities while ensuring uninterrupted service. We have just completed the Wachusett Aqueduct Pumping Station in Marlborough, which now provides a second way to get water to the treatment plant. We are also nearing completion of projects to provide redundant pipelines to the north and south of Boston. Design is underway to repair and improve the Weston Aqueduct Supply Main #3 in Weston, Waltham, Belmont, Arlington and Medford. Planning for two new tunnels north and south of Boston that will provide redundancy is now well underway.
On-going Pipeline RehabilitationMWRA continues to rehabilitate and replace
pipelines throughout the distribution system to improve both reliability and water quality. MWRA also provides zero-interest loans to customer communities for local pipeline projects. In 2018, $43 million was loaned to communities for 25 projects for the replacement of older, unlined pipes with new cement-lined ductile iron water pipes or rehabilitation with cleaning and new cement lining.
Monitoring Water Quality In Real Time Your water is monitored by a state-of-the-art system in real time —24 hours a day, seven days a week —to make sure it is free of contaminants. This allows MWRA to respond to changes in water quality almost immediately.
Sodium FactsSodium in water contributes only a small fraction of a person’s overall sodium intake (less than 5%). MWRA tests for sodium monthly and the highest level found was 41.6 mg/L (about 8 mg per 8 oz. glass). This would be considered VERY LOW SODIUM by the Food and Drug Administration.
3
What Can I Do To Save Water?Always Use Water WiselyWe know that
conservation works.
Customers in the
MWRA service area
have reduced their
average daily demand
from 340 million
gallons per day in 1980
to about 200 million
gallons today. It is
important that these
conservation efforts
continue – especially
during dry periods.
Monitoring Buoy inWachusett Reservoir
Why Your Water Tastes Great – High Quality Source Water
Your water comes from the Quabbin Reservoir, about 65 miles west of Boston, and the Wachusett Reservoir, about 35 miles west of Boston. Water from the Ware River can also add to the supply at times. These pristine reservoirs supply wholesale water to local water departments in 51 communi-ties. The two reservoirs combined supplied about 200 million gallons a day of high-quality water to consumers in 2018. Your water also comes from local water supplies. Please see page 7 for more information.
The Quabbin and Wachusett watersheds are naturally protected with over 85% of the water-sheds covered in forest and wetlands. To ensure safety, the streams and reservoirs are tested often and patrolled daily by the Department of Conservation and Recreation (DCR).
Rain and snow falling on the watersheds - protected land around the reservoirs - turn into streams that flow to the reservoirs. This water comes in contact with soil, rock, plants and other material as it follows its natural path to the reservoirs. While this process helps to clean the water, it can also dissolve and carry very small amounts of material, including radioactive material, into the reservoir. Minerals from soil and rock do not typically cause problems in the water. But water can also transport contaminants from human and animal activity. These can include bacteria and pathogens - some of which can cause illness. The test data in this report show that these contaminants are not a problem in your reservoirs' watersheds.
The Department of Environmental Protection (DEP) has prepared a Source Water Assessment Program report for the Quabbin and Wachusett Reservoirs. The DEP report commends DCR and MWRA on the existing source water protection
plans and states that our “watershed protection programs are very successful and greatly reduce the actual risk of contamination.” MWRA follows the report recommendations to maintain the pristine watershed areas. Your water also comes from local suplies that have a separate report.
Testing Your Water – Every Step Of The Way Test results show few contaminants are found in
the reservoir water. The few that are found are in very small amounts that are well below EPA's standards.
Turbidity (or cloudiness of the water) is one measure of overall water quality. All water must be below 5 NTU (Nephelometric Turbidity Units) and water can only be above 1 NTU if it does not interfere with effective disinfection. Typical levels at the Wachusett Reservoir are 0.34 NTU. In 2018, turbidity was always below EPA’s 5 NTU standard. It was also below the stricter Massachusetts standard of 1 NTU 99.99% of the time, with the highest level 2.9 NTU.
MWRA also tests reservoir water for pathogens such as fecal coliform, bacteria and the parasites Cryptosporidum and Giardia that can enter the water from animal or human waste. All test results were well within state and federal testing and treatment standards. For more information, please visit www.mwra.com/ucmr/2018.html.
Test Results – After TreatmentEPA and state regulations require many water
quality tests after treatment to check the water you are drinking. MWRA conducts hundreds of thousands of tests per year on over 120 contami-nants (a complete list is available on www.mwra.com). Details about 2018 test results are in the table below. The bottom line is the water quality is excellent. For results on your local water sources, please see page 7.
Why Your Water Tastes Great – Water Treatment
The MWRA has invested in state-of-the-art treatment to make sure your water is clean, fresh, and tastes great. Part of the reason that the water tastes so good is MWRA’s advanced treatment at the John J. Carroll Water Treatment Plant in Marlborough. Since 2005, your water has been treated with ozone - produced by pure oxygen. Ozone ensures strong protection against microbes and viruses, improves water clarity and makes the water taste better. In 2014, we also started using ultraviolet (UV) disinfection, further improving the quality of water. UV light is essentially a more potent form of the natural disinfection from sunlight and ensures that any pathogens poten-tially in our reservoirs are rendered harmless.
In addition, fluoride is added to promote dental health and the water chemistry is adjusted to reduce corrosion of home plumbing. Last, we add mono-chloramine, a mild and long-lasting disinfectant combining chlorine and ammonia to protect the water as it travels through miles of pipelines to your home. Your local water may have different treatment. Please see page 7.
Emergency Preparedness To confidently deliver the high-quality water you
expect, MWRA must be prepared for all situations. MWRA and DCR staff are out in the watersheds
every day walking the land, monitoring activities and protecting the source. Whether managing wildlife, rerouting road runoff away from the reservoir or regulating development activity, DCR’s biologists, engineers and planners are at work keeping the source water pristine.
MWRA continuously monitors water quality within the reservoir with monitoring buoys and underwater sampling stations at multiple locations with the ability to sample at multiple depths. If there were an accident in the reservoir, a pipeline, or in one of our communities, we are ready to respond with mobile disinfection units and pumps, a mobile laboratory and staff who have been trained and participate in drills.
Modern water systems rely on computers and
specialized control systems to operate efficiently. We have invested in cyber security systems to prevent disruption, and have backup operation centers in case our regular control center is damaged or inaccessible.
Redundant pipelines and tunnels also allow inspection and maintenance of key facilities while ensuring uninterrupted service. We have just completed the Wachusett Aqueduct Pumping Station in Marlborough, which now provides a second way to get water to the treatment plant. We are also nearing completion of projects to provide redundant pipelines to the north and south of Boston. Design is underway to repair and improve the Weston Aqueduct Supply Main #3 in Weston, Waltham, Belmont, Arlington and Medford. Planning for two new tunnels north and south of Boston that will provide redundancy is now well underway.
On-going Pipeline RehabilitationMWRA continues to rehabilitate and replace
pipelines throughout the distribution system to improve both reliability and water quality. MWRA also provides zero-interest loans to customer communities for local pipeline projects. In 2018, $43 million was loaned to communities for 25 projects for the replacement of older, unlined pipes with new cement-lined ductile iron water pipes or rehabilitation with cleaning and new cement lining.
What You Need To Know About Lead In Tap Water
MWRA water is lead-free when it leaves the reservoirs. MWRA and local pipes that carry the water to your community are made mostly of iron and steel and do not add lead to the water. However, lead can get into tap water through pipes in your home, your service line if it is made of lead, lead solder used in plumbing, and some brass fixtures. Corrosion or wearing away of lead-based materials can add lead to tap water, especially if water sits for a long time in the pipes before it is used.
In 1996, MWRA began adding sodium carbonate and carbon dioxide to adjust the water's pH and buffering capacity. This change has made the water less corrosive, thereby reducing the leaching of lead into drinking water. Lead levels found in sample tests of tap water have dropped by about 80 percent since this treatment change.
MWRA’s water system has been below the Lead Action Level for over a decade. Of the nearly 2,300 samples taken in the last 5 years, 98% were below the 15 ppb level.
MWRA Meets Lead Standard In 2018Under EPA rules, each year MWRA and your
local water department must test tap water in a sample of homes that are likely to have high lead levels. These are usually homes with lead service lines or lead solder. The EPA rule requires that 9 out of 10, or 90%, of the sampled homes must have lead levels below the Action Level of 15 parts per billion (ppb).
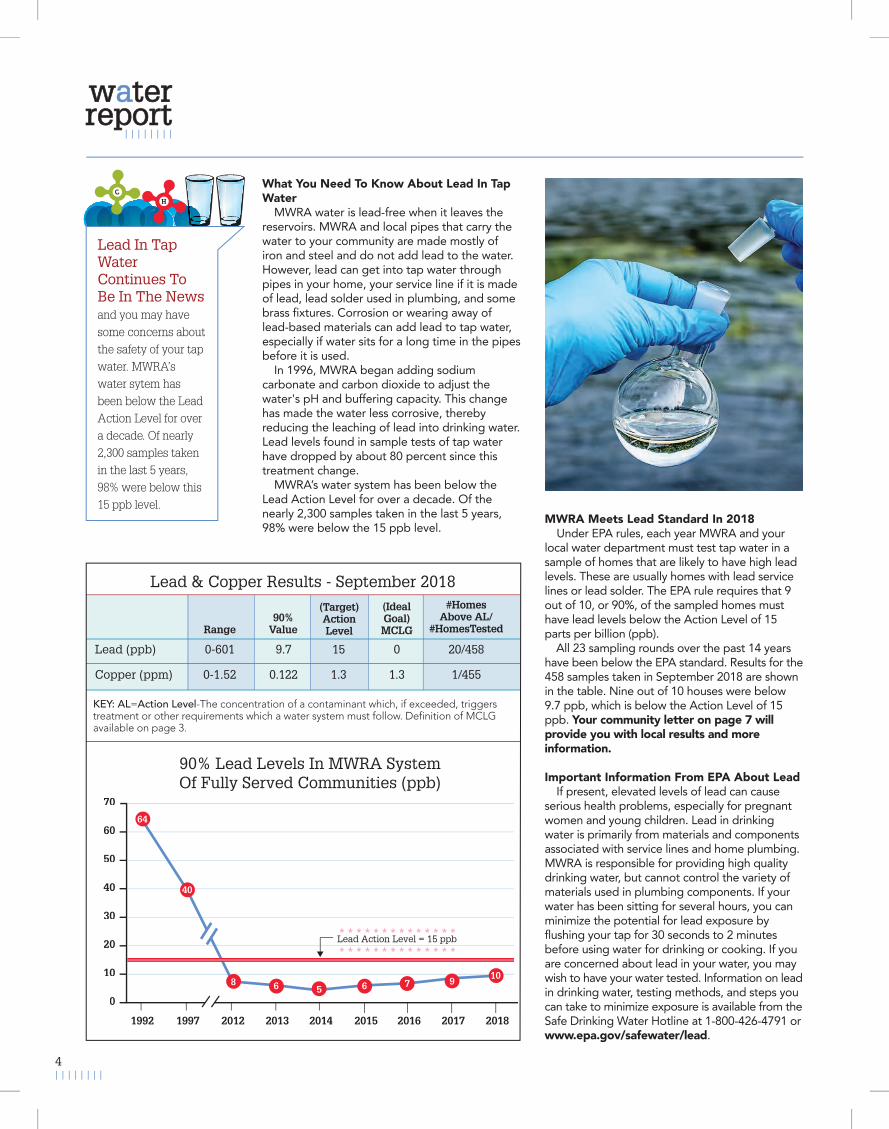
All 23 sampling rounds over the past 14 years have been below the EPA standard. Results for the 458 samples taken in September 2018 are shown in the table. Nine out of 10 houses were below 9.7 ppb, which is below the Action Level of 15 ppb. Your community letter on page 7 will provide you with local results and more information.
Important Information From EPA About LeadIf present, elevated levels of lead can cause
serious health problems, especially for pregnant women and young children. Lead in drinking water is primarily from materials and components associated with service lines and home plumbing. MWRA is responsible for providing high quality drinking water, but cannot control the variety of materials used in plumbing components. If your water has been sitting for several hours, you can minimize the potential for lead exposure by flushing your tap for 30 seconds to 2 minutes before using water for drinking or cooking. If you are concerned about lead in your water, you may wish to have your water tested. Information on lead in drinking water, testing methods, and steps you can take to minimize exposure is available from the Safe Drinking Water Hotline at 1-800-426-4791 or www.epa.gov/safewater/lead.
4
Lead In Tap WaterContinues To Be In The Newsand you may have some concerns about the safety of your tap water. MWRA’s water sytem has been below the Lead Action Level for over a decade. Of nearly 2,300 samples taken in the last 5 years, 98% were below this 15 ppb level.
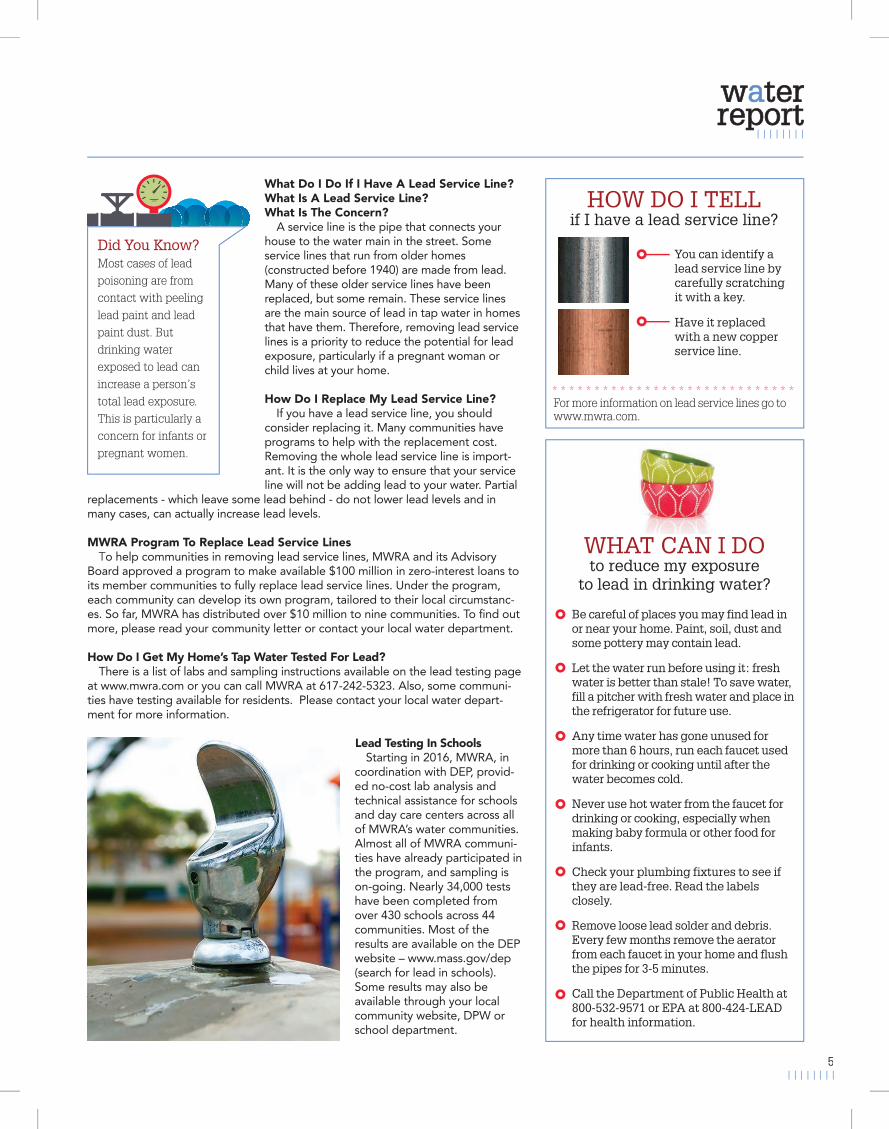
What Do I Do If I Have A Lead Service Line? What Is A Lead Service Line? What Is The Concern?
A service line is the pipe that connects your house to the water main in the street. Some service lines that run from older homes (constructed before 1940) are made from lead. Many of these older service lines have been replaced, but some remain. These service lines are the main source of lead in tap water in homes that have them. Therefore, removing lead service lines is a priority to reduce the potential for lead exposure, particularly if a pregnant woman or child lives at your home.
How Do I Replace My Lead Service Line? If you have a lead service line, you should
consider replacing it. Many communities have programs to help with the replacement cost. Removing the whole lead service line is import-ant. It is the only way to ensure that your service line will not be adding lead to your water. Partial
replacements - which leave some lead behind - do not lower lead levels and in many cases, can actually increase lead levels.
MWRA Program To Replace Lead Service LinesTo help communities in removing lead service lines, MWRA and its Advisory
Board approved a program to make available $100 million in zero-interest loans to its member communities to fully replace lead service lines. Under the program, each community can develop its own program, tailored to their local circumstanc-es. So far, MWRA has distributed over $10 million to nine communities. To find out more, please read your community letter or contact your local water department.
How Do I Get My Home’s Tap Water Tested For Lead?There is a list of labs and sampling instructions available on the lead testing page
at www.mwra.com or you can call MWRA at 617-242-5323. Also, some communi-ties have testing available for residents. Please contact your local water depart-ment for more information.
Lead Testing In Schools Starting in 2016, MWRA, in
coordination with DEP, provid-ed no-cost lab analysis and technical assistance for schools and day care centers across all of MWRA’s water communities. Almost all of MWRA communi-ties have already participated in the program, and sampling is on-going. Nearly 34,000 tests have been completed from over 430 schools across 44 communities. Most of the results are available on the DEP website – www.mass.gov/dep (search for lead in schools). Some results may also be available through your local community website, DPW or school department.
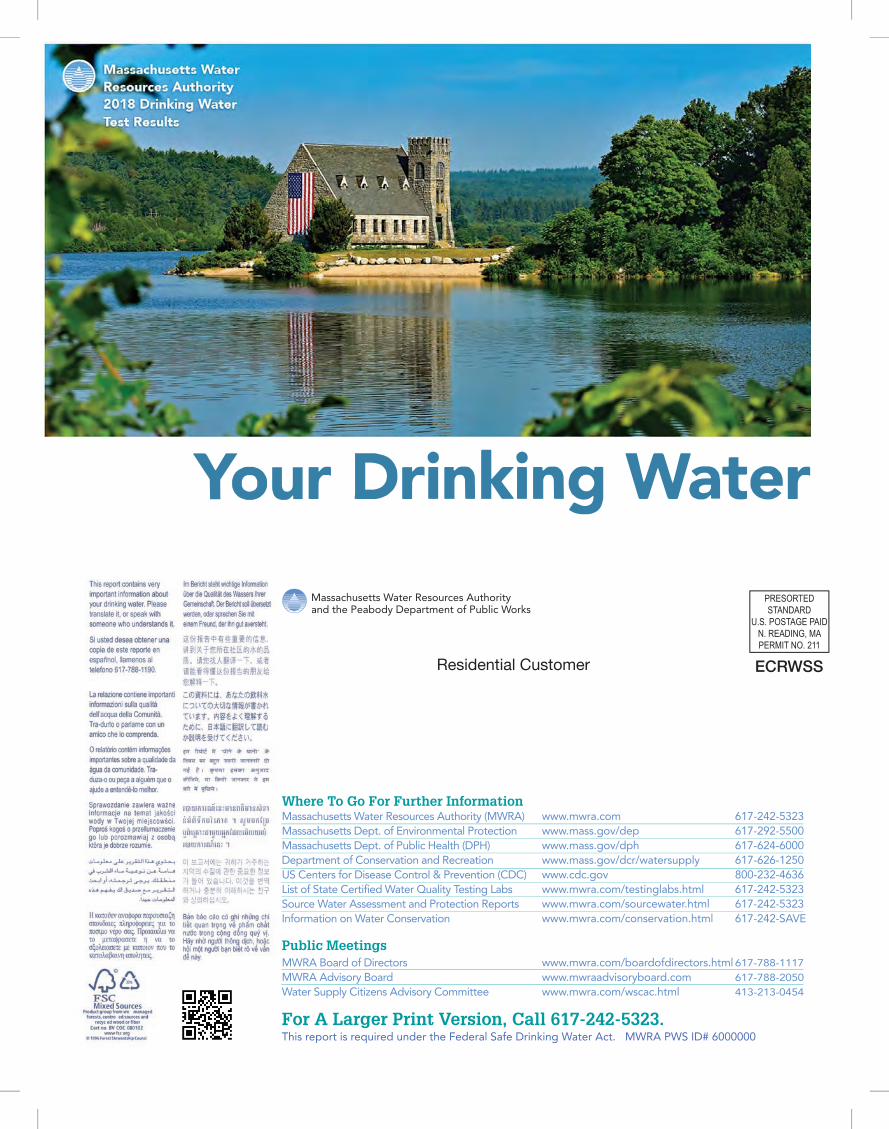
Lead & Copper Results - September 2018
70
60
50
40
30
20
10
0
1992 1997 2012 2013 2014 2015 2016 2017 2018
Lead (ppb)
Copper (ppm)
0-601
0-1.52
9.7
0.122
15
1.3
0
1.3
20/458
1/455
KEY: AL=Action Level-The concentration of a contaminant which, if exceeded, triggers treatment or other requirements which a water system must follow. Definition of MCLG available on page 3.
Range90%
Value
(Target)ActionLevel
(IdealGoal)MCLG
#HomesAbove AL/
#HomesTested
Lead Action Level = 15 ppb
90% Lead Levels In MWRA SystemOf Fully Served Communities (ppb)
64
40
8 6 5 6 7 910
What You Need To Know About Lead In Tap Water
MWRA water is lead-free when it leaves the reservoirs. MWRA and local pipes that carry the water to your community are made mostly of iron and steel and do not add lead to the water. However, lead can get into tap water through pipes in your home, your service line if it is made of lead, lead solder used in plumbing, and some brass fixtures. Corrosion or wearing away of lead-based materials can add lead to tap water, especially if water sits for a long time in the pipes before it is used.
In 1996, MWRA began adding sodium carbonate and carbon dioxide to adjust the water's pH and buffering capacity. This change has made the water less corrosive, thereby reducing the leaching of lead into drinking water. Lead levels found in sample tests of tap water have dropped by about 80 percent since this treatment change.
MWRA’s water system has been below the Lead Action Level for over a decade. Of the nearly 2,300 samples taken in the last 5 years, 98% were below the 15 ppb level.
MWRA Meets Lead Standard In 2018Under EPA rules, each year MWRA and your
local water department must test tap water in a sample of homes that are likely to have high lead levels. These are usually homes with lead service lines or lead solder. The EPA rule requires that 9 out of 10, or 90%, of the sampled homes must have lead levels below the Action Level of 15 parts per billion (ppb).
All 23 sampling rounds over the past 14 years have been below the EPA standard. Results for the 458 samples taken in September 2018 are shown in the table. Nine out of 10 houses were below 9.7 ppb, which is below the Action Level of 15 ppb. Your community letter on page 7 will provide you with local results and more information.
Important Information From EPA About LeadIf present, elevated levels of lead can cause
serious health problems, especially for pregnant women and young children. Lead in drinking water is primarily from materials and components associated with service lines and home plumbing. MWRA is responsible for providing high quality drinking water, but cannot control the variety of materials used in plumbing components. If your water has been sitting for several hours, you can minimize the potential for lead exposure by flushing your tap for 30 seconds to 2 minutes before using water for drinking or cooking. If you are concerned about lead in your water, you may wish to have your water tested. Information on lead in drinking water, testing methods, and steps you can take to minimize exposure is available from the Safe Drinking Water Hotline at 1-800-426-4791 or www.epa.gov/safewater/lead.
WHAT CAN I DOto reduce my exposure
to lead in drinking water?
HOW DO I TELLif I have a lead service line?
Be careful of places you may find lead in or near your home. Paint, soil, dust and some pottery may contain lead.
Let the water run before using it: fresh water is better than stale! To save water, fill a pitcher with fresh water and place in the refrigerator for future use.
Any time water has gone unused for more than 6 hours, run each faucet used for drinking or cooking until after the water becomes cold.
Never use hot water from the faucet for drinking or cooking, especially when making baby formula or other food for infants.
Check your plumbing fixtures to see if they are lead-free. Read the labels closely.
Remove loose lead solder and debris. Every few months remove the aerator from each faucet in your home and flush the pipes for 3-5 minutes.
Call the Department of Public Health at 800-532-9571 or EPA at 800-424-LEAD for health information.
You can identify a lead service line by carefully scratching it with a key.
Have it replaced with a new copper service line.
For more information on lead service lines go to www.mwra.com.
What Do I Do If I Have A Lead Service Line? What Is A Lead Service Line? What Is The Concern?
A service line is the pipe that connects your house to the water main in the street. Some service lines that run from older homes (constructed before 1940) are made from lead. Many of these older service lines have been replaced, but some remain. These service lines are the main source of lead in tap water in homes that have them. Therefore, removing lead service lines is a priority to reduce the potential for lead exposure, particularly if a pregnant woman or child lives at your home.
How Do I Replace My Lead Service Line? If you have a lead service line, you should
consider replacing it. Many communities have programs to help with the replacement cost. Removing the whole lead service line is import-ant. It is the only way to ensure that your service line will not be adding lead to your water. Partial
replacements - which leave some lead behind - do not lower lead levels and in many cases, can actually increase lead levels.
MWRA Program To Replace Lead Service LinesTo help communities in removing lead service lines, MWRA and its Advisory
Board approved a program to make available $100 million in zero-interest loans to its member communities to fully replace lead service lines. Under the program, each community can develop its own program, tailored to their local circumstanc-es. So far, MWRA has distributed over $10 million to nine communities. To find out more, please read your community letter or contact your local water department.
How Do I Get My Home’s Tap Water Tested For Lead?There is a list of labs and sampling instructions available on the lead testing page
at www.mwra.com or you can call MWRA at 617-242-5323. Also, some communi-ties have testing available for residents. Please contact your local water depart-ment for more information.
Lead Testing In Schools Starting in 2016, MWRA, in
coordination with DEP, provid-ed no-cost lab analysis and technical assistance for schools and day care centers across all of MWRA’s water communities. Almost all of MWRA communi-ties have already participated in the program, and sampling is on-going. Nearly 34,000 tests have been completed from over 430 schools across 44 communities. Most of the results are available on the DEP website – www.mass.gov/dep (search for lead in schools). Some results may also be available through your local community website, DPW or school department.
Did You Know?Most cases of lead poisoning are from contact with peeling lead paint and lead paint dust. But drinking water exposed to lead can increase a person’s total lead exposure. This is particularly a concern for infants or pregnant women.
What You Need To Know About Lead In Tap Water
MWRA water is lead-free when it leaves the reservoirs. MWRA and local pipes that carry the water to your community are made mostly of iron and steel and do not add lead to the water. However, lead can get into tap water through pipes in your home, your service line if it is made of lead, lead solder used in plumbing, and some brass fixtures. Corrosion or wearing away of lead-based materials can add lead to tap water, especially if water sits for a long time in the pipes before it is used.
In 1996, MWRA began adding sodium carbonate and carbon dioxide to adjust the water's pH and buffering capacity. This change has made the water less corrosive, thereby reducing the leaching of lead into drinking water. Lead levels found in sample tests of tap water have dropped by about 80 percent since this treatment change.
MWRA’s water system has been below the Lead Action Level for over a decade. Of the nearly 2,300 samples taken in the last 5 years, 98% were below the 15 ppb level.
MWRA Meets Lead Standard In 2018Under EPA rules, each year MWRA and your
local water department must test tap water in a sample of homes that are likely to have high lead levels. These are usually homes with lead service lines or lead solder. The EPA rule requires that 9 out of 10, or 90%, of the sampled homes must have lead levels below the Action Level of 15 parts per billion (ppb).
All 23 sampling rounds over the past 14 years have been below the EPA standard. Results for the 458 samples taken in September 2018 are shown in the table. Nine out of 10 houses were below 9.7 ppb, which is below the Action Level of 15 ppb. Your community letter on page 7 will provide you with local results and more information.
Important Information From EPA About LeadIf present, elevated levels of lead can cause
serious health problems, especially for pregnant women and young children. Lead in drinking water is primarily from materials and components associated with service lines and home plumbing. MWRA is responsible for providing high quality drinking water, but cannot control the variety of materials used in plumbing components. If your water has been sitting for several hours, you can minimize the potential for lead exposure by flushing your tap for 30 seconds to 2 minutes before using water for drinking or cooking. If you are concerned about lead in your water, you may wish to have your water tested. Information on lead in drinking water, testing methods, and steps you can take to minimize exposure is available from the Safe Drinking Water Hotline at 1-800-426-4791 or www.epa.gov/safewater/lead.
4
Lead In Tap WaterContinues To Be In The Newsand you may have some concerns about the safety of your tap water. MWRA’s water sytem has been below the Lead Action Level for over a decade. Of nearly 2,300 samples taken in the last 5 years, 98% were below this 15 ppb level.
What Do I Do If I Have A Lead Service Line? What Is A Lead Service Line? What Is The Concern?
A service line is the pipe that connects your house to the water main in the street. Some service lines that run from older homes (constructed before 1940) are made from lead. Many of these older service lines have been replaced, but some remain. These service lines are the main source of lead in tap water in homes that have them. Therefore, removing lead service lines is a priority to reduce the potential for lead exposure, particularly if a pregnant woman or child lives at your home.
How Do I Replace My Lead Service Line? If you have a lead service line, you should
consider replacing it. Many communities have programs to help with the replacement cost. Removing the whole lead service line is import-ant. It is the only way to ensure that your service line will not be adding lead to your water. Partial
replacements - which leave some lead behind - do not lower lead levels and in many cases, can actually increase lead levels.
MWRA Program To Replace Lead Service LinesTo help communities in removing lead service lines, MWRA and its Advisory
Board approved a program to make available $100 million in zero-interest loans to its member communities to fully replace lead service lines. Under the program, each community can develop its own program, tailored to their local circumstanc-es. So far, MWRA has distributed over $10 million to nine communities. To find out more, please read your community letter or contact your local water department.
How Do I Get My Home’s Tap Water Tested For Lead?There is a list of labs and sampling instructions available on the lead testing page
at www.mwra.com or you can call MWRA at 617-242-5323. Also, some communi-ties have testing available for residents. Please contact your local water depart-ment for more information.
Lead Testing In Schools Starting in 2016, MWRA, in
coordination with DEP, provid-ed no-cost lab analysis and technical assistance for schools and day care centers across all of MWRA’s water communities. Almost all of MWRA communi-ties have already participated in the program, and sampling is on-going. Nearly 34,000 tests have been completed from over 430 schools across 44 communities. Most of the results are available on the DEP website – www.mass.gov/dep (search for lead in schools). Some results may also be available through your local community website, DPW or school department.
Lead & Copper Results - September 2018
1992 1997 2012 2013 2014 2015 2016 2017 2018
Lead (ppb)
Copper (ppm)
0-601
0-1.52
9.7
0.122
15
1.3
0
1.3
20/458
1/455
KEY: AL=Action Level-The concentration of a contaminant which, if exceeded, triggers treatment or other requirements which a water system must follow. Definition of MCLG available on page 3.
Range90%
Value
(Target)ActionLevel
(IdealGoal)MCLG
#HomesAbove AL/
#HomesTested
Lead Action Level = 15 ppb
90% Lead Levels In MWRA SystemOf Fully Served Communities (ppb)
64
40
8 6 5 6 7 910
What You Need To Know About Lead In Tap Water
MWRA water is lead-free when it leaves the reservoirs. MWRA and local pipes that carry the water to your community are made mostly of iron and steel and do not add lead to the water. However, lead can get into tap water through pipes in your home, your service line if it is made of lead, lead solder used in plumbing, and some brass fixtures. Corrosion or wearing away of lead-based materials can add lead to tap water, especially if water sits for a long time in the pipes before it is used.
In 1996, MWRA began adding sodium carbonate and carbon dioxide to adjust the water's pH and buffering capacity. This change has made the water less corrosive, thereby reducing the leaching of lead into drinking water. Lead levels found in sample tests of tap water have dropped by about 80 percent since this treatment change.
MWRA’s water system has been below the Lead Action Level for over a decade. Of the nearly 2,300 samples taken in the last 5 years, 98% were below the 15 ppb level.
MWRA Meets Lead Standard In 2018Under EPA rules, each year MWRA and your
local water department must test tap water in a sample of homes that are likely to have high lead levels. These are usually homes with lead service lines or lead solder. The EPA rule requires that 9 out of 10, or 90%, of the sampled homes must have lead levels below the Action Level of 15 parts per billion (ppb).
All 23 sampling rounds over the past 14 years have been below the EPA standard. Results for the 458 samples taken in September 2018 are shown in the table. Nine out of 10 houses were below 9.7 ppb, which is below the Action Level of 15 ppb. Your community letter on page 7 will provide you with local results and more information.
Important Information From EPA About LeadIf present, elevated levels of lead can cause
serious health problems, especially for pregnant women and young children. Lead in drinking water is primarily from materials and components associated with service lines and home plumbing. MWRA is responsible for providing high quality drinking water, but cannot control the variety of materials used in plumbing components. If your water has been sitting for several hours, you can minimize the potential for lead exposure by flushing your tap for 30 seconds to 2 minutes before using water for drinking or cooking. If you are concerned about lead in your water, you may wish to have your water tested. Information on lead in drinking water, testing methods, and steps you can take to minimize exposure is available from the Safe Drinking Water Hotline at 1-800-426-4791 or www.epa.gov/safewater/lead.
WHAT CAN I DOto reduce my exposure
to lead in drinking water?
HOW DO I TELLif I have a lead service line?
Be careful of places you may find lead in or near your home. Paint, soil, dust and some pottery may contain lead.
Let the water run before using it: fresh water is better than stale! To save water, fill a pitcher with fresh water and place in the refrigerator for future use.
Any time water has gone unused for more than 6 hours, run each faucet used for drinking or cooking until after the water becomes cold.
Never use hot water from the faucet for drinking or cooking, especially when making baby formula or other food for infants.
Check your plumbing fixtures to see if they are lead-free. Read the labels closely.
Remove loose lead solder and debris. Every few months remove the aerator from each faucet in your home and flush the pipes for 3-5 minutes.
Call the Department of Public Health at 800-532-9571 or EPA at 800-424-LEAD for health information.
You can identify a lead service line by carefully scratching it with a key.
Have it replaced with a new copper service line.
For more information on lead service lines go to www.mwra.com.
What Do I Do If I Have A Lead Service Line? What Is A Lead Service Line? What Is The Concern?
A service line is the pipe that connects your house to the water main in the street. Some service lines that run from older homes (constructed before 1940) are made from lead. Many of these older service lines have been replaced, but some remain. These service lines are the main source of lead in tap water in homes that have them. Therefore, removing lead service lines is a priority to reduce the potential for lead exposure, particularly if a pregnant woman or child lives at your home.
How Do I Replace My Lead Service Line? If you have a lead service line, you should
consider replacing it. Many communities have programs to help with the replacement cost. Removing the whole lead service line is import-ant. It is the only way to ensure that your service line will not be adding lead to your water. Partial
replacements - which leave some lead behind - do not lower lead levels and in many cases, can actually increase lead levels.
MWRA Program To Replace Lead Service LinesTo help communities in removing lead service lines, MWRA and its Advisory
Board approved a program to make available $100 million in zero-interest loans to its member communities to fully replace lead service lines. Under the program, each community can develop its own program, tailored to their local circumstanc-es. So far, MWRA has distributed over $10 million to nine communities. To find out more, please read your community letter or contact your local water department.
How Do I Get My Home’s Tap Water Tested For Lead?There is a list of labs and sampling instructions available on the lead testing page
at www.mwra.com or you can call MWRA at 617-242-5323. Also, some communi-ties have testing available for residents. Please contact your local water depart-ment for more information.
Lead Testing In Schools Starting in 2016, MWRA, in
coordination with DEP, provid-ed no-cost lab analysis and technical assistance for schools and day care centers across all of MWRA’s water communities. Almost all of MWRA communi-ties have already participated in the program, and sampling is on-going. Nearly 34,000 tests have been completed from over 430 schools across 44 communities. Most of the results are available on the DEP website – www.mass.gov/dep (search for lead in schools). Some results may also be available through your local community website, DPW or school department.
5
Did You Know?Most cases of lead poisoning are from contact with peeling lead paint and lead paint dust. But drinking water exposed to lead can increase a person’s total lead exposure. This is particularly a concern for infants or pregnant women.
Tests In Community PipesMWRA and local water departments test 300
to 500 water samples each week for total coliform bacteria. Total coliform bacteria can come from the intestines of warm-blooded animals, or can be found in soil, plants, or other places. Most of the time, they are not harmful. However, their presence could signal that harmful bacteria from fecal waste may be there as well. If total coliform is detected in more than 5% of samples in a month, the water system is required to investigate the possible source and fix any identified problems. If a water sample does test positive, we run more specific tests for E.coli, which is a bacteria found in human and animal fecal waste and may cause illness. If your community found any total coliform or E.coli, it will be listed within the community letter on page 7.
Drinking Water And People With Weakened Immune Systems
Some people may be more vulnerable to contaminants in drinking water than the general population. Immuno-compromised persons such as persons with cancer undergoing chemotherapy, persons who have undergone organ transplants, people with HIV/AIDS or other immune system disorders, some elderly, and infants can be
particularly at risk from infections. These people should seek advice about drinking water from their health care providers. EPA/CDC guidelines on appropriate means to lessen the risk of infection by Cryptosporidium and other microbial contaminants are available from the EPA's Safe Drinking Water Hotline (1-800-426-4791).
Contaminants In Bottled Water And Tap WaterDrinking water, including bottled water, may
reasonably be expected to contain at least small amounts of some contaminants. The presence of contaminants does not necessarily indicate that water poses a health risk. More information about contaminants and potential health effects can be obtained by calling the EPA’s Safe Drinking Water Hotline (1-800-426-4791) or MWRA. In order to ensure that tap water is safe to drink, the Massachusetts DEP and EPA prescribe regulations which limit the amount of certain contaminants in water provided by public water systems. U.S. Food and Drug Administra-tion (FDA) and the Massachusetts Department of Public Health regulations establish limits for contaminants in bottled water which must provide the same protection for public health.
Research For New RegulationsMWRA has been working with EPA and other
researchers to define new national drinking water standards by testing for unregulated contaminants. To read more about these regulations, and to see a listing of what was found in MWRA water, please visit www.mwra.com/UCMR/2018.
Cross Connection InformationMassachusetts DEP recommends the installation of backflow prevention devices for inside and outside hose connections to help protect the water in your home as well as the drinking
water system in your town. For more information on cross connections, please call 617-242-5325 or visit mwra.com/crosscon.
6
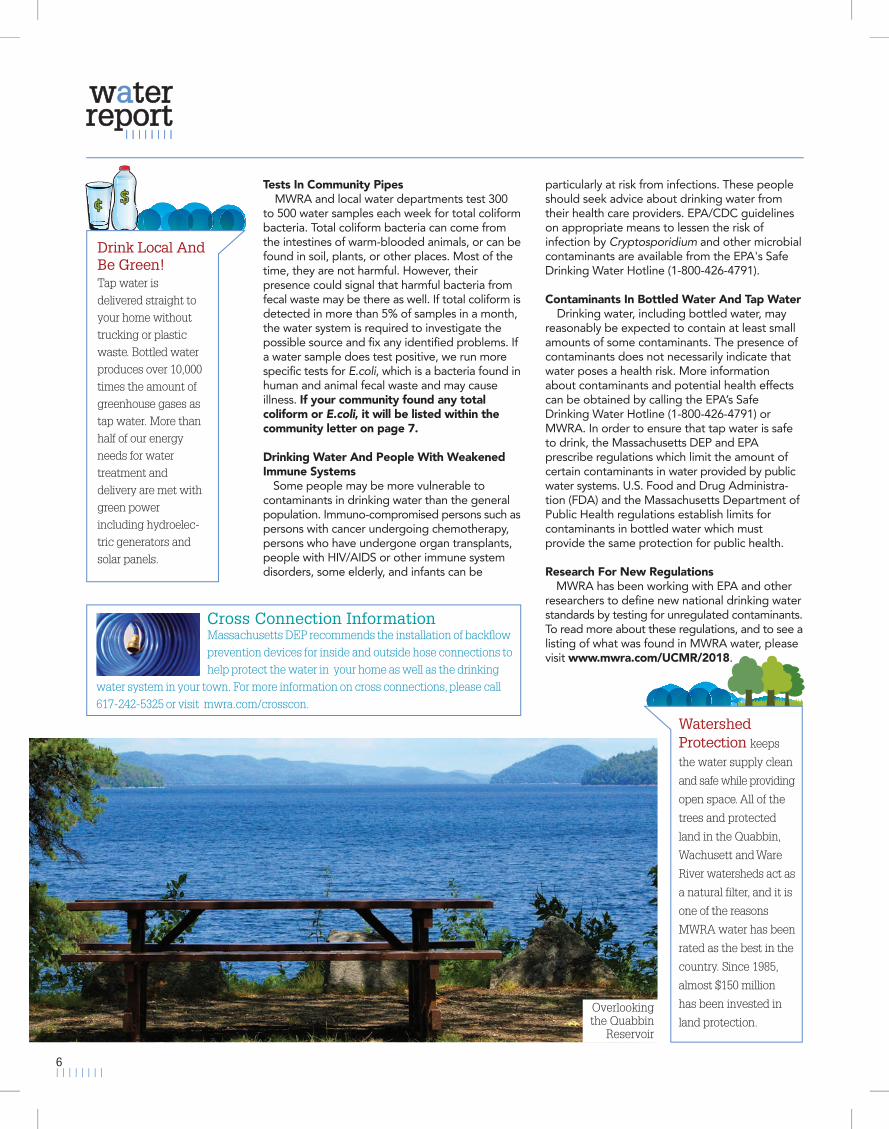
Watershed Protection keeps
the water supply clean
and safe while providing
open space. All of the
trees and protected
land in the Quabbin,
Wachusett and Ware
River watersheds act as
a natural filter, and it is
one of the reasons
MWRA water has been
rated as the best in the
country. Since 1985,
almost $150 million
has been invested in
land protection.
Drink Local And Be Green! Tap water is delivered straight to your home without trucking or plastic waste. Bottled water produces over 10,000 times the amount of greenhouse gases as tap water. More than half of our energy needs for water treatment and delivery are met with green power including hydroelec-tric generators and solar panels.
Overlookingthe Quabbin
Reservoir
Common mineral in natureAdditive for dental healthErosion of natural depositsNaturally present in the environmentSoil runoff
Common mineral in natureAdditive for dental healthErosion of natural depositsNaturally present in the environmentSoil runoff
Naturally present in the environmentWater disinfectantErosion of natural depositsBy-product of disinfectantBy-product of disinfectantBy-product of disinfectant
Dear Customer,
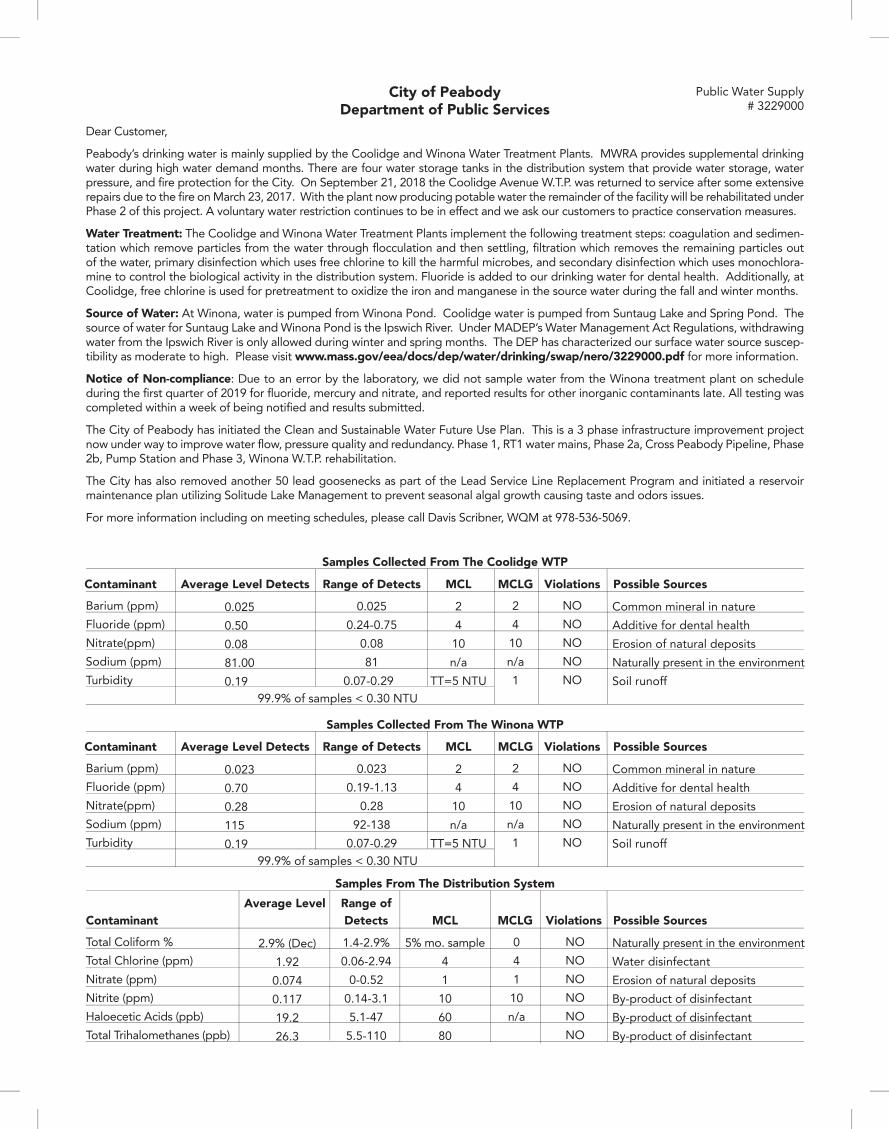
Peabody’s drinking water is mainly supplied by the Coolidge and Winona Water Treatment Plants. MWRA provides supplemental drinking water during high water demand months. There are four water storage tanks in the distribution system that provide water storage, water pressure, and fire protection for the City. On September 21, 2018 the Coolidge Avenue W.T.P. was returned to service after some extensive repairs due to the fire on March 23, 2017. With the plant now producing potable water the remainder of the facility will be rehabilitated under Phase 2 of this project. A voluntary water restriction continues to be in effect and we ask our customers to practice conservation measures.
Water Treatment: The Coolidge and Winona Water Treatment Plants implement the following treatment steps: coagulation and sedimen-tation which remove particles from the water through flocculation and then settling, filtration which removes the remaining particles out of the water, primary disinfection which uses free chlorine to kill the harmful microbes, and secondary disinfection which uses monochlora-mine to control the biological activity in the distribution system. Fluoride is added to our drinking water for dental health. Additionally, at Coolidge, free chlorine is used for pretreatment to oxidize the iron and manganese in the source water during the fall and winter months.
Source of Water: At Winona, water is pumped from Winona Pond. Coolidge water is pumped from Suntaug Lake and Spring Pond. The source of water for Suntaug Lake and Winona Pond is the Ipswich River. Under MADEP’s Water Management Act Regulations, withdrawing water from the Ipswich River is only allowed during winter and spring months. The DEP has characterized our surface water source suscep-tibility as moderate to high. Please visit www.mass.gov/eea/docs/dep/water/drinking/swap/nero/3229000.pdf for more information.
Notice of Non-compliance: Due to an error by the laboratory, we did not sample water from the Winona treatment plant on schedule during the first quarter of 2019 for fluoride, mercury and nitrate, and reported results for other inorganic contaminants late. All testing was completed within a week of being notified and results submitted.
The City of Peabody has initiated the Clean and Sustainable Water Future Use Plan. This is a 3 phase infrastructure improvement project now under way to improve water flow, pressure quality and redundancy. Phase 1, RT1 water mains, Phase 2a, Cross Peabody Pipeline, Phase 2b, Pump Station and Phase 3, Winona W.T.P. rehabilitation.
The City has also removed another 50 lead goosenecks as part of the Lead Service Line Replacement Program and initiated a reservoir maintenance plan utilizing Solitude Lake Management to prevent seasonal algal growth causing taste and odors issues.
For more information including on meeting schedules, please call Davis Scribner, WQM at 978-536-5069.
City of PeabodyDepartment of Public Services
Public Water Supply # 3229000
NONONONONO
NONONONONO
NONONONONONO
24
10n/a1
24
10n/a1
041
10n/a
24
10n/a
TT=5 NTU
24
10n/a
TT=5 NTU
5% mo. sample41
106080
0.0250.500.0881.000.19
0.0230.700.281150.19
2.9% (Dec)1.92
0.0740.11719.226.3
0.0250.24-0.75
0.0881
0.7-0.29
0.0230.19-1.13
0.2892-138
0.07-0.29
1.4-2.9%0.06-2.94
0-0.520.14-3.15.1-47
5.5-110
Barium (ppm)Fluoride (ppm)Nitrate(ppm)Sodium (ppm)Turbidity
Barium (ppm)Fluoride (ppm)Nitrate(ppm)Sodium (ppm)Turbidity
Total Coliform %Total Chlorine (ppm)Nitrate (ppm)Nitrite (ppm)Haloecetic Acids (ppb)Total Trihalomethanes (ppb)
99.9% of samples < 0.30 NTU
99.9% of samples < 0.30 NTU
Average Level Detects
Average Level Detects
Average Level
Contaminant
Contaminant
Contaminant
Samples Collected From The Coolidge WTP
Samples Collected From The Winona WTP
Samples From The Distribution System
Range of Detects
Range of Detects
Range of Detects
Violations
Violations
Violations
MCLG
MCLG
MCLG
MCL
MCL
MCL
Possible Sources
Possible Sources
Possible Sources
Tests In Community PipesMWRA and local water departments test 300
to 500 water samples each week for total coliform bacteria. Total coliform bacteria can come from the intestines of warm-blooded animals, or can befound in soil, plants, or other places. Most of the time, they are not harmful. However, their presence could signal that harmful bacteria from fecal waste may be there as well. If total coliform isdetected in more than 5% of samples in a month, the water system is required to investigate the possible source and fix any identified problems. If a water sample does test positive, we run more specific tests for E.coli, which is a bacteria found inhuman and animal fecal waste and may cause illness. If your community found any total coliform or E.coli, it will be listed within the community letter on page 7.
Drinking Water And People With Weakened Immune Systems
Some people may be more vulnerable to contaminants in drinking water than the general population. Immuno-compromised persons such aspersons with cancer undergoing chemotherapy, persons who have undergone organ transplants, people with HIV/AIDS or other immune system disorders, some elderly, and infants can be
particularly at risk from infections. These people should seek advice about drinking water from their health care providers. EPA/CDC guidelines on appropriate means to lessen the risk of infection by Cryptosporidium and other microbial contaminants are available from the EPA's Safe Drinking Water Hotline (1-800-426-4791).
Contaminants In Bottled Water And Tap WaterDrinking water, including bottled water, may
reasonably be expected to contain at least small amounts of some contaminants. The presence of contaminants does not necessarily indicate that water poses a health risk. More information about contaminants and potential health effects can be obtained by calling the EPA’s Safe Drinking Water Hotline (1-800-426-4791) or MWRA. In order to ensure that tap water is safe to drink, the Massachusetts DEP and EPA prescribe regulations which limit the amount of certain contaminants in water provided by public water systems. U.S. Food and Drug Administra-tion (FDA) and the Massachusetts Department of Public Health regulations establish limits for contaminants in bottled water which must provide the same protection for public health.
Research For New RegulationsMWRA has been working with EPA and other
researchers to define new national drinking water standards by testing for unregulated contaminants.To read more about these regulations, and to see alisting of what was found in MWRA water, please visit www.mwra.com/UCMR/2018.
Cross Connection InformationMassachusetts DEP recommends the installation of backflow prevention devices for inside and outside hose connections to help protect the water in your home as well as the drinking
water system in your town. For more information on cross connections, please call 617-242-5325 or visit mwra.com/crosscon.
6
Watershed Protection keeps
the water supply clean
and safe while providing
open space. All of the
trees and protected
land in the Quabbin,
Wachusett and Ware
River watersheds act as
a natural filter, and it is
one of the reasons
MWRA water has been
rated as the best in the
country. Since 1985,
almost $150 million
has been invested in
land protection.
Drink Local And Be Green!Tap water is delivered straight to your home without trucking or plastic waste. Bottled water produces over 10,000 times the amount of greenhouse gases as tap water. More than half of our energy needs for water treatment and delivery are met with green power including hydroelec-tric generators and solar panels.
Overlookingthe Quabbin
Reservoir
Common mineral in natureAdditive for dental healthErosion of natural depositsNaturally present in the environmentSoil runoff
Common mineral in natureAdditive for dental healthErosion of natural depositsNaturally present in the environmentSoil runoff
Naturally present in the environmentWater disinfectantErosion of natural depositsBy-product of disinfectantBy-product of disinfectantBy-product of disinfectant
Dear Customer,
Peabody’s drinking water is mainly supplied by the Coolidge and Winona Water Treatment Plants. MWRA provides supplemental drinking water during high water demand months. There are four water storage tanks in the distribution system that provide water storage, water pressure, and fire protection for the City. On September 21, 2018 the Coolidge Avenue W.T.P. was returned to service after some extensive repairs due to the fire on March 23, 2017. With the plant now producing potable water the remainder of the facility will be rehabilitated under Phase 2 of this project. A voluntary water restriction continues to be in effect and we ask our customers to practice conservation measures.
Water Treatment: The Coolidge and Winona Water Treatment Plants implement the following treatment steps: coagulation and sedimen-tation which remove particles from the water through flocculation and then settling, filtration which removes the remaining particles out of the water, primary disinfection which uses free chlorine to kill the harmful microbes, and secondary disinfection which uses monochlora-mine to control the biological activity in the distribution system. Fluoride is added to our drinking water for dental health. Additionally, at Coolidge, free chlorine is used for pretreatment to oxidize the iron and manganese in the source water during the fall and winter months.
Source of Water: At Winona, water is pumped from Winona Pond. Coolidge water is pumped from Suntaug Lake and Spring Pond. The source of water for Suntaug Lake and Winona Pond is the Ipswich River. Under MADEP’s Water Management Act Regulations, withdrawing water from the Ipswich River is only allowed during winter and spring months. The DEP has characterized our surface water source suscep-tibility as moderate to high. Please visit www.mass.gov/eea/docs/dep/water/drinking/swap/nero/3229000.pdf for more information.
Notice of Non-compliance: Due to an error by the laboratory, we did not sample water from the Winona treatment plant on schedule during the first quarter of 2019 for fluoride, mercury and nitrate, and reported results for other inorganic contaminants late. All testing was completed within a week of being notified and results submitted.
The City of Peabody has initiated the Clean and Sustainable Water Future Use Plan. This is a 3 phase infrastructure improvement project now under way to improve water flow, pressure quality and redundancy. Phase 1, RT1 water mains, Phase 2a, Cross Peabody Pipeline, Phase 2b, Pump Station and Phase 3, Winona W.T.P. rehabilitation.
The City has also removed another 50 lead goosenecks as part of the Lead Service Line Replacement Program and initiated a reservoir maintenance plan utilizing Solitude Lake Management to prevent seasonal algal growth causing taste and odors issues.
For more information including on meeting schedules, please call Davis Scribner, WQM at 978-536-5069.
City of PeabodyDepartment of Public Services
Public Water Supply # 3229000
NONONONONO
NONONONONO
NONONONONONO
24
10n/a1
24
10n/a1
041
10n/a
24
10n/a
TT=5 NTU
24
10n/a
TT=5 NTU
5% mo. sample41
106080
0.0250.500.0881.000.19
0.0230.700.281150.19
2.9% (Dec)1.920.0740.11719.226.3
0.0250.24-0.75
0.0881
0.07-0.29
0.0230.19-1.13
0.2892-138
0.07-0.29
1.4-2.9%0.06-2.94
0-0.520.14-3.15.1-47
5.5-110
Barium (ppm)Fluoride (ppm)Nitrate(ppm)Sodium (ppm)Turbidity
Barium (ppm)Fluoride (ppm)Nitrate(ppm)Sodium (ppm)Turbidity
Total Coliform %Total Chlorine (ppm)Nitrate (ppm)Nitrite (ppm)Haloecetic Acids (ppb)Total Trihalomethanes (ppb)
99.9% of samples < 0.30 NTU
99.9% of samples < 0.30 NTU
Average Level Detects
Average Level Detects
Average Level
Contaminant
Contaminant
Contaminant
Samples Collected From The Coolidge WTP
Samples Collected From The Winona WTP
Samples From The Distribution System
Range of Detects
Range of Detects
Range of Detects
Violations
Violations
Violations
MCLG
MCLG
MCLG
MCL
MCL
MCL
Possible Sources
Possible Sources
Possible Sources