Embed Size (px)
Citation preview
Summary Financial Statement 2013
Your building society On your side
Graham Beale, CEO, with Nationwide member Carole, Threadneedle Street branch
Financial performance
Our results for the year demonstrate the strength of our core business franchise, including strong growth in mortgage volumes, a significant improvement in our net interest margin, a material reduction in our cost:income ratio and continued delivery against our strategy to grow our share of the personal banking market. These positive developments have combined to drive an 18% rise in total income to £2.52 billion (2012: £2.14 billion).
Our underlying profit for the year was up 56% at £475 million (2012: £304 million), and statutory profit before tax was up 3% at £210 million (2012: £203 million). Our statutory profit before tax includes hedge accounting and valuation adjustments of £165 million for our risk hedging instruments (2012: £35 million gain) and £84 million for the impact of the Financial Services Compensation Scheme and bank levy (2012: £75 million).
Our retail credit quality remains high, with arrears rates well below industry averages and a reduction in provision charge of 32%, but our legacy commercial real estate assets continue to pose challenges to our short term profitability. Loans secured against commercial property have been affected by weak tenant demand and a resumption of declines in property values. Consequently the provision charge has increased this year to £493 million (2012: £247 million). We are working with our borrowers over the medium term to keep them in business and to protect members’ interests.
A prudent and strong business
Our business continues to be underpinned by conservative lending standards, a strong capital base and high levels of liquidity, each of which reflect our mutual status and primary focus on providing residential mortgages and secure savings products for our members. Our mortgage arrears are significantly below the industry average, 77% of our funding comes from retail balances and our Core Tier 1 capital ratio is one of the strongest in the industry at 12.3% (2012: 12.5%).
ContentsReview of the year 02
Financial results 07
Independent Auditors’ statement 09
Summary Directors’ Remuneration Report 10
02 03Summary Financial Statement 2013
Review of the year
Supporting the housing market
Over the past twelve months we have played a major role in supporting the UK housing market, increasing our lending by 17% to £21.5 billion (2012: £18.4 billion), and accounting for 15.1% (2012: 13.0%) of all mortgage lending, our highest ever market share. Our net lending for the year was £6.5 billion, well over double that achieved last year (2012: £2.7 billion) and equivalent to 108% of total net lending in the UK. In addition our net lending at £6.5 billion was significantly in excess of the £2.5 billion we drew down under the Funding for Lending Scheme.
We have placed a particular emphasis on providing mortgages to first time buyers, consistent with our mutual heritage as well as stimulating the housing market. During the year we helped over 42,000 people to take their first steps into home ownership, a 75% increase on last year (2012: 24,000). This means that one in every three of our new prime mortgages during the year was to a first time buyer and we accounted for almost one in five of all first time buyer mortgages in the UK. We have continued to make loans available for up to 95% of the value of the property through our Save to Buy scheme, and are active participants in government schemes aimed at boosting the supply of new properties and access to home finance.
With patterns of tenure evolving, our subsidiary The Mortgage Works (TMW) is an important provider of high quality loans to the buy to let sector. Over the past year, TMW gross advances were £3.3 billion (2012: £4.4 billion), representing 19.5% market share, with net lending of £1.6 billion (2012: £2.8 billion). Our total specialist mortgage book now stands at £25.0 billion (2012: £23.2 billion).
04 05Summary Financial Statement 2013
Over the past twelve months a number of lenders have unilaterally increased their standard variable mortgage rates for existing customers. We have maintained our Base Mortgage Rate (BMR) at 2% above Bank of England (BoE) base rate. We estimate the member benefit of our BMR pledge has been in the region of £800 million during the year, equating to an average of over £1,100 net benefit for each account per year when compared with the average standard variable rate charged by other lenders, conservatively estimated at 4%.
Delivering value for loyal members
As the Bank of England base rate has remained at its historic record low for yet another year, we have made every effort to look after the needs of our savings members.
During the year we have seen a change in regulatory requirements relating to the level of liquidity that we need to hold. As the requirement has fallen we have reduced our liquidity ratio from 13.7% to 11.1% and have maintained savings balances broadly flat at £126 billion. In doing so we have provided the most attractive rates of interest to our most loyal members, most notably through our Loyalty Saver account, which pays higher levels of interest according to length of membership and by year end had balances of £8 billion.
We have continued our campaign to persuade the Government to increase the cash ISA limit to make it equivalent to the annual equity ISA limit of £11,520. We strongly believe that the existing limit for cash ISAs of £5,760 is iniquitous and unfairly penalises those savers who prefer the security of cash savings over the greater volatility of equity markets.
Offering a genuine alternative
The past year has seen us make a huge stride forward in diversifying our business through the expansion of our personal banking services: we have launched
two new personal current accounts, FlexDirect and FlexPlus, and opened over 365,000 new current accounts (2012: 359,000). We have seen 123,000 customers switching their main banking relationships to us, up 58% on last year. Our total current account base has risen to 5.2 million and our market share of main current accounts is 5.7% (2012: 5.1%).
Our success in the personal loans market has continued for another year, during which we advanced 132,000 new loans, up 18% on 2011/12 (2012: 112,000). Our total gross lending was up 20% to £1.2 billion, representing a market share of 6.5%, the highest we have ever achieved.
Our banking product suite is completed by a range of high quality, good value credit cards. We were named as the company with the most responsible credit card lending practices and our Select Card was recognised as the best new credit card.1 We issued 350,000 new cards (2012: 357,000).
Our sales of home insurance products have increased by 20% on 2012, driven by the launch of two new products aimed at providing members with greater flexibility over the level of cover which best suits their needs.
In a market characterised by continued outflows from unit trusts and an overall reduction in net sales, our share of the investment market was 7.1% (2012: 7.3%), taking our assets under advice to £7.3 billion (2012: £6.7 billion). In addition to offering a broad range of funds through our investment panel, our unique high street annuity service has helped almost 1,800 retirees boost their pensions by an average of 17% when compared to their existing pension providers.
The implementation of the Retail Distribution Review in December 2012 has prompted a widespread retreat by our banking competitors from offering investment advice to the mass market. We do not believe that this was the intention of the new rules introduced by the Financial Services Authority, and have taken the
decision that we should continue to offer advice to our members. Our stance provides another example of how Nationwide is different from the established banks.
Providing an exceptional customer experience
Our internal surveys show a continued growth in satisfaction with our branch, telephone and internet channels and we have also been ranked number one for combined product service satisfaction amongst our high street peer group 2. Customer service is a key focus for all employees, and building on our lead in customer satisfaction is one of our major strategic targets for the next five years. This naturally enhances our reputation, and we have been assessed as the most reputable financial services organisation in the UK, and the only one in the top 50, according to the Reputation Institute’s annual survey.
There will of course be times when we fail to deliver the exceptional member experience for which we strive. Nationwide is the second largest savings provider, third largest mortgage provider (with approximately 11% share of each market) and is driving a rapid growth in our current account base, yet accounts for only 2% of total industry complaints. Further, of those complaints which are referred to the Financial Ombudsman Service (FOS), the percentage upheld in the customer’s favour is around half the average level for the industry (23% compared with 45%). A recent survey by Which? found that customers of Nationwide, when compared with other high street financial services retailers, were the least likely to have experienced customer service problems over the past twelve months.
The issue of complaints about the sale of PPI has continued to pose challenges across the industry. We are not alone in experiencing high volumes of claims from people to whom we have never sold a policy; 43% of all claims against us fall into this category.
It is particularly galling that almost three quarters of these claims continue to emanate from Claims Management Companies (CMCs), despite repeated calls for their activities to be better regulated. These fallacious claims are imposing unfair costs on our business, and directly impact the value that we are able to deliver to our members. We deal fairly with PPI claims; only 25% of our decisions are overturned by the FOS, compared with the industry average of 60%. We have made a further charge of £53 million for the year, taking our total cumulative charge for this issue to £181 million. As we have reiterated on many occasions, we encourage legitimate claims to be made directly to us, rather than through a CMC.
Transforming the business
We have delivered a range of programmes to improve our capacity and resilience and to allow us to improve the choice of product, service experience, advice and access provided to our members.
Our most notable achievement this year has been the implementation of a completely new core banking system that provides greater stability and flexibility, and has allowed us to expand our banking product suite. The benefits of our new system are already apparent, with increasing numbers of customers choosing Nationwide as their main current account provider. We will continue to develop our products to prove that while people may need a bank account, they do not need a bank.
The launch of our mobile banking app in November has fulfilled a growing demand to be able to manage your current account while on the move. It has been downloaded by over half a million members and is used on a daily basis by over 100,000 members.
2 For the financial year 2012/13. Source: GfK NOP’s Financial Research Survey (FRS), 12 months of interviews conducted between April 2012 and March 2013, proportion of extremely/very satisfied customers minus proportion of extremely/very dissatisfied customers summed across current account, mortgage and savings, our high street peer group is defined as Barclays, Halifax, HSBC, Lloyds TSB, NatWest and Santander.1 2013 Card and Payment Awards
06 07Summary Financial Statement 2013
Our long term strategy
Our ambition is to be the first choice for financial services. We have had a strong year and have been rated first for customer satisfaction for each month of the year. We will continue to invest in the Society and our people to maintain our number one position.
In particular we recognise the need to develop and expand our presence in the personal current account market and to establish a market share of at least 10% to balance our existing shares of the mortgage and savings market. Over the past year we have delivered a new banking platform and a mobile banking capability. This follows the delivery in the last two years of a new data centre, new payment platforms and a new internet bank, and puts us in the position of having one of the most modern banking infrastructures in the UK.
OutlookWe do not expect any significant change in the strength of the UK economy over the next twelve months, with continuing low interest rates required to support economic growth. This low rate environment combined with relative stability in unemployment will support mortgage affordability, but represents an unfavourable environment for savers. House prices have flatlined throughout 2012 and the first quarter of 2013, and this trend also looks set to continue with the broad balance between weak demand and constrained supply resulting in no strong price movements in either direction.
Against this weak but stable backdrop the fundamentals of our performance during 2012/13 will continue in the coming year. We expect the strong margin recovery evident in our results to continue, albeit potentially at a slower pace, as the impact of mortgage repricing and balance growth is supported by low cost funding in both retail and wholesale markets. As a member owned institution we will seek to protect our loyal savers from low rates as much as possible, but recognise that we cannot defy market conditions. The general economic outlook will continue to hold back recovery in commercial real estate for at least the next financial year, although we are confident that our core business performance will allow us to comfortably absorb this impact.
Approved by the Board of Directors on 21 May 2013 and signed on its behalf by:
Geoffrey Howe Chairman
Roger Perkin Chairman of Audit Committee
Graham Beale Director and Chief Executive
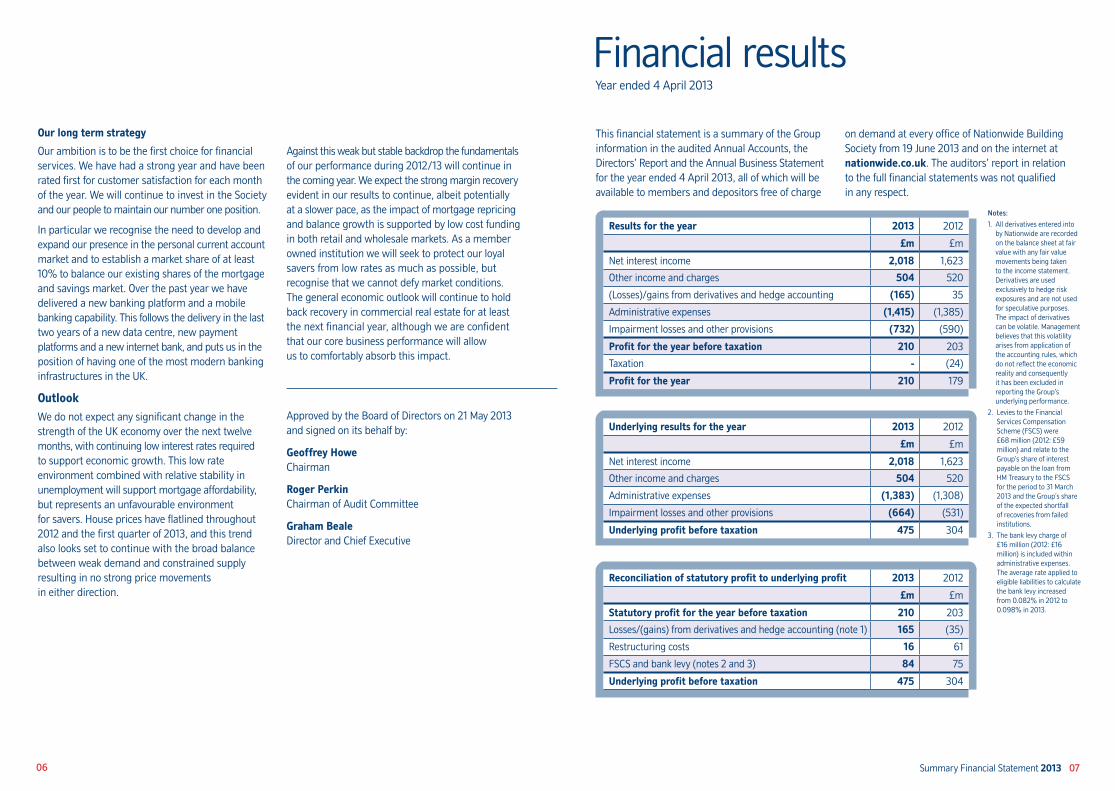
Financial resultsYear ended 4 April 2013
Results for the year 2013 2012
£m £m
Net interest income 2,018 1,623
Other income and charges 504 520
(Losses)/gains from derivatives and hedge accounting (165) 35
Administrative expenses (1,415) (1,385)
Impairment losses and other provisions (732) (590)
Profit for the year before taxation 210 203
Taxation - (24)
Profit for the year 210 179
Underlying results for the year 2013 2012
£m £m
Net interest income 2,018 1,623
Other income and charges 504 520
Administrative expenses (1,383) (1,308)
Impairment losses and other provisions (664) (531)
Underlying profit before taxation 475 304
Reconciliation of statutory profit to underlying profit 2013 2012
£m £m
Statutory profit for the year before taxation 210 203
Losses/(gains) from derivatives and hedge accounting (note 1) 165 (35)
Restructuring costs 16 61
FSCS and bank levy (notes 2 and 3) 84 75
Underlying profit before taxation 475 304
This financial statement is a summary of the Group information in the audited Annual Accounts, the Directors’ Report and the Annual Business Statement for the year ended 4 April 2013, all of which will be available to members and depositors free of charge
on demand at every office of Nationwide Building Society from 19 June 2013 and on the internet at nationwide.co.uk. The auditors’ report in relation to the full financial statements was not qualified in any respect.
Notes:
1. All derivatives entered into by Nationwide are recorded on the balance sheet at fair value with any fair value movements being taken to the income statement. Derivatives are used exclusively to hedge risk exposures and are not used for speculative purposes. The impact of derivatives can be volatile. Management believes that this volatility arises from application of the accounting rules, which do not reflect the economic reality and consequently it has been excluded in reporting the Group’s underlying performance.
2. Levies to the Financial Services Compensation Scheme (FSCS) were £68 million (2012: £59 million) and relate to the Group’s share of interest payable on the loan from HM Treasury to the FSCS for the period to 31 March 2013 and the Group’s share of the expected shortfall of recoveries from failed institutions.
3. The bank levy charge of £16 million (2012: £16 million) is included within administrative expenses. The average rate applied to eligible liabilities to calculate the bank levy increased from 0.082% in 2012 to 0.098% in 2013.
08 09Summary Financial Statement 2013
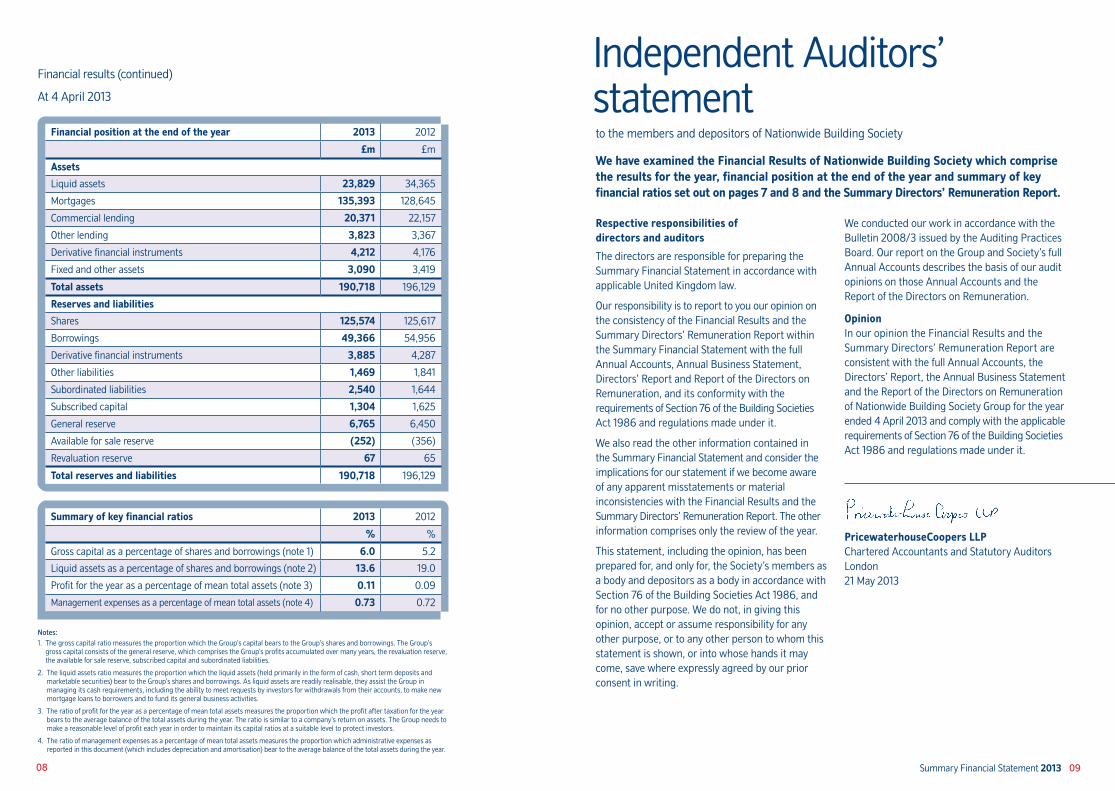
Financial results (continued)
At 4 April 2013
Independent Auditors’ statement
Respective responsibilities of directors and auditors
The directors are responsible for preparing the Summary Financial Statement in accordance with applicable United Kingdom law.
Our responsibility is to report to you our opinion on the consistency of the Financial Results and the Summary Directors’ Remuneration Report within the Summary Financial Statement with the full Annual Accounts, Annual Business Statement, Directors’ Report and Report of the Directors on Remuneration, and its conformity with the requirements of Section 76 of the Building Societies Act 1986 and regulations made under it.
We also read the other information contained in the Summary Financial Statement and consider the implications for our statement if we become aware of any apparent misstatements or material inconsistencies with the Financial Results and the Summary Directors’ Remuneration Report. The other information comprises only the review of the year.
This statement, including the opinion, has been prepared for, and only for, the Society’s members as a body and depositors as a body in accordance with Section 76 of the Building Societies Act 1986, and for no other purpose. We do not, in giving this opinion, accept or assume responsibility for any other purpose, or to any other person to whom this statement is shown, or into whose hands it may come, save where expressly agreed by our prior consent in writing.
We conducted our work in accordance with the Bulletin 2008/3 issued by the Auditing Practices Board. Our report on the Group and Society’s full Annual Accounts describes the basis of our audit opinions on those Annual Accounts and the Report of the Directors on Remuneration.
Opinion In our opinion the Financial Results and the Summary Directors’ Remuneration Report are consistent with the full Annual Accounts, the Directors’ Report, the Annual Business Statement and the Report of the Directors on Remuneration of Nationwide Building Society Group for the year ended 4 April 2013 and comply with the applicable requirements of Section 76 of the Building Societies Act 1986 and regulations made under it.
PricewaterhouseCoopers LLP Chartered Accountants and Statutory AuditorsLondon21 May 2013
Notes:1. The gross capital ratio measures the proportion which the Group’s capital bears to the Group’s shares and borrowings. The Group’s
gross capital consists of the general reserve, which comprises the Group’s profits accumulated over many years, the revaluation reserve, the available for sale reserve, subscribed capital and subordinated liabilities.
2. The liquid assets ratio measures the proportion which the liquid assets (held primarily in the form of cash, short term deposits and marketable securities) bear to the Group’s shares and borrowings. As liquid assets are readily realisable, they assist the Group in managing its cash requirements, including the ability to meet requests by investors for withdrawals from their accounts, to make new mortgage loans to borrowers and to fund its general business activities.
3. The ratio of profit for the year as a percentage of mean total assets measures the proportion which the profit after taxation for the year bears to the average balance of the total assets during the year. The ratio is similar to a company’s return on assets. The Group needs to make a reasonable level of profit each year in order to maintain its capital ratios at a suitable level to protect investors.
4. The ratio of management expenses as a percentage of mean total assets measures the proportion which administrative expenses as reported in this document (which includes depreciation and amortisation) bear to the average balance of the total assets during the year.
Financial position at the end of the year 2013 2012
£m £m
Assets
Liquid assets 23,829 34,365
Mortgages 135,393 128,645
Commercial lending 20,371 22,157
Other lending 3,823 3,367
Derivative financial instruments 4,212 4,176
Fixed and other assets 3,090 3,419
Total assets 190,718 196,129
Reserves and liabilities
Shares 125,574 125,617
Borrowings 49,366 54,956
Derivative financial instruments 3,885 4,287
Other liabilities 1,469 1,841
Subordinated liabilities 2,540 1,644
Subscribed capital 1,304 1,625
General reserve 6,765 6,450
Available for sale reserve (252) (356)
Revaluation reserve 67 65
Total reserves and liabilities 190,718 196,129
Summary of key financial ratios 2013 2012
% %
Gross capital as a percentage of shares and borrowings (note 1) 6.0 5.2
Liquid assets as a percentage of shares and borrowings (note 2) 13.6 19.0
Profit for the year as a percentage of mean total assets (note 3) 0.11 0.09
Management expenses as a percentage of mean total assets (note 4) 0.73 0.72
to the members and depositors of Nationwide Building Society
We have examined the Financial Results of Nationwide Building Society which comprise the results for the year, financial position at the end of the year and summary of key financial ratios set out on pages 7 and 8 and the Summary Directors’ Remuneration Report.
10 11Summary Financial Statement 2013
Summary Directors’ Remuneration ReportFor the year ended 4 April 2013
Introduction
Dear MemberI am pleased to present the Remuneration Committee’s report which sets out the pay, bonuses and benefits for the directors for the year to 4 April 2013. Executive directors are our highest paid roles and unlike in other financial institutions, there are no employees within the Society who earn more than them.
We have always tried to make this report transparent for our members and this year, in anticipation of the new reporting regulations on directors’ pay, we have included some additional information to help our members understand what our directors could earn through our annual and medium term bonus plans, and how we measure the performance of the business.
The leadership team has delivered another strong performance this year. We have grown the number of customers with whom we have a multi-product relationship. Our Core Tier 1 ratio, a measure of financial strength, remained at industry leading levels. At the same time we have successfully completed a number of major transformation programmes which will improve the range of products and services we can offer, for example, the launch of new current accounts and our mobile banking app. We have also maintained our 1st position for customer satisfaction throughout the year which reflects the member focused approach which is at the heart of what we do.
It is in this context that I would like to share with you our remuneration policies and practices for our executive team, including the payments to our executive directors in respect of our performance during 2012/13.
The Chief Executive has requested not to receive the full variable pay allocation for 2012/13 for which he may otherwise have been eligible as a result of the strong business performance, and instead that the Remuneration Committee cap the payment, such that his variable pay shows no increase on 2011/12.
Nationwide is committed to best practice in corporate governance and therefore we provide full details of our directors’ remuneration and ask our members to approve the Remuneration Report through an advisory vote at the Annual General Meeting. This report includes the key disclosure requirements of the UK Corporate Governance Code and follows market best practice.
On behalf of the Remuneration Committee, I recommend that you endorse our report.
Lynne PeacockChair of the Remuneration Committee
Summary
No general salary increases for 2013/14, with two executive directors awarded increases reflecting additional responsibilities.
Bonus payments triggered for both the annual and medium term schemes as a result of strong business performance.
CEO requested a cap on his variable pay for 2012/13.
Performance pay plans simplified and this report enhanced to provide disclosure in line with best practice.
Executive remuneration policy and principles
Our pay policy and framework is consistent with market practice for senior executive roles and enables us to motivate, reward and retain our leadership team to deliver value for our members. Our intention is to reward our executives at a level which is fair but not excessive.
We believe in pay for performance, and operate bonus schemes which reward our executive directors for the achievement of challenging key performance objectives over the short and medium term, based on our Corporate Plan.
We are simplifying the way in which we will measure our performance for any awards made in 2013/14 by focusing on three core measures of our success:
Financial health – measured in terms of our underlying profitability. This reflects our ability to operate a safe and secure Society, meet prudential requirements and invest for the future
Growing our business – measured in terms of the number of current accounts, which is one of our strategic goals
Customer satisfaction – to offer market leading product and service satisfaction.
The Committee will also consider each individual’s personal and leadership performance against objectives set at the start of each year.
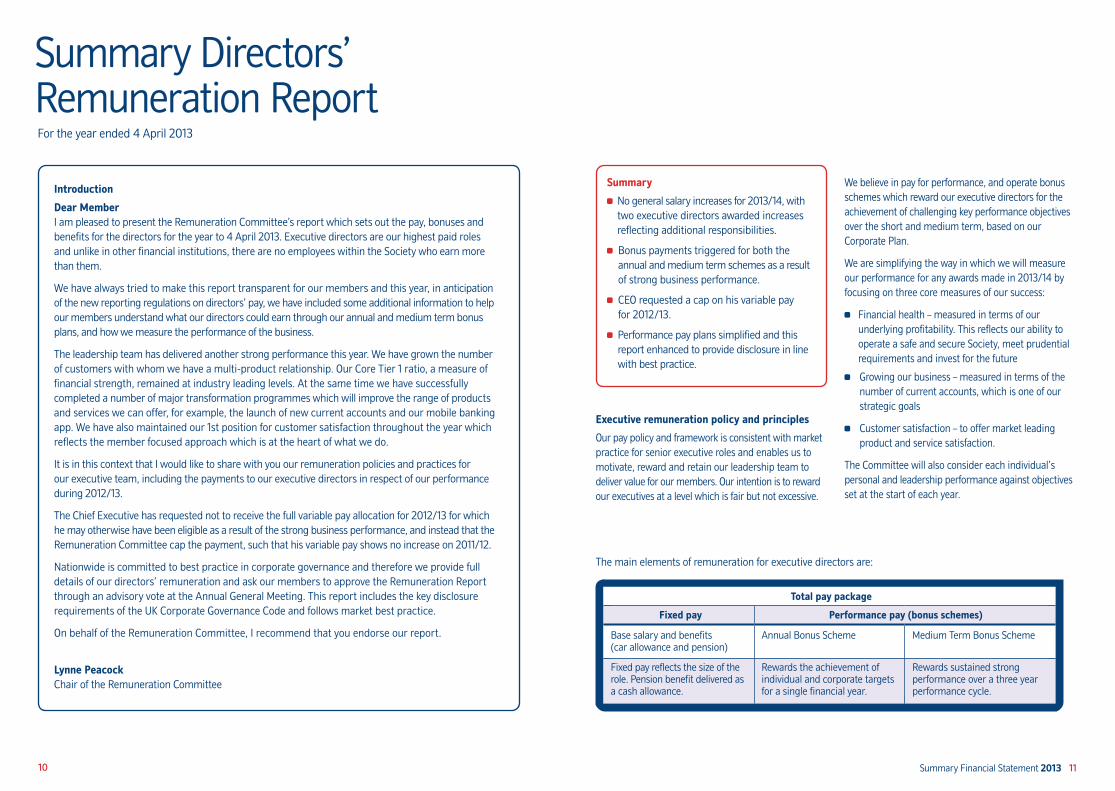
The main elements of remuneration for executive directors are:
Total pay package
Fixed pay Performance pay (bonus schemes)
Base salary and benefits (car allowance and pension)
Annual Bonus Scheme Medium Term Bonus Scheme
Fixed pay reflects the size of the role. Pension benefit delivered as a cash allowance.
Rewards the achievement of individual and corporate targets for a single financial year.
Rewards sustained strong performance over a three year performance cycle.
12 13Summary Financial Statement 2013
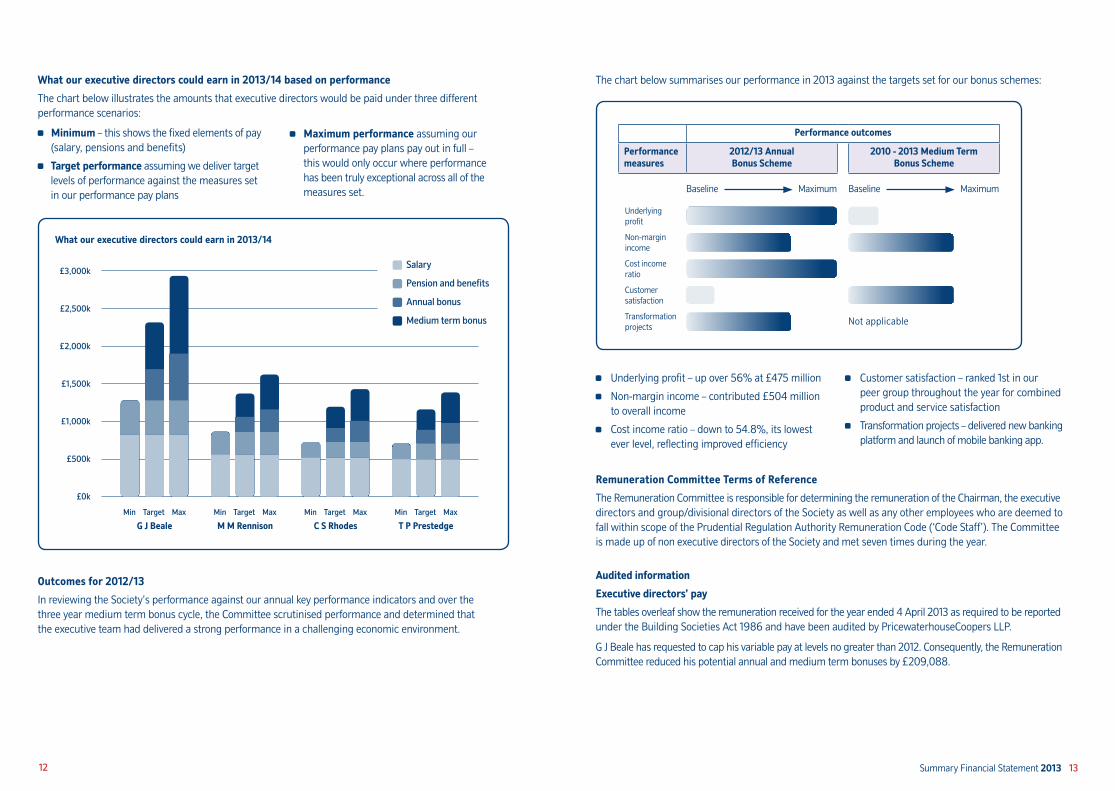
Minimum – this shows the fixed elements of pay (salary, pensions and benefits)
Target performance assuming we deliver target levels of performance against the measures set in our performance pay plans
Maximum performance assuming our performance pay plans pay out in full – this would only occur where performance has been truly exceptional across all of the measures set.
What our executive directors could earn in 2013/14 based on performance
The chart below illustrates the amounts that executive directors would be paid under three different performance scenarios:
Remuneration Committee Terms of Reference
The Remuneration Committee is responsible for determining the remuneration of the Chairman, the executive directors and group/divisional directors of the Society as well as any other employees who are deemed to fall within scope of the Prudential Regulation Authority Remuneration Code (‘Code Staff’). The Committee is made up of non executive directors of the Society and met seven times during the year.
Audited information
Executive directors’ pay
The tables overleaf show the remuneration received for the year ended 4 April 2013 as required to be reported under the Building Societies Act 1986 and have been audited by PricewaterhouseCoopers LLP.
G J Beale has requested to cap his variable pay at levels no greater than 2012. Consequently, the Remuneration Committee reduced his potential annual and medium term bonuses by £209,088.
The chart below summarises our performance in 2013 against the targets set for our bonus schemes:
Underlying profit – up over 56% at £475 million
Non-margin income – contributed £504 million to overall income
Cost income ratio – down to 54.8%, its lowest ever level, reflecting improved efficiency
Customer satisfaction – ranked 1st in our peer group throughout the year for combined product and service satisfaction
Transformation projects – delivered new banking platform and launch of mobile banking app.
Not applicable
Performance outcomes
Performance measures
2012/13 Annual Bonus Scheme
2010 - 2013 Medium Term Bonus Scheme
Baseline Maximum
Underlying profit
Non-margin income
Cost income ratio
Customer satisfaction
Transformation projects
Baseline Maximum
G J BealeMin Target Max
M M RennisonMin Target Max
C S RhodesMin Target Max
T P PrestedgeMin Target Max
Salary
Pension and benefits
Annual bonus
Medium term bonus
What our executive directors could earn in 2013/14
£3,000k
£2,500k
£2,000k
£1,500k
£1,000k
£500k
£0k
Outcomes for 2012/13
In reviewing the Society’s performance against our annual key performance indicators and over the three year medium term bonus cycle, the Committee scrutinised performance and determined that the executive team had delivered a strong performance in a challenging economic environment.
Notes:1. M P V Wyles left the Society on 30 April 2013 and has a deferred benefit entitlement that will receive statutory increases until he chooses to commence the
pension benefit, or transfers to another scheme.
2. The Nationwide Pension Fund Trustees changed, with actuarial advice, the transfer value basis this year and the updated values reflect the fall in gilt yields. This has had the impact of increasing transfer values for most pension fund members, including executive directors.
14 15Summary Financial Statement 2013
Lynne Peacock Chair of the Remuneration Committee 21 May 2013
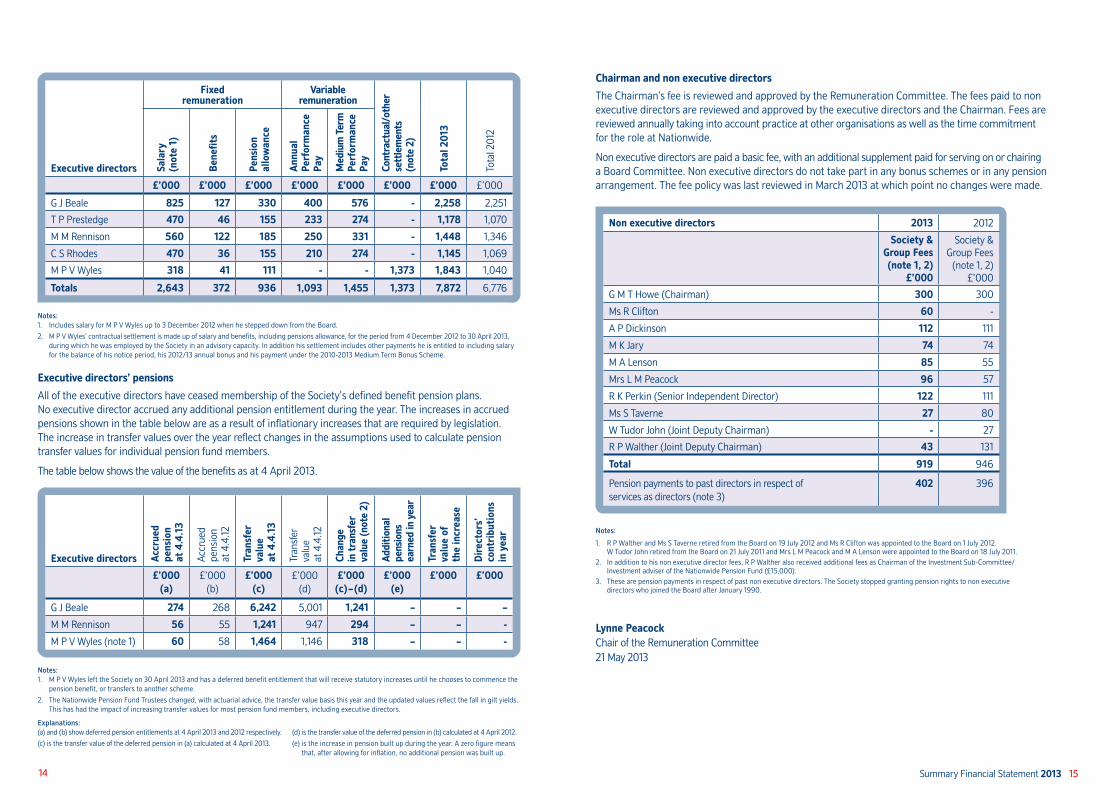
Executive directors’ pensions
All of the executive directors have ceased membership of the Society’s defined benefit pension plans. No executive director accrued any additional pension entitlement during the year. The increases in accrued pensions shown in the table below are as a result of inflationary increases that are required by legislation. The increase in transfer values over the year reflect changes in the assumptions used to calculate pension transfer values for individual pension fund members.
The table below shows the value of the benefits as at 4 April 2013.
Executive directors Accr
ued
pens
ion
at 4
.4.1
3
Accr
ued
pens
ion
at 4
.4.12
Tran
sfer
va
lue
at 4
.4.1
3
Tran
sfer
va
lue
at 4
.4.12
Chan
ge
in tr
ansf
er
valu
e (n
ote
2)
Addi
tiona
l pe
nsio
ns
earn
ed in
yea
r
Tran
sfer
va
lue
of
the
incr
ease
Dir
ecto
rs’
cont
ribu
tion
s in
yea
r
£’000(a)
£’000 (b)
£’000(c)
£’000 (d)
£’000(c) – (d)
£’000(e)
£’000 £’000
G J Beale 274 268 6,242 5,001 1,241 – – –
M M Rennison 56 55 1,241 947 294 – – -
M P V Wyles (note 1) 60 58 1,464 1,146 318 – – -
Explanations:(a) and (b) show deferred pension entitlements at 4 April 2013 and 2012 respectively.
(c) is the transfer value of the deferred pension in (a) calculated at 4 April 2013.
(d) is the transfer value of the deferred pension in (b) calculated at 4 April 2012.
(e) is the increase in pension built up during the year. A zero figure means that, after allowing for inflation, no additional pension was built up.
Executive directors
Fixed remuneration
Variable remuneration
Cont
ract
ual/
othe
r se
ttle
men
ts
(not
e 2)
Tota
l 201
3
Tota
l 201
2
Sala
ry
(not
e 1)
Bene
fits
Pens
ion
al
low
ance
Ann
ual
Perf
orm
ance
Pa
y
Med
ium
Ter
m
Perf
orm
ance
Pa
y
£’000 £’000 £’000 £’000 £’000 £’000 £’000 £’000
G J Beale 825 127 330 400 576 - 2,258 2,251
T P Prestedge 470 46 155 233 274 - 1,178 1,070
M M Rennison 560 122 185 250 331 - 1,448 1,346
C S Rhodes 470 36 155 210 274 - 1,145 1,069
M P V Wyles 318 41 111 - - 1,373 1,843 1,040
Totals 2,643 372 936 1,093 1,455 1,373 7,872 6,776
Notes:1. Includes salary for M P V Wyles up to 3 December 2012 when he stepped down from the Board.
2. M P V Wyles’ contractual settlement is made up of salary and benefits, including pensions allowance, for the period from 4 December 2012 to 30 April 2013, during which he was employed by the Society in an advisory capacity. In addition his settlement includes other payments he is entitled to including salary for the balance of his notice period, his 2012/13 annual bonus and his payment under the 2010-2013 Medium Term Bonus Scheme.
Chairman and non executive directors
The Chairman’s fee is reviewed and approved by the Remuneration Committee. The fees paid to non executive directors are reviewed and approved by the executive directors and the Chairman. Fees are reviewed annually taking into account practice at other organisations as well as the time commitment for the role at Nationwide.
Non executive directors are paid a basic fee, with an additional supplement paid for serving on or chairing a Board Committee. Non executive directors do not take part in any bonus schemes or in any pension arrangement. The fee policy was last reviewed in March 2013 at which point no changes were made.
Non executive directors 2013 2012
Society & Group Fees(note 1, 2)
£’000
Society & Group Fees
(note 1, 2)£’000
G M T Howe (Chairman) 300 300
Ms R Clifton 60 -
A P Dickinson 112 111
M K Jary 74 74
M A Lenson 85 55
Mrs L M Peacock 96 57
R K Perkin (Senior Independent Director) 122 111
Ms S Taverne 27 80
W Tudor John (Joint Deputy Chairman) - 27
R P Walther (Joint Deputy Chairman) 43 131
Total 919 946
Pension payments to past directors in respect of services as directors (note 3)
402 396
Notes:
1. R P Walther and Ms S Taverne retired from the Board on 19 July 2012 and Ms R Clifton was appointed to the Board on 1 July 2012. W Tudor John retired from the Board on 21 July 2011 and Mrs L M Peacock and M A Lenson were appointed to the Board on 18 July 2011.
2. In addition to his non executive director fees, R P Walther also received additional fees as Chairman of the Investment Sub-Committee/Investment adviser of the Nationwide Pension Fund (£15,000).
3. These are pension payments in respect of past non executive directors. The Society stopped granting pension rights to non executive directors who joined the Board after January 1990.

You can order all our publications in large print, Braille or CD. Your local branch will arrange this for you or you can contact us on 08457 30 20 10.
If you have hearing or speech difficulties and are a textphone user, you can call us direct in text on 0800 37 80 01. We also accept calls via BT TypeTalk. Just dial 18001 followed by the full telephone number you wish to ring.
Nationwide Building Society. Head Office: Nationwide House, Pipers Way, Swindon, Wiltshire SN38 1NW.
nationwide.co.uk
P948 (May 2013)